Embed Size (px)
Citation preview

Making a Material Difference
Veeco Investor Presentation
January 2020

Safe Harbor
To the extent that this presentation discusses expectations or otherwise makes
statements about the future, such statements are forward-looking and are subject to
a number of risks and uncertainties that could cause actual results to differ materially
from the statements made.
These items include the risk factors discussed in the Business Description and
Management's Discussion and Analysis sections of Veeco's Annual Report on
Form 10-K for the year ended December 31, 2018 and subsequent Quarterly Reports
on Form 10-Q and current reports on Form 8-K. Veeco does not undertake any obligation
to update any forward-looking statements to reflect future events or circumstances
after the date of such statements.
2 Investor Presentation | © 2020 Veeco Instruments Inc.

Veeco at a Glance
▪ Advanced Technology Equipment Provider
▪ ~1,000 Employees; >800 Patents
▪ $306M 2019 YTD Revenue (Q1-Q3 19)
▪ $232M in Cash, $345M in Convertible Debt*
Global Semiconductor Capital Equipment Provider with Specialized Technology
R&D, Manufacturing, Sales & Service R&D, Headquarters Sales & Service
3 Investor Presentation | © 2020 Veeco Instruments Inc.
* As of Q3 2019
San Jose, CA
St. Paul, MN
Somerset, NJ
Horsham, PAPlainview, NY
Waltham, MAMunich, Germany
Shanghai, China
Bangkok, Thailand
Penang, Malaysia
Singapore
Laguna, Philippines
Hsinchu, Taiwan
Tokyo, Japan
Seoul, Korea
Veeco System for
Semiconductor Manufacturing

Veeco Customers Drive Megatrends
Sc
ien
tifi
c &
In
du
str
ial
Co
mp
ou
nd
Se
mi
OS
ATs
, M
EM
S &
RF
Fil
ters
IDM
s &
Fo
un
dri
es
4 Investor Presentation | © 2020 Veeco Instruments Inc.

Historical Perspective
5
Positioned to Drive GrowthProven Legacy of Enabling Technologies
LED
GaN MOCVD for
LCD backlighting & general
lighting applicationsData Storage
Ion Beam Deposition & Etch of
magnetic material for HDD heads
Ultratech
Leader in Laser Spike Anneal and
Advanced Packaging Lithography
Transformation
Two-Phase Transformation
Improve profitability and drive growth in:
• Front-End Semiconductor
• Compound Semiconductor
• Advanced Packaging
Return the Company to Profitability and Drive Growth
1990s 2000s 2010s Today
HDD – Hard Disk Drive
LED – Light Emitting Diode
MOCVD – Metal Organic Chemical Vapor Deposition
GaN – Gallium NitrideInvestor Presentation | © 2020 Veeco Instruments Inc.

6
Phase 1: Returning to Profitability
▪ Shift MOCVD market focus from commodity LED to higher value photonics
▪ Execute general infrastructure reductions
▪ Rationalize product line investments
Phase 1: well underway
Phase 2: early stages
Transformation Update
VCSEL – Vertical Cavity Surface Emitting Laser
Phase 2: Driving Growth
Grow in current markets
▪ Front-End Semi with Laser Annealing
▪ Advanced Packaging with Lithography
▪ Data Storage with Ion Beam
Penetrate with new applications
▪ Front-End Semi with Ion Beam and MOCVD
▪ Compound Semi / VCSEL with MOCVD
Investor Presentation | © 2020 Veeco Instruments Inc.

7
General Infrastructure Reductions:
▪ Flatter organization led by exceptional leadership team including newly appointed CFO
▪ Product line organization
▪ Centralized R&D – optimal allocation of resources
Transformation Phase 1 - Highlights
Investor Presentation | © 2020 Veeco Instruments Inc.
Introducing John Kiernan, Senior VP, CFO:
▪ Appointed January 2020
▪ Close relationship for over 15 years
▪ Over 20 years financial leadership at Veeco
Better Focus on Markets and Customers with More Efficient R&D Execution

Returning to Profitability
8
* Based on midpoint of guidance for Q4 19 provided November 4, 2019
37%
39%40%
2018 2019 2020 Target
Gross Margin Improvement
Improving Operating Expenses and Gross Margin
Q3 2017 Target Q3 2020
SG&A
R&D
Operating Expense Reduction
$49M
$36M
▪ SG&A reduction
▪ Optimize R&D investments
▪ Gross margin has benefited from improving
product mix and volume increases
*
Investor Presentation | © 2020 Veeco Instruments Inc.

Markets and Technologies
AI / High Performance
Computing
• AP Lithography
Photonics / 5G
• MOCVDCloud / Data Storage
• Ion Beam Deposition & Etch
Veeco Applies Unique Know-how to Solve Unmet Needs with the Right
Technology for Commercial Scaling
Megatrend
Technology
* Compound Semi includes LED, Lighting & Display
AI – Artificial Intelligence
5G – Fifth Generation Wireless
AP – Advanced Packaging9
High Performance
Computing
• Laser Annealing
• Ion Beam Deposition & Etch
Investor Presentation | © 2020 Veeco Instruments Inc.

28nm 14nm 10nm 7nm 5nm
Multi Patterning
Single Patterning
EUV Lithography
EUV Mask Blanks for Front-End Semiconductor
10
Veeco Advantage
Market Opportunity – Up to $50M Annually
Enabling Advanced Nodes
EUV Adopters*
Market Drivers
▪ Artificial Intelligence
▪ High Performance Computing
▪ Autonomous Driving
Incre
asin
g T
ransis
tor
Density
*Source: Semiconductor Engineering
Veeco supplies best in class Ion
Beam Deposition systems to the
only two EUV Lithography mask
blank suppliers to the
semiconductor industry
Investor Presentation | © 2020 Veeco Instruments Inc.
EUV – Extreme Ultraviolet

Laser Annealing for Front-End Semiconductor
11
Veeco AdvantageMarket Drivers
▪ Artificial Intelligence
▪ High Performance Computing
▪ Graphics Processing Units
Market Opportunity – Up to $100M Annually
Enabling Advanced Nodes
Current product status:
▪ PTOR for single step at ≤7nm with
2 customers
▪ Potential for up to 3 steps at next
nodesHours Minutes Seconds Milliseconds Microseconds Nanoseconds
Anneal Time
Sem
iconducto
r N
ode
Furnace
Anneal>90nm
90
-40nm
40
-14nm
<10nm
Rapid
Thermal
Processing
Laser
Annealing
Melt
LSA – Laser Spike Anneal
PTOR – Process Tool of Record
Veeco’s LSA allows customers to
perform their annealing steps with
great accuracy.
▪ Very high temperatures over
precise geometries
▪ Extremely short durations
▪ Minimal introduction of wafer
defects
Investor Presentation | © 2020 Veeco Instruments Inc.

Lithography for Advanced Packaging
12
Veeco AdvantageMarket Drivers
▪ Artificial intelligence
▪ Automotive
▪ Mobility
▪ GPU
Market Opportunity – Up to $100M Annually
Enabling Better System Performance
▪ Updated product platform
▪ Highly automated
▪ Superior performance
▪ Cost effective
Lithography System
Smaller Form
Factor
Higher
Performance
Lower Cost
Improved
Battery Life
Veeco’s advanced packaging
lithography is the process of choice:
• Fan-out wafer level packaging at
top foundries
• Recent wins for Copper Pillar
applications in high bandwidth
memory
GPU – Graphical Processing UnitInvestor Presentation | © 2020 Veeco Instruments Inc.

Compound Semi for Photonics, 5G & MicroLED
13
Veeco Advantage: TurboDisc® PlatformCompound Semiconductor Markets
Significant Market Opportunity for Compound Semiconductor Applications
LiDAR – Light Detection and Ranging
AsP – Arsenide Phosphide
GaN – Gallium Nitride
GaAs – Galium Arsenide
InP – Indium Phosphide
RF – Radio Frequency
▪ Excellent uniformity
▪ Maximum up-time
▪ Highest productivity
▪ Lowest cost of ownership
Investor Presentation | © 2020 Veeco Instruments Inc.
GaN - GaAs - InP - AsP
• Multi-Wafer
• Single Wafer
GaN RF Devices (5G)GaN based RF devices are more efficient than silicon based power
amplifiers. Potential in mm wave base station and mobile device
applications.
MicroLEDSunlight readability, power efficiency & high brightness are the
advantages of this next generation display technology.
3D Sensing / VCSELAsP based devices with consumer, automotive and industrial
applications such as world facing sensors in mobile devices, LiDAR
for autonomous vehicles and Data / Telecom.

Recent Financial Trends (Non-GAAP)
Improving Financial Metrics as We Grow Top Line and Manage Expenses
14
99 99 98
109 110
Q4 18 Q1 19 Q2 19 Q3 19 Q4 19*
Revenue ($m)
36% 36%
38%
40% 40%
Q4 18 Q1 19 Q2 19 Q3 19 Q4 19*
Gross Margin
43
40
39
40 39
Q4 18 Q1 19 Q2 19 Q3 19 Q4 19*
OPEX ($m)
(0.16)(0.14)
(0.06)
0.05 0.08
Q4 18 Q1 19 Q2 19 Q3 19 Q4 19*
EPS ($)
Ending 2019
with anticipated
40% gross
margin
Q4 19 up 10%
YOY
Further OPEX
reductions expected($36m quarterly by Q3 20)
Return to
profitability
* Q4 19 figures represent the midpoint of guidance provided on November 4, 2019
A reconciliation of GAAP to Non-GAAP financial measures can be found in the backup section of this presentation.
Investor Presentation | © 2020 Veeco Instruments Inc.

Balance Sheet and Cash Flow Highlights
15
Amounts may not calculate precisely due to rounding. A reconciliation of GAAP to Non-GAAP financial measures can be found in the backup section of this presentation.
$ millions Q2 19 Q3 19
Cash & Short-Term Investments 247 232
Accounts Receivable 59 73
Inventories 140 135
Accounts Payable 22 35
Long-Term Debt 294 297
Cash Flow from Operations 14 (15)
DSO (days) 54 60
DOI 210 185
DPO 33 47
Investor Presentation | © 2020 Veeco Instruments Inc.

Investment Summary
▪ Leveraging core technologies in growing markets
▪ Growing top line
▪ Megatrends supported by our technologies
▪ EUV Mask Blanks – Ion Beam Deposition
▪ Advanced Front-End Semiconductor – Laser Annealing
▪ Photonics & 5G – MOCVD
▪ Advanced Packaging – Lithography
▪ Cloud / Data Storage – Ion Beam Deposition / Etch
▪ Improving profitability
Well Positioned to Turn High-Value Technology Solutions into Profitable and Sustainable Products
16 Investor Presentation | © 2020 Veeco Instruments Inc.

Backup &
Financial Tables
17 Investor Presentation | © 2020 Veeco Instruments Inc.

Q3 2019 Revenue by Market & Region
18
ROW
United States
EMEA
China
25%
41%
18%
16%
LED Lighting, Display
& Compound Semi
Front-End
Semiconductor
Scientific &
Industrial
Advanced
Packaging, MEMS
& RF Filters
$109M
31%
22%
37%
10%
Revenue by Market Revenue by Region
Revenue Trend ($m) Q4 18 Q1 19 Q2 19 Q3 19
Front-End Semiconductor 22 23 25 34
LED Lighting, Display & Compound Semi 13 14 10 24
Advanced Packaging, MEMS & RF Filters 14 23 16 11
Scientific & Industrial 50 40 47 40
Total 99 99 98 109
Amounts may not calculate precisely due to rounding.
Investor Presentation | © 2020 Veeco Instruments Inc.

Growth Areas – Market Status
19
EUV Mask
Blanks
Laser Spike
Annealing
AP
Lithography
3D Sensing /
VCSEL
Current Market
ViewGross Margin
(vs. corp. avg.)SAM Share Growth Driver
Up to $50M
Up to $100M
Up to $100M
Up to $100M
Very High
Medium
High
Low
Good
Good
Flat
Flat
Better
Equal
Equal
Equal
Technology
Technology
Capacity
Technology
Technology
Capacity
Investor Presentation | © 2020 Veeco Instruments Inc.

The Markets We Serve
Compound
Semi *
Front-End
Semi
Advanced
Packaging,
MEMS & RF
Filters
Scientific &
Industrial
* Compound Semi includes LED, Lighting & Display
Front-End
Semiconductor
Compound
Semiconductor
Advanced Packaging,
MEMS & RF Filters
Scientific & Industrial
Ion Beam Deposition for EUV and Laser Spike Annealing that enable early steps
in the process of integrated circuit fabrication
Metal Organic Chemical Vapor Deposition of Gallium Nitride and Arsenide
Phosphide compound-semi materials used to create VSCSELs, EELs, specialty LEDs,
displays, RF & power devices
Lithography for advanced packaging, wet etch and clean technology for wafer-
level packaging techniques that enable the miniaturization and performance of
electronic products
Ion Beam Etch/Sputtering, Molecular Beam Epitaxy, Atomic Layer Deposition
serving data storage, optical coating, university, research and industrial institutions to
create hard disc drives in cloud storage, fiber optics for wireless communication, and
research and development of complex and diverse material sciences
EEL – Edge Emitting Laser20 Investor Presentation | © 2020 Veeco Instruments Inc.
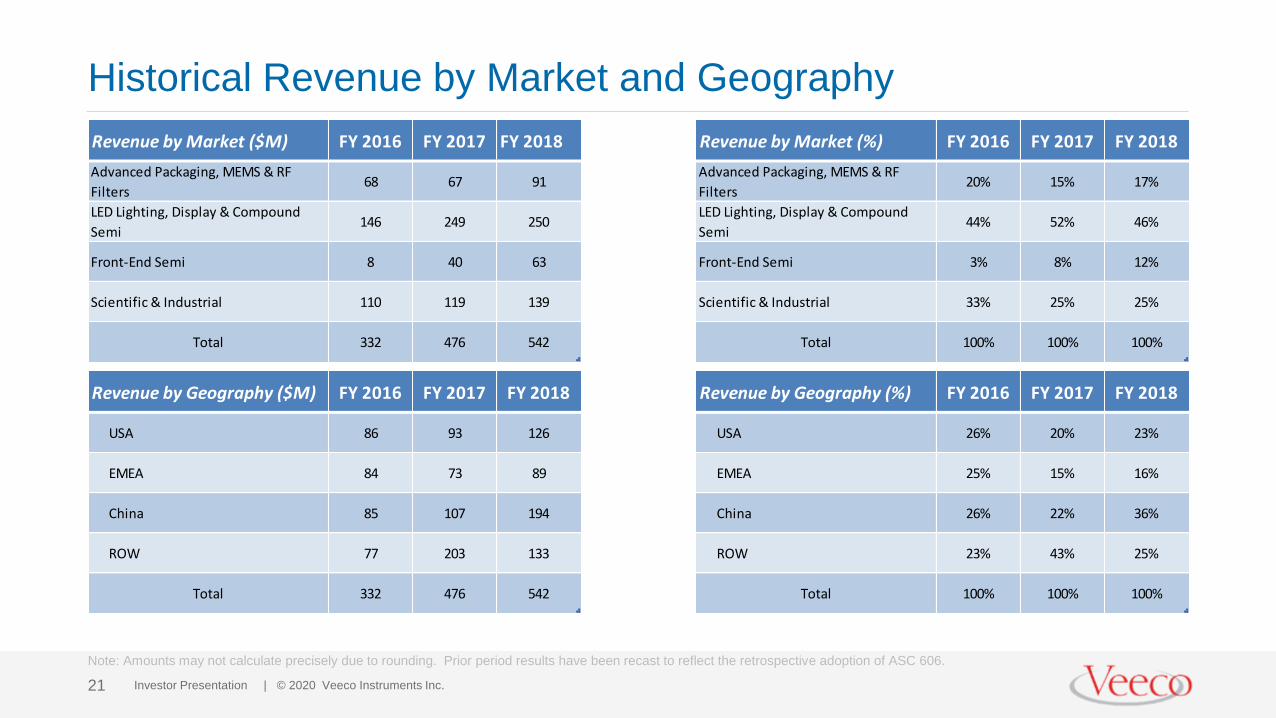
Historical Revenue by Market and Geography
Revenue by Market ($M) FY 2016 FY 2017 FY 2018
Advanced Packaging, MEMS & RF
Filters68 67 91
LED Lighting, Display & Compound
Semi146 249 250
Front-End Semi 8 40 63
Scientific & Industrial 110 119 139
Total 332 476 542
Revenue by Market (%) FY 2016 FY 2017 FY 2018
Advanced Packaging, MEMS & RF
Filters20% 15% 17%
LED Lighting, Display & Compound
Semi44% 52% 46%
Front-End Semi 3% 8% 12%
Scientific & Industrial 33% 25% 25%
Total 100% 100% 100%
Revenue by Geography ($M) FY 2016 FY 2017 FY 2018
USA 86 93 126
EMEA 84 73 89
China 85 107 194
ROW 77 203 133
Total 332 476 542
Revenue by Geography (%) FY 2016 FY 2017 FY 2018
USA 26% 20% 23%
EMEA 25% 15% 16%
China 26% 22% 36%
ROW 23% 43% 25%
Total 100% 100% 100%
Note: Amounts may not calculate precisely due to rounding. Prior period results have been recast to reflect the retrospective adoption of ASC 606.
21 Investor Presentation | © 2020 Veeco Instruments Inc.

Note on Reconciliation Tables
These tables include financial measures adjusted for the impact of certain items; these financial measures are therefore not calculated in
accordance with U.S. generally accepted accounting principles (“GAAP”). These Non-GAAP financial measures exclude items such as: share-
based compensation expense; charges relating to restructuring initiatives; non-cash asset impairments; certain other non-operating gains and
losses; and acquisition-related items such as transaction costs, non-cash amortization of acquired intangible assets, incremental transaction-
related compensation, and certain integration costs.
These Non-GAAP financial measures may be different from Non-GAAP financial measures used by other companies. Non-GAAP financial
measures should not be considered a substitute for, or superior to, measures of financial performance prepared in accordance with GAAP. By
excluding these items, Non-GAAP financial measures are intended to facilitate meaningful comparisons to historical operating results,
competitors' operating results, and estimates made by securities analysts. Management is evaluated on key performance metrics including
Non-GAAP Operating Income, which is used to determine management incentive compensation as well as to forecast future periods.
These Non-GAAP financial measures may be useful to investors in allowing for greater transparency of supplemental information used by
management in its financial and operational decision-making. In addition, similar Non-GAAP financial measures have historically been reported
to investors; the inclusion of comparable numbers provides consistency in financial reporting. Investors are encouraged to review the
reconciliation of the Non-GAAP financial measures used in this news release to their most directly comparable GAAP financial measures.
22 Investor Presentation | © 2020 Veeco Instruments Inc.

Supplemental Information – GAAP to Non-GAAP Reconciliation
Amounts may not calculate precisely due to rounding.
US$ millions Q4 18 Q1 19 Q2 19 Q3 19
Net Sales $99.0 $99.4 $97.8 $109.0
GAAP Gross Profit 35.3 34.7 36.3 42.2
GAAP Gross Margin 35.6% 34.9% 37.1% 38.8%
Add: Release of inventory fair value step-up
for purchase accounting
0.1 - - 1.3
Add: Share-Based Comp 0.3 0.5 0.6 0.4
Add: Depreciation of PP&E fair value step-up
for purchase accounting
0.1 - 0.1 -
Non-GAAP Gross Profit $35.7 $35.2 $36.9 $43.9
Non-GAAP Gross Margin 36.0% 35.5% 37.8% 40.3%
US$ millions, except per share amounts Q4 18 Q1 19 Q2 19 Q3 19
GAAP Basic EPS (3.11) (0.40) (0.33) (0.25)
GAAP Diluted EPS (3.11) (0.40) (0.33) (0.25)
GAAP Net Income (Loss) (144.7) (18.5) (15.6) (11.8)
Add: Share-Based Comp 3.4 3.2 4.6 3.8
Add: Amortization 4.2 4.2 4.2 4.3
Add: Restructuring 0.7 1.4 0.6 1.8
Add: Acquisition Related 0.1 - - -
Add: Release of inventory fair value step-up for purchase accounting 0.1 - - 1.3
Add: Depreciation of PP&E fair value step-up for purchase accounting 0.2 0.1 0.2 0.1
Add: Accelerated Depreciation 0.6 0.4 - -
Add: Asset Impairment 123.8 - - -
Add: Non-Cash Interest Expense 3.0 3.1 3.1 3.2
Add: Tax Adjustment from
GAAP to Non-GAAP
1.0 (0.3) (0.2) (0.1)
Non-GAAP Net Income (Loss) (7.5) (6.4) (3.0) 2.6
Non-GAAP Basic EPS (0.16) (0.14) (0.06) 0.05
Non-GAAP Diluted EPS (0.16) (0.14) (0.06) 0.05
US$ millions Q4 18 Q1 19 Q2 19 Q3 19
GAAP Net Income (Loss) $(144.7) $(18.5) $(15.6) $(11.8)
Add: Share-Based Comp 3.4 3.2 4.6 3.8
Add: Amortization 4.2 4.2 4.2 4.3
Add: Restructuring 0.7 1.4 0.6 1.8
Add: Acquisition Related 0.1 - - -
Add: Release of inventory fair value step-up
for purchase accounting
0.1 - - 1.3
Add: Depreciation of PP&E fair value step-
up for purchase accounting
0.2 0.1 0.2 0.1
Add: Accelerated Depreciation 0.6 0.4 - -
Add: Asset Impairment 123.8 - - -
Add: Interest Expense 4.5 4.2 4.2 4.3
Subtract: Tax expense (benefit) 0.2 0.2 0.1 0.1
Non-GAAP Operating Income (Loss) $(6.9) $(4.8) $(1.6) $4.0
23
US$ millions Q4 18 Q1 19 Q2 19 Q3 19
GAAP Operating Expenses $174.2 $48.9 $47.5 $49.6
Share-Based Compensation (2.9) (2.7) (4.0) (3.4)
Amortization (4.2) (4.2) (4.2) (4.3)
Asset Impairment (123.8) - - -
Other (0.7) (2.0) (0.8) (1.9)
Non-GAAP Operating Expenses $42.6 $40.0 $38.5 $40.0
Investor Presentation | © 2020 Veeco Instruments Inc.
![Wide-Bandga 16.Wide-BandgapII-VISemiconductors ... · molecular-beam epitaxy (MBE) [16.3], metalorganic molecular-beam epitaxy (MOMBE) [16.4] and atomic-layer epitaxy (ALE) [16.5]](https://img.pdfslide.us/doc/110x75/5e1f371b74bffa7fb71fc624/wide-bandga-16wide-bandgapii-visemiconductors-molecular-beam-epitaxy-mbe.jpg)