Embed Size (px)
Citation preview

Report Prepared for GREEN grid
NOTICE .
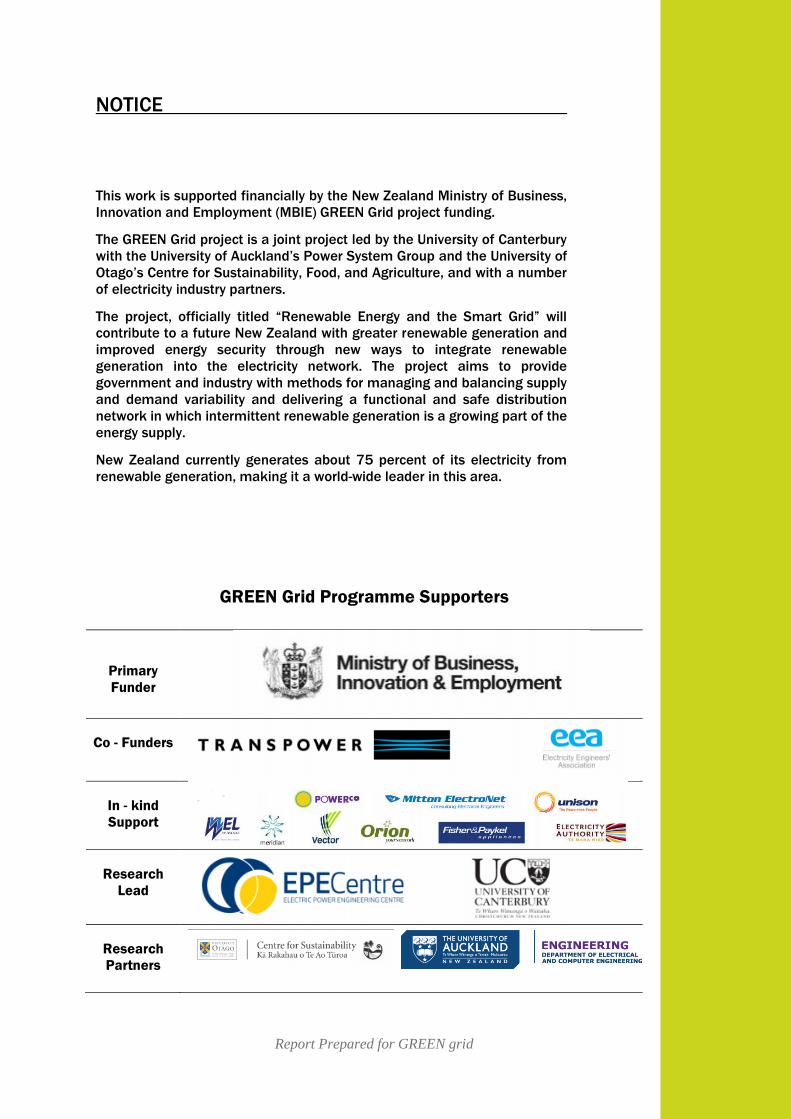
This work is supported financially by the New Zealand Ministry of Business,
Innovation and Employment (MBIE) GREEN Grid project funding.
The GREEN Grid project is a joint project led by the University of Canterbury
with the University of Auckland’s Power System Group and the University of
Otago’s Centre for Sustainability, Food, and Agriculture, and with a number
of electricity industry partners.
The project, officially titled “Renewable Energy and the Smart Grid” will
contribute to a future New Zealand with greater renewable generation and
improved energy security through new ways to integrate renewable
generation into the electricity network. The project aims to provide
government and industry with methods for managing and balancing supply
and demand variability and delivering a functional and safe distribution
network in which intermittent renewable generation is a growing part of the
energy supply.
New Zealand currently generates about 75 percent of its electricity from
renewable generation, making it a world-wide leader in this area.
GREEN Grid Programme Supporters
Primary
Funder
Co - Funders
In - kind
Support
Research
Lead
Research
Partners

Report Prepared for GREEN grid
Report Prepared for GREEN grid
Ngā Mihi – Acknowledgements .
The authors would like to thank Vector for their continuous in-kind support
throughout this project cycle by providing the Power Systems research Group
(PSG) with inverters and other requirements. PSG especially thank Sean Cross for
his regular feedback and valuable advices in the different stages of this joint work.
The authors would also like to acknowledge the efforts of Mehdi Farzinfar, Ankur
Mishra and Jaskaran Singh for the setup of the inverter test bench.
Finally, a special thanks goes to Nicholas Carson and Rhett Calvert for completing
the test bench setup and for their work on the testing of the inverters and the
validation of the test bench.
Report revision 1.0 (14th January 2016)
© 2016 The Authors
Published by the Department of Electrical and Computer Engineering, the
University of Auckland Engineering Faculty
University of Auckland
Auckland 1010, New Zealand
POWER SYSTEMS GROUP Tel: 64 9 923 9523
Fax: 64 9 373 7461

Report Prepared for GREEN grid

Vector’s Domestic Photovoltaic Trials: A Report on the Experiences
i
Executive Summary.
In 2013, Vector initiated the SunGenie program; a residential solar Photovoltaic (PV)/battery
storage system, to assess the uptake with customers and the effect on the grid with a solar
integrated battery solution. This was the first of its kind in New Zealand and after extensive
studies and design work Vector started the rollout of their SunGenie solar storage package to a
total 289 homes (2015 figure) on their network. The idea behind the program was to investigate
new methods of dealing with fluctuating grid demand and to assess the development and
implementation of a utility led battery storage solution.
As part of the GREEN Grid project, critical step 2.3.5, the University of Auckland’s Power
Systems group (PSG) was responsible to closely follow the initiation, design, data collection,
testing & monitoring phases of Vector’s PV trials and to record the experiences and lessons
learnt that will provide to be useful for all New Zealand utilities.
The experiences recorded from PSG’s involvement in Vectors SunGenie trials have been
included in this document. The initiation of the solar photovoltaic trials, combining research
with industry, developed a strong working relationship between PSG and Vector. PSG initially
provided Vector with the background knowledge of PV and battery technologies and the grid
impacts of runaway take up of residential PV. With this knowledge of PV/ Battery systems,
published as a white paper, Vector developed their SunGenie business plan for the trials.
PSG participated further in the PV trials in the testing of the inverters and their protection and
automation settings. An inverter test bench was developed at the University of Auckland and
after a series of tests performed on three short listed inverters, a choice was made on the inverter
that proved best to use and PSG recommended the required inverter settings.
The key findings from the trials, detailed in this document, are aimed at not only the utilities,
but also to inform the general public and potential customers with the knowledge taken from
the initiation, design, testing and operation stages of Vector’s solar PV/battery trials.
Future work includes the monitoring and data acquisition of the SunGenie’s performance. This
monitoring will provide Vector with the possible grid impacts, if any, of the PV systems in the
future. Vector have also agreed to continue working with PSG in the next critical step of the
GREEN Grid project in which new methods of coordinated voltage control will be tested
alongside a new “residential clustered PV/storage” project owned by Vector. This work has
already commenced and PSGs involvement in these trials will continue until the 30th September
2017.
Vector’s Domestic Photovoltaic Trials: A Report on the Experiences
ii
Table of Contents .
1. Introduction ...................................................................................... 1
Background ............................................................................................ 1
Overview ................................................................................................ 2
Timeline of PV Field trial related work between Vector and University of
Auckland’s PSG ....................................................................................... 3
2. Initiation ........................................................................................... 4
Combining Industry and Research through GREEN grid ................................ 4
Review of PV systems and possible impacts on the grid ................................ 4
Recording the experiences of the trials ....................................................... 4
3. Review of PV Systems and Battery Storage ....................................... 5
Impacts of PV Grid Interconnection ........................................................... 5
Possible Impacts .................................................................................. 5
Possible Benefits .................................................................................. 7
PV, Grid Quality and Supply Security, and Battery Energy Storage ................ 7
Battery Technology Overview.................................................................... 8
4. The Sun Genie solution .................................................................... 10
Introduction ......................................................................................... 10
The SunGenie Components ..................................................................... 11
SunGenie online beta dashboard .......................................................... 11
The Cabinet ....................................................................................... 12
The Solar Panels ................................................................................. 14
Vector Data Analysis on the Impacts and Benefits of PV/ Battery Storage ..... 15
5. Inverter Trials ................................................................................. 17
Introduction ......................................................................................... 17
Inverter Test Bench: the set-up & its components ..................................... 19
Basic tests ............................................................................................ 21
Over/ under voltage ............................................................................ 22
Over / under frequency ....................................................................... 23
Low voltage ride through (LVRT) .......................................................... 23
Harmonics ......................................................................................... 25
Advanced Tests ..................................................................................... 26
Volt/VAr Test ..................................................................................... 26
Vector’s Domestic Photovoltaic Trials: A Report on the Experiences
iii
Power / Frequency Test ....................................................................... 28
Power Factor / cos (phi) Test ............................................................... 29
Validating the Test Bench Results ............................................................ 30
Recommended settings .......................................................................... 31
6. Key Ideas and Lessons Learnt ......................................................... 33
Lessons learnt from grid connected Inverter Energy Systems ..................... 33
7. Future field trial work ...................................................................... 36
Assessment of long-term SunGenie performance ....................................... 36
Coordinated voltage control methods for NZ distribution following renewable
DG at MV, LV and household levels .......................................................... 36
8. References ......................................................................................... i
9. Appendices ........................................................................................ ii
Appendix 1: Summary of Basic Tests Results on Inverters A and B ............... ii
Appendix 2: Summary of Advanced Results on Inverters A and B ................ iii
Table of Figures Figure 4-1: SunGenie Installation [4] ................................................................................................... 10
Figure 4-2: Some components of Vector's SunGenie Program (left to right: The SunGenie online
dashboard (shown on smart phone, desktop and tablet) and the cabinet) ............................................. 11
Figure 4-3: photograph of the SunGenie online beta dashboard on a smart phone device ................... 11
Figure 4-4: Vector SunGenie Cabinet installed in Vector smart home ................................................ 12
Figure 4-5: Example of the Vector SunGenie systems central management system ............................ 13
Figure 4-6: Different options to program the operation of each unit .................................................... 14
Figure 4-7: The solar PV panels ........................................................................................................... 14
Figure 4-8: 4 kW PV array at Vector smart home ................................................................................ 15
Figure 4-9: Typical home with a Vector 3 kW solar array and 10.7 kWh battery storage ................... 15
Figure 4-10: Example of the feeder power smoothing using battery energy storage............................ 16
Figure 4-11: Power Systems Group and Vector at Vector Smart Home, July 2014 ............................. 17
Figure 4-12: Validation Test, Vector Smart Home, August 2014 ........................................................ 18
Figure 4-13: Simplified test circuit ....................................................................................................... 19
Figure 4-14: A simplified model of a grid connected home with a PV installation ............................. 19
Figure 4-15: The inverter test bench, a simplified representation of a grid tied residential PV
installation ............................................................................................................................................. 19
Figure 4-16: Sorensen SGI800-6.2 [7] .................................................................................................. 20
Figure 4-17:Agilent 6813B [8] ............................................................................................................. 20
Figure 4-18: Sorensen SLH 300V, 18A, 1.8kW [9] ............................................................................ 20
Figure 4-19: Inverter B GUI panel for basic settings ............................................................................ 21
Figure 4-20: A LVRT voltage profile highlighting where the inverter must remain connected to the
grid. Image from [11] ............................................................................................................................ 24
Figure 4-21: The LVRT voltage profile as captured from FlukeView for a 0.5pu (115V) test ............ 24
Figure 4-22: The corresponding current profile showing the inverter remained connected during the
LVRT event. ......................................................................................................................................... 25
Figure 5-1: Inverter GUI and the access tools to the gateway ............................................................. 26
Vector’s Domestic Photovoltaic Trials: A Report on the Experiences
iv
Figure 5-2: The voltage set points and corresponding reactive power compensation from the
perspective of the inverter’s output. A dead-band has been implemented between V2 and V3 ........... 27
Figure 5-3: Volt/ VAr test results for inverter A: the relationship with voltage and reactive power .... 27
Figure 5-4: Reduction in power output as the grid frequency increases, following a set gradient (a) and
with hysteresis enabled showing the power output remaining suppressed until a set point frequency
(Hz Stop) is reached and the power output returns the maximum (b) .................................................. 28
Figure 5-5: Reduction in inverter A output with an increase in frequency and then returning to the set
point for power output once the nominal 50Hz is reached ................................................................... 28
Figure 5-6: Inverter power factor change due to changes in the output of real power ......................... 29
figure 5-7: Relationship between real (top pane) and reactive power (middle pane) and the associated
power factor (bottom pane) ................................................................................................................... 30
Figure 5-8: Invert B producing high THD periodically – test bench results ......................................... 30
Figure 5-9: Invert B producing high THD periodically – grid connected results ................................ 31
Figure 5-10: Inverter installed at Vector smart home ........................................................................... 32
Figure 6-1: Happy customer publically announcing his satisfaction with SunGenie via Twitter ......... 35
Figure 7-1: PSG research students at Vector smart home, December 2015 ......................................... 37
List of Tables Table 1: Over and Under Voltage Settings ........................................................................................... 22
Table 2: Over and Under Frequency Settings ....................................................................................... 23
Table 3: Current harmonic tolerance levels as outlined by the IEEE 929-2000 standard..................... 25
Glossary
Term Description
A Ampere (SI unit used to measure electrical current)
AC Alternating Current
BESS Battery Energy Storage System
DC Direct Current
DG Distributed Generation
DRG Distributed renewable generation
EV Electric Vehicle
f Frequency
GC Grid connected
Hz Hertz (SI unit used to measure frequency)
IES Inverter Energy System
LCOE Levelised Cost of Electricity
Li- Ion Lithium ion (battery)
LV Low Voltage
LVRT Low Voltage Ride Through
MV Medium Voltage

Vector’s Domestic Photovoltaic Trials: A Report on the Experiences
v
NiCd Nickel – Cadmium (battery)
NiMH Nickel – metal hydride (battery)
PCC Point of Common Coupling
PF Power Factor
PSG Power System Group
PU Per – unit (unit of measure)
PV Photovoltaic (used to describe solar photovoltaic systems)
THD Total Harmonic Distortion
UA University of Auckland
UPS Uninterrupted Power Source
V Volt
VAr Volta amperes, reactive (SI unit used to measure Reactive Power)
W Watt (SI unit used to measure Power)

Introduction
1
1. Introduction
Background
A distributed renewable generation (DRG) system can function either in the presence of grid,
where it can feed the surplus power generated to the grid, or as a stand-alone isolated system
exclusively meeting the local demands. The most important features of stand-alone systems are
as follows [1]:
In these energy systems, the operational capacity is matched to the demand. The excess
power may be supplied to the grid.
These systems are ideal for remote locations where the system is required to operate at low
plant load factors.
Operation is mostly seasonal, as the typical stand-alone systems are usually based on
renewable energy technologies like solar PV, which is not available throughout the year.
These systems are not connected to the utility grid as a result of which they need batteries
for storage of electricity produced during off-peak demand periods, leading to extra battery
and storage costs, or else the excess power generated has to be thrown away.
On the other hand, a grid-connected energy system is an independent decentralized power
system that is connected to an electricity grid. There are two types of grid-connected systems:
1. The main priority of this energy system is to cater to the local needs for electricity and
any surplus generation will be fed into the grid, and when there is shortage electricity
is drawn from the grid.
2. The other option is a utility scale energy system, wherein decentralized stations are
managed by the utilities in the same way as large electric power plants. Any output of
the grid connected (GC) systems is fed into the central utility grid without paying
attention to the local needs.
Some of the important features of grid connected systems are as follows:
The operational capacity is determined by the supply source. The system functions only
when the supply sources are available.
Because of the supply driven operation, the system may have to ignore the local demand
during times of unavailability of supply sources.
The system could be either used to meet the local demand and surplus can be fed to the
grid, or otherwise, the system may exist only to feed the grid.
In a grid-connected power system the grid acts like a battery with an unlimited storage
capacity. So it takes care of seasonal load variations. As a result of which the overall
efficiency of a grid-connected system will be better than the efficiency of a stand-alone
system, as there is virtually no limit to the storage capacity, the generated electricity can
always be stored, and the additional generated electricity need not be ‘‘thrown away’’.
In addition to the initial cost of the system, cost for interface of the system with grid is
incurred.

Introduction
2
Vector started the SunGenie program as a solar PV/battery storage system in 2013. Different
aspects of Vector’s SunGenie program will be explained in chapter 4. In 2014, Vector started
offering grid-connected systems without battery storage units. The scope of this report is to
share the experiences from Vector’s solar PV trials (both with and without battery storage) in
order to better the operation and management of not only current systems, but also to help
design better systems in future through knowledge gained from these trials.
Overview
The report is organised as following:
Chapter 2 describes the initiation of the relationship between the University of Auckland’s
(UA) Power System Group (PSG) and Vector through the GREEN Grid project. The
establishment of a strong research – industry relationship led to the development of critical step
2.3.5 pf GREEN grid which was to follow all aspects of Vectors PV trials.
Chapter 3 provides the key characteristics of grid connected PV and battery storage systems
and the grid impacts associated with increased installations on a network.
Chapter 4 describes Vectors SunGenie programme. SunGenie was developed by Vector with
the help of the initial studies and data gathering carried out by PSG. This chapter includes the
concept behind and components of SunGenie
Chapter 5 describes the inverter tests carried out at the University of Auckland’s Power System
laboratory by the Power Systems Group (PSG) members. This includes the development of a
test bench at UA and the various tests carried out on the inverters selected, the reasoning behind
each test and the outcome of each test leading to the recommendation of inverter settings.
Chapter 6 highlights the key ideas and lessons learned from all stages of the PV trials. This is
the section that aims to aid in informing other utilities and customers on any future decisions
they may make when investing in PV/Battery storage systems.
Finally, Chapter 7 outlines the on-going relationship between University’s PSG and Vector
through GREEN grid and the future work that will be carried out as a result of previous
successes working together.

Introduction
3
Timeline of PV Field trial related work between Vector and University of
Auckland’s PSG

Initiation
4
2. Initiation
Combining Industry and Research through GREEN grid
GREEN Grid is aimed at providing government and industry with methods for managing and balancing
supply and demand variability and delivering a functional and safe distribution network in which
intermittent renewable generation is a growing part of the energy supply.
As part of a three year plan for critical step (CS) 2.3.5 “Photovoltaic field trials”, the University of
Auckland’s PSG began their strong industry relationship with Vector in order to closely follow all
aspects of their photovoltaic field trials. In 2013, the first year of the project (i.e. the first year of CS
2.3.5), an effective connection was established between PSG and Vector through their industry board
representative.
The research - industry relationship between PSG and Vector that was established in 2013 has become
very strong and successful since it’s initiation through GREEN grid and has stemmed even further as
Vector have agreed to become actively involved in further work with GREEN grid as part of CS 2.3.7
“Coordinated voltage control methods for NZ distribution following renewable DG at MV, LV and
household levels”. The work involved in this critical step began in October 2015 and will continue for
2 years until the end of September 2017.
Review of PV systems and possible impacts on the grid
The detailed data of the current PVs installed by Vector prior to 2013 was collected through surveys
and assessed by PSG. The general information of the PVs in 6 other distribution companies was also
collected through another survey. The collected data on current PV technologies was assessed against
other technologies available on the market and in order to assist Vector in the initial development of
their SunGenie solution, PSG provided a detailed literature review, published as a white paper, titled
“Solar PV, Battery Storage and Low Voltage Distribution Network: A Discussion on the Benefits of
Distributed Battery Storage” [2].
In this white paper, the potential benefits and impacts of distributed PV grid interconnections
that can be improved and/or mitigated by battery energy storage systems (BESS) are
highlighted and the importance of BESS to counteract the impacts is illustrated. The literature
review was sent to Vector to help them to prepare a business plan for the broader deployment
of solar PV / battery. This was completed as per plan of activities for this CS
Recording the experiences of the trials
In order to record all aspects of the PV field trials, PSG developed a means of gathering information in
the first year of the project. The gathered information is split into four stages: the preliminary study, the
Design, The Installation and the Commission.
The bank of information continued to grow over the 3 year project during each stage of the trials and in
future work PV data will be monitored and gathered to assess possible grid impacts that may occur
Review of PV Systems and Battery Storage
5
3. Review of PV Systems and Battery Storage
In the past decade, the installation of rooftop PV systems has substantially increased in many
countries due to its simplicity of installation, modularity and pollution free nature.
The existing electrical grid infrastructure was originally designed to supply power from source
to load but now due to such increase of distributed PV generation there is the possibility of
reverse power flow which presents some technical challenges when the numbers of such
systems increase for the utilities. Technical measures are required to eliminate those negative
impacts and enhance the benefits of PV systems.
Solar PV installations generate power only intermittently and with a highly variable output.
Furthermore, unlike a traditional centralized generation plant, these new sources may be
located anywhere on the grid, perhaps close to the load centres they serve, dispersed across the
network or even in remote locations far offshore or in deserts. Such fundamental changes in
the architecture and controllability of the grid call for smart, efficient power transmission and
distribution networks. And they require the storage of energy at appropriate times and locations
to balance between generation and consumption and also to maintain grid stability. In this
context, the potential of battery energy storage systems (BESS) to support the operation of
public distribution grids with local PV systems has gained wide interest.
In this section, the potential benefits and impacts of distributed PV grid interconnections that
can be improved and/or mitigated by BESS are summarised and the importance of BESS to
counteract the impacts is illustrated. This section is the summary of a published white paper
[2] that was prepared by PSG in University of Auckland to help Vector on their PV/Battery
storage plans.
Impacts of PV Grid Interconnection
Solar PV is an intermittent energy source and the increased interconnection of such energy
sources to the power grid brings various risks into view, such as lower electric power quality
and stability. In this section, several of these power quality impacts due to increased PV grid
interconnections are reviewed.
Possible Impacts
Over voltage/Under voltage
Over voltage and under voltage can be one of the biggest barriers to the mass distribution of
urban-scale PV systems. The voltage of electricity must be kept in a certain range as designated
by laws, standards or guidelines. The issue is that the network has been designed for one-way
power-flow along radial feeders from the transformer to the furthest customer on the network
while ensuring this remote customer is within statutory voltage limits. Due to the nature of
radial feeders, the voltage will drop towards the end of the feeder. To achieve suitable voltage
levels at the end of the feeder, the transformer voltage is deliberately set close to the upper
limit. This results in little voltage headroom for DG injection into the network. This
arrangement causes a problem as invariably surplus power is injected into the network at times
of typically low load (e.g. mid-afternoon and mid-morning) exacerbating the voltage
problem. Secondly the service lines are often neglected and the voltage drop down these can
Review of PV Systems and Battery Storage
6
be significant, particularly if they are long and have a small cross-section. As PV penetration
increases the voltage could exceed the upper limit, with the threat of causing damage to
electrical equipment installed on that part of the network. The line voltage can be reduced to
some extent by controlling the sending (secondary) voltage from the upstream transformer;
however, this may cause under voltage of neighbouring lines connected to that same
transformer.
If the systems are designed to control the voltage rise so as not to exceed the limit then a
disadvantage is that the PV power output is dumped to control the voltage, leading to lower
efficiency of the PV system and unhappy customers. If the investments are based on PV
production, the lower efficiency will affect the total investment in such technology.
A method to reduce voltage rise is the curtailment of power injected into the grid. However, to
avoid losses, PV owners can store this curtailed energy at home in batteries. An implicit option
to shorten the injected power is a feed-in tariff that favours self-consumption, which gives an
incentive to install batteries.
Voltage Fluctuations
One of the main characteristics of PV systems is the high variability of their output power. The
time frame for the short-term fluctuations in irradiance (caused mainly by moving cloud cover)
is in the order of seconds to few minutes. With high-connection densities of PVs in the low
voltage distribution grid, the short-time solar irradiance fluctuations can lead to unpredictable
variations of node voltages and power, mainly in weak residential and rural grids.
These voltage fluctuations can be mitigated to a certain extent by provision of backup from
energy storage systems which can support the network under varying generation from PV.
Unintended Islanding
Unintended islanding is an electrical phenomenon in which PV systems within a certain
network continue to supply power to the load even after the network is disconnected from the
main grid for some reason ( due to a fault, grid works/ repairs etc.). Islanding is very rare but
there are some certain concerns associated with islanded systems such as significant variations
in voltage and frequency, hazards to utility line workers by causing a line to remain energized,
damage in the PV, and interference with manual or automatic restoration of the normal service
for the neighbouring customers. Energy storage may be used as a countermeasure to protect
grid, consumers, and the PV.
Instantaneous Voltage Change
One possibility for instantaneous voltage change caused by a PV system is simultaneous
disconnection of PV systems by an unintended islanding (disconnect) function in the inverter
being too sensitive to grid operations. Computers, office automation equipment and industrial
robots are the most vulnerable to instantaneous voltage change.
A method of reducing this issue is to change the time for the PV system to drop off to have a
slight delay. Introducing a slight delay may not interfere with protection or safety but with
higher PV penetrations in the network, this delay may have to be coordinated with the networks
protection and automation scheme.

Review of PV Systems and Battery Storage
7
Possible Benefits
Security of supply
In the case of main grid disruption, users can switch the PV system from “normal” to “stand
alone” mode. This implies that from the PV system owner view point, PV may be used as a
back-up power source during the main supply disturbances. However, a battery bank needs to
be added to the PV system in order to smooth the varying output power of PV. Facilities such
as hospitals or communication businesses that use expensive, sensitive machines will need to
combine PV systems with an appropriate capacity of energy storage devices.
Peak power supply
PV systems can contribute to supplying the peak load. The peak power supply effect of a PV
system can be significantly enhanced through coupling with a small-scale energy storage
system such as batteries (peak-shifting). If the system stores power during times of high PV
output and discharges the power when it is needed, the power supplied from the grid during
peak hours would be reduced.
Utilities strive to reduce the peak demand through demand-side management programs and can
benefit if the network is operating to its rating and the demand is consistently reduced by the
battery/PV at times of peak load. Utilities also price electricity higher during peak periods with
time-of-use and demand-rate tariffs. Consequently, not only do the utilities benefit from
reduced peak demand via supply of PV power, the PV owner benefits as well due to reduced
peak electricity price and the benefit of energy cost savings is greater.
Power quality management
Putting a high performance power conditioner into practice would turn the negative impacts of
PV interconnection to positive effects and substantially would improve the power quality of
the grid.
Mitigating electric vehicle charging impacts on the distribution system
PVs could be used to limit the negative effects of electric vehicle (EV) introduction to
distribution system. EV can be used as a controlled battery load. In case of low voltage, the
controller reduces the charging speed to the desired value. Another scenario can be charging
EVs during the off-peak hours and using the EVs as batteries to support the distribution system
during the peak hours by means of a power injection.
PV, Grid Quality and Supply Security, and Battery Energy Storage
There are three main arguments in favour of the introduction of a storage function coupled to
a grid connected PV:
First, storage can improve the security of supply. One of the problems concerning the grid
quality is the incidents which can cause a perturbation in the supply of energy to the users.
Even in the best networks such events can occur, and in most countries, short or long
interruptions are quite common. A user with a grid connected PV system could stay without
electricity during daytime if there is an interruption of the grid service. A PV system with
battery storage available ensuring a total of 3 hours of autonomy for the user, would allow for
cover of 90% of the interruptions in Europe [2].
Review of PV Systems and Battery Storage
8
Secondly, the addition of a storage function can also increase the global performance ratio of
a PV generator either by hindering over-voltage disconnection or by storing the energy
produced during the disconnection time and feeding it in the grid after reconnection.
Thirdly, a large penetration of PV will not be able to cover all consumption peaks and therefore
storage seems necessary to defer the energy injection to the grid during the peaks of load which
do not correspond to the peaks of PV generation.
Finally, storage can improve the quality of the supply by mitigating the over- and under
voltages and smoothing the PV output power.
Battery Technology Overview
Batteries are identified as the main technology vital for large scale grid integration of
intermittent renewable generation. Presently four battery solutions are usually deployed:
Lead-acid battery
The lead-acid battery was historically a front-runner for use in distributed generation
application. Deep-cycle lead-acid batteries are ideal for small-cycle renewable energy
integration applications; these batteries can be discharged repeatedly by as much as 80% of
their capacity and hence are suited for grid connected systems where users sell power back to
the grid through programs like net metering. With low investment costs, lowest self-discharge
of all rechargeable battery systems, and relatively ease of maintenance, they provide a cost-
competitive and proven solution to a range of storage requirements.
Drawbacks of this technology include limited cycle life, poor performance at low and high
ambient temperatures, failure due to deep and continuous cycling, and environmentally
unfriendly lead content and acid electrolyte which result in a large eco-footprint.
Nickel cadmium (NiCd) battery
Nickel cadmium batteries are an alternative to lead-acid batteries and rank alongside them in
terms of their maturity. Longer cycle life, higher energy densities and low maintenance
requirements highlight superiority of NiCd batteries in comparison with lead-acid batteries.
NiCd batteries offer many advantages in PV applications and factors such as their cycling
ability, durability, long life and reliability make them ideal for operating under adverse
conditions. NiCd batteries are a competitive replacement for lead-acid batteries for their use in
applications which require instantaneous power.
Nickel metal hydride (NiMH) battery
Nickel metal hydride batteries are a feasible alternative to NiCd batteries due to their improved
performance and environmental advantage. NiMH is environmentally friendly due to the lack
of toxic substances such as cadmium, lead or mercury. Energy density of NiMH cells is 25–
30% better than high performance nickel cadmium cells. However, NiMH batteries are largely
inferior to rechargeable Li-ion batteries. They also suffer from severe self-discharge, making
them inefficient for long-term energy storage. With a lot fewer drawbacks than lead-acid and
NiCd batteries, NiMH batteries are possible front-runners for renewable energy integration
applications.

Review of PV Systems and Battery Storage
9
Lithium Ion (Li-ion) battery
Li-ion batteries achieve the highest energy storage efficiencies and have the highest energy
density when compared to the three types of batteries discussed in previous sections.
Drawbacks of this technology include high investment costs and complicated charge
management systems due to closely defined operational limits. With the greatest scope for
development of future applications in a wide range of energy storage applications, much of the
research and development work is aimed at reducing the capital cost of Li-ion batteries and
further improving performance of this technology.

The SunGenie Solution
10
4. The Sun Genie solution Initial studies and data gathering carried out by PSG in year 1 of GREEN Grid identified key
information that aided the design of the concept for Vector’s “SunGenie Program”. This section
describes the concept and components of SunGenie.
Introduction
The possible impacts and issues associated with runaway take-up of grid-connected PVs were
highlighted in the previous chapter. Utilities in different countries have answered differently to
these issues by, for example;
Restricting and blocking the further expansion
Applying monthly fees or pushing for higher network charges for the customers who
install rooftop solar PVs
Downsizing rooftop proposals
Removing discounts and forcing tariff changes on solar consumers
The above solutions may threaten the surging rooftop solar PV market. An opportunity was
seen here for New Zealand to avoid making similar mistakes as other countries by restricting
customers who wish to have PV. In 2013, after extensive studies and design work Vector
started the rollout of its SunGenie solar storage package for homes, identifying that rapid
developments in costs and technologies mean the nature of the electricity market is changing
– and utilities needed to adapt to remain relevant. Upon launching the program, experts in other
countries were very interested and pointed to two salient aspects of the SunGenie program -
“one that the network operator is actively exploring alternative solutions to dealing with the
demands of the grid, and the second is the pricing of the offer – given that “grid competitive”
battery storage solutions were considered by most to be several years away” [3].
The SunGenie program offered a leasing option of 3 kW, 4 kW and 5 kW solar PV systems
together with a 10.7 kWh Lithium-Ion battery. The cost for the 3 kW system was a NZ$1,999
down payment followed by 150 payments of NZ$70 per month over the course of the 12.5 year
lease. Assuming NZ inflation at around 3 per cent p.a., the associated levelised cost of
electricity (LCOE) of the package was around $0.21/kWh (US $ 0.17) in 2013 $NZ. This was
comparable with the average tariff of around NZ$ 0.254/ kWh [3].
It was expected that the PV array used in the 3
kW system would produce around 12 kWh on
an average day which is about ½ of the
consumption of an average all electric home in
Auckland. The intent of the solar / battery
system was to reduce the evening peak, as well
as to manage the intermittent effects of solar
PV on the network. The system was designed
so that home uses energy stored in the battery
at peak times, rather than using conventional
energy sources from the grid [3]. The battery
acted as a load in the home during the daytime,
allowing excess solar energy to be stored and
therefore managing voltage issues.
Figure 4-1: SunGenie Installation [4]
The SunGenie Solution
11
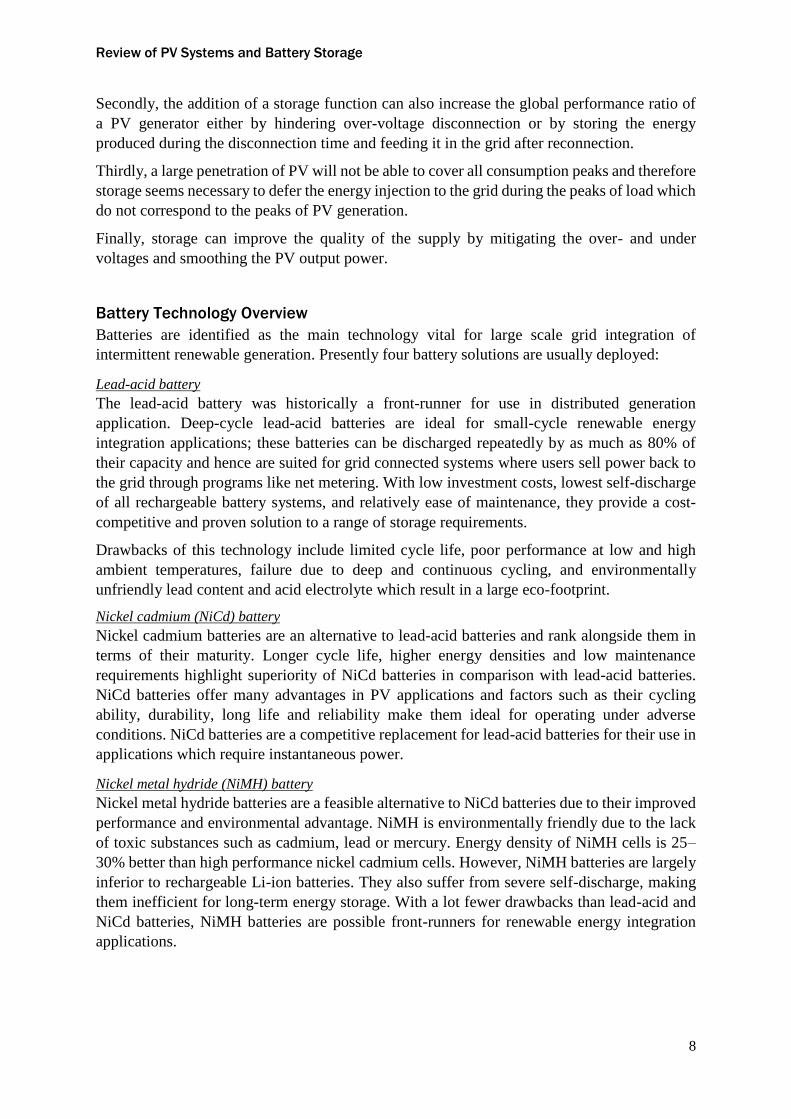
Advanced features of the system included solar ramping so that sudden changes in generation due to
cloud cover were buffered, reducing the overall grid-impact of the PV due to fluctuating output.
In the pilot program Vector deployed 289 solar / battery systems across their network.
The SunGenie Components
The components (apart from the 3 kW Trina PV panel array solar panels) of SunGenie are
shown below in Figure 4-2.
Figure 4-2: Some components of Vector's SunGenie Program (left to right: The SunGenie online dashboard (shown on
smart phone, desktop and tablet) and the cabinet)
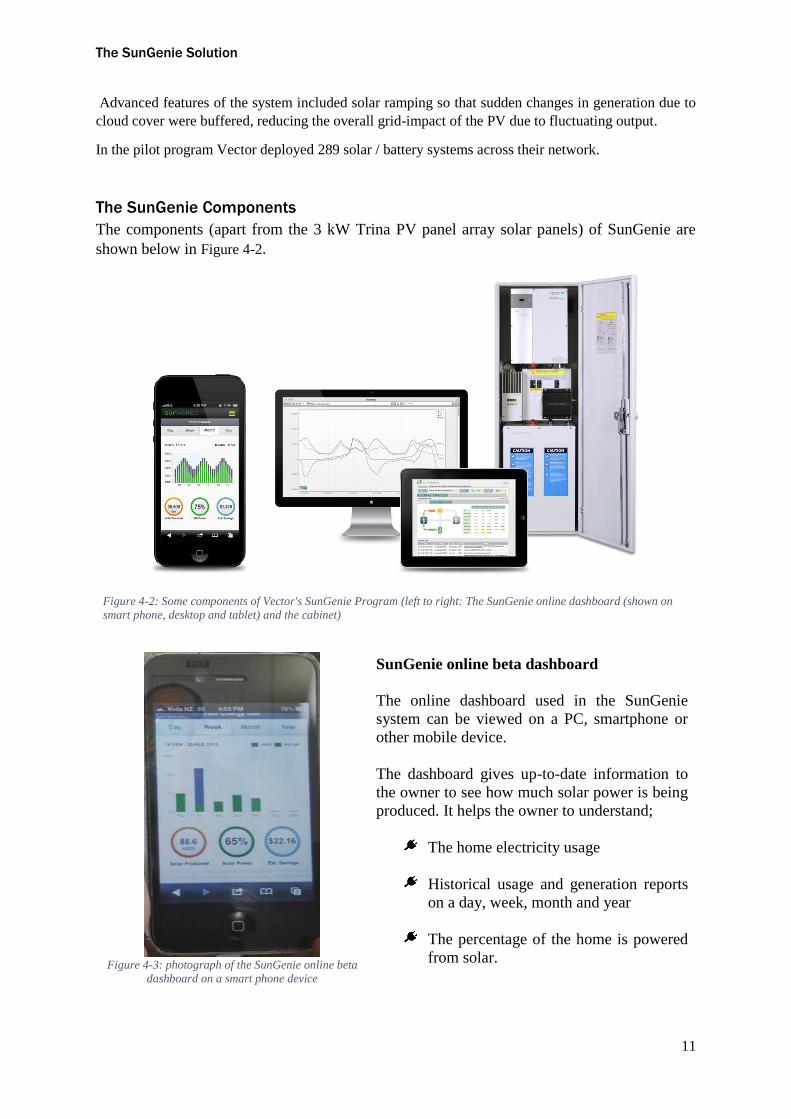
Figure 4-3: photograph of the SunGenie online beta
dashboard on a smart phone device
SunGenie online beta dashboard
The online dashboard used in the SunGenie
system can be viewed on a PC, smartphone or
other mobile device.
The dashboard gives up-to-date information to
the owner to see how much solar power is being
produced. It helps the owner to understand;
The home electricity usage
Historical usage and generation reports
on a day, week, month and year
The percentage of the home is powered
from solar.
The SunGenie Solution
12
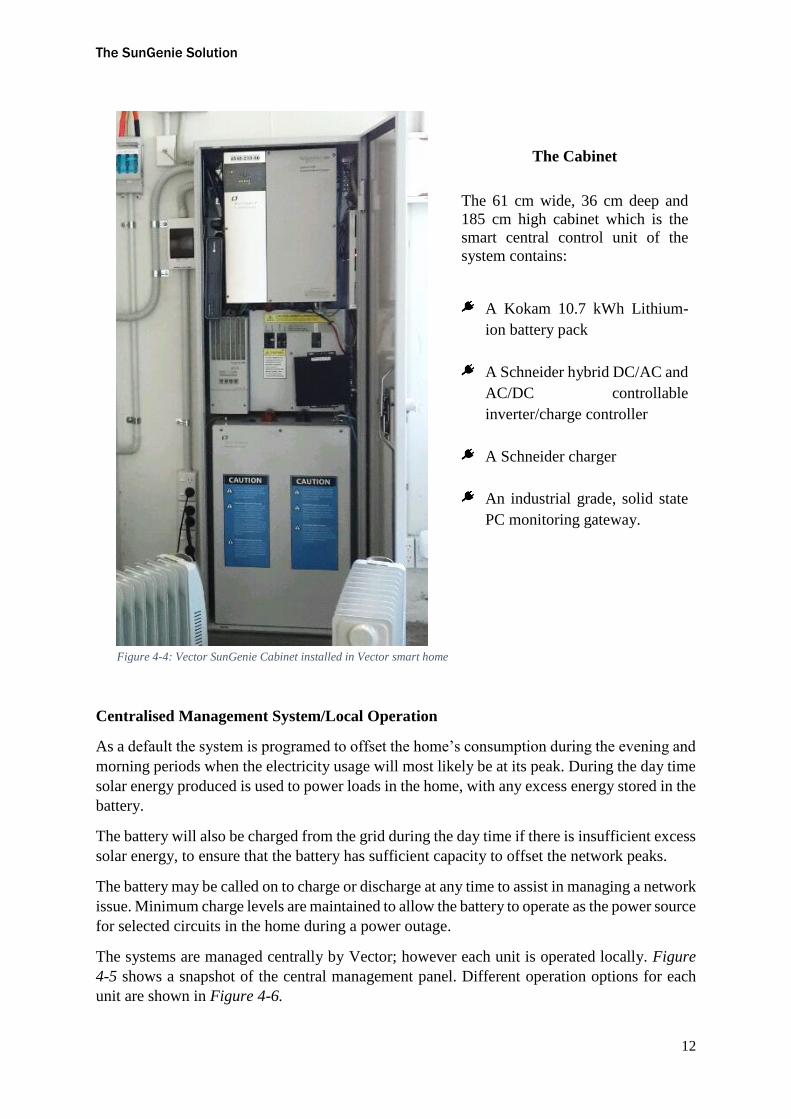
The Cabinet
The 61 cm wide, 36 cm deep and
185 cm high cabinet which is the
smart central control unit of the
system contains:
A Kokam 10.7 kWh Lithium-
ion battery pack
A Schneider hybrid DC/AC and
AC/DC controllable
inverter/charge controller
A Schneider charger
An industrial grade, solid state
PC monitoring gateway.
Centralised Management System/Local Operation
As a default the system is programed to offset the home’s consumption during the evening and
morning periods when the electricity usage will most likely be at its peak. During the day time
solar energy produced is used to power loads in the home, with any excess energy stored in the
battery.
The battery will also be charged from the grid during the day time if there is insufficient excess
solar energy, to ensure that the battery has sufficient capacity to offset the network peaks.
The battery may be called on to charge or discharge at any time to assist in managing a network
issue. Minimum charge levels are maintained to allow the battery to operate as the power source
for selected circuits in the home during a power outage.
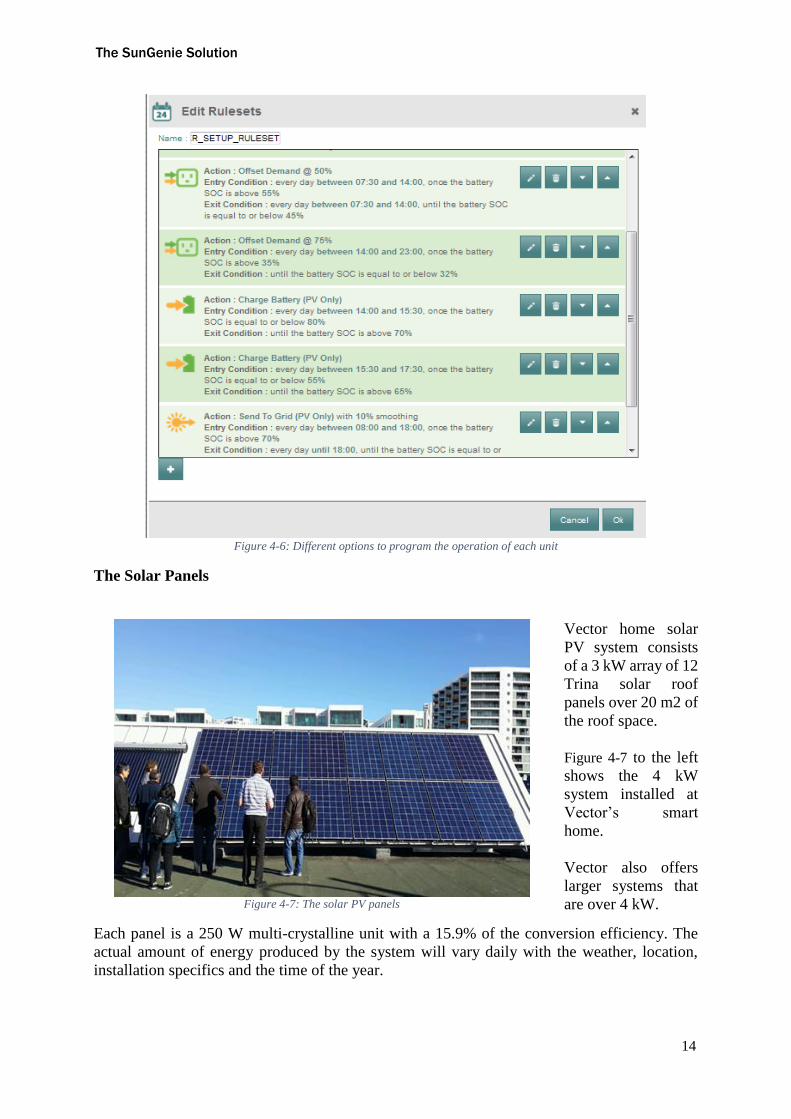
The systems are managed centrally by Vector; however each unit is operated locally. Figure
4-5 shows a snapshot of the central management panel. Different operation options for each
unit are shown in Figure 4-6.
Figure 4-4: Vector SunGenie Cabinet installed in Vector smart home

The SunGenie Solution
13
Figure 4-5: Example of the Vector SunGenie systems central management system
The SunGenie Solution
14
Figure 4-6: Different options to program the operation of each unit
The Solar Panels
Figure 4-7: The solar PV panels
Vector home solar
PV system consists
of a 3 kW array of 12
Trina solar roof
panels over 20 m2 of
the roof space.
Figure 4-7 to the left
shows the 4 kW
system installed at
Vector’s smart
home.
Vector also offers
larger systems that
are over 4 kW.
Each panel is a 250 W multi-crystalline unit with a 15.9% of the conversion efficiency. The
actual amount of energy produced by the system will vary daily with the weather, location,
installation specifics and the time of the year.

The SunGenie Solution
15
Figure 4-8: 4 kW PV array at Vector smart home
Vector Data Analysis on the Impacts and Benefits of PV/ Battery Storage
A summary of the impacts of PV and the benefits of using PV/ battery energy storage was
provided in the review in chapter 3. Some of those impacts and benefits have been investigated
by Vector through SunGenie and some results are shown in Figure 4-9 & Figure 4-10.
Figure 4-9: Typical home with a Vector 3 kW solar array and 10.7 kWh battery storage

The SunGenie Solution
16
Analysis was undertaken to understand the impacts on grid electricity requirements and the capability
of the battery to “time-shift” the solar energy generated in attempt to reduce peak demand on the grid.
Figure 4-9 shows how the energy collected from excess solar generation the previous day is used to
offset the home load during the early morning, reducing the morning peak demand from the grid.
During the daytime, excess solar energy is used to recharge the battery pack and this stored energy is
then used to significantly reduce the evening peak at the home. (Note: this example is for one particular
operating mode for the system – in this case with a bias to maximise solar consumption. See Figure 4-6
on operating mode examples). The significant impact of the solar /battery system on the quantum of
electricity required to be drawn from the grid, and the potential to reduce the peak demand on the
network is demonstrated.
Figure 4-10: Example of the feeder power smoothing using battery energy storage
The aggregated effect of distributed battery storage can effectively manage both the intermittent nature
of solar generation and provide a relatively flat grid electricity demand profile.
Figure 4-10 demonstrates the grid electricity demand over a 2 day period. The grid demand, in yellow,
hovers around a value of 50 to 60 kW for the sample of homes. Without battery storage, the network
peak would have been up to 380 kW.
Through Vector’s SunGenie program, detailed data has been collected to demonstrate the potential
value distributed battery storage has in future network management applications. The program has also
allowed various operating modes and control algorithms to be tested to achieve various objectives.

Inverter Trials
17
5. Inverter Trials Introduction
In March 2014, Vector decided to initiate a new solar program, this time utilising an advanced
inverter with dynamic Volt/VAr control. The inverter is required to be able to respond to the
network voltage and adjust the power factor of the generated output to help maintain voltage
within set limits. These Volt/VAr control enabled inverters should then theoretically allow
solar PV systems to be connected to the network with fewer issues than previous solar PV
systems without this inverter capability.
The University of Auckland’s PSG was approached to assist Vector in testing the three
inverters under consideration. What Vector was looking for was a deep understanding of how
best to configure the inverters, and then, to test their responses to the grid voltage and frequency
changes using laboratory equipment. The objective was to test the basic behaviour of the
inverters against New Zealand’s grid codes. Three inverters, each by a different manufacturer,
were to be tested.
Figure 5-1: Power Systems Group and Vector at Vector Smart Home, July 2014
The test bench was developed at first by using the available equipment in the power system
laboratory in University of Auckland and an advanced data logger was provided by Vector.
This was the first experience of its kind for utilities in New Zealand.
The basic tests results were very promising and Vector were interested to take the testing
project to the next level. Two of the three initial inverters were chosen to participate in the
laboratory testing of their advanced settings. The results of the advanced tests, summarised in
Appendix 2, were reported to Vector and the preferred inverter to be used for Vector’s program
was selected.
Inverter Trials
18
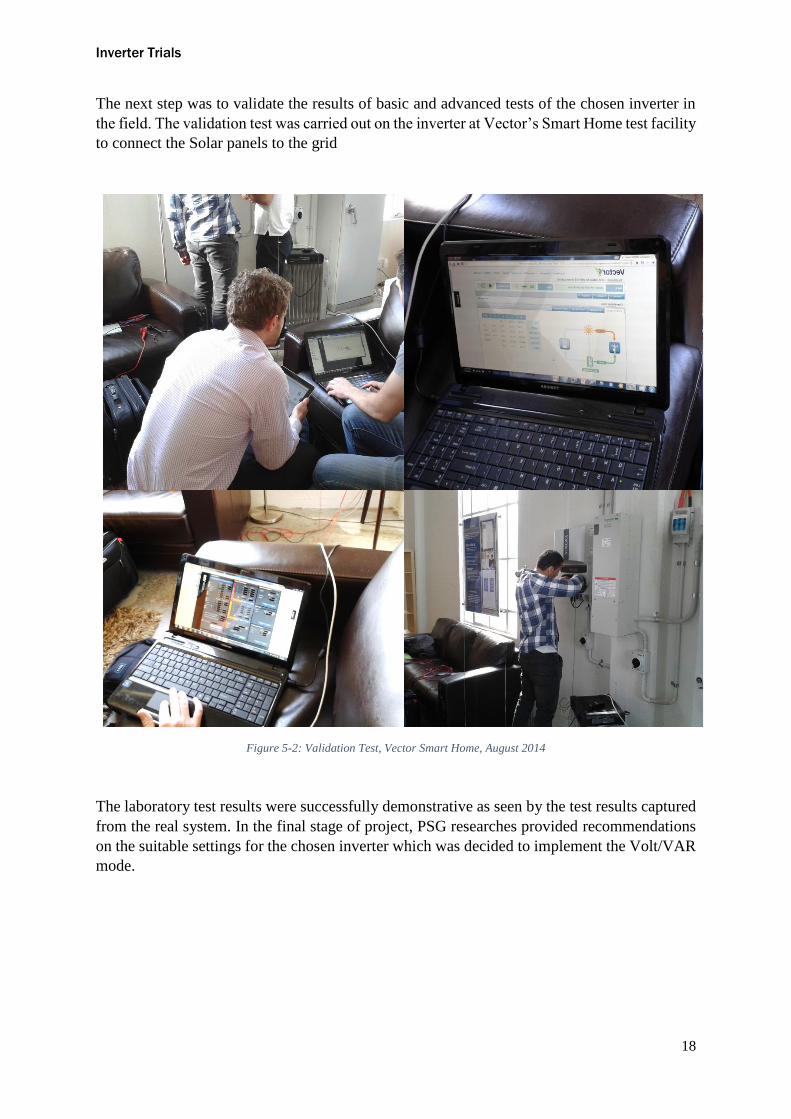
The next step was to validate the results of basic and advanced tests of the chosen inverter in
the field. The validation test was carried out on the inverter at Vector’s Smart Home test facility
to connect the Solar panels to the grid
Figure 5-2: Validation Test, Vector Smart Home, August 2014
The laboratory test results were successfully demonstrative as seen by the test results captured
from the real system. In the final stage of project, PSG researches provided recommendations
on the suitable settings for the chosen inverter which was decided to implement the Volt/VAR
mode.

Inverter Trials
19
Inverter Test Bench: the set-up & its components
The test circuit can be described by the following simplified circuit representation. The AC
source acts as the LV grid, the resistor represents the home electrical load and the DC source
represents the solar PV panel generation.
Figure 5-3: Simplified test circuit
Figure 5-4: A simplified model of a grid connected home with a PV installation
The test circuit was designed
to represent a typical
residential PV installation
where the dwelling is also grid
connected as shown in Figure
5-4.
This representation acted as a
guide for implementation of
the final test bench.
Figure 5-5: The inverter test bench, a simplified representation of a grid tied
residential PV installation
Once characterised it was
necessary to substitute the PV
array for a DC source, the
home for a controllable AC
load, the smart meter for a
power analyser / data logger
and the power grid for a
programmable AC source as
shown in Figure 5-5.

Inverter Trials
20
The devices used in the test bench adhere to the following guidelines:
The IEEE 1547.1 [5] ‘Measurement accuracy and calibration of the testing equipment’
The test protocol [6] under section 5.2 ‘Test Equipment Requirements’
Programmable DC supply
A Sorensen SGI800-6.2 DC Supply was utilised as the source for the inverter under test.
Figure 5-6: Sorensen SGI800-6.2 [7]
This particular device is capable of outputting 800 V at 6
A and is suitable for emulating a residential scale PV
panel installation of up to 4.8 kW. The device is
programmable either by way of the front panel or for
more complex inputs via the rear RS232 port and a serial
terminal programme (such as MS HyperTerminal). This
latter functionality would allow for various stochastic
solar irradiance patterns to be simulated.
Programmable AC source
The intention of this device is to simulate the LV grid network
and the various operating conditions the inverter could
experience. The ability to program ramp and step functions is
crucial to a number of fault scenarios and tests as laid out by
the IEEE 1547.1 standards. To satisfy these requirements an
Agilent 6813B rated at 1750 VA, 300 V, 13 A was used.
Figure 5-7:Agilent 6813B [8]
Programmable AC load
Figure 5-8: Sorensen SLH 300V,
18A, 1.8kW [9]
To simulate the load of a home and to act as a controllable
current sink for the inverter under test, a Sorensen SLH 300 V,
18 A, 1.8 kW device was utilised. By paralleling up to three
devices together sufficient loading could be provided for
residential scale PV inverters. Functionality exists that allows
for multiple load settings to be pre-programmed and
introduced systematically so to simulate load changes within
the home.
Digital power meter
To evaluate an inverters performance after test run it is necessary to accurately capture the
electrical quantities such as voltage, current, power – both real and reactive, current harmonics
and waveform distortions. A Fluke 434 Power Quality Analyser was initially used but due to
limited resolution of one second intervals we moved onto a more capable ELSPEC G4500
BLACKBOX PQA. The ELSPEC device samples at 1024 times per cycle for voltage and 256
times per cycle for current resulting in high resolution waveforms that aided characterising the
inverter behaviour in response to the simulated fault conditions. Captured data was viewed
using the relevant device’s proprietary software.

Inverter Trials
21
Basic tests
The basic inverter tests explore the inverters operation under basic settings in accordance with
applicable standards carried out include:
Over/under voltage
Sags & swells
Over/under frequency
LVRT (low voltage ride through)
Harmonics
Results from these basic tests are included in the Appendix 1.
Basic inverter settings were accessible and adjustable through the inverter basic settings GUI
panel.
Figure 5-9: Inverter B GUI panel for basic settings
Inverters Tested
Three inverters were used for assessment during the basic testing. This report includes the
results of only the two inverters that were chosen to undergo both basic and advanced tests -

Inverter Trials
22
referred to as Inverter A and Inverter B. All inverters were rated at a max output of 3 kW. By
harnessing their proprietary software the advanced functionality was explored and tested.
Over/ under voltage
The IEEE 1547.1 standards for Over / Under Voltage are summarised in Table 1 and closely
follows the accepted levels in New Zealand of > 1.1 p.u. for over voltage and <0.88 p.u. for
under voltage, as indicated by Vector grid codes and are considered as such when the event
persists for greater than one minute.
Table 1: Over and Under Voltage Settings
Table 1 summarises the over- and under-voltage limits and associated disconnection times
when these conditions are experienced at the point of common coupling.
The AC source was set to a nominal voltage of 230 V at 50 Hz and was either increased at 5
V/sec for the over-voltage test up to 275 V or decreased at 5 V/sec for the under-voltage test
down to 160 V until a collapse of the current was detected - thereby confirming the inverter
had stopped energising. By correlating the time indices of the current and voltage in FlukeView
it was possible to ascertain the voltage level at which the disconnection was occurring.
As it was indicated in Table 1, the other half of these tests are to ensure the inverters disconnect
within a certain timeframe depending on the voltage level. In accordance with Appendix A in
the IEEE 1547.1 document, ramp changes in voltages were programmed into the AC source
and the time from when this was initiated to disconnection was recorded.
Sags and swells
As defined by IEEE 1159-1995 [10] voltage sags are between 0.1 p.u. and 0.9 p.u. - for either
voltage or current (RMS) for a duration of ½ cycle to one minute and are caused by abrupt
increases in loading such as short circuits or motors starting.
Voltage swells, classed as between 1.1 p.u. and 1.8 p.u. for duration of ½ cycle to one minute,
are usually caused by abrupt reductions in loading on a circuit and are less common than sags.
These abnormal conditions can be of particular issue for sensitive electronic equipment. While
the IEEE 1547.1 document does not specify actual tests for these conditions, the relevant
voltage sag/swell ranges as described were investigated for durations up to one minute.
The AC source was set to various voltage levels and it was checked to see if the inverter
remained connected for one minute. For sags, voltage levels of 0.3 p.u., 0.5 p.u., 0.7 p.u. and

Inverter Trials
23
0.9 p.u. were investigated. For swells, voltages of 1.1 p.u., and 1.2 p.u. up to 1.3 p.u. were
investigated only - due to the limitation of the AC source being 300 V.
Over / under frequency
As previously indicated there are a number of international standards that help guide DG
inverter testing. Table 2 summarises various international standards for over and under
frequency, including for comparative purposes Vector’s settings for residential DG inverters.
Table 2: Over and Under Frequency Settings
The power outputs of residential inverters (typically < 5 kW) are not considered sufficiently
large enough to alter the grid frequency or provide support, as such the settings guidelines for
DG inverter disconnection are in response to fault conditions on the LV grid.
The AC source was set to a nominal voltage of 230 V at 50 Hz. The frequency was either
increased at 1 Hz/sec for the over-frequency tests, up to 60 Hz or decreased at 1 Hz/sec for
under- frequency test down to 40 Hz until a collapse of the current was detected; thereby
confirming the inverter had stopped energising. As with the abnormal voltage tests, the time
indices of the current collapse was matched to obtain the frequency value at which the inverter
disconnected.
As previously described for the voltage time response, the same approach was taken for
frequency. A ramp function for frequency was programmed into the AC source in accordance
with the IEEE 1547.1 standards and the time from when this was initiated to disconnection was
recorded.
Low voltage ride through (LVRT)
For grid connected PV inverters this is a necessary feature so to avoid unwarranted
disconnections that can exacerbate power quality issues such as voltage fluctuations. The
LVRT guidelines in New Zealand are currently aimed at medium voltage connected wind
generation. For this project a number of tests were performed with increasing depths of voltage
dip. A typical LVRT voltage profile is shown in Figure 5-10 and represents the format used in
this project for programming the AC source.

Inverter Trials
24
Figure 5-10: A LVRT voltage profile highlighting where the inverter must remain connected to the grid. Image from [11]
By programming the AC source to produce the voltage profile as indicated in Figure 5-10, the
LVRT test could be performed for increasing voltage dips from 0.7 p.u. (161 V) stepping in
0.1pu increments for each new test, down to 0.4 p.u. (92 V). Each test was performed at three
different DC input power levels of 750 W, 1000 W and 1500 W for both inverter A and B. By
examining the resultant current readings in FlukeView it was possible to confirm that both
Inverter A and Inverter B remained connected during the LVRT events except for the 0.4pu
test. Whereby confirmation came from the current rising immediately after the voltage began
to return to 0.9 p.u. (207 V) as per the LVRT guidelines. The corresponding voltage and current
profiles are shown in Figure 5-11 and Figure 5-12 respectively. The time index is shown for
the lowest point of the dip.
Figure 5-11: The LVRT voltage profile as captured from FlukeView for a 0.5pu (115V) test

Inverter Trials
25
Figure 5-12: The corresponding current profile showing the inverter remained connected during the LVRT event.
Harmonics
Harmonics are an established issue within power system networks and have been well studied.
This has led to standards/guidelines that have been developed to deal with this issue on
distribution networks. The AS/NZ 4777.2:2005 (latest revision accepted in 2015) document
draws upon the IEEE 929-2000 standard for this issue and the associated harmonic and level
are summarised in standard Table.
Table 3: Current harmonic tolerance levels as outlined by the IEEE 929-2000 standard
Using the inbuilt functionality of the ELSPEC PQA, it was possible to view either current or
voltage up to the 100th harmonic and the overall total harmonic distortion (THD) %. The DC
input was increased from 0.5 kW through to 3 kW (max rated power) in 0.5 kW intervals and
the harmonics were recorded for each input power level. For one inverter the THD level
exceeded the tolerance level that was reported to Vector.
A summary of basic tests results on two inverters is shown in Appendix 1.

Inverter Trials
26
Advanced Tests
With the express interest of improving power system reliability and efficiency, the capabilities
of inverters to behave autonomously have been well developed in response to guidelines issued
by the IEC [12]. If the advanced settings are unlocked and applied, DG inverters can respond
dynamically to changes in local voltage levels and frequency deviations. This flexibility can
help support grid codes without the explicit need to continually communicate with the devices.
Each inverter’s proprietary software provided the gateway for setting the various options and
were accessed either via Bluetooth (for inverter A) or through a USB-to-RS485 connection (for
inverter B). The inverter, its GUI gateway, and the access tools to the gateway are shown
pictorially in Figure 5-13.
The advanced inverter settings for inverters A and B that were unlocked and tested in the
laboratory were as follows:
Volt/VAr control for voltage regulation
Output power/ frequency control
Power factor /cos (phi) tests
The summarised results from the advanced tests are included in Appendix 2.
Figure 5-13: Inverter GUI and the access tools to the gateway
Volt/VAr Test
The phase-shifting functionality allows DG to contribute to voltage control and current
reduction near to the point of common coupling (PCC) in a cost effective manner. By
harnessing their built-in power electronics, inverters can absorb reactive power in an attempt
at voltage regulation. The depth and flexibility of Volt/VAr settings are determined by the
manufacturer, Figure 5-14 demonstrates a standard dead-band setting for inverter Volt/VAr
control from the power plant perspective.
Advanced• Volt / Reactive Power (VAr)• Power (W)/ Frequency (Hz)• Power Factor or Cos(phi)

Inverter Trials
27
Figure 5-14: The voltage set points and corresponding reactive power compensation from the perspective of the
inverter’s output. A dead-band has been implemented between V2 and V3
A range of tests were conducted to explore the relationship between voltage changes and
resultant reactive power compensation given the available inverter setting options. The AC
source voltage was increased from a nominal voltage of 230 V to 245 V at 1 V/sec and the
corresponding inverter reactive power compensation was observed. An example of a test run
on inverter A is shown in Figure 5-15 where it was observed that as the voltage is increased
the reactive power starts to back off and eventually inverter begins to absorb reactive power in
an attempt to counteract the voltage rise.
Figure 5-15: Volt/ VAr test results for inverter A: the relationship with voltage and reactive power

Inverter Trials
28
Power / Frequency Test
Residential PV systems are typically <5 kW, meaning their ability to influence local grid
frequencies is minimal. The inverters tested both came with the capability to alter their power
output in response to changes in grid frequency and this was explored through testing for
completeness. Depending on utilities guidelines and the inverter functionality, an option to
activate hysteresis may be possible with the differing modes illustrated in Figure 5-16.
Figure 5-16: Reduction in power output as the grid frequency increases, following a set gradient (a) and with hysteresis
enabled showing the power output remaining suppressed until a set point frequency (Hz Stop) is reached and the power
output returns the maximum (b)
To test the inverters’ response to frequency changes, the AC source frequency was increased
at 0.1 Hz/sec to 51 Hz and the behaviour of the inverter was noted. It is clearly shown Figure
5-17 that the inverter reduces the real power output as the frequency increases. Depending on
the inverter functionality it may be possible to alter the control system gradients, thereby
controlling how quickly the inverter responds.
Figure 5-17: Reduction in inverter A output with an increase in frequency and then returning to the set point for power
output once the nominal 50Hz is reached

Inverter Trials
29
Power Factor / cos (phi) Test
By default, inverters are sold with their output set to unity power factor (PF = 1), meaning that
this output power has no reactive components. Through advanced functionality, the PF can be
modified to be between 0.95 lagging (inductive) and 0.95 leading (capacitive) as allowed by
the New Zealand and Australian standards NZ/AS 4777 (2015) for grid tied inverters rated at
less than 20A / phase [13]. The ability of inverters to alter their output, in response to demand
changes and power quality issues, aids in grid regulation, making this functionality a useful
feature. As illustrated by Figure 5-18, different PF’s can be set for differing levels of output
active power. The inverter will then alter the phase angle between its current and voltage to
achieve the desired PF.
Figure 5-18: Inverter power factor change due to changes in the output of real power
As shown in the next figure, Figure 5-19, by setting the power factor to 0.85 lagging at 1.5 kW,
reactive power is injected into the current sink at 1.0 kVAr. Then due to the settings under this
advanced functionality, as the real power is increased the reactive power output reduces and
eventually becomes 0.85 leading (or absorbing). This test was purely for demonstration
purposes but was carried out with the intention of limiting voltage rises on the LV grid with
the aim to help support the grid codes.

Inverter Trials
30
Figure 5-19: Relationship between real (top pane) and reactive power (middle pane) and the associated power factor
(bottom pane)
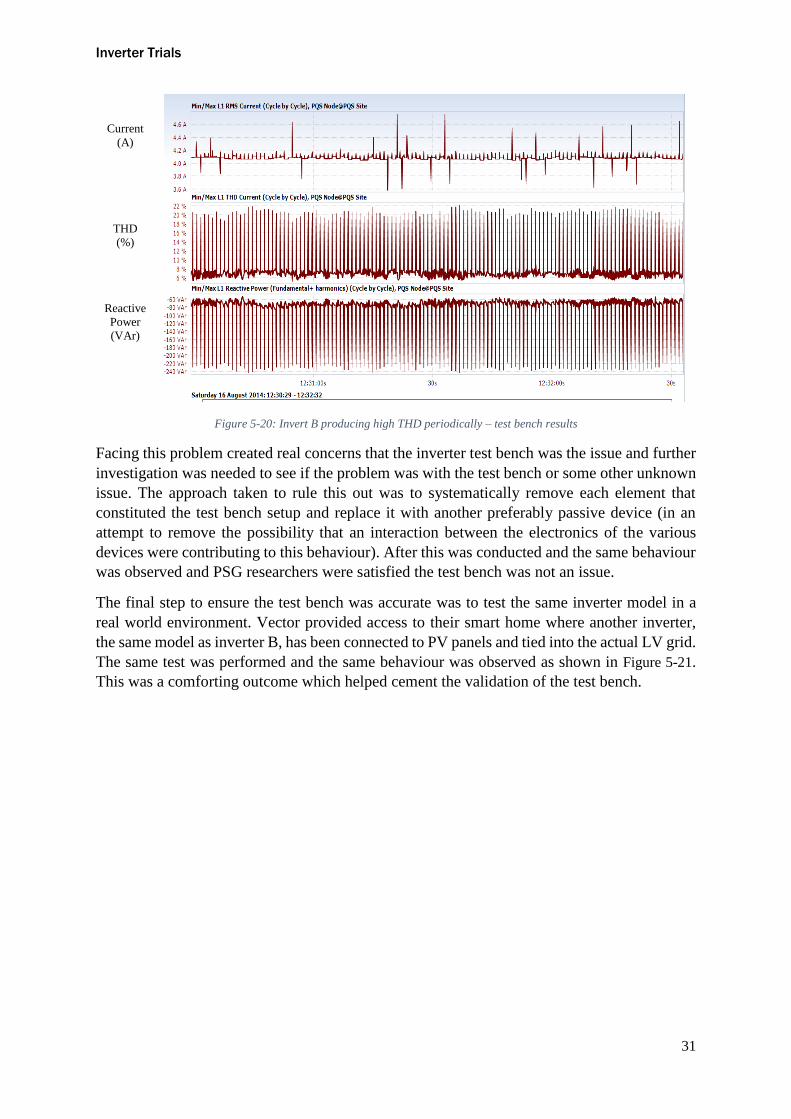
Validating the Test Bench Results
In order to validate the accuracy of the lab results for all inverter tests, the test bench required
validation. This was done by comparing test results to inverter performance in the field. When
conducting the first ‘out of the box’ tests in the lab for Inverter B, it was found that the inverter
was producing high total harmonic distortion (THD) readings and periodically and consistently
drawing VArs as shown in
Figure 5-
20. It was found that by turning on the advanced features these problems settled down but it
was still there to some extent.
Inverter Trials
31
Current
(A)
THD
(%)
Reactive
Power
(VAr)
Figure 5-20: Invert B producing high THD periodically – test bench results
Facing this problem created real concerns that the inverter test bench was the issue and further
investigation was needed to see if the problem was with the test bench or some other unknown
issue. The approach taken to rule this out was to systematically remove each element that
constituted the test bench setup and replace it with another preferably passive device (in an
attempt to remove the possibility that an interaction between the electronics of the various
devices were contributing to this behaviour). After this was conducted and the same behaviour
was observed and PSG researchers were satisfied the test bench was not an issue.
The final step to ensure the test bench was accurate was to test the same inverter model in a
real world environment. Vector provided access to their smart home where another inverter,
the same model as inverter B, has been connected to PV panels and tied into the actual LV grid.
The same test was performed and the same behaviour was observed as shown in Figure 5-21.
This was a comforting outcome which helped cement the validation of the test bench.

Inverter Trials
32
Current
(A)
THD
(%)
Reactive
Power
(VAr)
Figure 5-21: Invert B producing high THD periodically – grid connected results
Recommended settings
In the final stage of the testing project, PSG researchers were invited to provide their
recommended settings for the inverter chosen by Vector. During the meeting it was decided
that Vector choose to use the Volt/VAr mode of the inverter advanced control functions. The
potential over voltage issue that could arise in some parts of the Vector LV distribution network
(without any PV penetration) was the main reason behind this decision. The other option was
to use the inverter active power control to prevent the overvoltage. However, a disadvantage is
that the PV power output is dumped to control the voltage, leading to lower overall efficiency
of the PV system.
Consequently, PSG recommended the appropriate settings for the Volt/VAr control to be
applied to all model B inverters. Some issues on the inverter behaviour encountered during the
basic and advanced tests were also highlighted and the importance of fixing those problems
identified.
To summarise, the collaboration between PSG and Vector resulted in the knowledge on how
to best setup inverters so to help support the grid codes and avoid the sort of power quality
issues experienced overseas. This resulted in a very effective test bench that can be used to
achieve sufficient outcomes to characterise and understand an inverter’s grid interaction
behaviour. The outcome was very well received by Vector. The interest from industry is further
confirmation that results obtained during this project are highly relevant and applicable to real
world implementation.

Inverter Trials
33
Figure 5-22: Inverter installed at Vector smart home

Key Ideas and Lessons learnt
34
6. Key Ideas and Lessons Learnt
This section describes all lessons learnt and key ideas taken from this 3 year trial. This
knowledge is aimed, not only at the utilities, but also towards the general public & potential
customers. The lessons learnt from the initiation, design, testing and operation stages of
Vector’s PV/battery trials will describe any tests that would need to be carried out on future
inverters prior to their installation.
Lessons learnt from grid connected Inverter Energy Systems
i. Smart inverters with a wide range of different adjustable functionalities (if activated) are an
important consideration for residential solar PV systems since these can be used to mitigate
the impacts of these intermittent distributed generation systems on the LV network.
ii. Smart inverters have some specific functions, like lock-in, lock-out function, that can be used
to improve the operational characteristics of the grid-connected PV/inverter systems in the
favour of grid security. It is important to check the existence of these functions and also to
adjust them properly to make sure that the PV/inverter behaviour complies with the grid
codes.
iii. It is recommended that for each network, the suitability of linking the network’s voltage
regulation to either active or reactive power control (and/or a mix of the two) by inverters to
be assessed to better comply with the grid codes and also to minimize the long-term impacts
on the PV outputs.
iv. Inverter testing and setting them properly before the installation and commissioning stage is
very important as it will reduce the need for the online communication with the inverter to
change the settings when it is in operation.
v. Inverter settings required to operate the protective functions of the systems are required to be
set by an authorised accredited person during installation. This must not be allowed to be
accessed by other persons not qualified or authorised.
vi. Standards and guidelines followed need to reflect high penetration scenarios of inverter based
energy systems in the network. Safety, protection and automation of the IES must comply
with the gird code in such scenarios.
Lessons learnt from the SunGenie program that may benefit the utility and the customer
vii. Vector’s SunGenie program reminds us that utilities can start thinking of new business
models for electricity services with PV and storage in mind.
viii. Battery energy storage offers multiple benefits for both utility and the PV owner. However,
the application of battery storage to residential PV systems has been limited due to the battery
Key Ideas and Lessons learnt
35
cost. Fortunately, new low-cost technologies are coming to market and it is anticipated that
the wide-area application of residential PV systems with battery storage to be revisited by
utilities. Future work with Vector’s PV/battery trials includes the use of the Tesla Powerall
battery as storage. These trials are discussed further in section 7.
ix. Utilities should consider the impacts of distributed battery storage on the network in their
network planning since the effects on network demand profiles could be significant in the
medium term (5-10 years).
x. Pilot programs, such as SunGenie, using new and emerging technologies are an invaluable
means of gathering real life data on their performance and functionality, thereby informing
the utility & customer on these solutions once technically and / or commercially viable.
xi. Customers can benefit from commercially viable PV/Battery systems, taking advantage of
the possibility of lower electricity prices.
xii. Customers can control their own home energy usage by learning more about their own
demands. The SunGenie dashboard provides a variety of usage data throughout the day,
informing the customer of the times at which their PV generation is maximum and the times
at which their grid usage is maximum. This information can be used by the consumer, if they
wish, to adjust their lifestyle in order to make the most of their PV/storage system and save
on their electricity bills.
In addition, for the general public who have read this report, It is hoped that the information
provided gives a larger understanding of PV & Battery systems available, how large scale PV
can affect the grid, the tests that are performed on inverters and why they are done, and the
effort that utilities in NZ are making to provide renewable alternative energy sources to uphold
New Zealand’s internationally renowned “Green” image.
Key Ideas and Lessons learnt
36
Figure 6-1: Happy customer publically announcing his satisfaction with SunGenie via Twitter

Future field trial work
37
7. Future field trial work
Assessment of long-term SunGenie performance
Data can be monitored across all SunGenie homes. The data monitored will give insight into
the practical effects of not only the existing installations, but will also give insight to the effects
that future higher penetration of PV systems may have across the grid.
If a fault or disturbance occurs in the power supply to some area of SunGenie installations, it
will prove useful to monitor how the systems react and if they react in unison. Their
disconnection levels, disconnection time and reconnection times can be compared across the
systems, in which they are installed, to see if a fault affecting many inverter based PV/Battery
systems at once could create a problem for the utility.
With additional PV/Battery systems being installed in future years, it will be important to
closely monitor changes in operation of the original 289 SunGenie systems. Crucial changes
in operation will be further researched to see if problems affecting the grid could occur with
further PV/Battery penetration. Changes to the grid and the introduction of large battery loads
could also have an effect on their operation.
Coordinated voltage control methods for NZ distribution following renewable DG
at MV, LV and household levels
Vector have agreed to continue working with PSG in critical step 2.3.7 to test new methods of
coordinated voltage control alongside a new PV/storage project owned by Vector. PSG will
be involved in the various stages of Vectors “Residential Solar Clustered Batteries” project
which consists of 30 homes being fed by clusters of PV with battery.
The test bench that has already been developed at the University of Auckland can be adapted
& used to help determine the coordinated voltage control strategies between the battery, the
PV, the smart meters and other existing voltage control devices in the network. The initial work
has already started and will be completed by 30th September 2017.
Future field trial work
38
Figure 7-1: PSG research students at Vector smart home, December 2015

i
8. References
[1] D. Kaundinya, P. Paramashivan and N. H. Ravindrath, “Grid-connected versus stand alone
energy systems for decentralized power - a review of literature,” Renewable and Sustainable
Energy Reviews 13.8, 2009.
[2] M. Bahadornejad and N. Nair, “Solar PV, Battery Storage and Low Voltage Distribution
Network: A discussion on the Benefits of Distributed Battery Storage,” University of Auckland,
Auckland, 2013.
[3] [Online]. Available: http://reneweconomy.com.au/2013/culture-shock-network-offers-solar-
storage-leases-to-customers-91569.
[4] [Online]. Available: http://article.wn.com/view/2015/05/11/Vector_chief/.
[5] IEEE Std. 1547.1 Sponsored by IEEE Standards Coordinating Committee on Fuel Cells,
Photovoltaics, Dispersed generation, and Energy Storage, Ney York: IEEE, 2005.
[6] E. Bower, Performance Test Protocol for Evaluating Inverters Used in Grid-Connected
Photovoltaic Systems [Online]., 2004.
[7] [Online]. Available: http://www.signaltestinc.com/product-p/sgi%20800-6.2.htm.
[8] [Online]. Available: http://www.axiomtest.com/Power-Supplies/AC-Power-Sources,-up-to-
3kVA/Keysight-..-Agilent/6813B/AC-Power-Source-..-Analyzer,-300V,-1750VA,-13A/.
[9] [Online]. Available: http://www.testequity.com/products/1480/.
[10] I. S. 1159, “Recommended Practice for Monitoring Electrical Power Quality,” 1995.
[11] T. Shu, “Study on Low Voltage Ride Through test Methods for PV Inverter,” in International
Conference on Electricity Distribution, Shanghai, 2012.
[12] “Photovoltaic (PV) systems - Characteristics of the utility interface,,” International
Electrotechnical Commission, International Standard IEC 61727, 2004.
[13] “Grid-connection of energy systems via inverters – Inverter Requirements,” New Zealand
Electrical Regulations AS 4777.2, 2015.
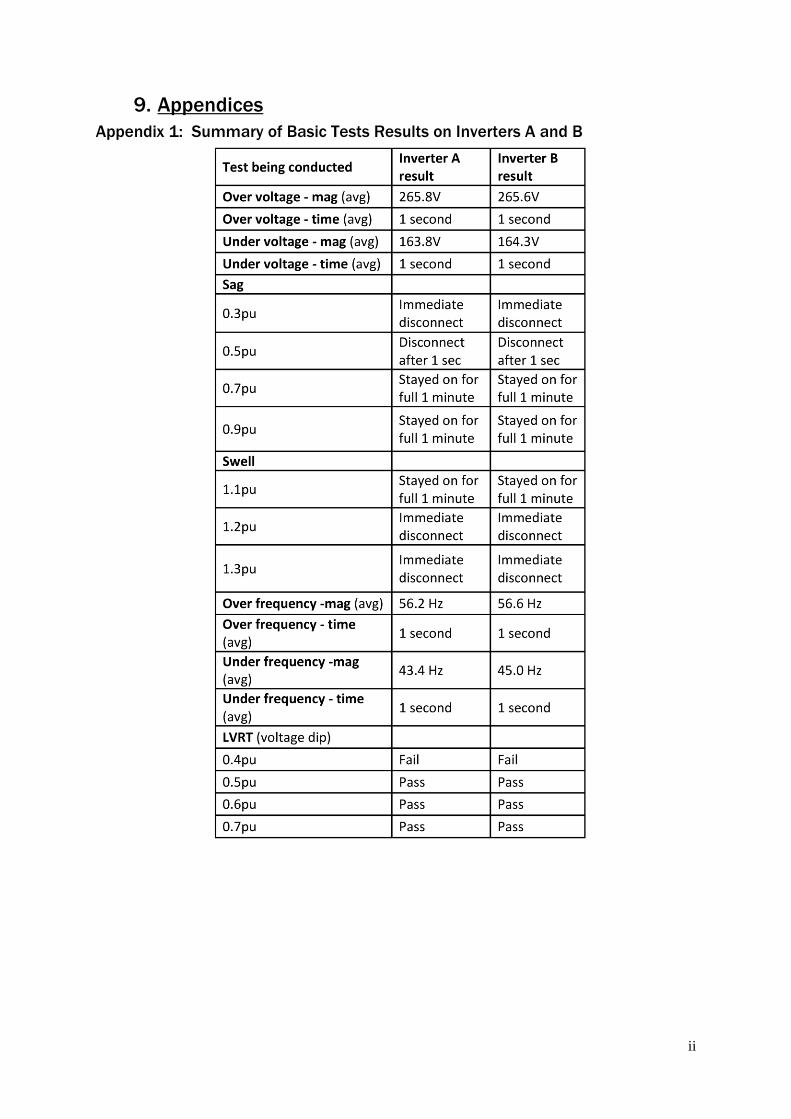
ii
9. Appendices
Appendix 1: Summary of Basic Tests Results on Inverters A and B

iii
Appendix 2: Summary of Advanced Results on Inverters A and B
Test conducted Inverter A Inverter B
Over voltage - mag (avg) 265.8 Volt 265.6 Volt
Over voltage - time (avg) 1 second 1 second
Under voltage - mag (avg) 163.8V 164.3 V
Under voltage - time (avg) 1 second 1 second
Sag
0.3pu Immediate disconnect Immediate disconnect
0.5pu Disconnect after 1 sec Disconnect after 1 sec
0.7pu Stayed on for full 1 minute Stayed on for full 1 minute
0.9pu Stayed on for full 1 minute Stayed on for full 1 minute
Swell
1.1pu Stayed on for full 1 minute Stayed on for full 1 minute
1.2pu Immediate disconnect Immediate disconnect
1.3pu Immediate disconnect Immediate disconnect
Over frequency -mag (avg) 56.2 Hz 56.6 Hz
Over frequency - time (avg) 1 second 1 second
Under frequency -mag (avg) 43.4 Hz 45 Hz
Under frequency - time (avg) 1 second 1 second
LVRT (voltage dip)
0.4pu Fail Fail
0.5pu Pass Pass
0.6pu Pass Pass
0.7pu Pass Pass