Embed Size (px)
Citation preview
Vector Measurements for Wireless Network Devices
EFRAIN ZENTENO
Licentiate Thesis
Electrical Engineering
School of Electrical engineering
KTH
Stockholm, Sweden, 2013

TRITA-EE 2013:004ISSN 1653-5146ISBN 978-91-7501-630-6
KTH - Electrical EngineeringSignal Processing
SE-100 44 Stockholm, SWEDEN
Akademisk avhandling som med tillstånd av Kungl Tekniska högskolan framläggestill offentlig granskning för avläggande av teknologie licentiatexamen fredagen den22 Feb 2013 klockan 13.00 i hörsal 99131, Kungsbäcksvägen 47, Gävle.
© Efrain Zenteno, February 2013
Tryck: Universitetsservice US AB
iii
Abstract
Wireless networks are an iconic technology of today’s modern era, theyare present in our daily activities as can be exemplified by cellular communi-cations, wi-fi, bluetooth, and others. Vector measurements play an importantrole in the design, simulation, and testing of wireless networks and are usedto characterize key devices operating in the radio interface, such as amplifiers,filters, and mixers.
Accurate characterization is the key for improving the capacity and effi-ciency of wireless networks. As the demand for network capacity continuouslyincreases, the accuracy of vector measurements must also improve. Further,it is anticipated that such trends will continue in the years to come. Con-sequently, the wireless industry needs to include nonlinear behavior in theircharacterization and analysis, to assess and guaranty the operation of the de-vices, and to comply to the specifications from governmental regulations. Incontrast to linear behavior, nonlinear behavior presents an additional band-width requirement because the signal bandwidth grows when it passes throughnonlinear devices. In this thesis, vector measurements for devices operatingin wireless networks are studied, emphasizing a synthetic approach for theinstrumentation. This approach enables the use of digital post-processing al-gorithms, which enhances the measurement accuracy and/or speed and canovercome hardware impairments. This thesis presents the design of a vecto-rial measurement system for wireless devices considering the aforementionedtrends and requirements. It also explores the advantages of the proposedapproach, describes its limitations, and discusses the digital signal processingalgorithms used to reach its final functionality. Finally, measurement resultsof the proposed setup are presented, analyzed and compared to those of mo-dern industrial instruments.

v
Acknowledgments
I would like to thank my supervisors, Dr. Magnus Isaksson at the Uni-versity of Gävle and Prof. Peter Händel at the Royal Institute of Technology,without their help this path would be much longer end less enjoyable.
I am certainly grateful to all the personal at ATM - University of Gävleand at the Signal processing department - Royal Institute of Technology KTH,for creating a nice work environment sharing ideas and inspiring to developmy best skills.
I truly enjoyed the time spent with my colleagues, Per Landin, CharlesNader, Sathyaveer Prasad, Javier Ferrer, Mohammed Hamid, and ShoaibAmin, a big smile for all the experiences, even if some of you are not aroundanymore I treasure amazing memories.
To my family for giving love, support and encouraging me despite of thedistance and the life waving. To my wife Pamela for all the happiness thatshe brought to my life.
Efrain ZentenoGävle, February, 2013.
Contents
Contents vi
I Introduction 1
1 Introduction 3
1.1 Overview . . . . . . . . . . . . . . . . . . . . . . . . . . . . . . . . . 31.2 Contribution of the Thesis . . . . . . . . . . . . . . . . . . . . . . . . 41.3 Acronyms . . . . . . . . . . . . . . . . . . . . . . . . . . . . . . . . . 6
2 Vector Measurements for Wireless Networks Devices 7
2.1 Overview . . . . . . . . . . . . . . . . . . . . . . . . . . . . . . . . . 72.2 Multisine Signals . . . . . . . . . . . . . . . . . . . . . . . . . . . . . 72.3 Software Defined Measurements in Radio . . . . . . . . . . . . . . . 82.4 Linear and nonlinear measurements . . . . . . . . . . . . . . . . . . . 92.5 Continuous Wave and Modulation . . . . . . . . . . . . . . . . . . . 10
3 Synthetic Vector Network Analysis 13
3.1 Setup . . . . . . . . . . . . . . . . . . . . . . . . . . . . . . . . . . . 133.2 Post Processing . . . . . . . . . . . . . . . . . . . . . . . . . . . . . . 143.3 Results . . . . . . . . . . . . . . . . . . . . . . . . . . . . . . . . . . . 173.4 Bandwidth extension . . . . . . . . . . . . . . . . . . . . . . . . . . . 22
4 Discussions and Conclusions 27
4.1 Discussions . . . . . . . . . . . . . . . . . . . . . . . . . . . . . . . . 274.2 Conclusions . . . . . . . . . . . . . . . . . . . . . . . . . . . . . . . . 28
Bibliography 29
vi

Part I
Introduction
1

Chapter 1
Introduction
Wireless networks are an iconic technology in today’s modern era. In recent years,wireless networks have experienced impressive growth, and this trend will likelycontinue in the years to come. Although the deployment of such networks haspromoted the development of novel applications and scenarios; the hardware usedto deploy these networks has become cheaper, and the capacity of the networks hasincreased.
Due to increasing demands from the users of wireless networks, operators strug-gle to offer greater capacity; thus, the importance of quick and accurate vectormeasurements is emphasized in modern industry. Lately, trends in “green technol-ogy” trend, which battle for the optimal use of energy, have enhanced the role ofefficiency in wireless networks. The simultaneous demand for, capacity and effi-ciency, has shifted the characterization needs from linear towards nonlinear, andthe present thesis discusses an approach for the required instrumentation.
1.1 Overview
To develop wireless networks, all of the different parts of the system must be under-stood, especially the hardware used in RF (radio frequencies), and the knowledgeand understanding of various devices comes from measurements. The RF por-tion of the system is characterized using vector measurements. The term vectorrefers to the ability to simultaneously measure amplitude and phase of waves. Incontrast, traditional microwave and radio measurements sometimes specify inde-pendent power or phase measurements.
Vector measurements provide engineers the knowledge required to design, de-ploy and maintain wireless networks. This measurements have a long and richhistory that encompasses vector network analysis since the design of vector net-work analyzers (VNAs) to modern nonlinear network analyzers [1].
3
4 CHAPTER 1. INTRODUCTION
1.2 Contribution of the Thesis
The contributions of this thesis are presented in 4 papers based on synthetic instru-mentation applied to vectorial radio measurements. These papers discuss the detailsof the setup design and post-processing algorithms required to achieve vector func-tionality using standard and generic hardware. The scenario posed in the setupincludes the use of a single noncoherent receiver, which is widely available in testand workstations.
These papers exploit the flexibility gained by digitizing the baseband prior toup-conversion (as present in many modern instruments), which allows the use ofdigital signal processing (DSP) algorithms, from which the RF behavior can beextracted.
Paper A: Paper A presents the synthetic instrument used to perform vec-tor measurements using a single receiver. This paper describes the procedure tomaintain the phase reference required for simultaneous amplitude and phase mea-surement. This paper highlight the DSP algorithms to achieve the vector mea-surement and correction. Chapter 2 of the present thesis provides an overview ofvector measurements for wireless network devices. Moreover, principles for syn-thetic instrumentation design are described, and their application in the design ofthe proposed synthetic vector network analyzer is briefly discussed in Chapter 3.
Paper B: Paper B proposes an extension of the synthetic instrument (SI) pre-sented in paper A to perform nonlinear in-band measurements. this extension ispossible considering that the measured bandwidth contains new frequency compo-nents in the measured band. Paper B addresses the calibration required to performthis type of measurements and introduces the power absolute calibration for thepresented instrument, which the same excitation signal in the experiments is usedas a time reference. Further discussion on this topic can be found in Chapter 3.
Paper C: Paper C summarizes paper A and paper B, and evaluates the speed,accuracy, and repeatability of the presented instrument (called SDM VNA). Fur-ther, paper C compares the SDM VNA with industrial modern vector networkanalyzers (VNAs) and describes its nonlinear abilities.
Paper D: Paper D describes a receiver bandwidth extension technique thatallows measurement over larger bandwidths, which is required for nonlinear cha-racterization. The proposed setup uses no additional hardware; facilitating the useof such schemes in operating tests and works stations. Chapter 2 of the presentthesis describe the need for this type of measurement and explain the relation-ship between bandwidth, dynamic range and averaging. The suggested bandwidthextension suggested relies on the use of a known user-defined signal. Further, dis-cussion on this technique can be found in Chapters 3 and 4.
1.2. CONTRIBUTION OF THE THESIS 5
Papers Included in the Thesis
The papers included in this thesis are listed bellow:
• Paper A: E. Zenteno, M. Isaksson, D. Wisell, N. Keskitalo, and O. Andersen,“An Envelope Domain Measurement Test Setup to Acquire Linear ScatteringParameters,” in 72nd ARFTG. Conf. Dig., Portland, OR, 2008, pp. 54-57.
• Paper B: E. Zenteno, O. Andersen, M. Isaksson, N. Keskitalo, and D.Wisell,“Nonlinear Network Analysis for Modern Communication Devices,”in 72nd ARFTG Conf. Dig., Portland, OR, 2008, pp. 64-68.
• Paper C: M. Isaksson, and E. Zenteno, “A Synthetic Vector Network Ana-lyzing Measurement System”, IEEE Trans. Instrum. Meas., vol. 60, no. 6,pp. 2154-2161, Jun., 2011.
• Paper D: E. Zenteno, M. Isaksson, and, Peter Händel, “A Bandwidth Ex-tension Technique for Radio Frequency Measurements Using Pilot Tones”,submitted to IEEE Trans. Instrum. Meas. 2012.
6 CHAPTER 1. INTRODUCTION
1.3 Acronyms
AUT : Antenna Under TestCW : Continuous WavedB : DecibelsDFT : Discrete Fourier TransformDSP : Digital Signal ProcessingDUT : Device Under TestFPGA : Field Programmable Gate ArrayLSE : Least Square EstimationLSNA : Large Signal Network AnalyzerNVNA : Nonlinear Vector Network AnalyzerPAPR : Peak to Average Power RatioPC : Personal ComputerPSD : Power Spectral DensityRBW : Resolution Bandwidth FilterRF : Radio FrequencySDM : Software Defined MeasurementSI : Synthetic InstrumentSNR : Signal to Noise RatioTOSM : Through-Open-Short-MatchUSRP : Universal Software Radio PeripheralVNA : Vector Network AnalyzerVI : Virtual InstrumentVSA : Vector Signal analyzerVSG : Vector signal Generator
Chapter 2
Vector Measurements for Wireless
Networks Devices
2.1 Overview
Digital components become cheaper, faster, and its flexibility has been enhanced aclear example of this trend is found in latest generations of programmed platformsas Field Programmable Field Arrays (FPGAs), which offer large computationalpower. The availability of such components is finding a place where only analogelectronics were thought possible; this trend has enhanced the radio equipmentgaining flexibility and allowing the use of generic hardware [2]. Hence, the abilitiesof the equipment are defined in the software; those called synthetic instruments[3, 4, 5, 6, 7] or virtual instruments [8], although the term synthetic seems to begaining more followers.
Such combination is indeed the best of two worlds: generic hardware performingbasic operations and digital capabilities allowing complex computations, correctionsand different display formats. However, the implementation of the software inspecialized platforms (as FPGAs) creates new challenges, since this devices areresource limited pushing for a branch of efficient algorithm implementation. Thisfurther trend creates what is defined as Software Defined Measurements (SDM)[9, 5].
2.2 Multisine Signals
Multisine signals became widely used in RF measurements; there are several reasonsfor its success:
• Multisines signals enable a simple mathematical framework where importantfigures of merit can be extracted both analytically and experimentally [10,11, 12, 13, 14].
7
8CHAPTER 2. VECTOR MEASUREMENTS FOR WIRELESS NETWORKS
DEVICES
• The digitization of baseband allows a simpler and quicker manipulation ofthese type of signals [15]. Further, multisine are periodic excitations hence itsmeasurement can be performed avoiding leakage and other artifacts [16]; atthe same time its PSD (power spectral density) is confined at discrete spotsin the frequency plane enabling a high SNR (signal to noise ratio) in themeasurement ensuring high measurement accuracy.
• Multisine signals can emulate a realistic excitations of the devices operatingthe wireless network [17]. They can mimic PSD [18] as well as higher orderspectra [19, 20]. Hence, the nonlinear behavior obtained from such excitationis meaningful and may produce relevant figures of merit.
• Multisines are the choice for calibration in modern measurement systems asLarge Signal Network Analyzers (LSNA) [1], Nonlinear Vector Network An-alyzers (NVNA).
• Some effects in measurement system are well described in frequency, for ins-tance, group and phase delay. Thus, the estimation of such parameters frommultisines signals are robust since several frequency points are measured si-multaneously.
2.3 Software Defined Measurements in Radio
Despite of the development of digital components, that follow approximately Moores’law [21], the synthetic instrumentation has not followed in the same proportion.This effect is due to the slower development of components to serve as interfacebetween RF and baseband [7], since they are key to enable SDM at RF.
Thus, The SDM path to RF can be tracked to the availability of cheap hardwarecomponents and integrated circuits which task is to transform the RF signals tolow pass domain where digitization occur, and to the DSP algorithms developed toprocess, analyze, and display RF behavior. For instance, [4, 22, 23] distinguishesthe physical layer as RF part, and leaves the baseband in digital stages which canbe programmed. This trend can be evidenced in the so called Universal SoftwareRadio Peripheral (USRP).
Another possibility is the direct use of DSO at the RF wave [24], this solutionruns quickly into problems since Nyquist limit will require faster ADCs than today’savailable in the market or which price become out of the budget for such instrument.
A great advantage of digital baseband is that digital processing algorithms canbe applied to improve the system performance. Such improvements may tacklehardware impairments as IQ imbalance, transmitter nonlinearities, crosstalk, andothers. A digital processing used with this purpose aligns with the so called “dirtyradio” [25]. Many examples of this can be already found in the literature [26,27]. The requirements for the design of instruments in the framework of SDMare analyzed and discussed [28]. Main points are the hardware generality andindependence.
2.4. LINEAR AND NONLINEAR MEASUREMENTS 9
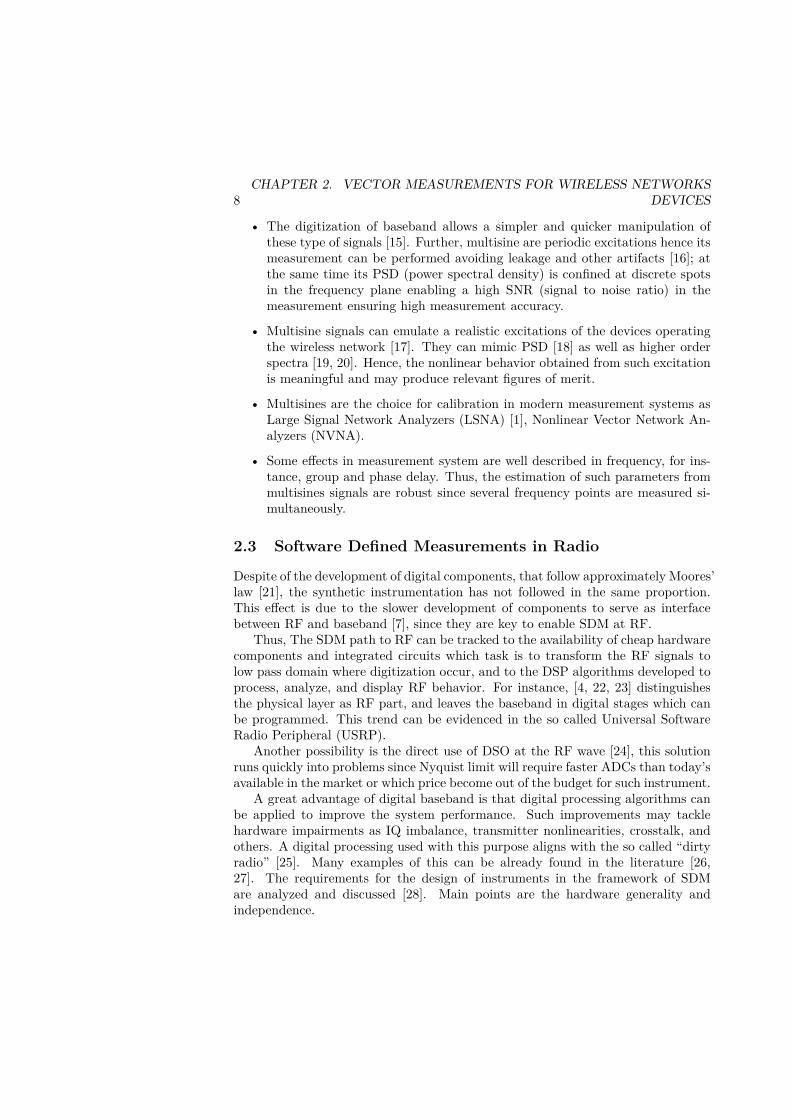
A synthetic instrument is depicted in Fig. 2.1. Three basic layers are dis-tinguished: the physical layer, where the measurement occurs, the interface thatcontrols the hardware, and the software layer that is basically a collection of DSPalgorithms that are in charge of the processing, and presentation of the results.
Figure 2.1: Layers of a synthetic instrument, hardware, interface and software.
2.4 Linear and nonlinear measurements
Linear behavior is referred to the behavior of devices satisfying additivity, in otherwords, a device with transfer function H { } holding:
H {x + y} = H {x} + H {y} . (2.1)
Thus, nonlinear behavior is exhibit by devices violating eq. (2.1). This property al-lows to measure independently different spectral components of the linear response,as presented in Paper A and Paper C.
In contrast to linear operation, the nonlinear behavior is characterized by thecreation of new spectral components. The class of nonlinear systems, studied in
10CHAPTER 2. VECTOR MEASUREMENTS FOR WIRELESS NETWORKS
DEVICES
this thesis, hold the property:
Property: A periodic excitation signal applied to a device exhibiting nonlinearbehavior produces an output signal that has the same period as the excitation.
This property implies that the nonlinear behavior creates only new frequencycomponents harmonically related, sub-harmonics can not be present in this type ofsystems. In principle, this property indicates that the time for the measurement ofnonlinear behavior is not increased compared with linear measurement; since theperiod for the response remains the same either in linear or nonlinear behavior.However, the bandwidth becomes the limitation. Paper D contributes tacklingthe bandwidth problem, introducing the use of a known user-defined signal (called“pilot signal”). Such approach is similar to the phase calibration in NVNAs [1].
Today’s industrial nonlinear vector measurements use a reference signal for cal-ibration [1] (called phase reference), which is calibrated by electro-optical system[29]. However, a nonlinear vector measurement is possible without the use of aphase calibrated reference, this has motivated some work [30]. But, this approachrequires a calibrated (by nose to nose) digital sampling oscilloscope (DSO) togetherwith coherent sources. Hence, the use of this setup becomes complex.
2.5 Continuous Wave and Modulation
The common excitation types to extract the response of a device are the Continuouswave (CW) and the modulated wave. In the case of linear systems, its intrinsicproperty (additivity) allows to use any of them without distinction. In contrast,finding the nonlinear response requires the use of a realistic signal, which is amodulated excitation.
However, the choice of excitation leads to a different measurement setup type,for instance, the receiver is narrowband for CW but not for modulated waveforms.This causes the dynamic range to be different.
The bandwidth of the receiver impacts the performance of the measurements.First, as the thermal noise (known also as Johnson-Nyquist [31, 32]) is directlyproportional to the bandwidth of the measurement; thus, lower amount of noise isencountered in narrowband receivers. Secondly, as the Nyquist sampling conditionis intrinsically related to the measurement bandwidth; thus, narrowband receiversrequire less sampling rate, which yields in general to better ADC performance.Hence, narrowband receivers offer the highest dynamic range. On the other hand,modulated measurements require a larger receiver bandwidth which reduces thedynamic range.
In contrast to CW excitation the modulated wave can excite multiple frequencylines simultaneously. Hence, the speed of the modulated measurement could befaster for dense frequency grids [33]. Further, the dynamic range in an instrumentbased on modulated signals may be enhanced by coherent averaging [34]. These
2.5. CONTINUOUS WAVE AND MODULATION 11
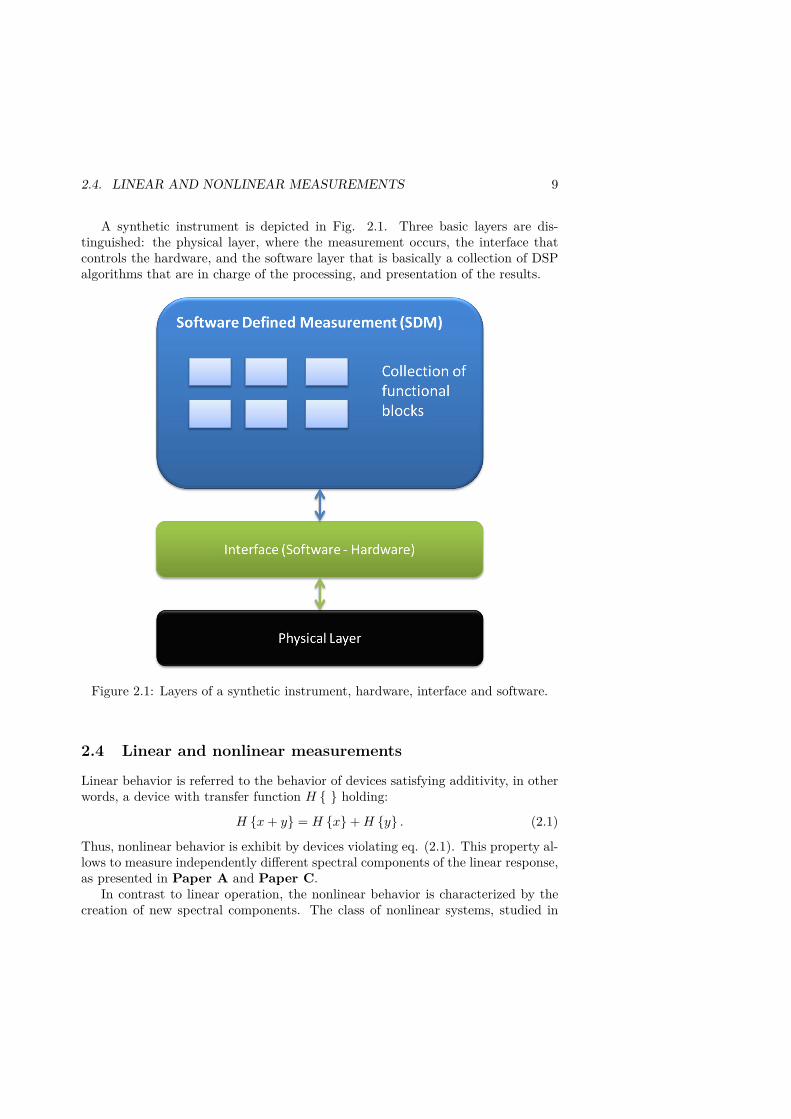
aspects are discussed in Paper C and depicted in Fig. 2.2 where three instrumentsare compared, the nonlinear vector network analyzer (NVNA)with a narrowbandreceiver architecture, the Digital Sampling Oscilloscope (DSO) with the largest re-ceiver bandwidth and the SDM VNA (a synthetic instrument with an intermediatebandwidth).
Figure 2.2: Comparison of three instruments for nonlinear systems with differentarchitectures.

Chapter 3
Synthetic Vector Network Analysis
This chapter presents a vector network analyzer implemented in the frameworkas a software defined measurements(SDM), called in the following SDM VNA, asdescribed in papers A, B and C. The setup is formed by instruments alreadyfound in current test and workstations, where the ability to correctly representvector quantities is performed in software in a PC.
We explore the hardware aspects of the design of such instrument, highlightingthe compromises acquired for the use of generic or specific hardware. We des-cribe the digital post-processing processes required to gain the vector measurementability, relating them to the hardware design. Finally, we compare this syntheticinstrument to a modern industrial VNA available in the market and describe someof this additional features gained by the synthetic design.
3.1 Setup
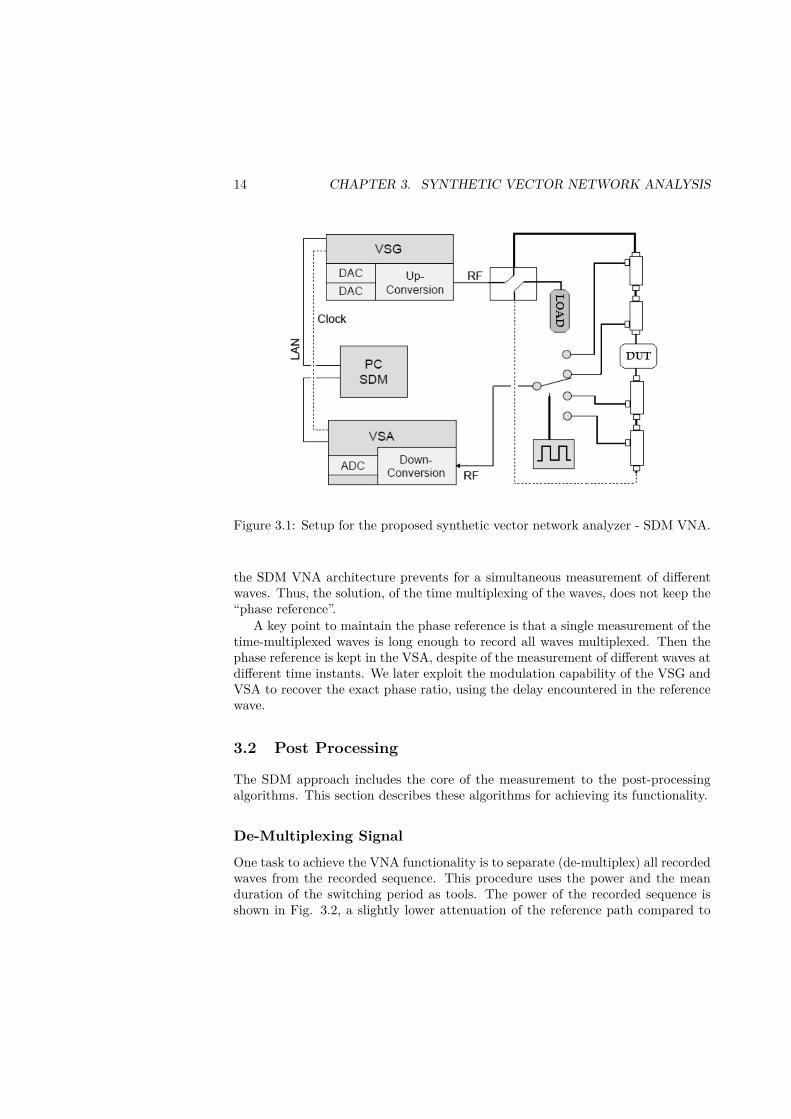
The proposed setup is formed by two RF instruments, currently found in test andworkstations, a vector signal generator (VSG) and a vector signal analyzer (VSA),as depicted in Fig 3.1. A test set is built using directional couplers to separate thewaves in different directions; a solid state RF switch multiplexes this four signalsenabling a single receiver to perform the measurement.
Working principle
A VNA is capable of finding the complex ratio of two waves, such ratio includes am-plitude and phase. The amplitude ratio indicates the attenuation / gain suffered bythe waves, where the phase ratio indicates the time delay between them. A correctamplitude ratio may be found using any instrument with accurate power reading.However, the calculation of the phase ratio needs a simultaneous measurement ofboth waves, as done in current VNA architectures, a simultaneous measurement ofdifferent waves preserves what is referred as “phase reference”. A single receiver in
13
14 CHAPTER 3. SYNTHETIC VECTOR NETWORK ANALYSIS
Figure 3.1: Setup for the proposed synthetic vector network analyzer - SDM VNA.
the SDM VNA architecture prevents for a simultaneous measurement of differentwaves. Thus, the solution, of the time multiplexing of the waves, does not keep the“phase reference”.
A key point to maintain the phase reference is that a single measurement of thetime-multiplexed waves is long enough to record all waves multiplexed. Then thephase reference is kept in the VSA, despite of the measurement of different waves atdifferent time instants. We later exploit the modulation capability of the VSG andVSA to recover the exact phase ratio, using the delay encountered in the referencewave.
3.2 Post Processing
The SDM approach includes the core of the measurement to the post-processingalgorithms. This section describes these algorithms for achieving its functionality.
De-Multiplexing Signal
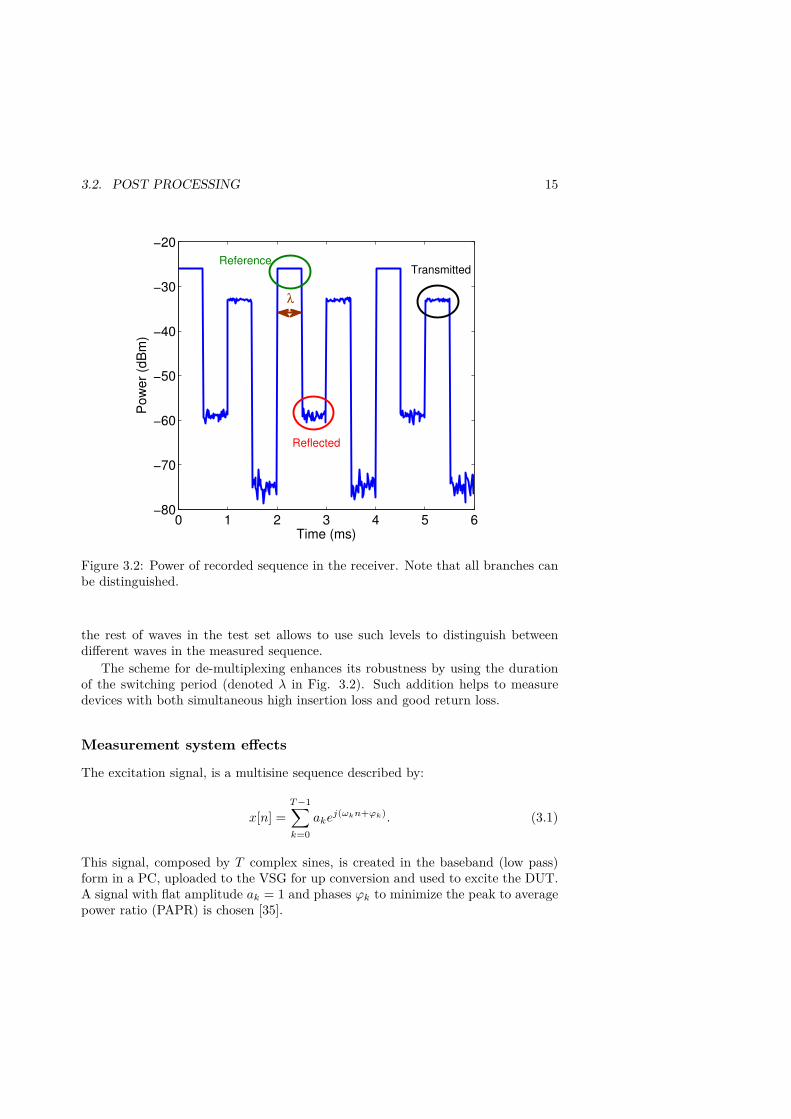
One task to achieve the VNA functionality is to separate (de-multiplex) all recordedwaves from the recorded sequence. This procedure uses the power and the meanduration of the switching period as tools. The power of the recorded sequence isshown in Fig. 3.2, a slightly lower attenuation of the reference path compared to
3.2. POST PROCESSING 15
0 1 2 3 4 5 6−80
−70
−60
−50
−40
−30
−20
Time (ms)
Pow
er
(dB
m)
Reference
Reflected
Transmitted
λ
Figure 3.2: Power of recorded sequence in the receiver. Note that all branches canbe distinguished.
the rest of waves in the test set allows to use such levels to distinguish betweendifferent waves in the measured sequence.
The scheme for de-multiplexing enhances its robustness by using the durationof the switching period (denoted λ in Fig. 3.2). Such addition helps to measuredevices with both simultaneous high insertion loss and good return loss.
Measurement system effects
The excitation signal, is a multisine sequence described by:
x[n] =T −1∑
k=0
akej(ωkn+ϕk). (3.1)
This signal, composed by T complex sines, is created in the baseband (low pass)form in a PC, uploaded to the VSG for up conversion and used to excite the DUT.A signal with flat amplitude ak = 1 and phases ϕk to minimize the peak to averagepower ratio (PAPR) is chosen [35].
16 CHAPTER 3. SYNTHETIC VECTOR NETWORK ANALYSIS
The output z[n] of a linear system H {} excited by x[n], can be written as:
z[n] =
T −1∑
k=0
H{
akej(ωk∆+ϕk+Ψ}
, (3.2)
with a time delay ∆, Ψ as the phase delay introduced by the system. The magnituderesponse of the system |H {ωk} | can be found by least square estimation (LSE) in:
z = Aθ + v, (3.3)
with z as an N-sampled output vector on complex envelope form, θ as the vectorcontaining the magnitudes and phases to be determined, and as v is a vector repre-senting imperfections from the measurement system approximated by a Gaussianprocess.
A =
1 1 . . . 1e−jω0 e−jω1 . . . e−jωT −1
......
. . ....
e−jω0(N−1) e−jω1(N−1) . . . e−jωT −1(N−1)
. (3.4)
The solution to this equation is given by:
θ̂ = (AHA)−1AHz, (3.5)
with H as the hermitian operator.The phase of this measurement ∠θk is:
∠θk = ωk∆ + ϕk + ∠(H(ωk)) + Ψ. (3.6)
Under linear assumption and zero phase of the measurement system (∠θk = 0),the pseudo delay can be computed as:
∆ =(∠θk − ∠θk+1) − (ϕk − ϕk+1)
ωk − ωk+1. (3.7)
Note that, the pseudo delay is the required delay to time align the multisine withits low pass excitation x[n]. Thus, k in equation (3.7) can be chosen in the middlepart of the band, where lower distortion from filters (generator or receiver) areexpected.
Then, any phase in the measured signal can be compensated, time aligning itas:
∠θck = ∠θk − ϕk − ωk∆. (3.8)
Both, the amplitude response from (3.5) and the pseudo delay from (3.7) areestimated using the measured wave corresponding to the excitation branch of thetest set. However, both terms are used to compensate all the recorded waves.
3.3. RESULTS 17
Calibration
Calibration refers to the correction of the systematic deviations encountered inthe measurement system. The calibration process uses the multisine excitationto take advantage and compute the frequency response measurement at all theexcited tones, this is similar to [33, 36] with emphasis in time savings by thisapproach. Calibration is applied to the SDM VNA in order to obtain high accuratemeasurement, thus, the measurement procedure will indicate the DUT behavior atreference planes.
A 12 term error model have been used to perform the calibrations, such modelinclude the following defects: imperfect source matching, lossy transmission andreflection tracking, limited isolation and directivity. Where the standards selectedwere: Through Open Short Match (TOSM). However any other type of calibrationmodel and or standards is possible.
3.3 Results
The measured S parameters provided by the SDM VNA are presented below, thevalidation of the measurements is using a high-performance industrial VNA R&SZVA-8.
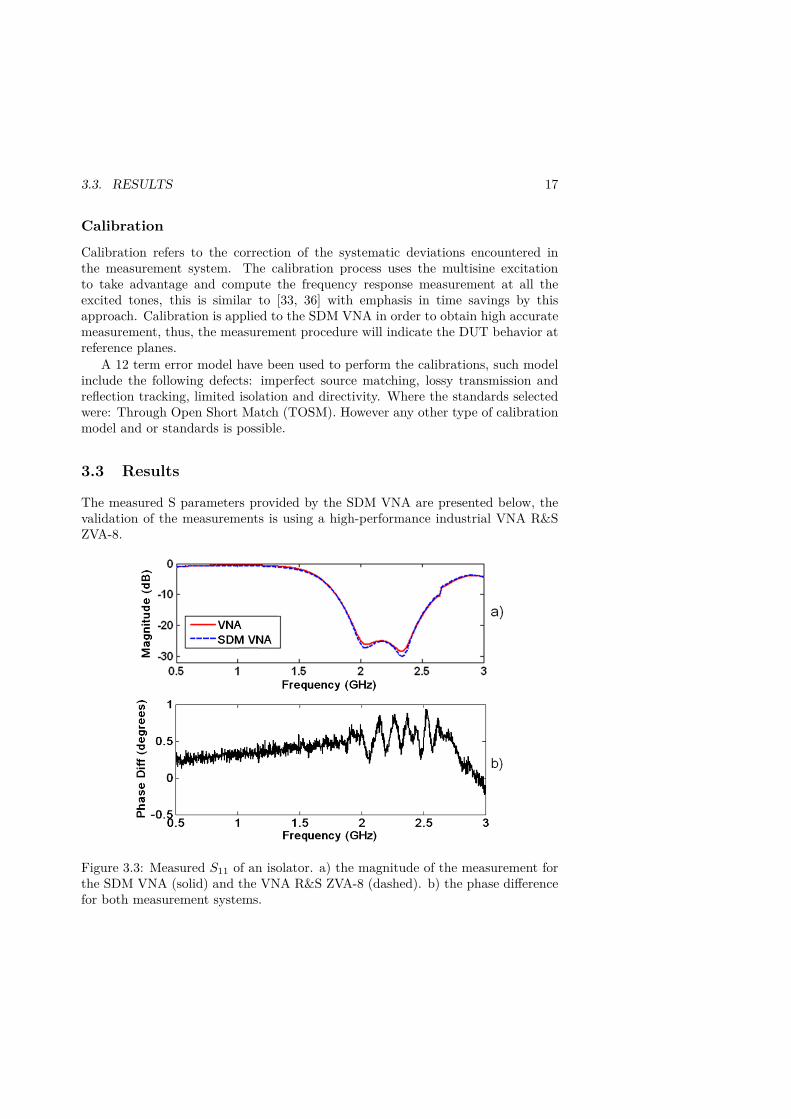
Figure 3.3: Measured S11 of an isolator. a) the magnitude of the measurement forthe SDM VNA (solid) and the VNA R&S ZVA-8 (dashed). b) the phase differencefor both measurement systems.
18 CHAPTER 3. SYNTHETIC VECTOR NETWORK ANALYSIS
Fig. 3.3a) shows the measured magnitude S11 for an isolator, in solid line ispresented the VNA R&S ZVA-8, while in dashed lined the SDM VNA. Fig. 3.3b)plots the phase difference of these two instruments.
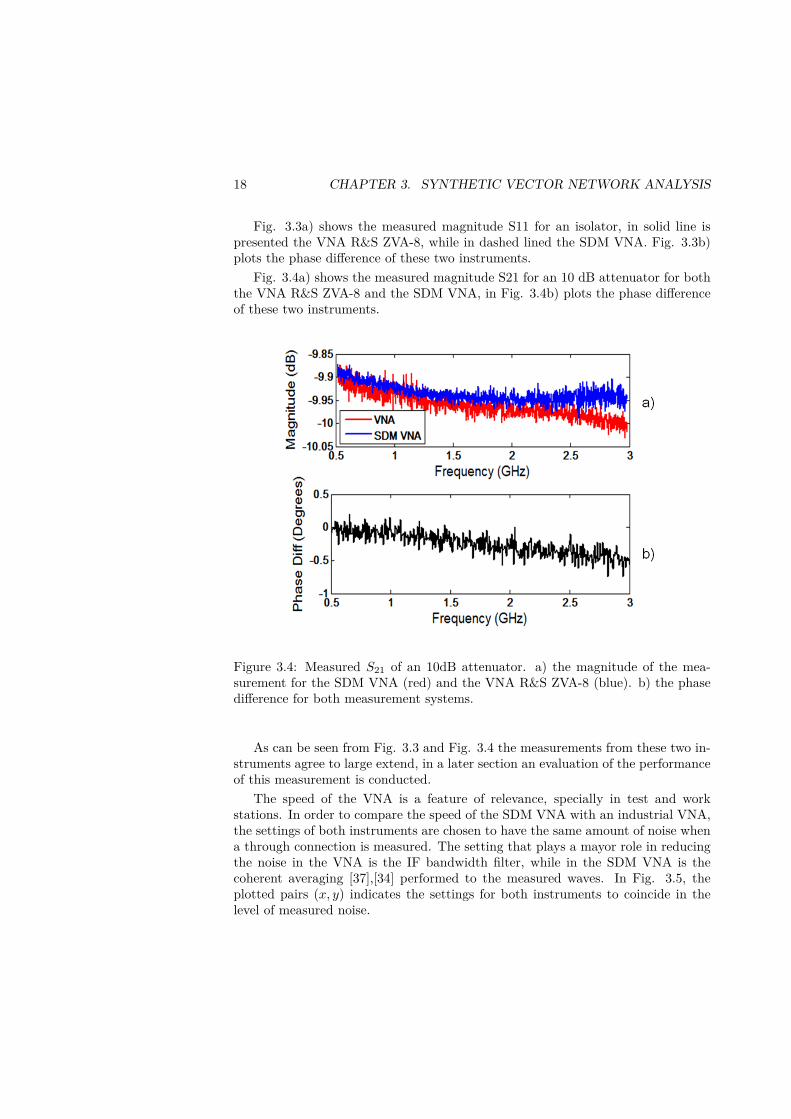
Fig. 3.4a) shows the measured magnitude S21 for an 10 dB attenuator for boththe VNA R&S ZVA-8 and the SDM VNA, in Fig. 3.4b) plots the phase differenceof these two instruments.
Figure 3.4: Measured S21 of an 10dB attenuator. a) the magnitude of the mea-surement for the SDM VNA (red) and the VNA R&S ZVA-8 (blue). b) the phasedifference for both measurement systems.
As can be seen from Fig. 3.3 and Fig. 3.4 the measurements from these two in-struments agree to large extend, in a later section an evaluation of the performanceof this measurement is conducted.
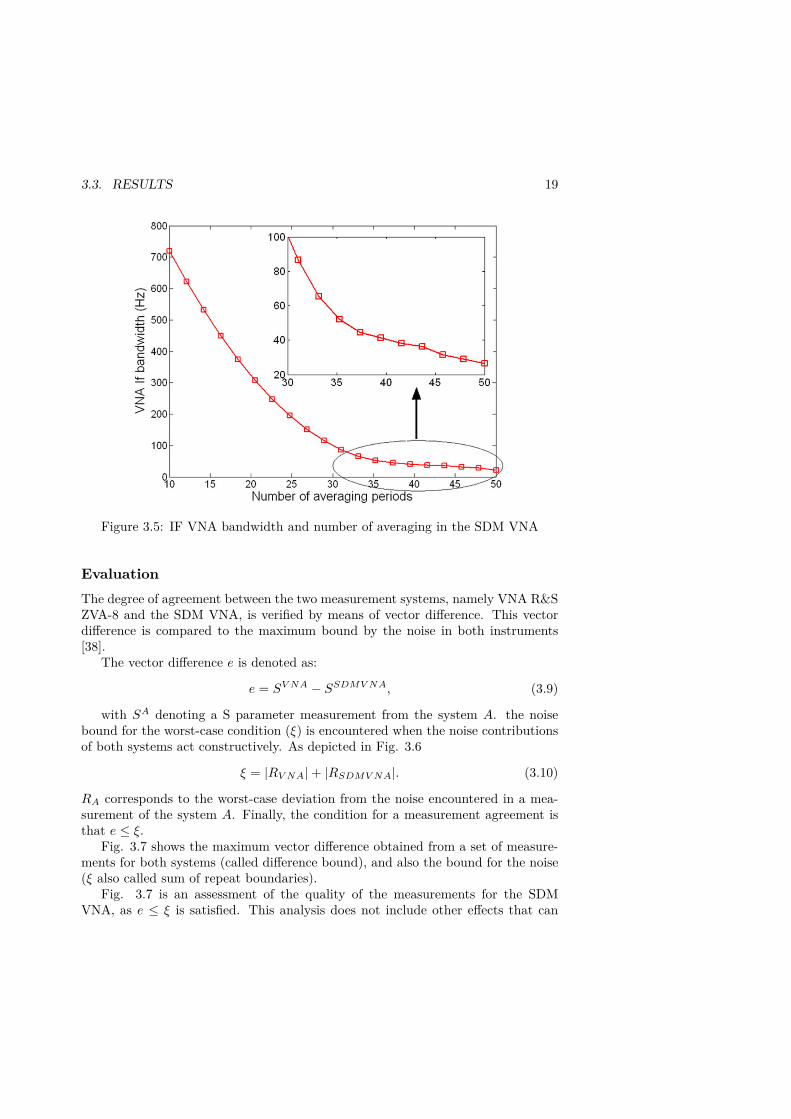
The speed of the VNA is a feature of relevance, specially in test and workstations. In order to compare the speed of the SDM VNA with an industrial VNA,the settings of both instruments are chosen to have the same amount of noise whena through connection is measured. The setting that plays a mayor role in reducingthe noise in the VNA is the IF bandwidth filter, while in the SDM VNA is thecoherent averaging [37],[34] performed to the measured waves. In Fig. 3.5, theplotted pairs (x, y) indicates the settings for both instruments to coincide in thelevel of measured noise.
3.3. RESULTS 19
Figure 3.5: IF VNA bandwidth and number of averaging in the SDM VNA
Evaluation
The degree of agreement between the two measurement systems, namely VNA R&SZVA-8 and the SDM VNA, is verified by means of vector difference. This vectordifference is compared to the maximum bound by the noise in both instruments[38].
The vector difference e is denoted as:
e = SV NA − SSDMV NA, (3.9)
with SA denoting a S parameter measurement from the system A. the noisebound for the worst-case condition (ξ) is encountered when the noise contributionsof both systems act constructively. As depicted in Fig. 3.6
ξ = |RV NA| + |RSDMV NA|. (3.10)
RA corresponds to the worst-case deviation from the noise encountered in a mea-surement of the system A. Finally, the condition for a measurement agreement isthat e ≤ ξ.
Fig. 3.7 shows the maximum vector difference obtained from a set of measure-ments for both systems (called difference bound), and also the bound for the noise(ξ also called sum of repeat boundaries).
Fig. 3.7 is an assessment of the quality of the measurements for the SDMVNA, as e ≤ ξ is satisfied. This analysis does not include other effects that can
20 CHAPTER 3. SYNTHETIC VECTOR NETWORK ANALYSIS
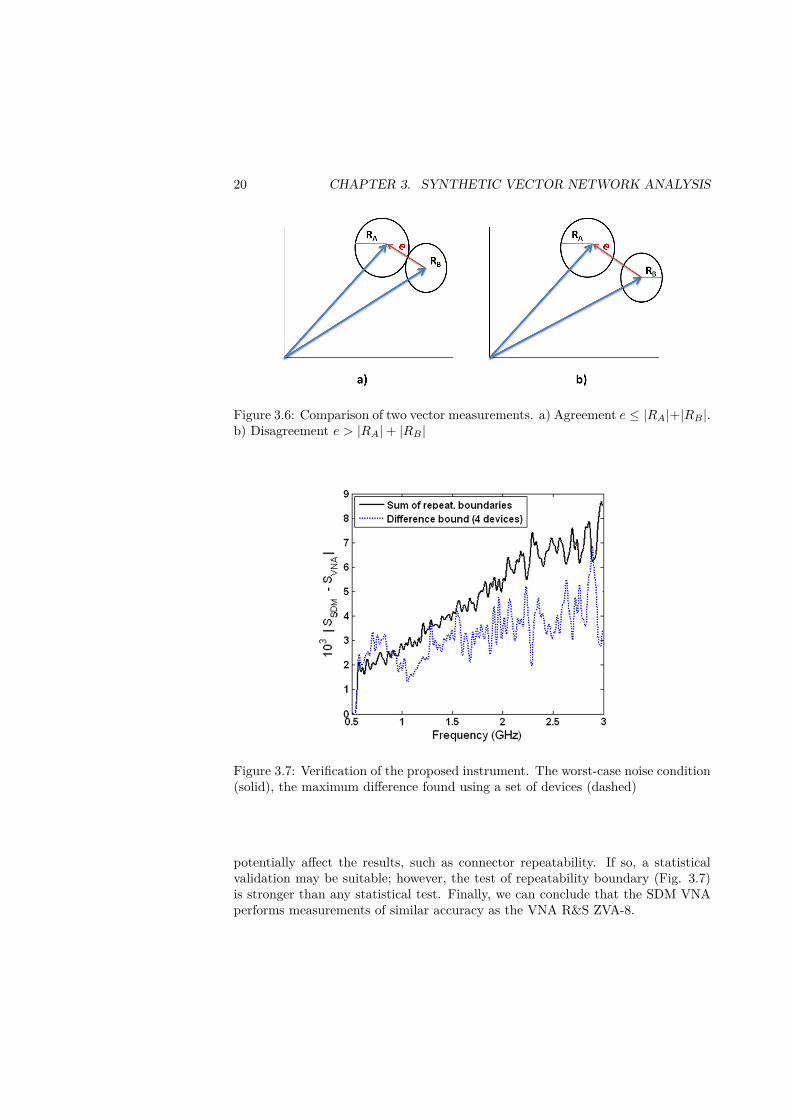
Figure 3.6: Comparison of two vector measurements. a) Agreement e ≤ |RA|+|RB |.b) Disagreement e > |RA| + |RB |
Figure 3.7: Verification of the proposed instrument. The worst-case noise condition(solid), the maximum difference found using a set of devices (dashed)
potentially affect the results, such as connector repeatability. If so, a statisticalvalidation may be suitable; however, the test of repeatability boundary (Fig. 3.7)is stronger than any statistical test. Finally, we can conclude that the SDM VNAperforms measurements of similar accuracy as the VNA R&S ZVA-8.
3.3. RESULTS 21
Nonlinear Abilities
A calibration modification is required to compensate for both amplitude and phaseabsolute calibration. The power absolute calibration is obtained by using a powersensor in the band of interest. The absolute phase calibration is not performed forthis setup. However, for all in-band measured tones the phases preserve the correctrelationships. The phases of the measured signal are compared to the user-definedphases of the excitation signal to estimate a delay (called for that reason pseudodelay). This is equivalent then to use the excitation signal as a reference for timealigning the measured waves.
It can be argued that an absolute phase calibration is not required as long asall the relative phases of all frequency components remain unchanged. An absolutecalibration refers to the ability of indicating the phases at certain time instant.Usually, such instant is the zero crossing of the fundamental harmonic (zero phaseof the fundamental). Despite of the use of this time instant is widely extended,there is no problem to use any other time as long as the phase relationships to allharmonics are preserved, some discussions on this topic is presented in Paper D.
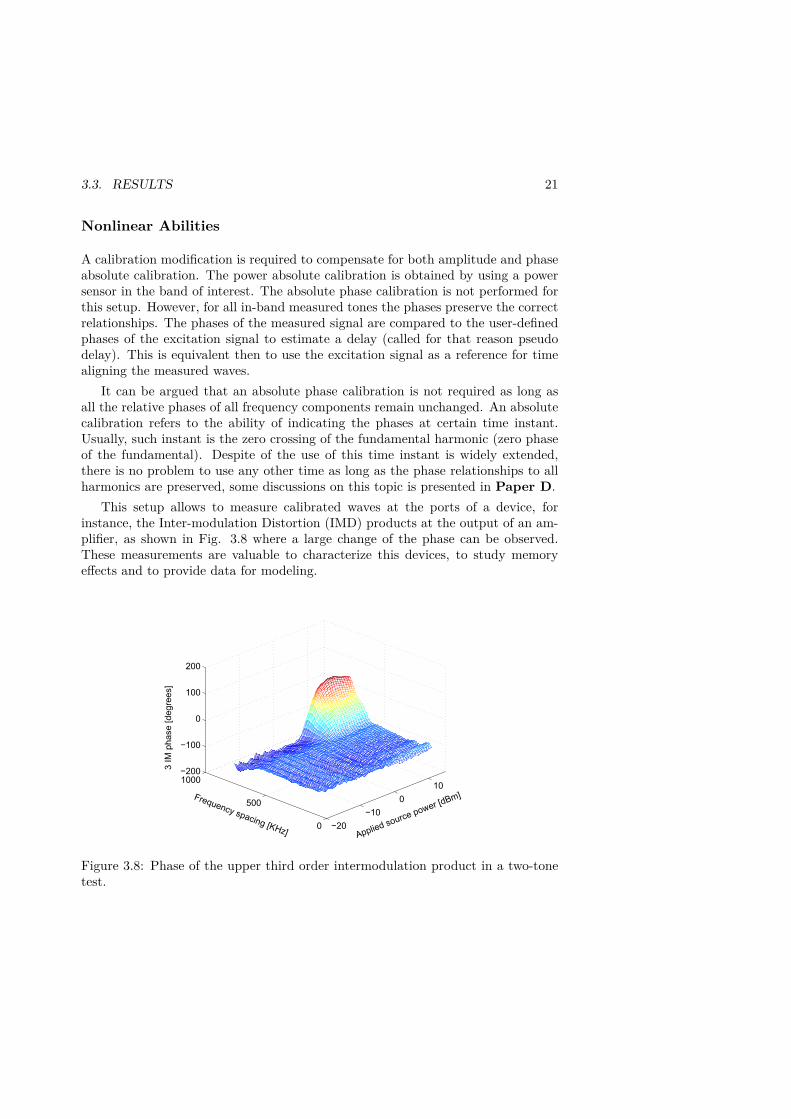
This setup allows to measure calibrated waves at the ports of a device, forinstance, the Inter-modulation Distortion (IMD) products at the output of an am-plifier, as shown in Fig. 3.8 where a large change of the phase can be observed.These measurements are valuable to characterize this devices, to study memoryeffects and to provide data for modeling.
Figure 3.8: Phase of the upper third order intermodulation product in a two-tonetest.
22 CHAPTER 3. SYNTHETIC VECTOR NETWORK ANALYSIS
3.4 Bandwidth extension
Multisines presents advantages for the estimation of system effects as time delayand phase delay. Thus, the time delay estimation is made with reference to the“user defined” multisine [39]. Hence, multisines are used as reference signals innonlinear instrument systems. Vector receivers as the SDM VNA, trade-off dynamicrange for measurement bandwidth, as indicated in Chapter 2. Several efforts havebeen made to extend the bandwidth of a receiver that offer higher dynamic range,for instance, adding extra signals to determine the phases of the nonlinear terms[40, 41, 42]. However, such approaches where specifically tailored to two or threetone signals and have limited applicability. The idea presented in Paper D explorethe bandwidth extension.
Approach
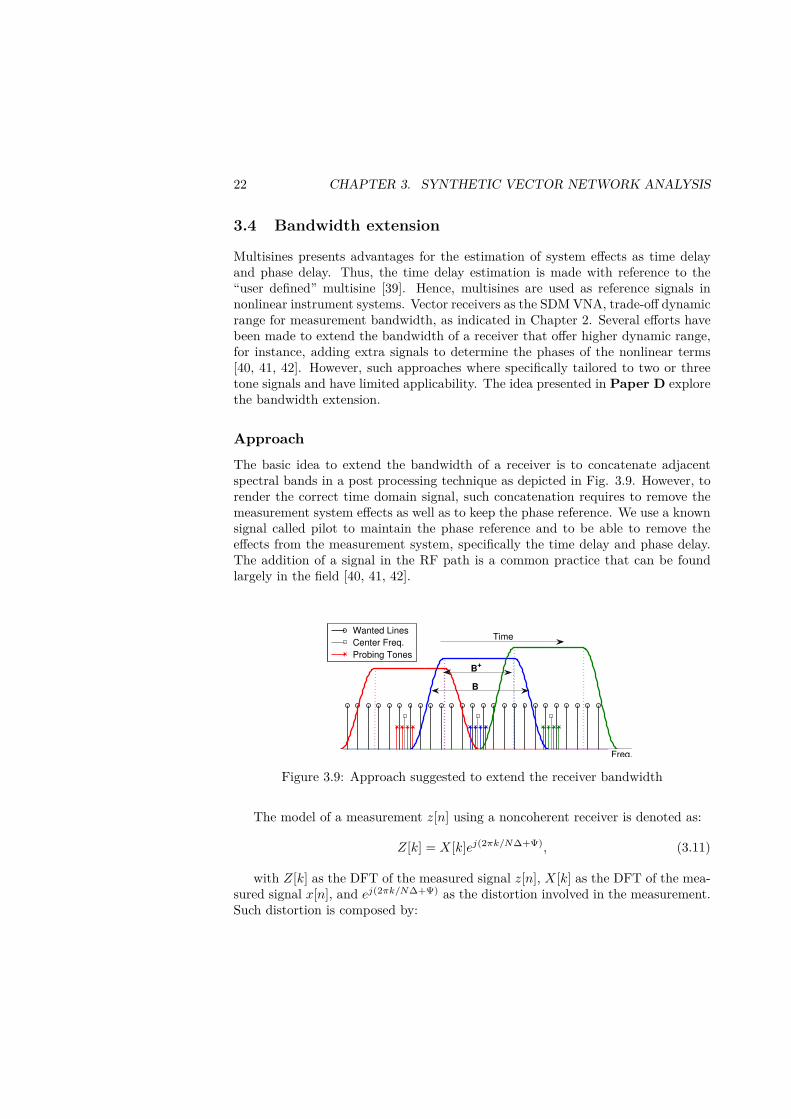
The basic idea to extend the bandwidth of a receiver is to concatenate adjacentspectral bands in a post processing technique as depicted in Fig. 3.9. However, torender the correct time domain signal, such concatenation requires to remove themeasurement system effects as well as to keep the phase reference. We use a knownsignal called pilot to maintain the phase reference and to be able to remove theeffects from the measurement system, specifically the time delay and phase delay.The addition of a signal in the RF path is a common practice that can be foundlargely in the field [40, 41, 42].
Wanted Lines
Center Freq.
Probing Tones
Freq.
Time
B+
B
Figure 3.9: Approach suggested to extend the receiver bandwidth
The model of a measurement z[n] using a noncoherent receiver is denoted as:
Z[k] = X[k]ej(2πk/N∆+Ψ), (3.11)
with Z[k] as the DFT of the measured signal z[n], X[k] as the DFT of the mea-sured signal x[n], and ej(2πk/N∆+Ψ) as the distortion involved in the measurement.Such distortion is composed by:
3.4. BANDWIDTH EXTENSION 23
• Time delay: Introduced because the signal has been measured with a differentreference point (n = 0) with respect to the signal generation. This effect isdescribed as the rotation of X[k] i.e. X[k]ej2πk/N∆. The quantity ∆ ∈ R
denotes the time delay, which is in general a non-integer.
• Phase delay: The carrier phase difference Ψ (between modulator and de-modulator), affects the measured signal as X[k]ejΨ.
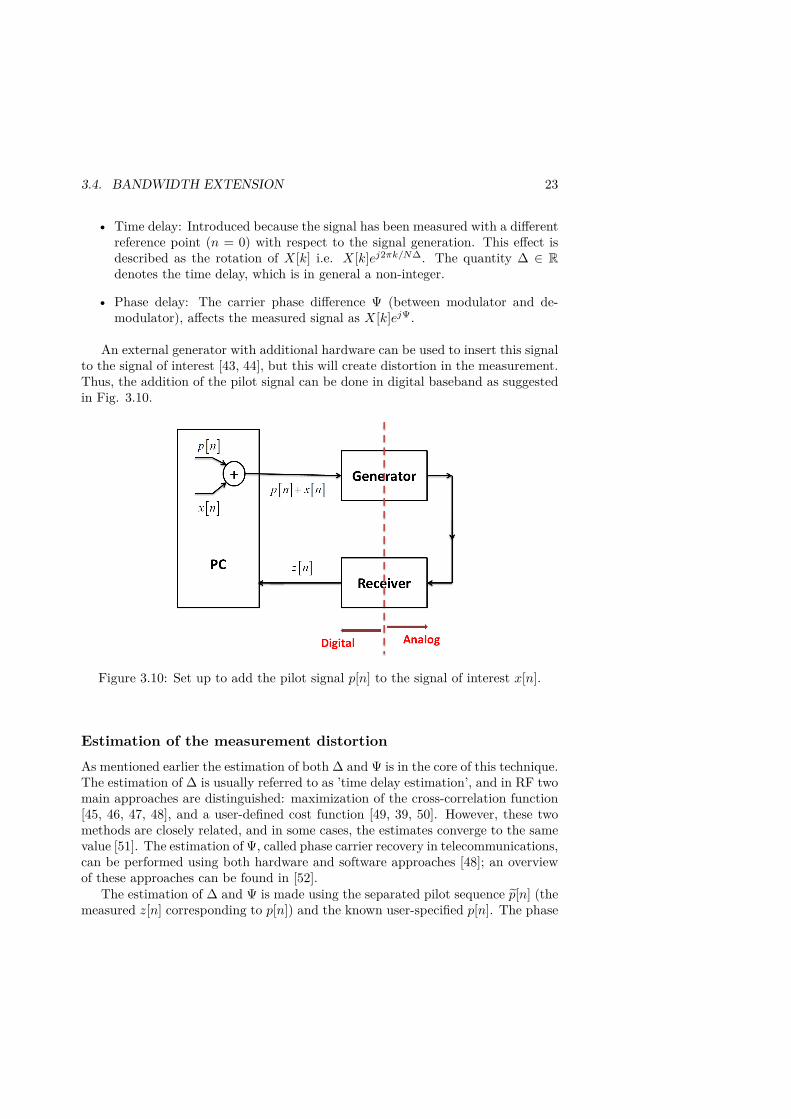
An external generator with additional hardware can be used to insert this signalto the signal of interest [43, 44], but this will create distortion in the measurement.Thus, the addition of the pilot signal can be done in digital baseband as suggestedin Fig. 3.10.
Figure 3.10: Set up to add the pilot signal p[n] to the signal of interest x[n].
Estimation of the measurement distortion
As mentioned earlier the estimation of both ∆ and Ψ is in the core of this technique.The estimation of ∆ is usually referred to as ’time delay estimation’, and in RF twomain approaches are distinguished: maximization of the cross-correlation function[45, 46, 47, 48], and a user-defined cost function [49, 39, 50]. However, these twomethods are closely related, and in some cases, the estimates converge to the samevalue [51]. The estimation of Ψ, called phase carrier recovery in telecommunications,can be performed using both hardware and software approaches [48]; an overviewof these approaches can be found in [52].
The estimation of ∆ and Ψ is made using the separated pilot sequence p̃[n] (themeasured z[n] corresponding to p[n]) and the known user-specified p[n]. The phase
24 CHAPTER 3. SYNTHETIC VECTOR NETWORK ANALYSIS
difference between the measured p̃[n] and the known sequence can be expressedusing the DFT as:
G[k] = ∠P̃ [k] − ∠P [k]. (3.12)
Note,G[k] = 2πk∆ + Ψ + Im(V [k]/Z[k]) (3.13)
with V [k] the noise sequence, and Im represent the imaginary part of the com-plex argument. Such result is in agreement with the Tretter’s approximation [53].With E[k] = Im(V [k]/Z[k]) as the noise contribution for the phase term. WhenE[k] is normally distributed with zero mean ∼ N (0, σ2), (3.13) can be solved opti-mally by Linear Least Square Estimation (LSE) on:
ω0 1ω1 1...
...ωT −1 1
[∆Ψ
]=
G[k0]G[k1]
...G[kT −1]
(3.14)
with kt as the frequency bin corresponding to ωt the angular frequency of thetth tone. T is the number of pilot tones around a center frequency. Thus, there arestandard tools for this estimation that are robust and reliable. However, in practice,this estimator will lack robustness, since for large ∆ the phase it is not linearbut saw-tooth shaped due to phase wrapping. Hence, the estimation is enhancedby an initial sampled-based synchronization using cross correlation maximization[54, 45, 46, 55, 56].
Verification
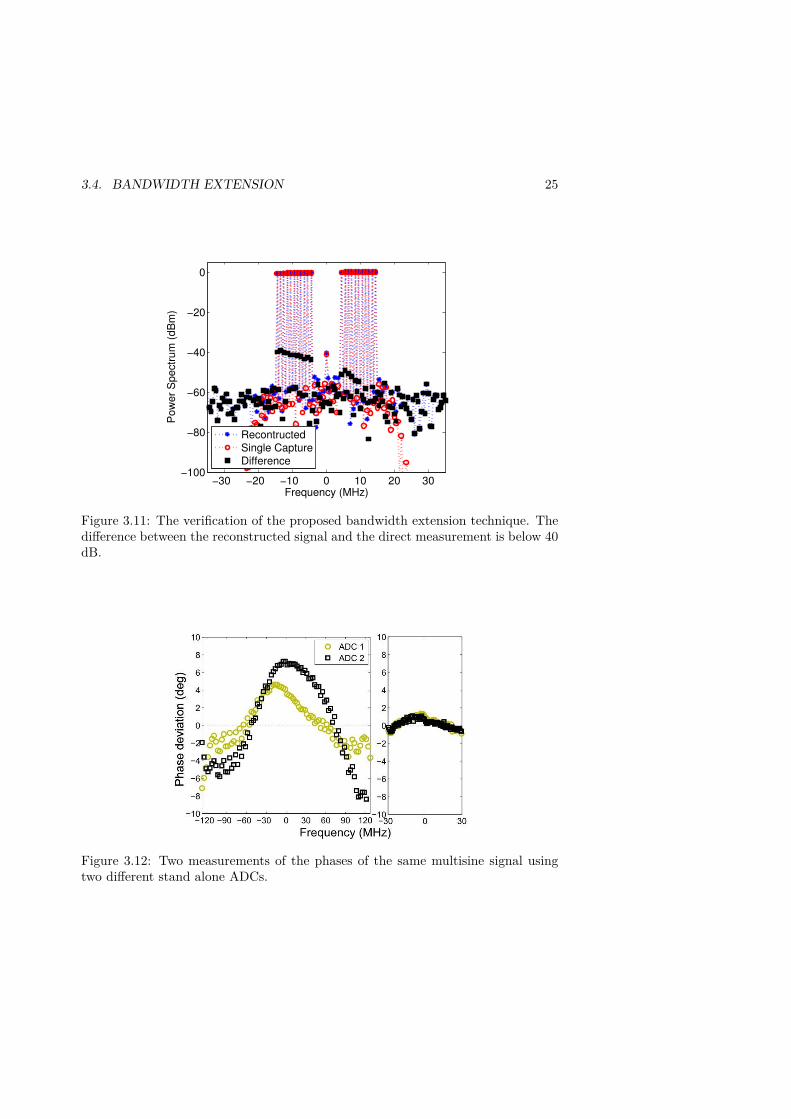
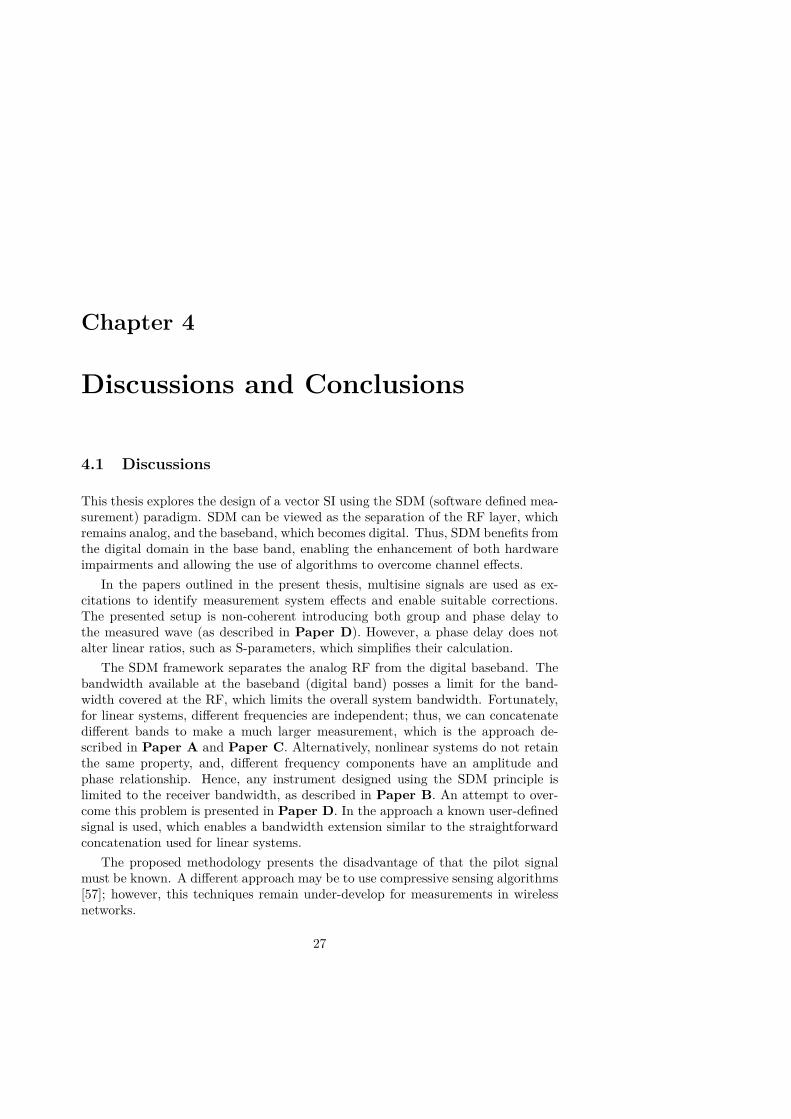
The verification is made using a reference measurement with a bandwidth coveringthe whole signal of interest. First, a total band of 48 MHz will be measured byconcatenating 6 adjacent spectral bands (B+=8 MHz), such result is comparedwith a single measurement with the same receiver but with a bandwidth of 48MHz (referred as reference measurement). Fig. 3.11 shows the power spectrum ofthe measured signals and the power spectrum of the difference. As can be seen,such differences are below 40 dB. Notice that the same level of differences can beencountered when the same signal is measured by two different instruments (twostand alone ADCs) as depicted for the measured phase in Fig. 3.12.
3.4. BANDWIDTH EXTENSION 25
−30 −20 −10 0 10 20 30−100
−80
−60
−40
−20
0
Frequency (MHz)
Po
we
r S
pe
ctr
um
(d
Bm
)
Recontructed
Single Capture
Difference
Figure 3.11: The verification of the proposed bandwidth extension technique. Thedifference between the reconstructed signal and the direct measurement is below 40dB.
Figure 3.12: Two measurements of the phases of the same multisine signal usingtwo different stand alone ADCs.

Chapter 4
Discussions and Conclusions
4.1 Discussions
This thesis explores the design of a vector SI using the SDM (software defined mea-surement) paradigm. SDM can be viewed as the separation of the RF layer, whichremains analog, and the baseband, which becomes digital. Thus, SDM benefits fromthe digital domain in the base band, enabling the enhancement of both hardwareimpairments and allowing the use of algorithms to overcome channel effects.
In the papers outlined in the present thesis, multisine signals are used as ex-citations to identify measurement system effects and enable suitable corrections.The presented setup is non-coherent introducing both group and phase delay tothe measured wave (as described in Paper D). However, a phase delay does notalter linear ratios, such as S-parameters, which simplifies their calculation.
The SDM framework separates the analog RF from the digital baseband. Thebandwidth available at the baseband (digital band) posses a limit for the band-width covered at the RF, which limits the overall system bandwidth. Fortunately,for linear systems, different frequencies are independent; thus, we can concatenatedifferent bands to make a much larger measurement, which is the approach de-scribed in Paper A and Paper C. Alternatively, nonlinear systems do not retainthe same property, and, different frequency components have an amplitude andphase relationship. Hence, any instrument designed using the SDM principle islimited to the receiver bandwidth, as described in Paper B. An attempt to over-come this problem is presented in Paper D. In the approach a known user-definedsignal is used, which enables a bandwidth extension similar to the straightforwardconcatenation used for linear systems.
The proposed methodology presents the disadvantage of that the pilot signalmust be known. A different approach may be to use compressive sensing algorithms[57]; however, this techniques remain under-develop for measurements in wirelessnetworks.
27
28 CHAPTER 4. DISCUSSIONS AND CONCLUSIONS
4.2 Conclusions
This thesis presented the design, implementation and post processing algorithmsrequired for a synthetic vector network instrument. The digital signal processingalgorithms required to achieve a vector measurement functionality were emphasized.
Hardware limitations and the use of digital post processing to overcome thehardware impairments were discussed herein. Furthermore, the results were com-pared to those of modern industrial instruments, as the VNA R&S ZVA-8 showinggood agreement with the proposed measurement system.
The proposed instrument, called SDM VNA, uses modulated signals to performmeasurements; thus, the receiver bandwidth is larger compared to the CW recei-vers, which reduces the dynamic range further overcome by performing coherentaveraging. A coherent averaging technique predicts an increasing gain for a largernumber of averages; however, hardware imperfections limit this improvement.
The ability to select the pilot signal removes some of the limitations in currentnonlinear phase calibration procedures, and favors measurements with narrow tonespacing (limited by the depth of the receiver memory), which can be needed itto study long term memory effects. In contrast, the use of this pilot signal couldrequire a previous “characterization” measurement, such as performed for currentphase references used in modern instrumentation, this is specially recommended forlarger bandwidths where deviations from the low pass signal are expected.
Bibliography
[1] T. Van den Broeck and J. Verspecht, “Calibrated vectorial nonlinear-networkanalyzers,” in IEEE MTT-S Int. Microwave Symp. Dig., San Diego, USA.1994, pp. 1069 –1072 vol.2.
[2] M. Bertocco, S. Cappellazzo, A. Carullo, M. Parvis, and A. Vallan, “Virtualenvironment for fast development of distributed measurement applications,”IEEE Trans. Instrum. Meas., vol. 52, no. 3, pp. 681–685, Jun. 2003.
[3] J. Murrill, “Rf synthetic instrumentation used to support EW test capability,”in IEEE Autotestcon, Sep. 2008, pp. 144 –147.
[4] P. Cruz, N. Carvalho, K. Remley, and K. Gard, “Mixed analog-digital instru-mentation for software-defined-radio characterization,” in IEEE MTT-S Int.Microwave Symp. Dig., Jun. 2008, pp. 253–256.
[5] M. Granieri and R. Lowdermilk, “Synthetic instrumentation: The road ahead,”in IEEE Autotestcon, Sep. 2009, pp. 359 –364.
[6] J. Fleagle, “Tradeoffs in synthetic instrument design and application,” in IEEEAutotestcon, Sep. 2005, pp. 166–170.
[7] J. Stratton, “Can you make one size fit all? [synthetic instrument],” in IEEEAutotestcon, sept. 2005, pp. 162 – 165.
[8] L. Cristaldi, A. Ferrero, and V. Piuri, “Programmable instruments, virtual in-struments, and distributed measurement systems: what is really useful, innova-tive and technically sound?” IEEE Instrumentation Measurement Magazine,,vol. 2, no. 3, pp. 20–27, Sep. 1999.
[9] G. Kolumban, T. Krebesz, and F. Lau, “Theory and application of softwaredefined electronics: Design concepts for the next generation of telecommuni-cations and measurement systems,” IEEE Circuits and Systems Magazine,,vol. 12, no. 2, pp. 8–34, 2ndquarter 2012.
[10] K. Vanhoenacker, T. Dobrowiecki, and J. Schoukens, “Design of multisine ex-citations to characterize the nonlinear distortions during FRF-measurements,”IEEE Trans. Instrum. Meas., vol. 50, no. 5, pp. 1097 –1102, oct 2001.
29
30 BIBLIOGRAPHY
[11] N. Carvalho, K. Remley, D. Schreurs, and K. Card, “Multisine signals for wire-less system test and design [application notes],” IEEE Microw. Mag., vol. 9,no. 3, pp. 122 –138, Jun. 2008.
[12] C. Evans and D. Rees, “Nonlinear distortions and multisine signals. I: Mea-suring the best linear approximation,” IEEE Trans. Instrum. Meas., vol. 49,no. 3, pp. 602–609, Jun. 2000.
[13] ——, “Nonlinear distortions and multisine signals. II. Minimizing the distor-tion,” IEEE Trans. Instrum. Meas., vol. 49, no. 3, pp. 610–616, Jun. 2000.
[14] K. Gharaibeh, K. Gard, and M. Steer, “In-band distortion of multisines,” IEEETrans. Microw. Theory Tech., vol. 54, no. 8, pp. 3227–3236, Aug. 2006.
[15] C. Brown and K. Feher, “Reconfigurable digital baseband modulation for wire-less computer communication,” in IEEE Conf. Proc. Computers and Commu-nications, Phoenix, Mar. 1995, pp. 610–616.
[16] N. McKinley, K. Remley, M. Myslinski, and J. Kenney, “Eliminating fft ar-tifacts in vector signal analyzer spectra,” Microwave J., vol. 49, no. 10, pp.156–164, Oct. 2006.
[17] D. Schreurs and K. Remley, “Use of multisine signals for efficient behaviouralmodelling of rf circuits with short-memory effects,” in 61st ARFTG Conf. Dig.,Spring, Jun. 2003, pp. 65–72.
[18] M. Myslinski, K. Remley, M. McKinley, D. Schreurs, and B. Nauwelaers, “Ameasurement-based multisine design procedure,” in Int. Workshop on Inte-grated Nonlinear Microwave and Millimeter-Wave Circuits, Jan. 2006, pp. 52–55.
[19] J. Pedro and N. Carvalho, “Designing multisine excitations for nonlinear modeltesting,” IEEE Trans. Microw. Theory Tech., vol. 53, no. 1, pp. 45 – 54, jan.2005.
[20] J. Pedro and N. de Carvalho, “On the use of multitone techniques for assess-ing rf components’ intermodulation distortion,” IEEE Trans. Microw. TheoryTech., vol. 47, no. 12, pp. 2393–2402, Dec. 1999.
[21] G. Moore, “Cramming more components onto integrated circuits,” Proceedingsof the IEEE, vol. 86, no. 1, pp. 82–85, Jan. 1998.
[22] S. Sen, S. Devarakond, and A. Chatterjee, “Phase distortion to amplitudeconversion-based low-cost measurement of am-am and am-pm effects in rfpower amplifiers,” IEEE Trans. Very Large Scale Integr. (VLSI) Syst., vol. 20,no. 9, pp. 1602–1614, Sep. 2012.
BIBLIOGRAPHY 31
[23] Z. Wang, L. Mao, and R. Liu, “High-accuracy amplitude and phase measure-ments for low-level rf systems,” IEEE Trans. Instrum. Meas., vol. 61, no. 4,pp. 912–921, Apr. 2012.
[24] N. Waivio, “High frequency sampling oscilloscopes used for vector networkanalysis: Synthetic vector network analyzer,” in IEEE Autotescon, Sep. 2010,pp. 1–4.
[25] G. Fettweis, M. Lohning, D. Petrovic, M. Windisch, P. Zillmann, and W. Rave,“Dirty rf: a new paradigm,” in Personal, Indoor and Mobile Radio Communi-cations, PIMRC., vol. 4, Sep. 2005, pp. 2347 –2355.
[26] M. Underhill, “Time jitter and phase noise: Now and in the future?” inFrequency Control Symposium (FCS), May 2012, pp. 1–8.
[27] N. Carvalho, J. Pedro, and J. Martins, “A corrected microwave multisine wave-form generator,” IEEE Trans. Microw. Theory Tech., vol. 54, no. 6, pp. 2659–2664, Jun. 2006.
[28] D. Wisell, P. Stenvard, A. Hansebacke, and N. Keskitalo, “Considerationswhen designing and using virtual instruments as building blocks in flexiblemeasurement system solutions,” in IEEE Instrumentation and MeasurementTechnology Conference, IMTC., May. 2007, pp. 1–5.
[29] D. Williams, P. Hale, T. Clement, and J. Morgan, “Calibrating electro-optic sampling systems,” in IEEE MTT-S Int. Microwave Symp. Dig., vol. 3,Phoenix, AZ. 2001, pp. 1527 –1530 vol.3.
[30] J. Hu, K. Gard, and M. Steer, “Calibrated non-linear vector network mea-surement without using a multi-harmonic generator,” IET Trans. Microw.,Antennas, Propag., vol. 5, no. 5, pp. 616–624, Apr. 2011.
[31] J. B. Johnson, “Thermal agitation of electricity in conductors,” Phys. Rev.,vol. 32, pp. 97–109, Jul. 1928.
[32] H. Nyquist, “Thermal agitation of electric charge in conductors,” Phys. Rev.,vol. 32, pp. 110–113, Jul. 1928.
[33] W. Van Moer and Y. Rolain, “A multisine based calibration for broadbandmeasurements,” in IEEE Conf. Instrumentation and Measurement Technology,May. 2007, pp. 1–6.
[34] “Coherent averaging technique: A tutorial review part 1: Noise reduction andthe equivalent filter,” Journal of Biomedical Engineering, vol. 8, no. 1, pp. 24– 29, 1986.
[35] M. Schroeder, “Synthesis of low-peak-factor signals and binary sequences withlow autocorrelation (corresp.),” IEEE Trans. Inf. Theory, vol. 16, no. 1, pp.85 – 89, Jan. 1970.
32 BIBLIOGRAPHY
[36] W. Van Moer and Y. Rolain, “Multisine calibration for large-signal broadbandmeasurements,” IEEE Trans. Instrum. Meas., vol. 57, no. 7, pp. 1478–1483,Jul. 2008.
[37] “IEEE standard for terminology and test methods for analog-to-digital con-verters,” IEEE Std 1241-2010 (Revision of IEEE Std 1241-2000), pp. 1 –139,Jan. 2011.
[38] D. C. DeGroot, R. B. Marks, and J. A. Jargon, “A method for comparingvector network analyzers,” in 50th ARFTG Conf. Dig., Fall, vol. 32, Dec.1997, pp. 107–114.
[39] K. Remley, D. Williams, D.-P. Schreurs, G. Loglio, and A. Cidronali, “Phasedetrending for measured multisine signals,” in 61st ARFTG Conf. Dig.,Philadelphia, PA. 2003, pp. 73–83.
[40] J. Pedro, J. Martins, and P. Cabral, “New method for phase characterizationof nonlinear distortion products,” in IEEE MTT-S Int. Microwave Symp. Dig.,Long Beach, CA. 2005, pp. 972–974.
[41] J. Dunsmore and D. Goldberg, “Novel two-tone intermodulation phase mea-surement for evaluating amplifier memory effects,” in 33rd European Mi-crowave Conference, Munich,, Oct. 2003, pp. 235–238.
[42] J. Vuolevi, T. Rahkonen, and J. Manninen, “Measurement technique for cha-racterizing memory effects in RF power amplifiers,” IEEE Trans. Microw. The-ory Tech., vol. 49, no. 8, pp. 1383 –1389, Aug. 2001.
[43] J. Martens and P. Kapetanic, “Probe-tone s-parameter measurements,” IEEETrans. Microw. Theory Tech., vol. 50, no. 9, pp. 2076 – 2082, Sep. 2002.
[44] W. V. Moer and Y. Rolain, “Measuring the out-of-band best linear approxi-mation,” Measurement Science and Technology, vol. 21, no. 1, p. 015102.
[45] D. Wisell, D. Rönnow, and P. Händel, “A technique to extend the bandwidthof an RF power amplifier test bed,” IEEE Trans. Instrum. Meas., vol. 56,no. 4, pp. 1488 –1494, Aug. 2007.
[46] J. Falk, “An electronic warfare perspective on time difference arrival estima-tion subjected to radio receiver imperfections,” Licenciate thesis, Royal Inst.Technology, KTH, TRITA-S3-SB-0446, Stockholm, Sweden, 2004.
[47] “On the application of cross correlation function to subsample discrete timedelay estimation,” Digital Signal Processing, vol. 16, no. 6, pp. 682–694, 2006.
[48] J. Marple, S.L., “Estimating group delay and phase delay via discrete-timeanalytic cross-correlation,” IEEE Trans. Signal Process., vol. 47, no. 9, pp.2604 –2607, Sep. 1999.
BIBLIOGRAPHY 33
[49] M. El Yaagoubi, G. Neveux, D. Barataud, J. Nebus, and J. Verspecht, “Ac-curate phase measurements of broadband multitone signals using a specificconfiguration of a large signal network analyzer,” in IEEE MTT-S Int. Mi-crowave Symp. Dig., San Francisco, CA. 2006, pp. 1448 –1451.
[50] K. Remley, D. Williams, D. Schreurs, and M. Myslinski, “Measurement band-width extension using multisine signals: Propagation of error,” IEEE Trans.Microw. Theory Tech., vol. 58, no. 2, pp. 458 –467, Feb. 2010.
[51] P. Blockley, J. Scott, D. Gunyan, and A. Parker, “Noise considerations whendetermining phase of large-signal microwave measurements,” IEEE Trans. Mi-crow. Theory Tech., vol. 54, no. 8, pp. 3182–3190, Aug. 2006.
[52] S. Nicoloso, “An investigation of the carrier recovery techniques for psk modu-lated signals in cdma multipath environments,” M.S. Thesis, Virginia Poly-technic Institute and State University, 1997.
[53] S. Tretter, “Estimating the frequency of a noisy sinusoid by linear regression(corresp.),” IEEE Trans. Inf. Theory, vol. 31, no. 6, pp. 832 – 835, Nov. 1985.
[54] D. Rife and R. Boorstyn, “Single tone parameter estimation from discrete-timeobservations,” IEEE Trans. Inf. Theory, vol. 20, no. 5, pp. 591–598, Sep. 1974.
[55] M. Isaksson, D. Wisell, and D. Rönnow, “A comparative analysis of behavioralmodels for rf power amplifiers,” IEEE Trans. Microw. Theory Tech., vol. 54,no. 1, pp. 348 –359, Jan. 2006.
[56] D. Rönnow, D. Wisell, and M. Isaksson, “Three-tone characterization of non-linear memory effects in radio-frequency power amplifiers,” IEEE Trans. In-strum. Meas., vol. 56, no. 6, pp. 2646 –2657, Dec. 2007.
[57] M. Davenport, P. Boufounos, M. Wakin, and R. Baraniuk, “Signal processingwith compressive measurements,” IEEE J. Sel. Topics Signal Process., vol. 4,no. 2, pp. 445–460, Apr. 2010.


![Advanced measurements with a Vector Network AnalyzerA vector network analyzer[VNA] has thepossibility tomeasure amplitude and phase over specified frequency range. The vector network](https://img.pdfslide.us/doc/110x75/61036d65dd6f994a6f506c4c/advanced-measurements-with-a-vector-network-analyzer-a-vector-network-analyzervna.jpg)