Embed Size (px)
Citation preview
Santa Clara UniversityScholar Commons
Computer Engineering Senior Theses Engineering Senior Theses
6-7-2016
Vector Based Handwriting AnalysisArman ElahiSanta Clara University
Alex McAfeeSanta Clara University
Kameron TinsleySanta Clara University
Follow this and additional works at: https://scholarcommons.scu.edu/cseng_senior
Part of the Computer Engineering Commons
This Thesis is brought to you for free and open access by the Engineering Senior Theses at Scholar Commons. It has been accepted for inclusion inComputer Engineering Senior Theses by an authorized administrator of Scholar Commons. For more information, please contact [email protected].
Recommended CitationElahi, Arman; McAfee, Alex; and Tinsley, Kameron, "Vector Based Handwriting Analysis" (2016). Computer Engineering Senior Theses.73.https://scholarcommons.scu.edu/cseng_senior/73
Vector Based Handwriting Analysis
Arman ElahiAlex McAfee
Kameron Tinsley
Department of Computer EngineeringSanta Clara University
June 7, 2016
ABSTRACT
The purpose of this design project was to develop a system capable of analyzing vectors significantly fasterand more accurately than other systems available. These vectors were exceedingly large in both size anddimension and were resolved efficiently through the use of parallel programming. We then be implementedour own system to create a vector-based handwriting analysis authentication system that can be used in lieu ofa conventional password. This was developed using the highly flexible Android kernel in order to emphasizeportability. The final system worked well in the context of normal user interactions but was not as successfulin stopping professional forgers.
Keywords: Fast Vector Matching, Parallel Programming, Feature Vector Recognition
Table of Contents
1 Introduction 11.1 Motivation . . . . . . . . . . . . . . . . . . . . . . . . . . . . . . . . . . . . . . . . . . . . 11.2 Solution . . . . . . . . . . . . . . . . . . . . . . . . . . . . . . . . . . . . . . . . . . . . . 2
2 Requirements 32.1 Design Constraints . . . . . . . . . . . . . . . . . . . . . . . . . . . . . . . . . . . . . . . 32.2 Functional Requirements . . . . . . . . . . . . . . . . . . . . . . . . . . . . . . . . . . . . 32.3 Nonfunctional Requirements . . . . . . . . . . . . . . . . . . . . . . . . . . . . . . . . . . 3
3 Use Cases 4
4 System Design 64.1 Technologies Used . . . . . . . . . . . . . . . . . . . . . . . . . . . . . . . . . . . . . . . 64.2 Architectural Design . . . . . . . . . . . . . . . . . . . . . . . . . . . . . . . . . . . . . . 74.3 Signature Classification . . . . . . . . . . . . . . . . . . . . . . . . . . . . . . . . . . . . . 84.4 Signature Comparison . . . . . . . . . . . . . . . . . . . . . . . . . . . . . . . . . . . . . 94.5 Stroke Comparison . . . . . . . . . . . . . . . . . . . . . . . . . . . . . . . . . . . . . . . 10
5 Testing & Results 125.1 SVC2004 . . . . . . . . . . . . . . . . . . . . . . . . . . . . . . . . . . . . . . . . . . . . 125.2 Android User Testing . . . . . . . . . . . . . . . . . . . . . . . . . . . . . . . . . . . . . . 16
5.2.1 White Box Testing . . . . . . . . . . . . . . . . . . . . . . . . . . . . . . . . . . . 165.2.2 Black Box Testing . . . . . . . . . . . . . . . . . . . . . . . . . . . . . . . . . . . 16
6 Ethical Analysis 18
7 Lessons Learned 197.1 Technologies . . . . . . . . . . . . . . . . . . . . . . . . . . . . . . . . . . . . . . . . . . 197.2 Testing . . . . . . . . . . . . . . . . . . . . . . . . . . . . . . . . . . . . . . . . . . . . . . 20
8 Future Plans 218.1 General System Improvements . . . . . . . . . . . . . . . . . . . . . . . . . . . . . . . . . 218.2 Language Specific Improvements . . . . . . . . . . . . . . . . . . . . . . . . . . . . . . . . 22
9 User Manual 239.1 Overview . . . . . . . . . . . . . . . . . . . . . . . . . . . . . . . . . . . . . . . . . . . . 239.2 Enrolling into the System . . . . . . . . . . . . . . . . . . . . . . . . . . . . . . . . . . . . 239.3 Normal Use . . . . . . . . . . . . . . . . . . . . . . . . . . . . . . . . . . . . . . . . . . . 239.4 Fequently Asked Questions . . . . . . . . . . . . . . . . . . . . . . . . . . . . . . . . . . . 24.1 Cosine Similarity . . . . . . . . . . . . . . . . . . . . . . . . . . . . . . . . . . . . . . . . 25.2 Pearson Correlation Coefficient . . . . . . . . . . . . . . . . . . . . . . . . . . . . . . . . . 25.3 Spearman’s Rank Correlation Coefficient . . . . . . . . . . . . . . . . . . . . . . . . . . . 25.4 Kendall-Tau Correlation Coefficient . . . . . . . . . . . . . . . . . . . . . . . . . . . . . . 27
iv
List of Figures
3.1 A use case diagram showing the one main way that users will interact with our system. . . . 4
4.1 Architectural Design of the system. . . . . . . . . . . . . . . . . . . . . . . . . . . . . . . . 84.2 Overview of similarity metrics . . . . . . . . . . . . . . . . . . . . . . . . . . . . . . . . . 94.3 Example of Signature Comparison . . . . . . . . . . . . . . . . . . . . . . . . . . . . . . . 10
5.1 Graph of a considering online and offline schemes . . . . . . . . . . . . . . . . . . . . . . . 145.2 Graph of a weighting scheme with pressure maximized . . . . . . . . . . . . . . . . . . . . 155.3 Graph of a weighting scheme only considering online features . . . . . . . . . . . . . . . . 15
1 Spearman’s rank figure . . . . . . . . . . . . . . . . . . . . . . . . . . . . . . . . . . . . . 26
v

List of Tables
6.1 Ethical Analysis . . . . . . . . . . . . . . . . . . . . . . . . . . . . . . . . . . . . . . . . . 18
vi
Chapter 1
Introduction
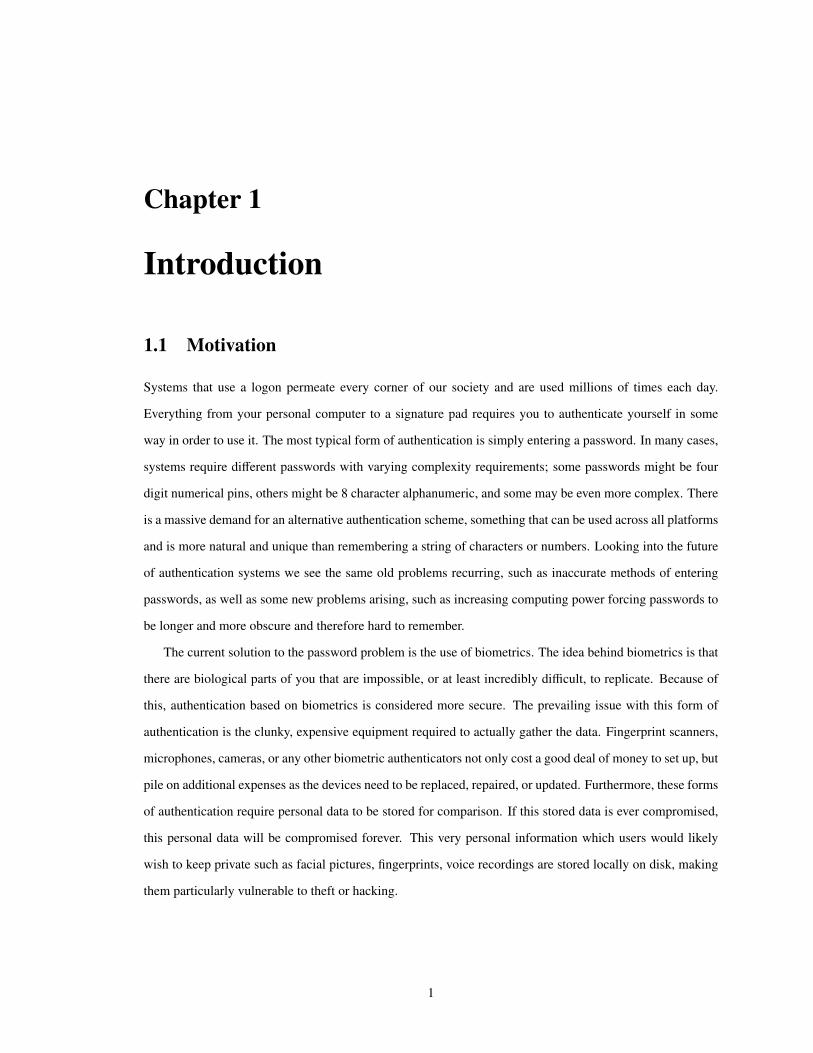
1.1 Motivation
Systems that use a logon permeate every corner of our society and are used millions of times each day.
Everything from your personal computer to a signature pad requires you to authenticate yourself in some
way in order to use it. The most typical form of authentication is simply entering a password. In many cases,
systems require different passwords with varying complexity requirements; some passwords might be four
digit numerical pins, others might be 8 character alphanumeric, and some may be even more complex. There
is a massive demand for an alternative authentication scheme, something that can be used across all platforms
and is more natural and unique than remembering a string of characters or numbers. Looking into the future
of authentication systems we see the same old problems recurring, such as inaccurate methods of entering
passwords, as well as some new problems arising, such as increasing computing power forcing passwords to
be longer and more obscure and therefore hard to remember.
The current solution to the password problem is the use of biometrics. The idea behind biometrics is that
there are biological parts of you that are impossible, or at least incredibly difficult, to replicate. Because of
this, authentication based on biometrics is considered more secure. The prevailing issue with this form of
authentication is the clunky, expensive equipment required to actually gather the data. Fingerprint scanners,
microphones, cameras, or any other biometric authenticators not only cost a good deal of money to set up, but
pile on additional expenses as the devices need to be replaced, repaired, or updated. Furthermore, these forms
of authentication require personal data to be stored for comparison. If this stored data is ever compromised,
this personal data will be compromised forever. This very personal information which users would likely
wish to keep private such as facial pictures, fingerprints, voice recordings are stored locally on disk, making
them particularly vulnerable to theft or hacking.
1
1.2 Solution
Our solution to the password problem is to present an API for authenticating users based on their handwriting
instead of convoluted passwords. Users will not have to worry about missed keystrokes or unforgiving pass-
word restrictions any longer. In addition, our solution will be simple to use, requiring only a users signature to
quickly receive feedback as to whether or not the user has been logged in. We will analyze a users handwrit-
ing as it is being written, allowing quick feedback, instead of having to wait for an entire string of characters
to be entered or the entire fingerprint to be read. Additionally, our system will not store any intrusive per-
sonal information about the user being authenticated, only a mathematical representation of a written word
or phrase. Our user-friendly form of authentication will not only eliminate the need to memorize lengthy
passwords, but also cost less than biometric equipment.
2
Chapter 2
Requirements
The following section will define the design constraints, function requirements, and nonfunctional require-
ments. Design constraints limit the implementation of the system. The functional requirements describe what
the system will do. The nonfunctional requirements describe the way in which the functional requirements
will be achieved.
2.1 Design Constraints
1. The system must be able to be ported to different systems.
2. The system must be parallelizable.
2.2 Functional Requirements
1. The System will generate vectors from the user’s handwriting.
2. The system will compare gathered vectors to an adapting master set of vectors.
3. The system will use handwriting as an authentication mechanism.
2.3 Nonfunctional Requirements
1. The system will be efficiently compare vectors.
2. The system will provide prompt user feedback.
3. The system will load efficiently.
3
Chapter 3
Use Cases
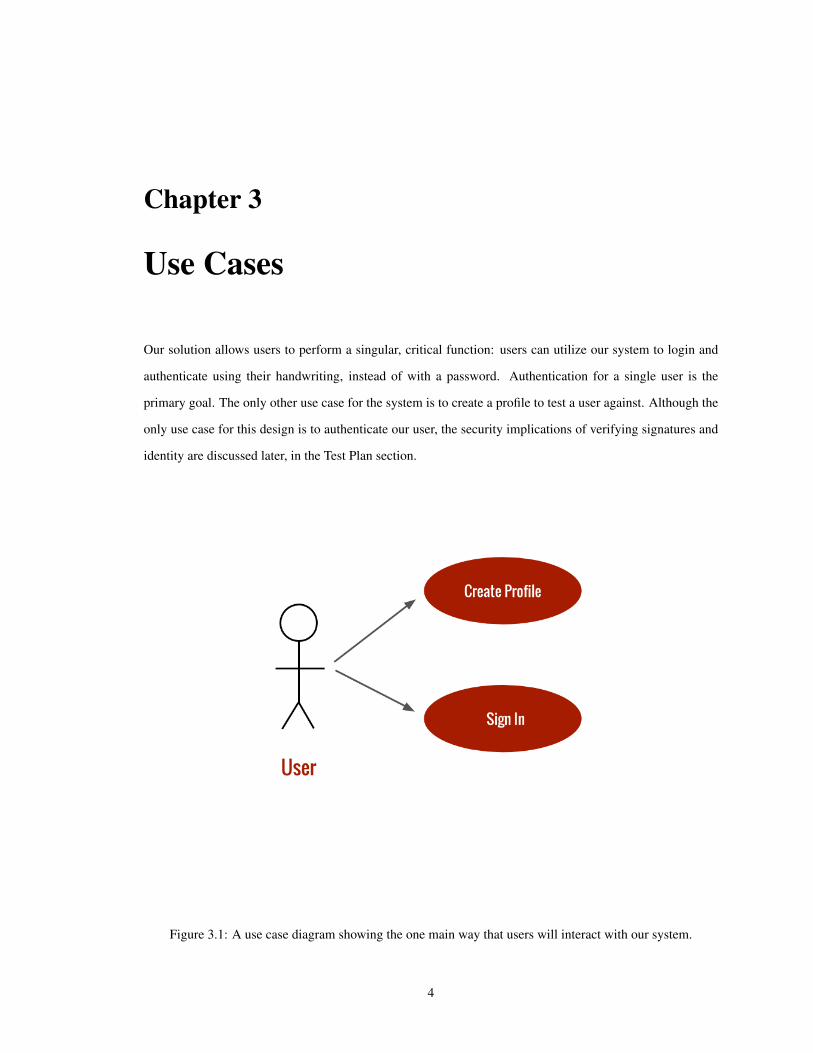
Our solution allows users to perform a singular, critical function: users can utilize our system to login and
authenticate using their handwriting, instead of with a password. Authentication for a single user is the
primary goal. The only other use case for the system is to create a profile to test a user against. Although the
only use case for this design is to authenticate our user, the security implications of verifying signatures and
identity are discussed later, in the Test Plan section.
Figure 3.1: A use case diagram showing the one main way that users will interact with our system.
4
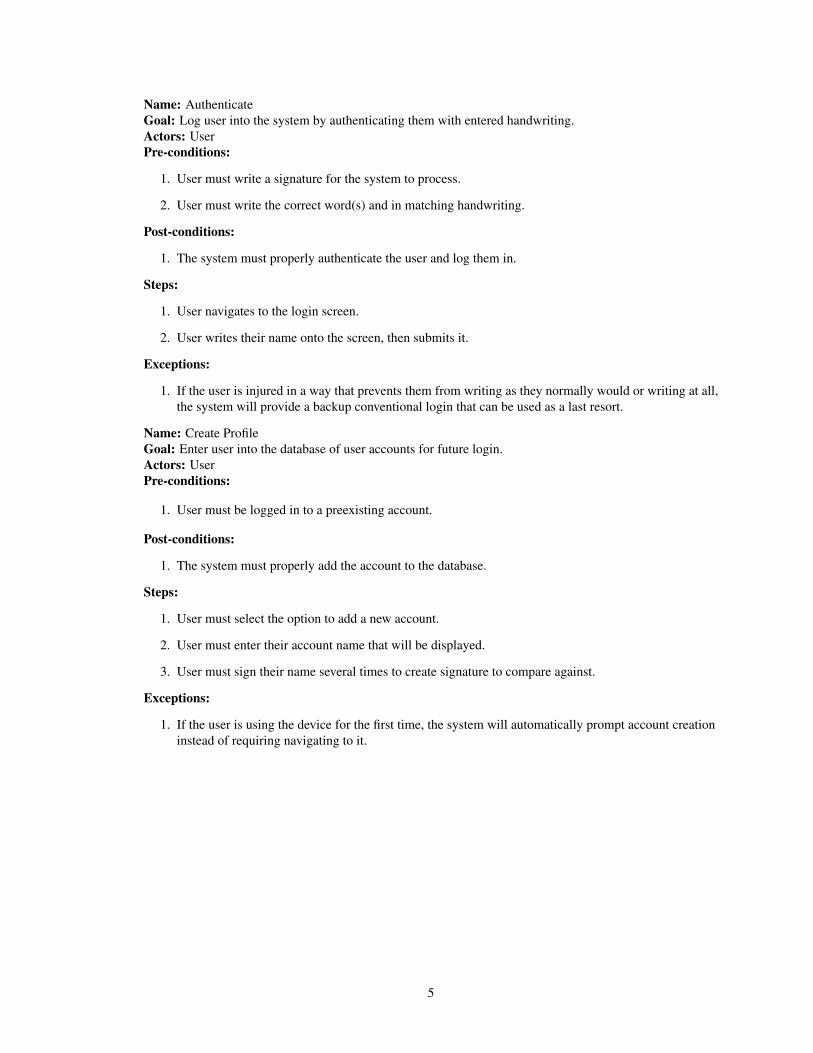
Name: AuthenticateGoal: Log user into the system by authenticating them with entered handwriting.Actors: UserPre-conditions:
1. User must write a signature for the system to process.
2. User must write the correct word(s) and in matching handwriting.
Post-conditions:
1. The system must properly authenticate the user and log them in.
Steps:
1. User navigates to the login screen.
2. User writes their name onto the screen, then submits it.
Exceptions:
1. If the user is injured in a way that prevents them from writing as they normally would or writing at all,the system will provide a backup conventional login that can be used as a last resort.
Name: Create ProfileGoal: Enter user into the database of user accounts for future login.Actors: UserPre-conditions:
1. User must be logged in to a preexisting account.
Post-conditions:
1. The system must properly add the account to the database.
Steps:
1. User must select the option to add a new account.
2. User must enter their account name that will be displayed.
3. User must sign their name several times to create signature to compare against.
Exceptions:
1. If the user is using the device for the first time, the system will automatically prompt account creationinstead of requiring navigating to it.
5
Chapter 4
System Design
The following section outlines the design of the system. The first section outlines the technologies used and
gives a brief overview of their purposes. The second section describes the architecture of the overall system.
The last section discusses some of the more important choices in designing the algorithm.
4.1 Technologies Used
The technologies used in the project were quite straightforward. In an exercise to truly understand the system,
we hand wrote the code in C++ only relying on Microsoft Hardware Libraries to communicate with the
device. To maintain consistency, Pearson and Cosine similarity were implemented in both Java and Python
as well. All languages can be used in an Object-Oriented manner and so the overall structures stayed the
same. Other algorithms such as K-Means and Kendall-Tau Correlation ranking were called from libraries.
Version control and documentation are standard tools with no surprises.
• Surface Development
1. C++ was the language used for all Microsoft Development. It was chosen as a catch-all language,
but the integration with Android through NDK was more of a hassle than re-writing all the code.
2. Microsoft Pen API was the only library used just for communication with the Surface tablet and
the Pen.
• Android Development
1. Java is the standard language for Android development.
2. Apache Commons Library is an open-source library with many mathematical functions already
built in.
• Command Line Analysis
6
1. Python was used for scripting mainly due to the team’s familiarity with the language. Python also
allows for rapid testing of the algorithms. Once data was collected, running analysis on the data
was simple.
2. Scikit-Learn is an open source machine learning library for Python which had built in implemen-
tations of the functions used in the Apache Commons Library
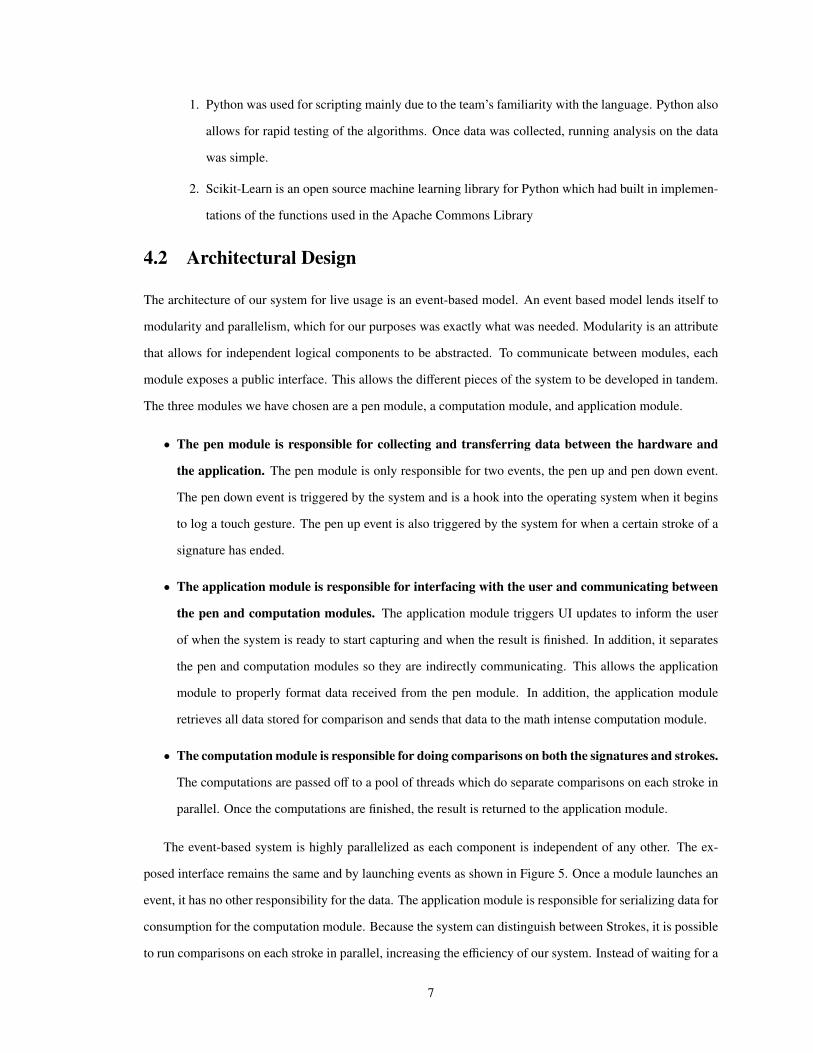
4.2 Architectural Design
The architecture of our system for live usage is an event-based model. An event based model lends itself to
modularity and parallelism, which for our purposes was exactly what was needed. Modularity is an attribute
that allows for independent logical components to be abstracted. To communicate between modules, each
module exposes a public interface. This allows the different pieces of the system to be developed in tandem.
The three modules we have chosen are a pen module, a computation module, and application module.
• The pen module is responsible for collecting and transferring data between the hardware and
the application. The pen module is only responsible for two events, the pen up and pen down event.
The pen down event is triggered by the system and is a hook into the operating system when it begins
to log a touch gesture. The pen up event is also triggered by the system for when a certain stroke of a
signature has ended.
• The application module is responsible for interfacing with the user and communicating between
the pen and computation modules. The application module triggers UI updates to inform the user
of when the system is ready to start capturing and when the result is finished. In addition, it separates
the pen and computation modules so they are indirectly communicating. This allows the application
module to properly format data received from the pen module. In addition, the application module
retrieves all data stored for comparison and sends that data to the math intense computation module.
• The computation module is responsible for doing comparisons on both the signatures and strokes.
The computations are passed off to a pool of threads which do separate comparisons on each stroke in
parallel. Once the computations are finished, the result is returned to the application module.
The event-based system is highly parallelized as each component is independent of any other. The ex-
posed interface remains the same and by launching events as shown in Figure 5. Once a module launches an
event, it has no other responsibility for the data. The application module is responsible for serializing data for
consumption for the computation module. Because the system can distinguish between Strokes, it is possible
to run comparisons on each stroke in parallel, increasing the efficiency of our system. Instead of waiting for a
7
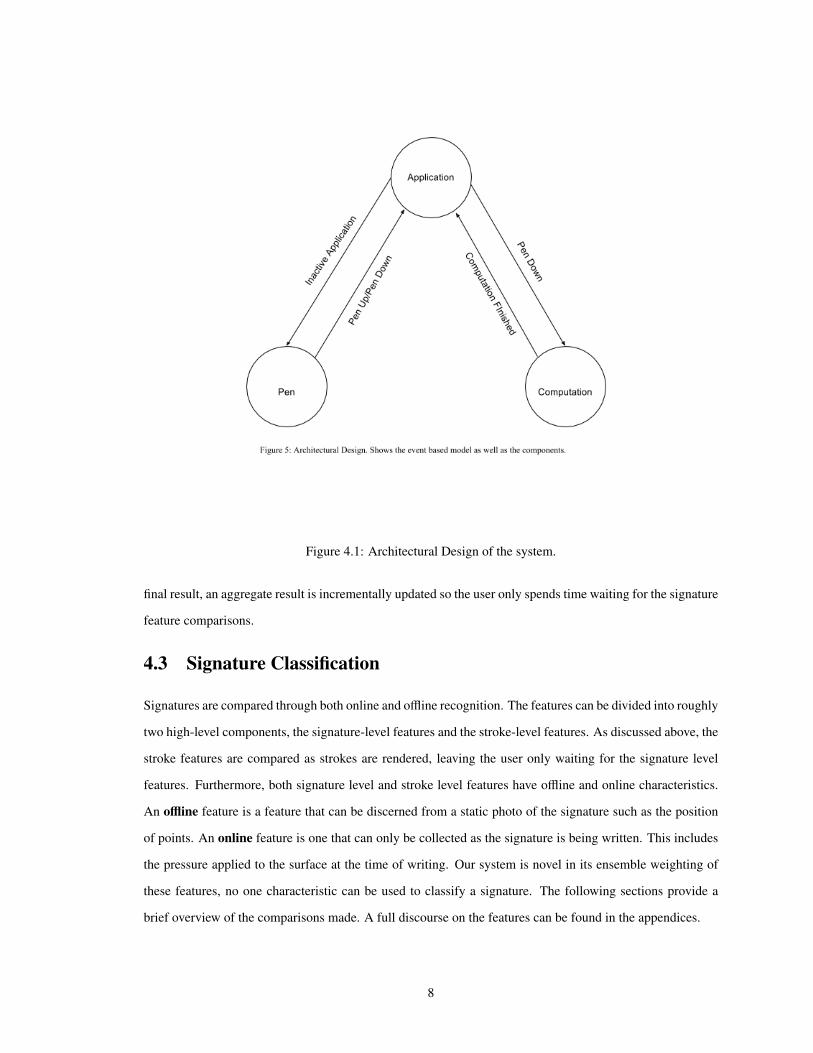
Figure 4.1: Architectural Design of the system.
final result, an aggregate result is incrementally updated so the user only spends time waiting for the signature
feature comparisons.
4.3 Signature Classification
Signatures are compared through both online and offline recognition. The features can be divided into roughly
two high-level components, the signature-level features and the stroke-level features. As discussed above, the
stroke features are compared as strokes are rendered, leaving the user only waiting for the signature level
features. Furthermore, both signature level and stroke level features have offline and online characteristics.
An offline feature is a feature that can be discerned from a static photo of the signature such as the position
of points. An online feature is one that can only be collected as the signature is being written. This includes
the pressure applied to the surface at the time of writing. Our system is novel in its ensemble weighting of
these features, no one characteristic can be used to classify a signature. The following sections provide a
brief overview of the comparisons made. A full discourse on the features can be found in the appendices.
8
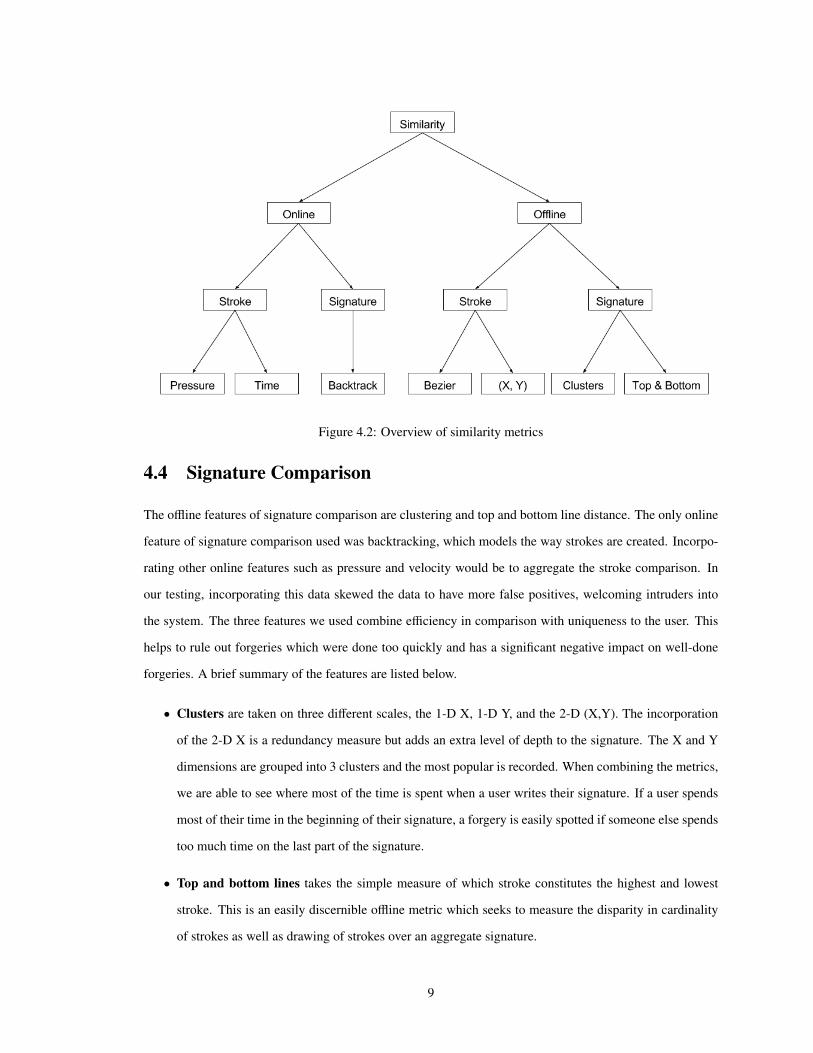
Figure 4.2: Overview of similarity metrics
4.4 Signature Comparison
The offline features of signature comparison are clustering and top and bottom line distance. The only online
feature of signature comparison used was backtracking, which models the way strokes are created. Incorpo-
rating other online features such as pressure and velocity would be to aggregate the stroke comparison. In
our testing, incorporating this data skewed the data to have more false positives, welcoming intruders into
the system. The three features we used combine efficiency in comparison with uniqueness to the user. This
helps to rule out forgeries which were done too quickly and has a significant negative impact on well-done
forgeries. A brief summary of the features are listed below.
• Clusters are taken on three different scales, the 1-D X, 1-D Y, and the 2-D (X,Y). The incorporation
of the 2-D X is a redundancy measure but adds an extra level of depth to the signature. The X and Y
dimensions are grouped into 3 clusters and the most popular is recorded. When combining the metrics,
we are able to see where most of the time is spent when a user writes their signature. If a user spends
most of their time in the beginning of their signature, a forgery is easily spotted if someone else spends
too much time on the last part of the signature.
• Top and bottom lines takes the simple measure of which stroke constitutes the highest and lowest
stroke. This is an easily discernible offline metric which seeks to measure the disparity in cardinality
of strokes as well as drawing of strokes over an aggregate signature.
9
• Backtracking measures the way strokes are created in relation to each other. Someone who has always
written the uppercase letter E from top to bottom is not likely to change to writing the same letter from
bottom to top as shown in 4.4. In addition, this metric takes into account a 2-D measure which is
missed in the top and bottom lines metric.
Figure 4.3: Comparison of top and bottom line (in purple) and backtracking (in green) measures of signaturecomparison. The left signature would have a top line of 1 and a backtrack of [0, -1, 1]. The right signaturewould have a top line of 3 and a backtrack of [0, -1, 0]
4.5 Stroke Comparison
The stroke comparison is based on both online and offline features as well. Some of these computations are
heavily computational and have been left out. In the following section, a brief overview of the results of the
calculations are discussed.
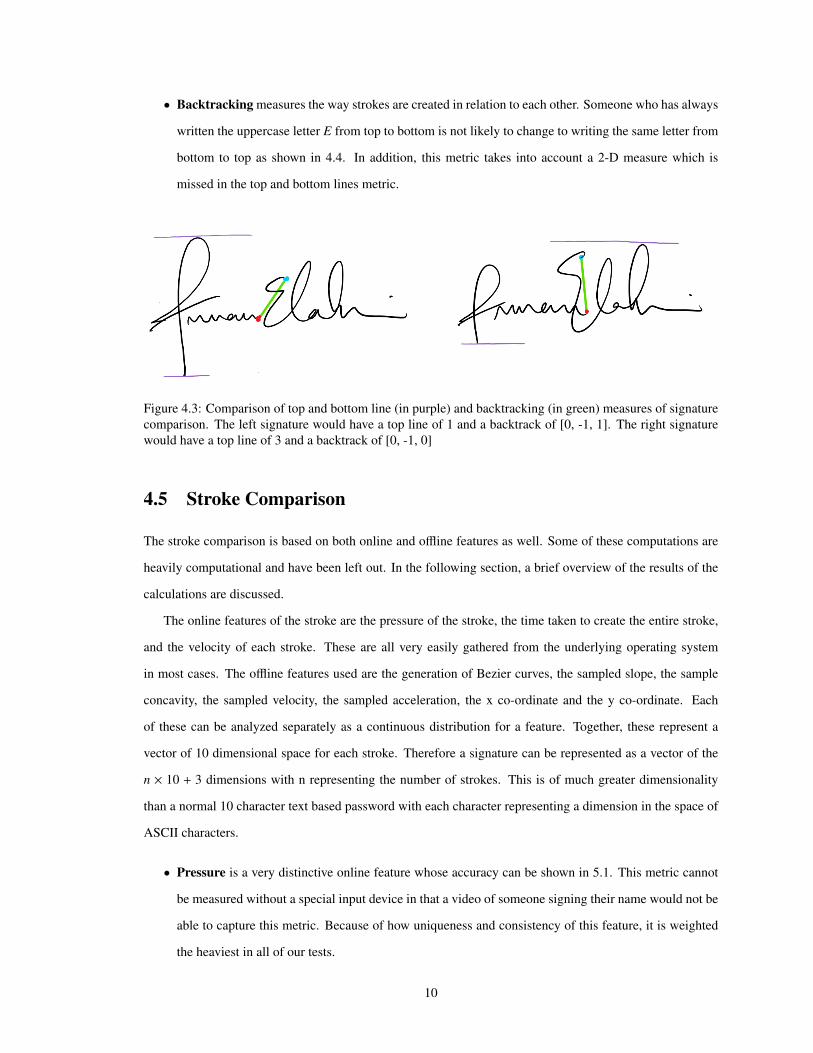
The online features of the stroke are the pressure of the stroke, the time taken to create the entire stroke,
and the velocity of each stroke. These are all very easily gathered from the underlying operating system
in most cases. The offline features used are the generation of Bezier curves, the sampled slope, the sample
concavity, the sampled velocity, the sampled acceleration, the x co-ordinate and the y co-ordinate. Each
of these can be analyzed separately as a continuous distribution for a feature. Together, these represent a
vector of 10 dimensional space for each stroke. Therefore a signature can be represented as a vector of the
n × 10 + 3 dimensions with n representing the number of strokes. This is of much greater dimensionality
than a normal 10 character text based password with each character representing a dimension in the space of
ASCII characters.
• Pressure is a very distinctive online feature whose accuracy can be shown in 5.1. This metric cannot
be measured without a special input device in that a video of someone signing their name would not be
able to capture this metric. Because of how uniqueness and consistency of this feature, it is weighted
the heaviest in all of our tests.
10
• Time and by extension velocity are measured as the other major online feature of a stroke. Although
these can be measured based on a recording of someone taking a signature, there is an inverse rela-
tionship between time and the accuracy of points. The velocity is a secondary measure because it
is measured as a function of time which is mainly recorded for future purposes in creating smoother
approximation of signatures.
• Bezier curves are a parametric function of the stroke at a given time. Similar to x and y, creating a
function allows access to different attributes of the stroke. This curve is taken as a measure of time
and so the first and second derivatives represent the sampled velocity and sampled acceleration. By
creating a Bezier curve, we are able to interpolate points from the signature. This allows the system
as a whole to smooth over errors in cardinality that may have been a result of the OS having a slow
collection rate for points.
• X and Y Coordinates are the obvious metric for signature comparison. For experienced forgers, this
metric seemed easy to overcome given the data in SVC2004, but for any normal users, this metric is
actually quite powerful, especially with the accuracy given by the devices.
11
Chapter 5
Testing & Results
Since our application is fairly simple in our intended use our test plan was similar in simplicity. Our largest
area of testing was user testing, wherein we just had users log in with our system to test our authentication
methods and aggregate higher numbers of logins, patterns, and vectors to better analyze for patterns and
trends that can then be re-applied to our algorithm. We performed both White Box and Black Box testing
with the end goal being compromising our system or finding a way to bypass our system entirely. The results
allowed us to better secure our system and therefore all future applications that intend to use our system
as an authentication mechanism. In the early stages of development we tested our algorithms be creating
random vectors of large dimensions and running them through the comparisons. This helped to optimize the
parallelism of our code.
In order to verify the security of our system, we conducted several tests aiming to circumvent or abuse our
methods of authentication. We used our knowledge of the architecture to try and manipulate the vector com-
parison algorithms, the Android platform,, and the methods of vector storage. This ensured that our system
addressed attempts to force data into our algorithms manually, to bypass log ins with Java vulnerabilities, and
to abuse access to the file system to change or destroy stored data. In doing so, secured our system against
malicious users.
Our testing was carried through two stages. Both are highlighted below. The first stage of testing was
done using data from SVC2004, a handwriting verification competition which features real data gathered
from a variety of users. The second set of data was real world user data. This data was gathered from user
testing in the Santa Clara community. The methods of this testing are highlighted below.
5.1 SVC2004
SVC2004 is a dataset consisting of real signatures and skilled forgeries of those signatures. Each participant
signs their name 20 times. After that, 20 skilled forgeries are provided by other users. This process is repeated
12
for each of the 40 participants. The following characteristics are logged for each point by the user:
1. X-Coordinate
2. Y-Coordinate
3. Pressure
4. Timestamp
5. Cursor Position
6. Azimuth
7. Altitude
Due to limitations of hardware, our initial testing relied on 5/7 of the characteristics: x-coordinate, y-
coordinate, timestamp, cursor position, and pressure. As our project is focused on leveraging existing hard-
ware, azimuth and altitude were disregarded.
Below are initial results based on the first 5 users. The tests run on this data set form the basis of our
algorithm through many hours of testing. Due to Pythons ease of use and the modularity of our design, we
were able to easily go through the testing of all this data and port it to Java for our Android application.
The graphs below, Figures 5.1-5.3 should be read as follows. Along the x-axis, are attempted signatures.
Each dot represents the distance between a real signature and that particular attempt. For all three charts, we
changed the weighting scheme between each run, but the user remains the same. Our system would accept
a signature with a difference of less than 0.2 and would reject anything above 0.2. Although we have not
included it, the same conclusions hold true for all other users.
13
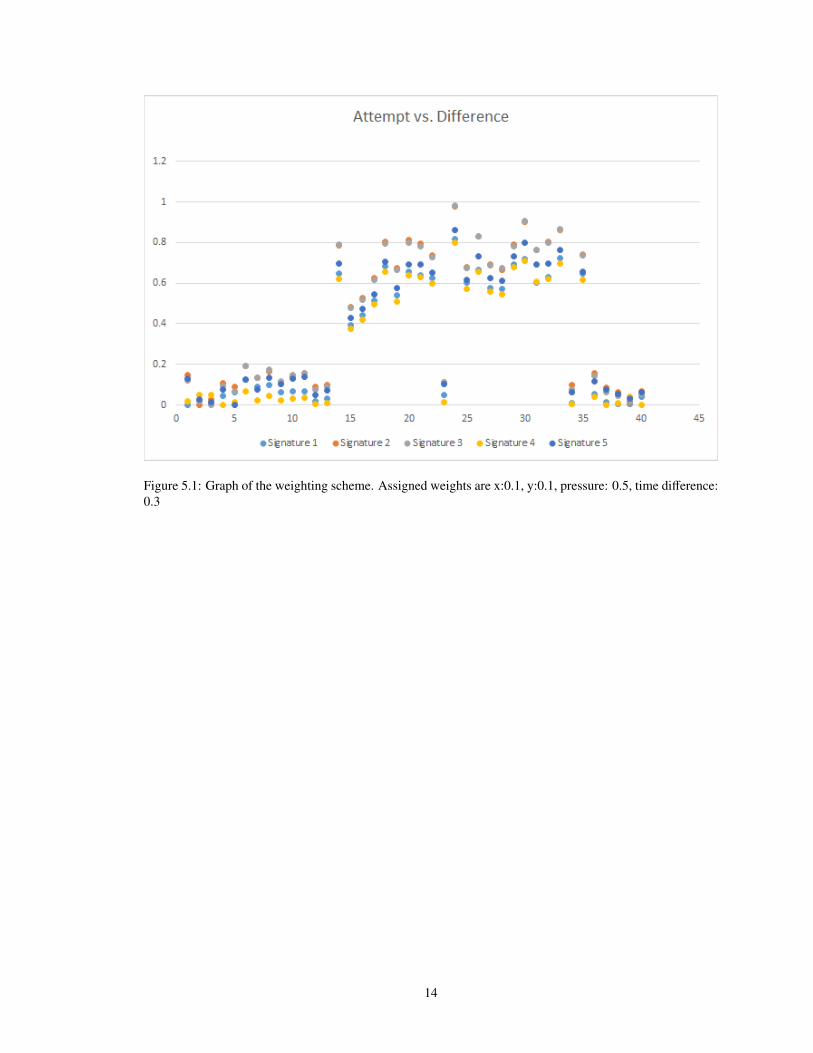
Figure 5.1: Graph of the weighting scheme. Assigned weights are x:0.1, y:0.1, pressure: 0.5, time difference:0.3
14
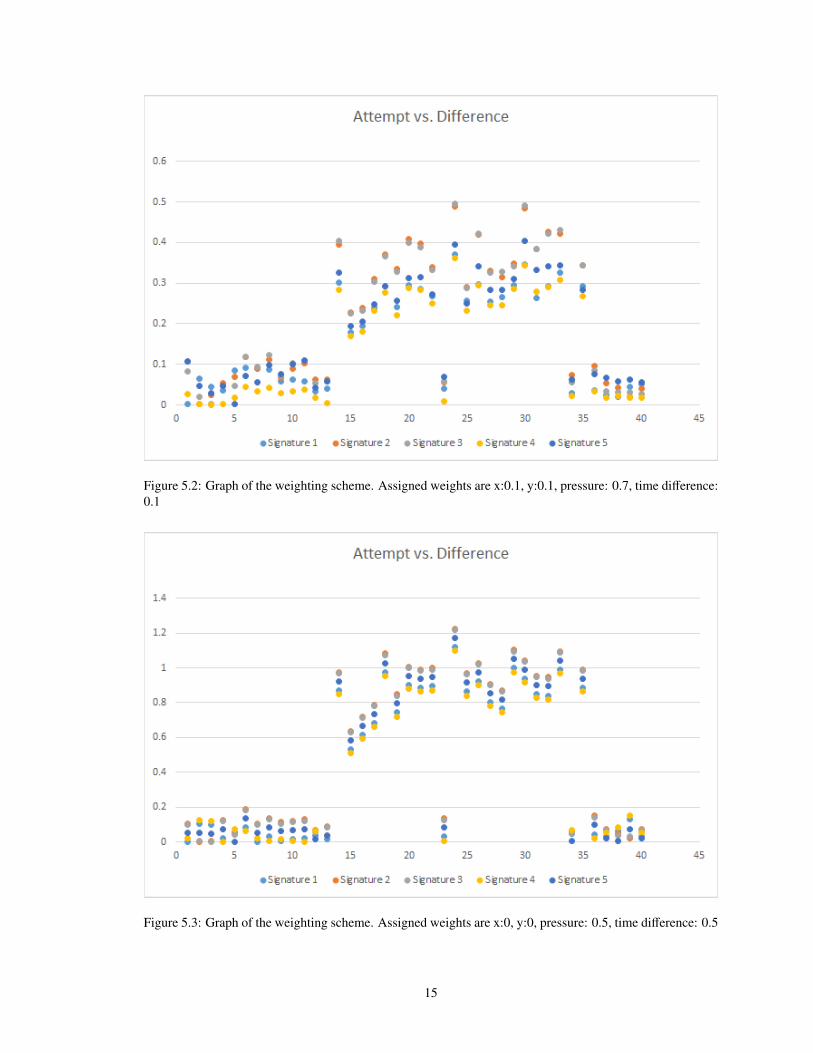
Figure 5.2: Graph of the weighting scheme. Assigned weights are x:0.1, y:0.1, pressure: 0.7, time difference:0.1
Figure 5.3: Graph of the weighting scheme. Assigned weights are x:0, y:0, pressure: 0.5, time difference: 0.5
15
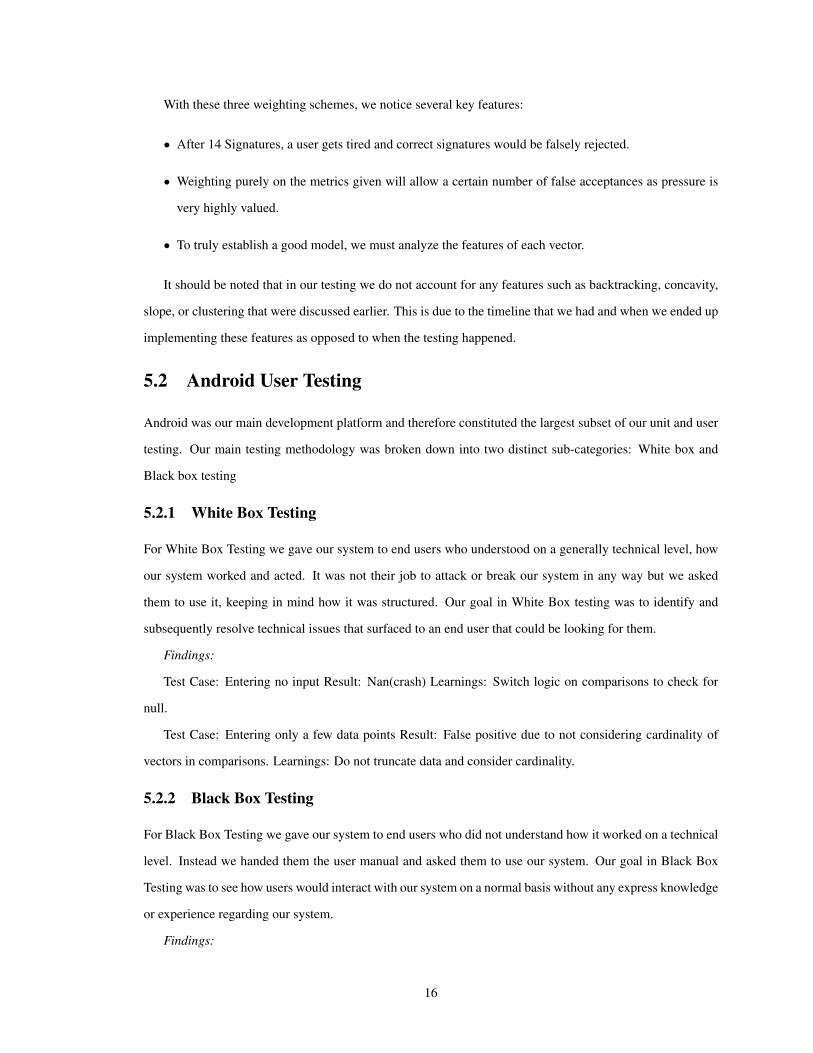
With these three weighting schemes, we notice several key features:
• After 14 Signatures, a user gets tired and correct signatures would be falsely rejected.
• Weighting purely on the metrics given will allow a certain number of false acceptances as pressure is
very highly valued.
• To truly establish a good model, we must analyze the features of each vector.
It should be noted that in our testing we do not account for any features such as backtracking, concavity,
slope, or clustering that were discussed earlier. This is due to the timeline that we had and when we ended up
implementing these features as opposed to when the testing happened.
5.2 Android User Testing
Android was our main development platform and therefore constituted the largest subset of our unit and user
testing. Our main testing methodology was broken down into two distinct sub-categories: White box and
Black box testing
5.2.1 White Box Testing
For White Box Testing we gave our system to end users who understood on a generally technical level, how
our system worked and acted. It was not their job to attack or break our system in any way but we asked
them to use it, keeping in mind how it was structured. Our goal in White Box testing was to identify and
subsequently resolve technical issues that surfaced to an end user that could be looking for them.
Findings:
Test Case: Entering no input Result: Nan(crash) Learnings: Switch logic on comparisons to check for
null.
Test Case: Entering only a few data points Result: False positive due to not considering cardinality of
vectors in comparisons. Learnings: Do not truncate data and consider cardinality.
5.2.2 Black Box Testing
For Black Box Testing we gave our system to end users who did not understand how it worked on a technical
level. Instead we handed them the user manual and asked them to use our system. Our goal in Black Box
Testing was to see how users would interact with our system on a normal basis without any express knowledge
or experience regarding our system.
Findings:
16

Test Case: Entering signature on panel Result: Frequent mistaken use of clear button isntead of enter
button Learnings: Switch placement of buttons
Test Case: Enrolling in system Result: Mistake while enrolling on one or more of initial signatures
Learnings: Add a clear button during enrollment
17
Chapter 6
Ethical Analysis
As a team, due to the disparities in skill, the main concern was around the distribution of tasks among the
team. Knowing the schedule of the entire team and setting meeting dates to ensure that work was shared
fairly was key to mitigating this ethical issue.
The ethical considerations of our project center around privacy and storing user data. No identifying
information besides a user’s name is stored in the Android version. This information is stored to an application
local database that cannot be read unless a user has root access to the device in which case the device’s security
has already been compromised.
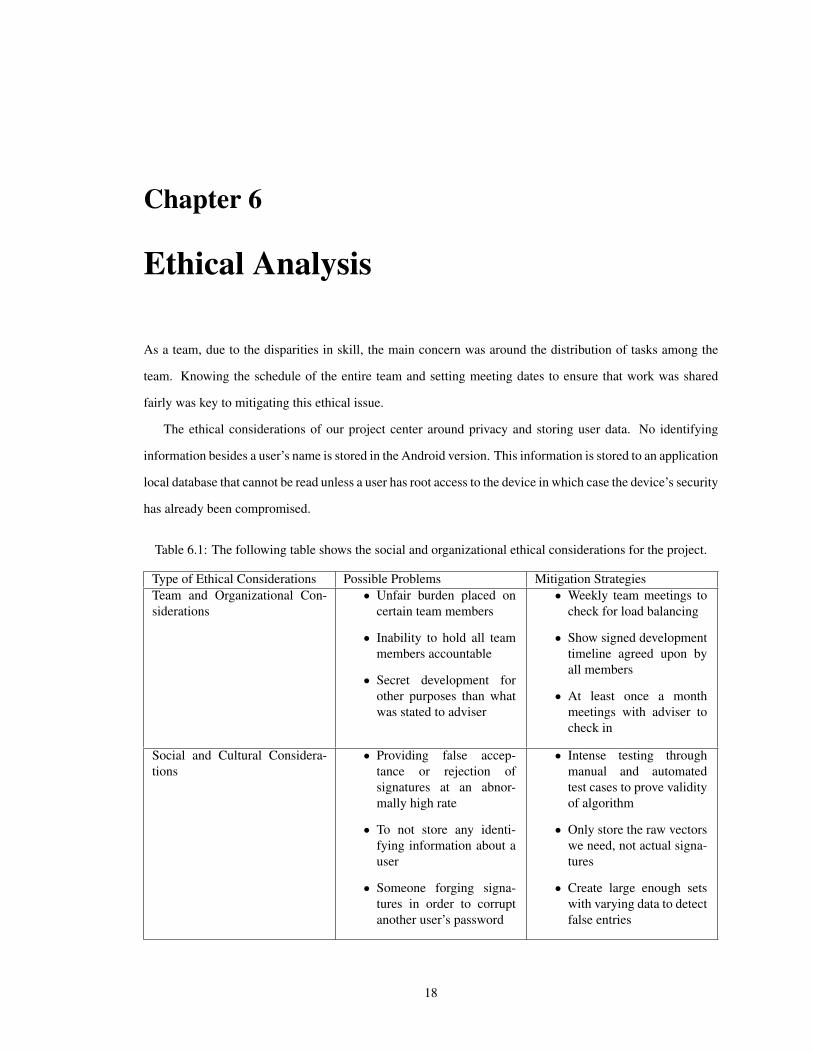
Table 6.1: The following table shows the social and organizational ethical considerations for the project.
Type of Ethical Considerations Possible Problems Mitigation StrategiesTeam and Organizational Con-siderations
• Unfair burden placed oncertain team members
• Inability to hold all teammembers accountable
• Secret development forother purposes than whatwas stated to adviser
• Weekly team meetings tocheck for load balancing
• Show signed developmenttimeline agreed upon byall members
• At least once a monthmeetings with adviser tocheck in
Social and Cultural Considera-tions
• Providing false accep-tance or rejection ofsignatures at an abnor-mally high rate
• To not store any identi-fying information about auser
• Someone forging signa-tures in order to corruptanother user’s password
• Intense testing throughmanual and automatedtest cases to prove validityof algorithm
• Only store the raw vectorswe need, not actual signa-tures
• Create large enough setswith varying data to detectfalse entries
18
Chapter 7
Lessons Learned
After going through the development practice, our team has learned many lessons pertaining to the Software
Development Process. In particular, the lessons learned are divided into technologies and testing. The most
important lesson learned was that prototyping is the best use of time early in the project when specifics are
still in the air. The prototype can easily guide the rest of the system design as issues which are faced early
can be noted and fixed for the actual implementation.
7.1 Technologies
1. Prototyping is one of the singular most important tasks early in the project. Good prototyping
can save hours of work and frustration. Keeping in mind that this work will most likely be discarded,
creating a simple end-to-end demo of the project can help to gauge how many hours will be needed
to create a more robust application. Although a system may be designed with certain specifications in
mind, these specifications must be validated through prototyping. Establishing a functional prototype
also allows the team to place the entire objective into perspective.
2. Know the limitations of technologies chosen. Knowing the limitations about technology is vital to
the project. In particular, it took us two months of development before we were able to get into contact
with a developer from Microsoft to find out that the API’s which were being used were not available
for the Surface Pen as we had initially thought, only on higher-end styluses. The original thought on
the project was to be a C++ Microsoft app, but the project evolved to encompass Java and Python as
well. Again with Python, due to technical limitations, discussed in Appendix E, the normal threading
implementations which are used in Java and C++ were unavailable.
3. When working with unfamiliar technologies, choose technologies with large support communi-
ties. Working with the Windows APIs was very challenging. There was almost no support for some of
19
the issues that we were encountering. As mentioned above, we had to ask a developer working for Mi-
crosoft to find out that we would not be able to pull all the data we had hoped for. When working with
Android, on the other hand, support was easily found addressing issues we faced. All of this support
was available within the top 5 search results on Google, and there were no hoops to jump through, just
a lot of reading.
7.2 Testing
1. Find and set up a testing framework early in the project. Writing unit tests is one of the most
important parts of any software development project. Our testing revolved around testing the functional
capabilities of our project. In this process, we encountered many bugs deep down the dependency
tree. If we had written unit tests before doing user testing, we would have caught many of our easily
discoverable bugs before deploying.
2. Test algorithms based on user feedback and the requirements established. Much of our algorithm
testing was based on the data from SVC2004. Although the data is good, the common use case was
not for detecting forgeries from well trained forgers. In addition, the data received from SVC2004 had
a higher quality than much of the data received on our platforms. This meant we ended up having
different weights for features based on the platform.
20
Chapter 8
Future Plans
Our project is a good starting point but there are many ways to improve upon the application.
8.1 General System Improvements
The following list enumerates some of the possible system level improvements which are general enough to
be applied to any of the three implementations provided.
1. Implement more complex machine learning algorithms given data from SVC2004 and SIG-
COMP2009. With the proliferation of Machine Learning, implementing a lightweight learning ma-
chine will be a good way to increase the initial accuracy, thus directly impacting future accuracy. In
addition, running dimensionality reduction algorithms greatly enhances the ability of the system to
accurately acquire and process data.
2. Implementation of an Inverse User Frequency, IUF, model with multiple signatures. Currently the
system takes each user independently. Because most of the signatures are clustered around the same
points, implementing an IUF model which takes into account the rarity of a vector in the given space
allows the system to eliminate phone-based bias.
3. Take advantage of the GPU and offload calculations onto the GPU. The focus of our project was
on a general purpose algorithm. That being the case, specific architectures were not taken into account
when designing the algorithms. One particular way to take advantage of architecture is to check for
the presence of a GPU. By offloading the calculations onto the GPU, the CPU is only responsible for
loading data and processing the output.
4. Creation of a connection layer to actually integrate the current system with a login mechanism.
Our system is a stand alone application which returns a boolean value, True or False, indicating whether
21
a particular signature comes from a particular user. By creating an API for the system, one might forego
the need for passwords in general.
5. Implementation of signature complexity requirements Admins of all authentication system always
want users to have safe and secure passwords, our version of this is ensuring that a user’s signature is
reasonably detailed, and therefore complex. This is to say that a user who signs with a straight vertical
line will be prompted to add more detail to their signature.
8.2 Language Specific Improvements
1. C++
• Code Refactoring and Cleanliness
• Implementation of Parallel Algorithms to match Android Implementation
2. Android
• Change from an AsyncTask model to a ThreadExecutor Model
• Incorporate Velocity metric for better drawing
• Encode Features as a Vector for efficient loading and comparison
3. Python
• Use of numpy for faster array manipulations
4. Extended use of scikit-learn and dimensionality reductions on features to minimize feature set
22
Chapter 9
User Manual
9.1 Overview
A Person utilizing our system should ideally be able to do so without much instruction, save for the first
time they are registering. The purpose of this manual is to serve as an orientation to the system and its
features as well as walking through a users first use and answering a few common questions. Our system uses
handwriting to authenticate users instead of the conventional text or PIN based authentication systems. This
has a few notable advantages for the user such as not having a password to remember, increased security, and
a marked increase in ease of use.
9.2 Enrolling into the System
The first time using our system you will be prompted to enroll yourself. This will be done by first login in
with another account and after successful authentication adding another user profile. When adding another
user profile you will be prompted to sign your name 5 times. It is important that you attempt to replicate
your normal signature under normal conditions since it is the style of handwriting, not the spelling or any
other factors that will be used to authenticate you. This means you should make no extra effort to sign your
name neatly or smaller or larger than normal. After entering your name a few times the system will log these
attempts to create a sort of stored password for you, immediately after this stage you will be asked to login to
the system in order to test the authentication for your signature specifically. If this authentication is successful
then you have completed the enrollment.
9.3 Normal Use
Normal use for our system is incredibly straightforward. A user should select their user profile and then sign
their name. Any extra steps beyond that are not needed unless a user is using the system for the first time. If
that is the case please refer to the section immediately prior to this.
23
9.4 Fequently Asked Questions
Q. - If I am somehow injured and cannot replicate my signature, will I still be able to use the system?
A. - Yes, we have checks in place for this. Just do your best to sign your name as you normally would
and you will be walked through a secondary process for users who are unable to replicate their password.
Q. - Someone watched me sign my name, can they now log into my profile?
A. - No, it has been proven that so far nobody can properly replicate a password on our system other than
the individual user. We pay attention to very small details and your privacy is our top priority, you signature
can never be forged.
24
Vector Algorithm Audit
.1 Cosine SimilarityCosine Similarity is a measure of similarity between two vectors of an inner product space. It is boundedcleanly by [-1, 1] as the similarity of inverse vectors and duplicate vectors, respectively. The algorithm forCosine similarity consists of two parts: the numerator, which is the dot product of the two vectors, and thedenominator which is the product of the magnitudes of the two vectors.
similarity = cos(θ) =A · B‖A|‖B‖
=
∑ni=1 Ai × Bi√∑n
i=1(Ai)2 ×√∑n
i=1(Bi)2(1)
Cosine similarity is a fairly easy to understand and implement comparison model, and therefore was theobvious choice for starting out. We used Cosine similarity to ensure that the rest of our implementation wasoperating properly and as a proof of concept in terms of scale, data collection, and analysis. Cosine Similarityis not used in the final version of our algorithm.
.2 Pearson Correlation CoefficientPearson Correlation is a measure of linear correlation between two vectors. It is often and widely used to testfor dependence between two variables in natural sciences. It is bounded by [-1, 1] as the similarity of inversevectors and duplicate vectors, respectively. The algorithm consists mainly of the same components as CosineSimilarity, differing only in that Pearson centers, or normalizes, the data before calculating similarity. Thiscan be seen in the subtraction of the mean from all individual data points.
r =
∑(X − X)(Y − Y)√∑
(X − X)2√∑
(Y − Y)2(2)
Pearson Similarity is used in calculating the similarity of handwriting features that relate to pressure. Thegeneral idea here is that pressure is something that will vary slightly from one attempt of a signature toanother, but in general follows a common trend throughout.
Fig 1 from Design DocSimilarly, pressure varies very slightly from attempt to attempt from the same user but varies greatly in
forgeries.Figure 2 from Design docThis difference is just further enhanced when compared to authentic signatures, as they are in different
ranges and also follow no common trend.Figure 3 from design docFurthermore, pressure is nearly impossible to observe with inspection and therefore is a very telling, yet
hard to replicate aspect of a signature.
.3 Spearman’s Rank Correlation CoefficientSpearmans Rank Correlation Coefficient is a nonparametric measure of dependence between two variables.When two variables are sampled and fit to the same metric, Spearmans rank is a great measure of theirdependence, or how similar they are. It will inherently disregard certain factors that may sway other ratingschemes in the wrong direction. Here is the equation used to calculate Spearmans rank:
rs = 1 −6∑
d2i
n(n2 − 1)(3)
Basically the way this algorithm works is to take the distances of the ranking squared, sum them up, multiplyby a constant, and then normalize by the number of elements. Here, the distance refers to a specific quantity
25
that is obtained through the following process. Given two data sets, we first rank them from either lowest tohighest or highest to lowest, it does not matter so long as it is constant. Then we take two ranked lists(the twovariables we are attempting to compare) and move down the list one at a time while comparing the values.If, for instance, our lists were 2,5,3 and 6,3,4 after we applied them to a model, which in this case is justascending order, we would have 2,3,5 and 3,4,6. Then we would compare 2-¿3, 3-¿4, 5-¿6 to get our distancevalue. As seen in the algorithm this distance is then squared and multiplied by a constant and summation.Then this is normalized to get our final value.
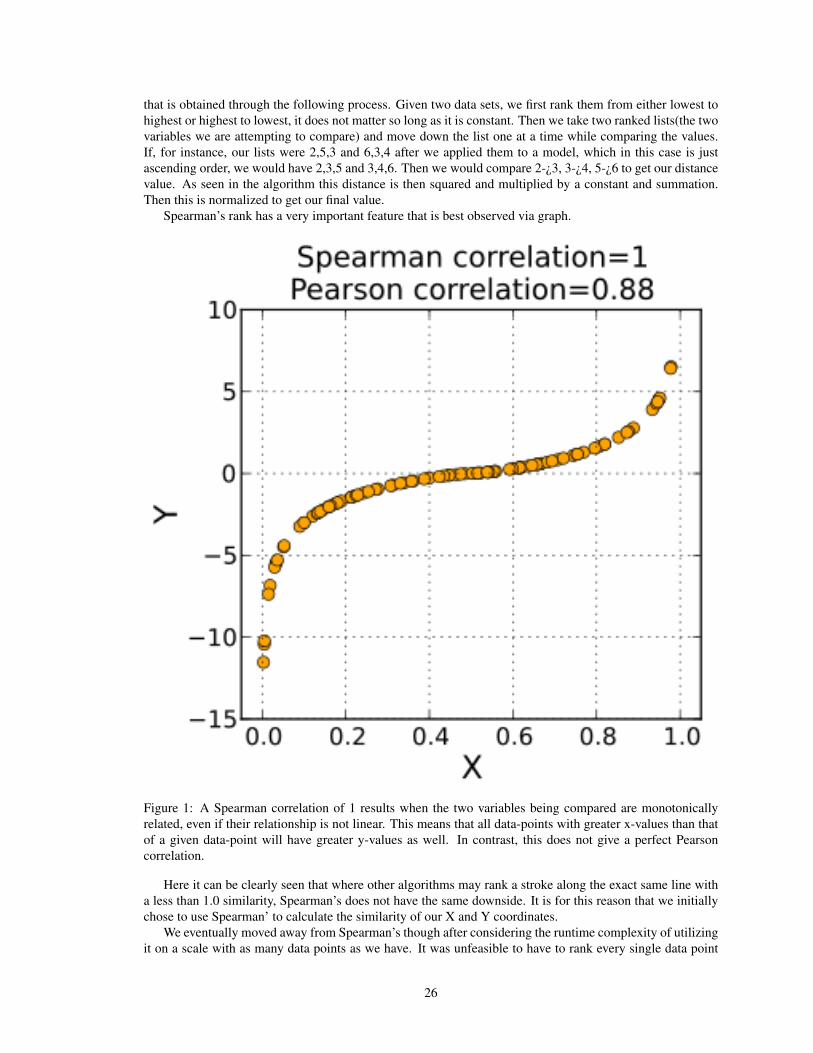
Spearman’s rank has a very important feature that is best observed via graph.
Figure 1: A Spearman correlation of 1 results when the two variables being compared are monotonicallyrelated, even if their relationship is not linear. This means that all data-points with greater x-values than thatof a given data-point will have greater y-values as well. In contrast, this does not give a perfect Pearsoncorrelation.
Here it can be clearly seen that where other algorithms may rank a stroke along the exact same line witha less than 1.0 similarity, Spearman’s does not have the same downside. It is for this reason that we initiallychose to use Spearman’ to calculate the similarity of our X and Y coordinates.
We eventually moved away from Spearman’s though after considering the runtime complexity of utilizingit on a scale with as many data points as we have. It was unfeasible to have to rank every single data point
26
and then run a calculation on them, especially because it prevented a major improvement we had made. Thisimprovement was to start calculations on a penUp event on a stroke by stroke basis instead of waiting untilthe very end of a signature. For this reason Spearman’s rank is not in our final version.
.4 Kendall-Tau Correlation CoefficientKendall-Tau [KT] correlation coefficient was our answer to the dilemma we had with Spearman’s rank. KTgivbes us nearly the same results without the increase in runtime complexity we were trying to avoid. Thisalgorithm measure ordinal association between two sets. Here is the algorithm used to calculate KT:
τ =nc − nd
n(n−1)2
(4)
where Nc stands for number of concordant pairs and Nd stand for number of discordant pairs.
27