Embed Size (px)
Citation preview
TECHNICAL REPORT
© The Broadband Forum. All rights reserved.
TR-115 VDSL2 Functionality Test Plan
Issue: 2
Issue Date: July 2012
VDSL2 Functionality Test Plan TR-115 Issue 2
July 2012 © The Broadband Forum. All rights reserved 2 of 96
Notice
The Broadband Forum is a non-profit corporation organized to create guidelines for broadband
network system development and deployment. This Broadband Forum Technical Report has
been approved by members of the Forum. This Broadband Forum Technical Report is not
binding on the Broadband Forum, any of its members, or any developer or service provider. This
Broadband Forum Technical Report is subject to change, but only with approval of members of
the Forum. This Technical Report is copyrighted by the Broadband Forum, and all rights are
reserved. Portions of this Technical Report may be copyrighted by Broadband Forum members.
This Broadband Forum Technical Report is provided AS IS, WITH ALL FAULTS. ANY
PERSON HOLDING A COPYRIGHT IN THIS BROADBAND FORUM TECHNICAL
REPORT, OR ANY PORTION THEREOF, DISCLAIMS TO THE FULLEST EXTENT
PERMITTED BY LAW ANY REPRESENTATION OR WARRANTY, EXPRESS OR
IMPLIED, INCLUDING, BUT NOT LIMITED TO, ANY WARRANTY:
(A) OF ACCURACY, COMPLETENESS, MERCHANTABILITY, FITNESS FOR A
PARTICULAR PURPOSE, NON-INFRINGEMENT, OR TITLE;
(B) THAT THE CONTENTS OF THIS BROADBAND FORUM TECHNICAL REPORT ARE
SUITABLE FOR ANY PURPOSE, EVEN IF THAT PURPOSE IS KNOWN TO THE
COPYRIGHT HOLDER;
(C) THAT THE IMPLEMENTATION OF THE CONTENTS OF THE TECHNICAL REPORT
WILL NOT INFRINGE ANY THIRD PARTY PATENTS, COPYRIGHTS,
TRADEMARKS OR OTHER RIGHTS.
By using this Broadband Forum Technical Report, users acknowledge that implementation may
require licenses to patents. The Broadband Forum encourages but does not require its members
to identify such patents. For a list of declarations made by Broadband Forum member
companies, please see http://www.broadband-forum.org. No assurance is given that licenses to
patents necessary to implement this Technical Report will be available for license at all or on
reasonable and non-discriminatory terms.
ANY PERSON HOLDING A COPYRIGHT IN THIS BROADBAND FORUM TECHNICAL
REPORT, OR ANY PORTION THEREOF, DISCLAIMS TO THE FULLEST EXTENT
PERMITTED BY LAW (A) ANY LIABILITY (INCLUDING DIRECT, INDIRECT, SPECIAL,
OR CONSEQUENTIAL DAMAGES UNDER ANY LEGAL THEORY) ARISING FROM OR
RELATED TO THE USE OF OR RELIANCE UPON THIS TECHNICAL REPORT; AND (B)
ANY OBLIGATION TO UPDATE OR CORRECT THIS TECHNICAL REPORT.
Broadband Forum Technical Reports may be copied, downloaded, stored on a server or
otherwise re-distributed in their entirety only, and may not be modified without the advance
written permission of the Broadband Forum.
The text of this notice must be included in all copies of this Broadband Forum Technical Report.
VDSL2 Functionality Test Plan TR-115 Issue 2
July 2012 © The Broadband Forum. All rights reserved 3 of 96
Issue History
Issue
Number
Approval
Date
Publication
Date
Issue
Editor
Changes
1 23 November 2009 Michael Hanrahan,
Huawei Technologies
Zhang Yongjun,
Huawei Technologies
Original
Corrigendum 1 3 March 2010 Michael Hanrahan,
Huawei Technologies
Corrections
summarized in
Executive
Summary
Corrigendum 2 22 February 2011 Michael Hanrahan,
Huawei Technologies
Corrections
summarized in
Executive
Summary
2 2 July 2012 9 July 2012 Michael Hanrahan,
Huawei Technologies
Updates
summarized in
Executive
Summary
Comments or questions about this Broadband Forum Technical Report should be directed to
Editor Michael Hanrahan Huawei Technologies
Metallic Transmission
Working Group Chair
Les Brown Lantiq
Vice Chairs Massimo Sorbara
Lincoln Lavoie
Ikanos
UNH
Chief Editor Michael Hanrahan Huawei Technologies
VDSL2 Functionality Test Plan TR-115 Issue 2
July 2012 © The Broadband Forum. All rights reserved 4 of 96
TABLE OF CONTENTS
EXECUTIVE SUMMARY .......................................................................................................8
1 PURPOSE AND SCOPE ................................................................................................. 10
1.1 PURPOSE .................................................................................................................... 10
1.2 SCOPE ........................................................................................................................ 10
2 REFERENCES AND TERMINOLOGY........................................................................ 11
2.1 CONVENTIONS ............................................................................................................ 11 2.2 REFERENCES .............................................................................................................. 12
2.3 DEFINITIONS............................................................................................................... 13 2.4 ABBREVIATIONS ......................................................................................................... 13
2.5 G.997.1 PARAMETERS ................................................................................................ 16 2.5.1 Far-end INM performance monitoring parameters ................................................ 18 2.5.2 INM configuration parameters (downstream, upstream) ........................................ 18
3 TECHNICAL REPORT IMPACT ................................................................................. 19
3.1 ENERGY EFFICIENCY .................................................................................................. 19
3.2 IPV6........................................................................................................................... 19 3.3 SECURITY ................................................................................................................... 19
3.4 PRIVACY .................................................................................................................... 19
4 TEST STRUCTURE ....................................................................................................... 20
4.1 TEST CONFIGURATIONS .............................................................................................. 21 4.2 SYSTEM UNDER TEST SETTINGS .................................................................................. 23
4.2.1 Band Profiles ......................................................................................................... 23
4.2.2 Line Settings .......................................................................................................... 25 4.2.3 Profile Line Combinations ..................................................................................... 33
4.3 TEST PLAN PASSING CRITERIA .................................................................................... 33 4.4 TEST SETUP ................................................................................................................ 33
4.5 EQUIPMENT FEATURE TABLES .................................................................................... 34 4.6 EQUATIONS FOR ESTIMATING BER ............................................................................. 35
5 PHYSICAL LAYER TESTS........................................................................................... 36
5.1 INTERLEAVING DELAY TEST ....................................................................................... 36
5.2 IMPULSE NOISE PROTECTION TEST .............................................................................. 37 5.3 DUAL LATENCY TEST (OPTIONAL) .............................................................................. 38 5.4 ON-LINE RECONFIGURATION TESTS ............................................................................ 39
5.4.1 Bitswap Test .......................................................................................................... 39 5.4.2 Wideband Bitswap Test .......................................................................................... 41
5.4.3 Seamless Rate Adaptation Test (Optional) ............................................................. 44 5.4.4 SOS Test (Optional) ............................................................................................... 52
5.5 LOOP DIAGNOSTIC MODE TEST ................................................................................... 57 5.6 VTU-R INVENTORY TEST ........................................................................................... 61
5.7 PSD TESTS ................................................................................................................. 62
VDSL2 Functionality Test Plan TR-115 Issue 2
July 2012 © The Broadband Forum. All rights reserved 5 of 96
5.7.1 PSD Mask Test....................................................................................................... 62 5.7.2 Aggregate Transmit Power Test ............................................................................. 64
5.7.3 In-band Spectral Shaping Test ............................................................................... 65 5.7.4 Downstream Power Back-off Test .......................................................................... 67
5.7.5 Upstream Power Back-off Test ............................................................................... 69 5.8 LONGITUDINAL CONVERSION LOSS (LCL) TEST .......................................................... 71
5.9 VTU-R INM .............................................................................................................. 72 5.9.1 Expected Results for Test 1 .................................................................................... 75
5.9.2 Expected Results for Test 2 .................................................................................... 75 5.9.3 Expected Results for Test 3 .................................................................................... 75
5.9.4 Expected Results for Test 5, 7 and 9 ....................................................................... 76 5.9.5 Expected results for Test 4, 6, 8 and 10 .................................................................. 76 5.9.6 Expected Results for Test 11 .................................................................................. 76
5.9.7 Expected Results for Test 12 .................................................................................. 77 5.9.8 PEIN Test Sequence Definition .............................................................................. 77
6 SYSTEM LEVEL TESTS ............................................................................................... 78
6.1 64/65-OCTET ENCAPSULATION FAR-END PTM-TC PERFORMANCE MONITORING TEST
(OPTIONAL) ........................................................................................................................... 78
7 TESTING G.997.1 CONFIGURATION PARAMETERS AND PERFORMANCE
MONITORING COUNTERS ................................................................................................. 80
7.1 CONFIGURATION PARAMETER MINSNRM .................................................................. 80 7.2 CONFIGURATION PARAMETER TARSNRM.................................................................. 81
7.3 CONFIGURATION PARAMETER PSDMASK .................................................................. 82 7.4 CONFIGURATION PARAMETER VDSL2-CARMASK .................................................... 83
7.5 CONFIGURATION PARAMETER MAXNOMATP ........................................................... 84 7.6 PERFORMANCE MONITORING COUNTERS FOR CODE VIOLATIONS AND ERRORED
SECONDS ............................................................................................................................... 85 7.7 PERFORMANCE MONITORING COUNTER FOR SES ........................................................ 87
7.8 PERFORMANCE MONITORING COUNTER FOR UNAVAILABLE SECONDS (UAS) .............. 88 7.9 PERFORMANCE MONITORING COUNTERS FOR FULL INITIALIZATION AND FAILED FULL
INITIALIZATION ...................................................................................................................... 89
ANNEX A NOISE MODEL FOR REGION B VDSL2 PROFILE 30MHZ ..................... 90
ANNEX B ANNEX B PEIN TEST SEQUENCE .............................................................. 92
APPENDIX I ADDITIONAL INFORMATION ABOUT OAM PROTOCOL DATA
UNIT (OAMPDU) ................................................................................................................... 93
VDSL2 Functionality Test Plan TR-115 Issue 2
July 2012 © The Broadband Forum. All rights reserved 6 of 96
List of Figures
Figure 1 - Generic Test Configuration ....................................................................................... 21 Figure 2 - Test Setup For Configurations Using Data Layer ...................................................... 21
Figure 3 - Test Configuration for PSD Measurement Tests ........................................................ 22 Figure 4 - Alternative Test Configuration for PSD Measurement Tests ..................................... 22
List of Tables
Table 1 - Common Band Profiles .............................................................................................. 23
Table 2 - List of Common Line Settings for VDSL2 Functionality Tests ................................... 25 Table 3 - Common Line Settings for BA17a_D&UPBO Band Profile ....................................... 26 Table 4 - Common Line Settings for BB17a_D&UPBO Band Profile ....................................... 26
Table 5 - Common Line Settings for BA30a_D&UPBO Band Profile ....................................... 27 Table 6 - Common Line Settings for BB30a_D&UPBO Band Profile ....................................... 28
Table 7 - Common Line Settings for BA8c_D&UPBO Band Profile ......................................... 29 Table 8 - UPBOA and UPBOB for band-profile AA8d.............................................................. 29
Table 9 - UPBOA and UPBOB for band-profile BA17a_D&UPBO, BB17a_ D&UPBO ........... 30 Table 10 - UPBOA and UPBOB for band-profile BA8c_D&UPBO .......................................... 30
Table 11 - UPBOA and UPBOB for band-profiles CG8d, CG12a, CG17a, CG30a .................... 30 Table 12 - General Line Settings ............................................................................................... 31 Table 13 - Specific line settings ................................................................................................. 32
Table 14 - Concatenated common settings, testing combination description .............................. 33 Table 15 - VTU-O Feature Table............................................................................................... 34
Table 16 - VTU-R Feature Table ............................................................................................... 35 Table 17 - Interleaving Delay Test ............................................................................................ 36
Table 18 - Capabilities of Impulse Noise Protection .................................................................. 37 Table 19 - Verification of the Function of Dual Latency (Optional) ........................................... 38
Table 20 - Bitswap Test............................................................................................................. 39 Table 21 - Wideband Bit Swap Test Noise Definition ............................................................... 41
Table 22 - DS Wideband Bit Swapping Test ............................................................................. 42 Table 23 - US Wideband Bit Swapping Test ............................................................................. 43 Table 24 - SRA Configuration ................................................................................................... 44
Table 25 - Functional SRA Test - Downstream ......................................................................... 45 Table 26 - Functional SRA test - Upstream ............................................................................... 46
Table 27 - Functional SRA Test with DCID – Downstream ....................................................... 48 Table 28 - Functional SRA Test with DCID – Upstream ........................................................... 50
Table 29 – SOS Test In The Downstream .................................................................................. 53 Table 30 - SOS Test In The Upstream ....................................................................................... 55
Table 31 - Test on Loop Diagnostic Mode requested by VTU-O ............................................... 57 Table 32 - Test on Loop Diagnostic Mode requested by VTU-R ............................................... 59 Table 33 - VTU-R Inventory Information Test .......................................................................... 61
Table 34 - PSD Mask Test......................................................................................................... 62 Table 35 - Aggregate Transmit Power Test ............................................................................... 64
Table 36 - List of some predefined RFI Notches (source: Europe/Germany, incl. international
amateur radio bands) ......................................................................................................... 65
VDSL2 Functionality Test Plan TR-115 Issue 2
July 2012 © The Broadband Forum. All rights reserved 7 of 96
Table 37 - In-band Spectral Shaping / RFI Notch Configuration Test ........................................ 66 Table 38 - Downstream Power Back-Off Test ........................................................................... 67
Table 39 - Upstream Power Back-Off Test ................................................................................ 69 Table 40 - Longitudinal Conversion Loss (LCL) Test................................................................ 71
Table 41 - VTU-R INM Tests ................................................................................................... 72 Table 42 - VTU-R INM Capability............................................................................................ 73
Table 43 - 64/65-Octet Encapsulation Far-End PTM-TC Performance Monitoring Test (Optional)
.......................................................................................................................................... 79
Table 44 - MINSNRM Control Test .......................................................................................... 80 Table 45 - TARSNRM Control Test .......................................................................................... 81
Table 46 - PSDMASK Control Test .......................................................................................... 82 Table 47 - VDSL2 CARMASK Control Test ............................................................................ 83 Table 48 - MAXNOMATP Control Test ................................................................................... 84
Table 49 - Code Violation and Errored Seconds Test in the Fast Mode ...................................... 85 Table 50 - Code Violation and Errored Seconds Test in the Interleaved Mode ........................... 86
Table 51 - SES Counter Reporting Test ..................................................................................... 87 Table 52 - Unavailable Seconds (UAS) Reporting Test ............................................................. 88
Table 53 - Full Initialization Count and Failed Full Initialization Count Test ............................. 89 Table 54 - XA.LT and XA.NT component for MD_CAB72 noise scenario ............................... 90
Table 55 - Noise models for the 30a profiles with activated D&UPBO ...................................... 91 Table 56 - Example Information OAMPDU after OAM discovery ............................................ 94 Table 57 - Variable Request OAMPDU to retrieve TCCRCErrors Counter ............................... 94
Table 58 - Variable Response OAMPDU to retrieve TCCRCErrors Counter ............................. 95 Table 59 - Variable Request OAMPDU to retrieve TCCodingViolations Counter ..................... 95
Table 60 - Variable Response OAMPDU to retrieve TCCodingViolations counter .................... 96
VDSL2 Functionality Test Plan TR-115 Issue 2
July 2012 © The Broadband Forum. All rights reserved 8 of 96
Executive Summary
TR-115, as part of the Broadband Suite, provides a set of test methods to verify a significant
subset of the transceiver functional requirements of VDSL2 modems implemented in accordance
with ITU-T G.993.2 (Very high speed Digital Subscriber Line transceivers 2) as well as physical
layer OAM configuration and performance monitoring parameters defined in ITU-T G.997.1. Its
key value is in the verification of transceiver functionalities and management parameters such
that network operators may deploy interoperable and successful VDSL2 services in their
networks.
TR-115 accompanies TR-114 “VDSL2 Performance Test Plan” and TR-138 “Accuracy Tests
For Test Parameters”. TR-114 provides a set of region specific performance requirements and
test methods for VDSL2 modems implemented in accordance with ITU-T G.993.2. TR-138
defines the tests for verification of the accuracy of the reported test (Physical Layer OAM
configuration and performance monitoring) parameters defined in ITU-T G.993.2 and G.997.1.
Updates for Issue 1 Corrigendum 1 include corrections to:
Section 2, Definitions
Table 5, Common Lines Settings for BA8c_D&UPBO Band Profile
Table 16, Capabilities of Impulse Noise Protection
Table 17, Verification of the Function of Dual Latency
Table 18, Bitswap Test
Table 34, Longitudinal Conversion Loss (LCL) Test
Table 45, SES counter reporting test
Updates for Issue 1 Corrigendum 2 include corrections to:
Table 18, Bitswap Test
Table 23, SOS Test In The Downstream
Table 24, SOS Test In The Upstream
Table 32, Downstream Power Back-Off Test
Table 33, Upstream Power Back-Off Test
Table 38, MINSNRM Control Test
Table 45, SES counter reporting test
VDSL2 Functionality Test Plan TR-115 Issue 2
July 2012 © The Broadband Forum. All rights reserved 9 of 96
Updates for Issue 2 include:
Added Annex B 30a band profiles in Wideband Bitswap test
SOS extended to all band-profiles
PEIN test sequence included in TR-115_Issue-2.xls
The following tests were updated:
Table 18, Bitswap Test (now Table 20)
Table 22, Functional SRA Test
o Test expanded to
Table 25, Functional SRA Test – Downstream
Table 26, Functional SRA test – Upstream
Table 27, Functional SRA Test with DCID – Downstream
Table 28, Functional SRA Test with DCID – Upstream
Table 23, SOS Test In The Downstream (now Table 29)
Table 24, SOS Test In The Upstream (now Table 30)
Table 32, Downstream Power Back-Off Test (now Table 38)
Table 33, Upstream Power Back-Off Test (now Table 39)
Table 38, MINSNRM Control Test (Now Table 44)
Table 42, MAXNOMATP Control Test (now Table 48)
The following tests were added:
Table 41, VTU-R INM Tests
Table 42, VTU-R INM Capability
The following was removed:
Section 5.9, Virtual Noise Test
o Includes Table 36, Tranmitter Referred Virtual Noise Functionality Test
o At the time of publication it was agreed to include the test in the next issue of
TR-114, VDSL2 Performance Test Plan
VDSL2 Functionality Test Plan TR-115 Issue 2
July 2012 © The Broadband Forum. All rights reserved 10 of 96
1 Purpose and Scope
1.1 Purpose
This test plan describes a series of functionality tests that are used to verify that a VTU (VTU-O
or VTU-R) is functionally compliant to ITU-T Recommendation G.993.2 (Very High Speed
Subscriber Line transceiver 2). A VTU is functionally compliant to this test plan if it implements
correctly the required functions and features of the ITU-T Recommendation G.993.2. In addition
the VTU is functionally compliant if it implements the optional feature as specified in the
standard. TR-115 also defines tests for some of the VDSL2 optional features such as dual latency
and Seamless Rate Adaptation (SRA).
This functionality test plan does not specify the rate/reach performance requirements for VDSL2
transceiver. Instead, the reader is referred to TR-114 (VDSL2 performance test plan).
1.2 Scope
This test plan facilitates VDSL2 over POTS and over ISDN functional testing. This test plan
embodies operators' definitions of VDSL2 interoperability (between one VTU-O and one VTU-
R at a time). The test plan focuses on physical layer testing, and also validation and verification
of selected higher layer functionality. It does not replace operators' pre-deployment testing.
This test plan defines tests for various physical layer functionalities and some higher layer
functionalities. A pass/fail indication result is provided for each functionality test
NOTE - There is no requirement for VDSL2 VTUs to interoperate with G.993.1 (VDSL1)
VTUs.
VDSL2 Functionality Test Plan TR-115 Issue 2
July 2012 © The Broadband Forum. All rights reserved 11 of 96
2 References and Terminology
2.1 Conventions
In this Technical Report, several words are used to signify the requirements of the specification.
These words are always capitalized. More information can be found be in RFC 2119 [14].
SHALL This word, or the term “REQUIRED”, means that the definition is an
absolute requirement of the specification.
SHALL NOT This phrase means that the definition is an absolute prohibition of the
specification.
SHOULD This word, or the term “RECOMMENDED”, means that there could
exist valid reasons in particular circumstances to ignore this item, but
the full implications need to be understood and carefully weighed
before choosing a different course.
SHOULD NOT This phrase, or the phrase "NOT RECOMMENDED" means that there
could exist valid reasons in particular circumstances when the
particular behavior is acceptable or even useful, but the full
implications need to be understood and the case carefully weighed
before implementing any behavior described with this label.
MAY This word, or the term “OPTIONAL”, means that this item is one of
an allowed set of alternatives. An implementation that does not
include this option SHALL be prepared to inter-operate with another
implementation that does include the option.
VDSL2 Functionality Test Plan TR-115 Issue 2
July 2012 © The Broadband Forum. All rights reserved 12 of 96
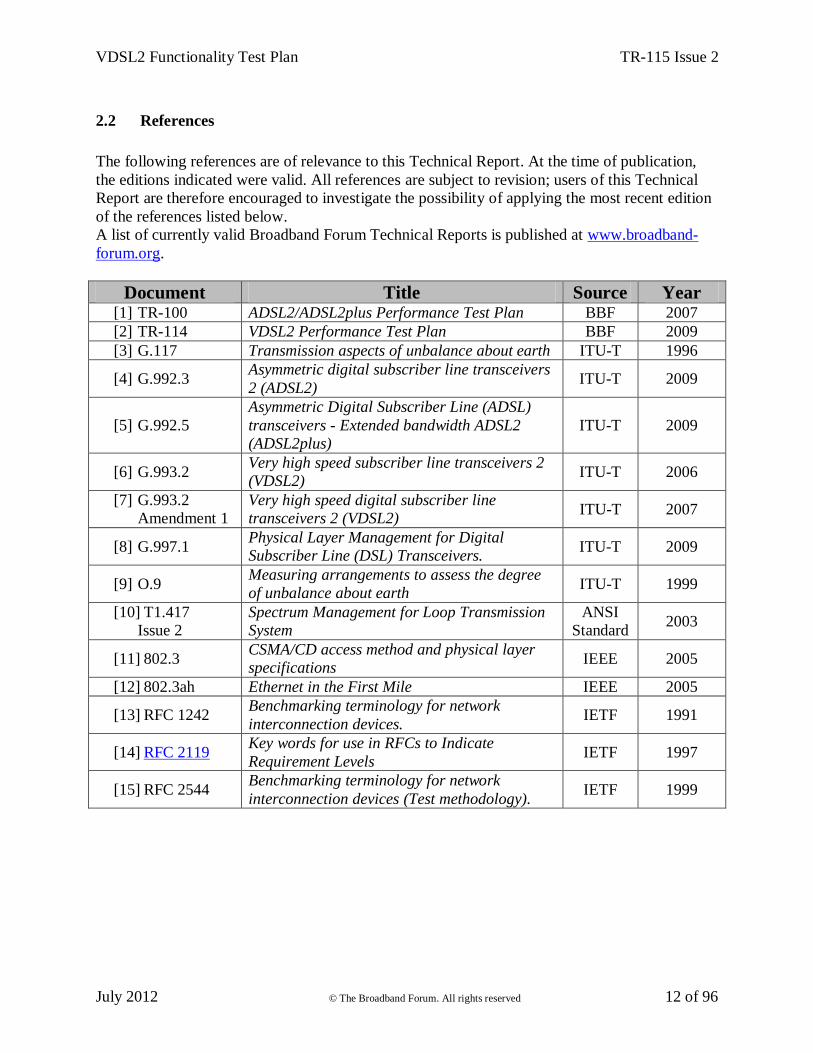
2.2 References
The following references are of relevance to this Technical Report. At the time of publication,
the editions indicated were valid. All references are subject to revision; users of this Technical
Report are therefore encouraged to investigate the possibility of applying the most recent edition
of the references listed below.
A list of currently valid Broadband Forum Technical Reports is published at www.broadband-
forum.org.
Document Title Source Year [1] TR-100 ADSL2/ADSL2plus Performance Test Plan BBF 2007
[2] TR-114 VDSL2 Performance Test Plan BBF 2009
[3] G.117 Transmission aspects of unbalance about earth ITU-T 1996
[4] G.992.3 Asymmetric digital subscriber line transceivers
2 (ADSL2) ITU-T 2009
[5] G.992.5
Asymmetric Digital Subscriber Line (ADSL)
transceivers - Extended bandwidth ADSL2
(ADSL2plus)
ITU-T 2009
[6] G.993.2 Very high speed subscriber line transceivers 2
(VDSL2) ITU-T 2006
[7] G.993.2
Amendment 1
Very high speed digital subscriber line
transceivers 2 (VDSL2) ITU-T 2007
[8] G.997.1 Physical Layer Management for Digital
Subscriber Line (DSL) Transceivers. ITU-T 2009
[9] O.9 Measuring arrangements to assess the degree
of unbalance about earth ITU-T 1999
[10] T1.417
Issue 2
Spectrum Management for Loop Transmission
System
ANSI
Standard 2003
[11] 802.3 CSMA/CD access method and physical layer
specifications IEEE 2005
[12] 802.3ah Ethernet in the First Mile IEEE 2005
[13] RFC 1242 Benchmarking terminology for network
interconnection devices. IETF 1991
[14] RFC 2119 Key words for use in RFCs to Indicate
Requirement Levels IETF 1997
[15] RFC 2544 Benchmarking terminology for network
interconnection devices (Test methodology). IETF 1999
VDSL2 Functionality Test Plan TR-115 Issue 2
July 2012 © The Broadband Forum. All rights reserved 13 of 96
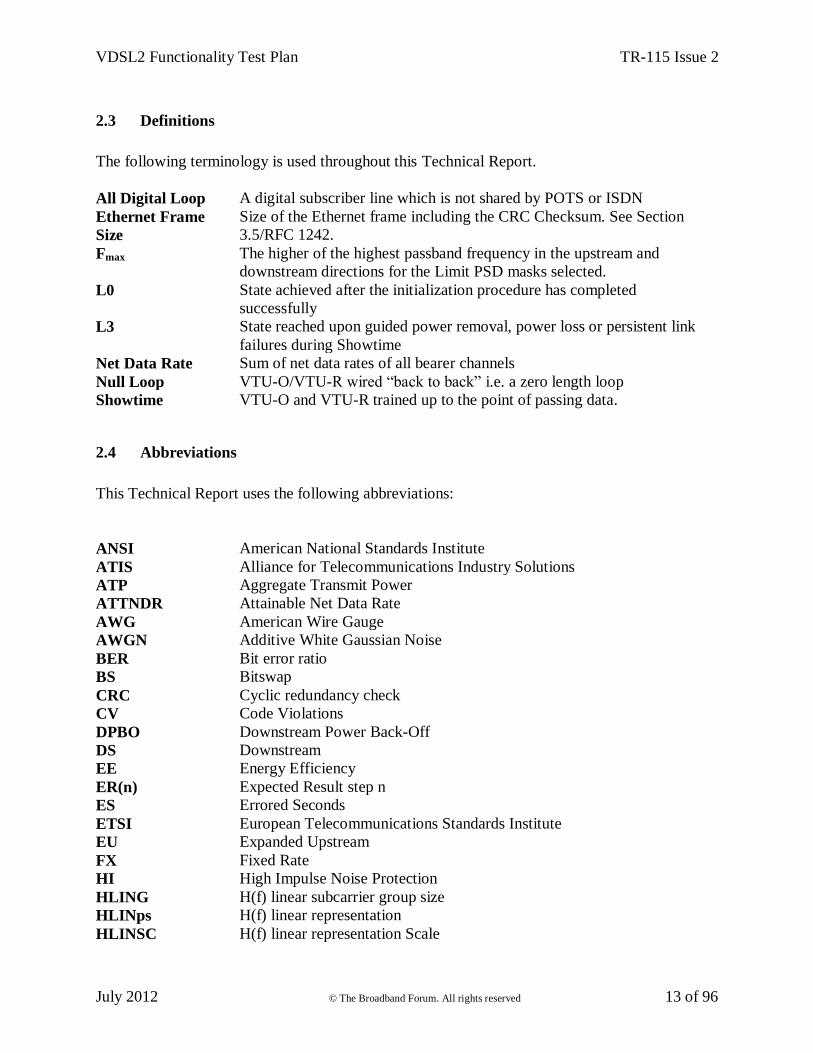
2.3 Definitions
The following terminology is used throughout this Technical Report.
All Digital Loop A digital subscriber line which is not shared by POTS or ISDN
Ethernet Frame
Size
Size of the Ethernet frame including the CRC Checksum. See Section
3.5/RFC 1242.
Fmax The higher of the highest passband frequency in the upstream and
downstream directions for the Limit PSD masks selected.
L0 State achieved after the initialization procedure has completed
successfully
L3 State reached upon guided power removal, power loss or persistent link
failures during Showtime
Net Data Rate Sum of net data rates of all bearer channels
Null Loop VTU-O/VTU-R wired “back to back” i.e. a zero length loop
Showtime VTU-O and VTU-R trained up to the point of passing data.
2.4 Abbreviations
This Technical Report uses the following abbreviations:
ANSI American National Standards Institute
ATIS Alliance for Telecommunications Industry Solutions
ATP Aggregate Transmit Power
ATTNDR Attainable Net Data Rate
AWG American Wire Gauge
AWGN Additive White Gaussian Noise
BER Bit error ratio
BS Bitswap
CRC Cyclic redundancy check
CV Code Violations
DPBO Downstream Power Back-Off
DS Downstream
EE Energy Efficiency
ER(n) Expected Result step n
ES Errored Seconds
ETSI European Telecommunications Standards Institute
EU Expanded Upstream
FX Fixed Rate
HI High Impulse Noise Protection
HLING H(f) linear subcarrier group size
HLINps H(f) linear representation
HLINSC H(f) linear representation Scale
VDSL2 Functionality Test Plan TR-115 Issue 2
July 2012 © The Broadband Forum. All rights reserved 14 of 96
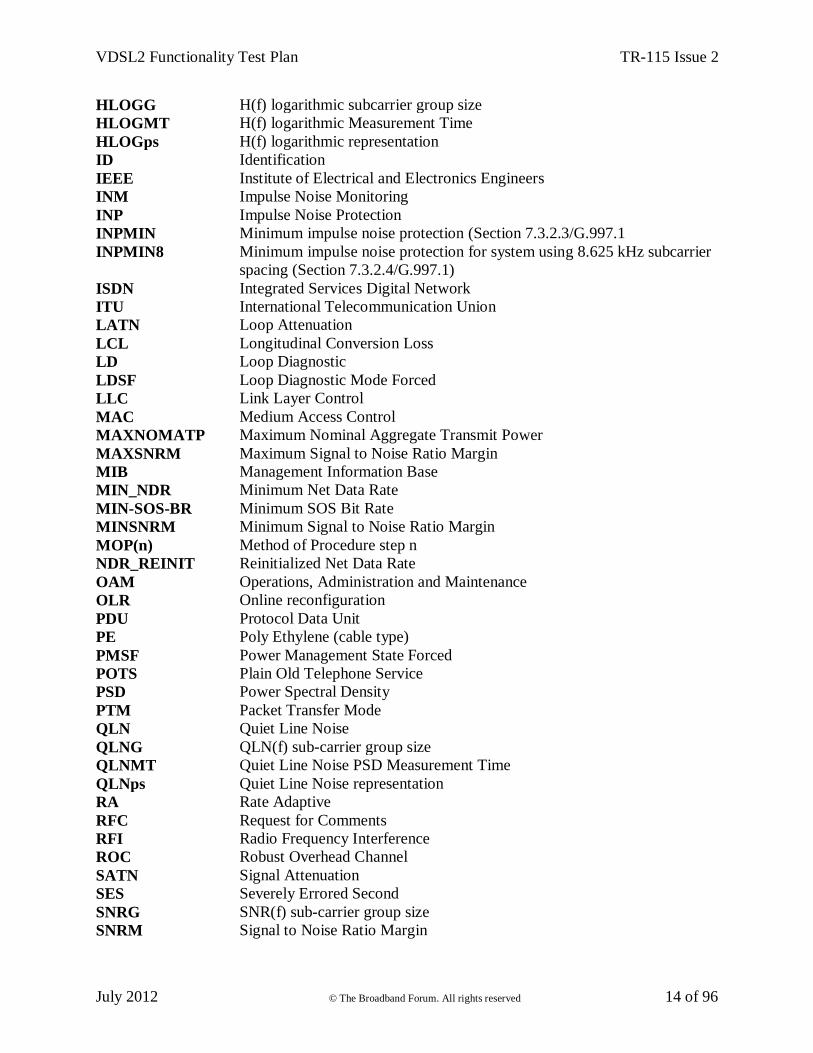
HLOGG H(f) logarithmic subcarrier group size
HLOGMT H(f) logarithmic Measurement Time
HLOGps H(f) logarithmic representation
ID Identification
IEEE Institute of Electrical and Electronics Engineers
INM Impulse Noise Monitoring
INP Impulse Noise Protection
INPMIN Minimum impulse noise protection (Section 7.3.2.3/G.997.1
INPMIN8 Minimum impulse noise protection for system using 8.625 kHz subcarrier
spacing (Section 7.3.2.4/G.997.1)
ISDN Integrated Services Digital Network
ITU International Telecommunication Union
LATN Loop Attenuation
LCL Longitudinal Conversion Loss
LD Loop Diagnostic
LDSF Loop Diagnostic Mode Forced
LLC Link Layer Control
MAC Medium Access Control
MAXNOMATP Maximum Nominal Aggregate Transmit Power
MAXSNRM Maximum Signal to Noise Ratio Margin
MIB Management Information Base
MIN_NDR Minimum Net Data Rate
MIN-SOS-BR Minimum SOS Bit Rate
MINSNRM Minimum Signal to Noise Ratio Margin
MOP(n) Method of Procedure step n
NDR_REINIT Reinitialized Net Data Rate
OAM Operations, Administration and Maintenance
OLR Online reconfiguration
PDU Protocol Data Unit
PE Poly Ethylene (cable type)
PMSF Power Management State Forced
POTS Plain Old Telephone Service
PSD Power Spectral Density
PTM Packet Transfer Mode
QLN Quiet Line Noise
QLNG QLN(f) sub-carrier group size
QLNMT Quiet Line Noise PSD Measurement Time
QLNps Quiet Line Noise representation
RA Rate Adaptive
RFC Request for Comments
RFI Radio Frequency Interference
ROC Robust Overhead Channel
SATN Signal Attenuation
SES Severely Errored Second
SNRG SNR(f) sub-carrier group size
SNRM Signal to Noise Ratio Margin
VDSL2 Functionality Test Plan TR-115 Issue 2
July 2012 © The Broadband Forum. All rights reserved 15 of 96
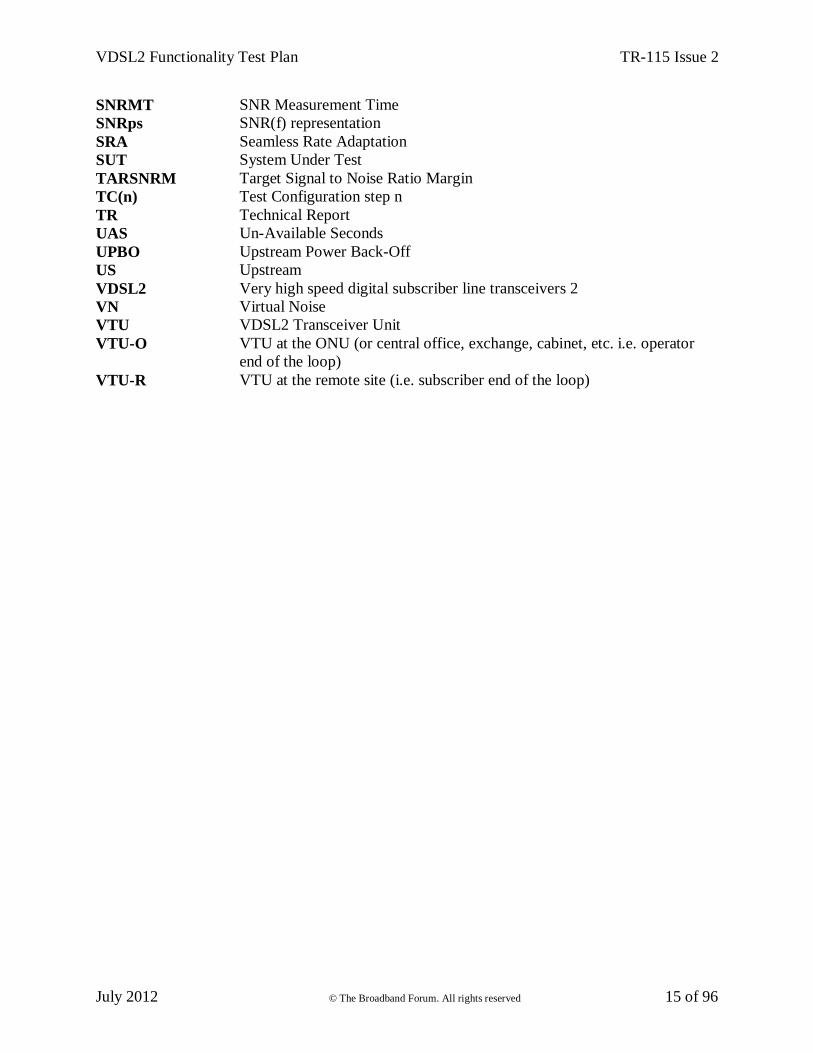
SNRMT SNR Measurement Time
SNRps SNR(f) representation
SRA Seamless Rate Adaptation
SUT System Under Test
TARSNRM Target Signal to Noise Ratio Margin
TC(n) Test Configuration step n
TR Technical Report
UAS Un-Available Seconds
UPBO Upstream Power Back-Off
US Upstream
VDSL2 Very high speed digital subscriber line transceivers 2
VN Virtual Noise
VTU VDSL2 Transceiver Unit
VTU-O VTU at the ONU (or central office, exchange, cabinet, etc. i.e. operator
end of the loop)
VTU-R VTU at the remote site (i.e. subscriber end of the loop)
VDSL2 Functionality Test Plan TR-115 Issue 2
July 2012 © The Broadband Forum. All rights reserved 16 of 96
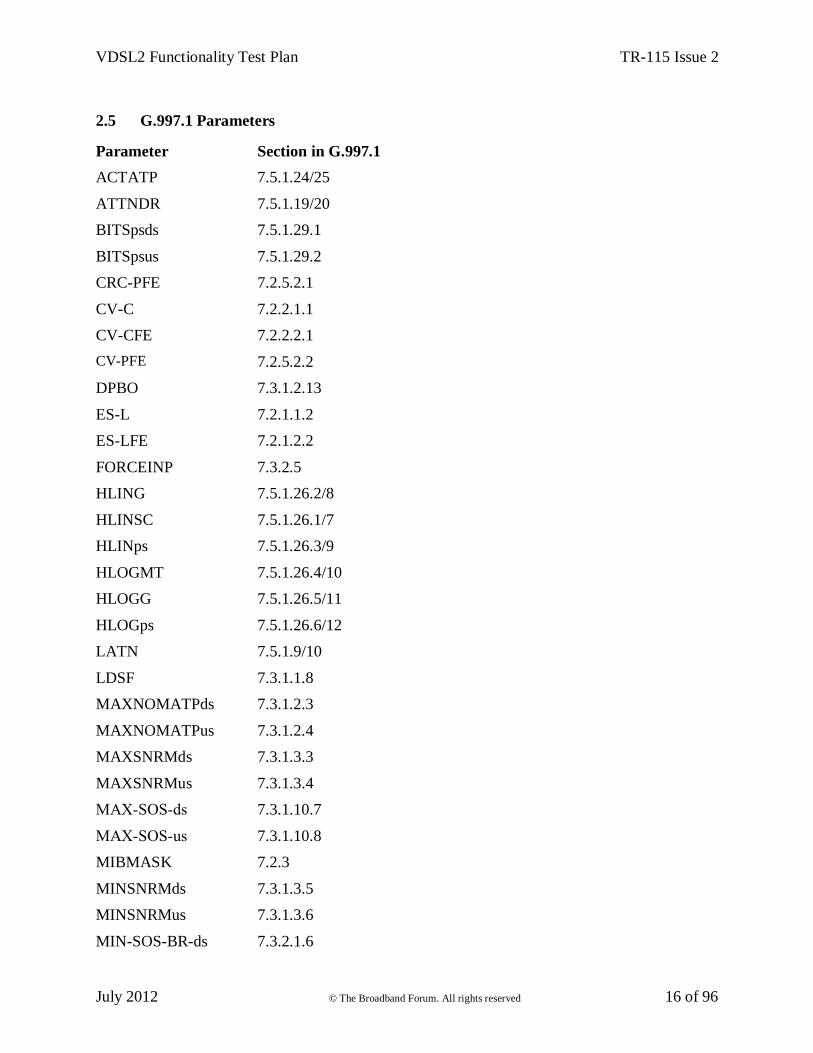
2.5 G.997.1 Parameters
Parameter Section in G.997.1
ACTATP 7.5.1.24/25
ATTNDR 7.5.1.19/20
BITSpsds 7.5.1.29.1
BITSpsus 7.5.1.29.2
CRC-PFE 7.2.5.2.1
CV-C 7.2.2.1.1
CV-CFE 7.2.2.2.1
CV-PFE 7.2.5.2.2
DPBO 7.3.1.2.13
ES-L 7.2.1.1.2
ES-LFE 7.2.1.2.2
FORCEINP 7.3.2.5
HLING 7.5.1.26.2/8
HLINSC 7.5.1.26.1/7
HLINps 7.5.1.26.3/9
HLOGMT 7.5.1.26.4/10
HLOGG 7.5.1.26.5/11
HLOGps 7.5.1.26.6/12
LATN 7.5.1.9/10
LDSF 7.3.1.1.8
MAXNOMATPds 7.3.1.2.3
MAXNOMATPus 7.3.1.2.4
MAXSNRMds 7.3.1.3.3
MAXSNRMus 7.3.1.3.4
MAX-SOS-ds 7.3.1.10.7
MAX-SOS-us 7.3.1.10.8
MIBMASK 7.2.3
MINSNRMds 7.3.1.3.5
MINSNRMus 7.3.1.3.6
MIN-SOS-BR-ds 7.3.2.1.6
VDSL2 Functionality Test Plan TR-115 Issue 2
July 2012 © The Broadband Forum. All rights reserved 17 of 96
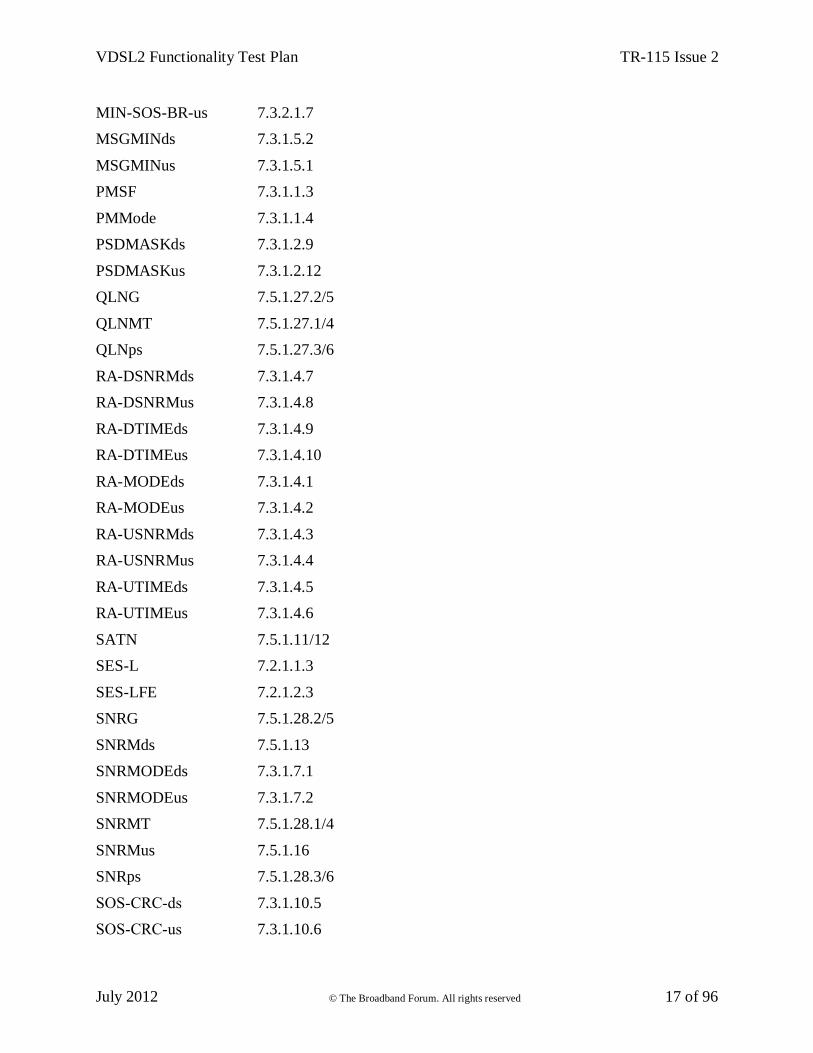
MIN-SOS-BR-us 7.3.2.1.7
MSGMINds 7.3.1.5.2
MSGMINus 7.3.1.5.1
PMSF 7.3.1.1.3
PMMode 7.3.1.1.4
PSDMASKds 7.3.1.2.9
PSDMASKus 7.3.1.2.12
QLNG 7.5.1.27.2/5
QLNMT 7.5.1.27.1/4
QLNps 7.5.1.27.3/6
RA-DSNRMds 7.3.1.4.7
RA-DSNRMus 7.3.1.4.8
RA-DTIMEds 7.3.1.4.9
RA-DTIMEus 7.3.1.4.10
RA-MODEds 7.3.1.4.1
RA-MODEus 7.3.1.4.2
RA-USNRMds 7.3.1.4.3
RA-USNRMus 7.3.1.4.4
RA-UTIMEds 7.3.1.4.5
RA-UTIMEus 7.3.1.4.6
SATN 7.5.1.11/12
SES-L 7.2.1.1.3
SES-LFE 7.2.1.2.3
SNRG 7.5.1.28.2/5
SNRMds 7.5.1.13
SNRMODEds 7.3.1.7.1
SNRMODEus 7.3.1.7.2
SNRMT 7.5.1.28.1/4
SNRMus 7.5.1.16
SNRps 7.5.1.28.3/6
SOS-CRC-ds 7.3.1.10.5
SOS-CRC-us 7.3.1.10.6
VDSL2 Functionality Test Plan TR-115 Issue 2
July 2012 © The Broadband Forum. All rights reserved 18 of 96
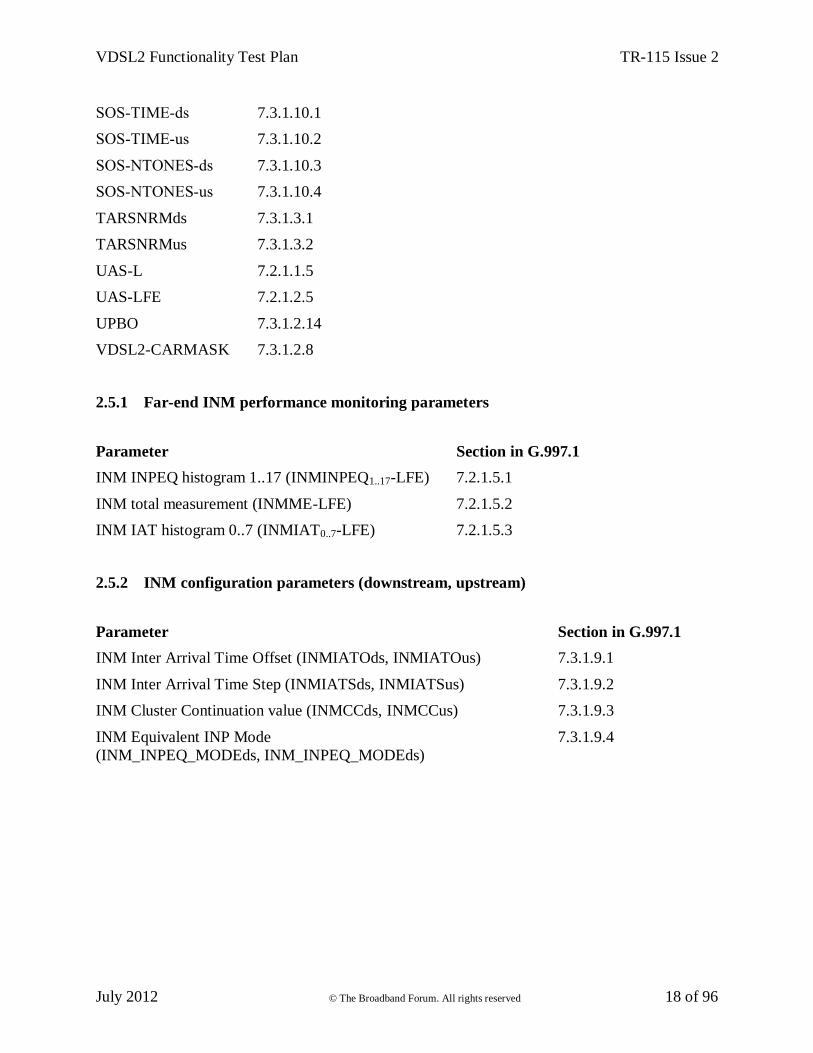
SOS-TIME-ds 7.3.1.10.1
SOS-TIME-us 7.3.1.10.2
SOS-NTONES-ds 7.3.1.10.3
SOS-NTONES-us 7.3.1.10.4
TARSNRMds 7.3.1.3.1
TARSNRMus 7.3.1.3.2
UAS-L 7.2.1.1.5
UAS-LFE 7.2.1.2.5
UPBO 7.3.1.2.14
VDSL2-CARMASK 7.3.1.2.8
2.5.1 Far-end INM performance monitoring parameters
Parameter Section in G.997.1
INM INPEQ histogram 1..17 (INMINPEQ1..17-LFE) 7.2.1.5.1
INM total measurement (INMME-LFE) 7.2.1.5.2
INM IAT histogram 0..7 (INMIAT0..7-LFE) 7.2.1.5.3
2.5.2 INM configuration parameters (downstream, upstream)
Parameter Section in G.997.1
INM Inter Arrival Time Offset (INMIATOds, INMIATOus) 7.3.1.9.1
INM Inter Arrival Time Step (INMIATSds, INMIATSus) 7.3.1.9.2
INM Cluster Continuation value (INMCCds, INMCCus) 7.3.1.9.3
INM Equivalent INP Mode
(INM_INPEQ_MODEds, INM_INPEQ_MODEds)
7.3.1.9.4
VDSL2 Functionality Test Plan TR-115 Issue 2
July 2012 © The Broadband Forum. All rights reserved 19 of 96
3 Technical Report Impact
3.1 Energy Efficiency
TR-115 has no impact on Energy Efficiency.
3.2 IPv6
TR-115 has no impact on IPv6.
3.3 Security
TR-115 has no impact on Security.
3.4 Privacy
Any issues regarding privacy are not affected by TR-115.
VDSL2 Functionality Test Plan TR-115 Issue 2
July 2012 © The Broadband Forum. All rights reserved 20 of 96
4 Test Structure
This section contains all the specifications and information required for building the basic testing
environment (e.g. test configurations, setup of the simulated network environment, main settings
of the equipment under test) for VDSL2 test cases defined in this test plan. Different
configurations and settings needed for specific test cases are defined in the related section.
VDSL2 Functionality Test Plan TR-115 Issue 2
July 2012 © The Broadband Forum. All rights reserved 21 of 96
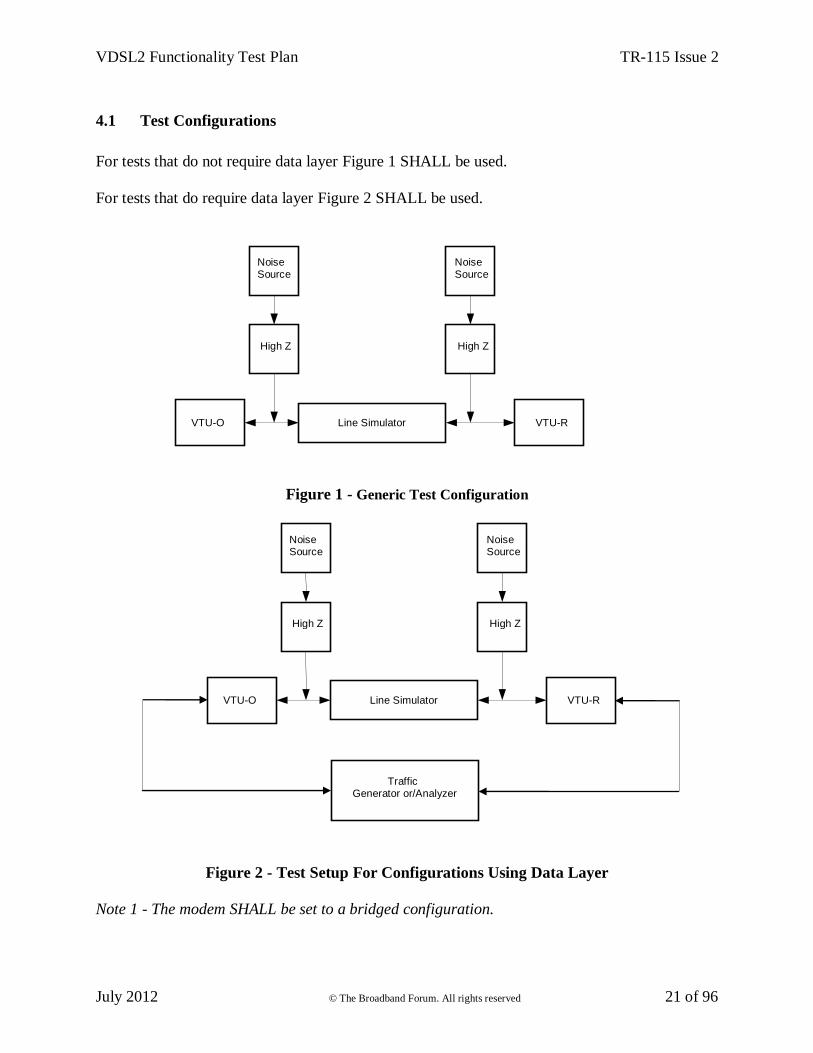
4.1 Test Configurations
For tests that do not require data layer Figure 1 SHALL be used.
For tests that do require data layer Figure 2 SHALL be used.
Figure 1 - Generic Test Configuration
Figure 2 - Test Setup For Configurations Using Data Layer
Note 1 - The modem SHALL be set to a bridged configuration.
Line Simulator
High Z
Noise Source
High Z
Noise Source
VTU-O VTU-R
Traffic Generator or/Analyzer
Line Simulator
High Z
Noise Source
High Z
Noise Source
VTU-O VTU-R
VDSL2 Functionality Test Plan TR-115 Issue 2
July 2012 © The Broadband Forum. All rights reserved 22 of 96
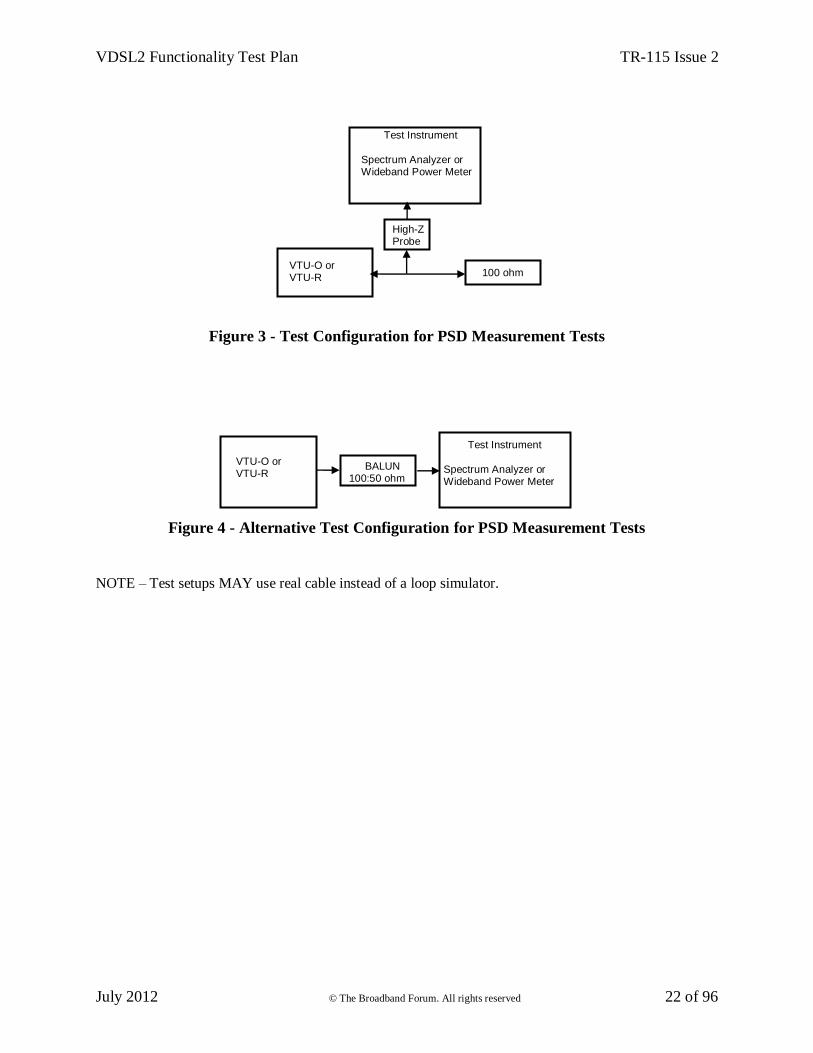
Figure 3 - Test Configuration for PSD Measurement Tests
Figure 4 - Alternative Test Configuration for PSD Measurement Tests
NOTE – Test setups MAY use real cable instead of a loop simulator.
VTU-O or VTU-R
BALUN 100:50 ohm
Test Instrument
Spectrum Analyzer or Wideband Power Meter
VTU-O or VTU-R 100 ohm
Test Instrument
Spectrum Analyzer or Wideband Power Meter
High-Z Probe
VDSL2 Functionality Test Plan TR-115 Issue 2
July 2012 © The Broadband Forum. All rights reserved 23 of 96
4.2 System Under Test Settings
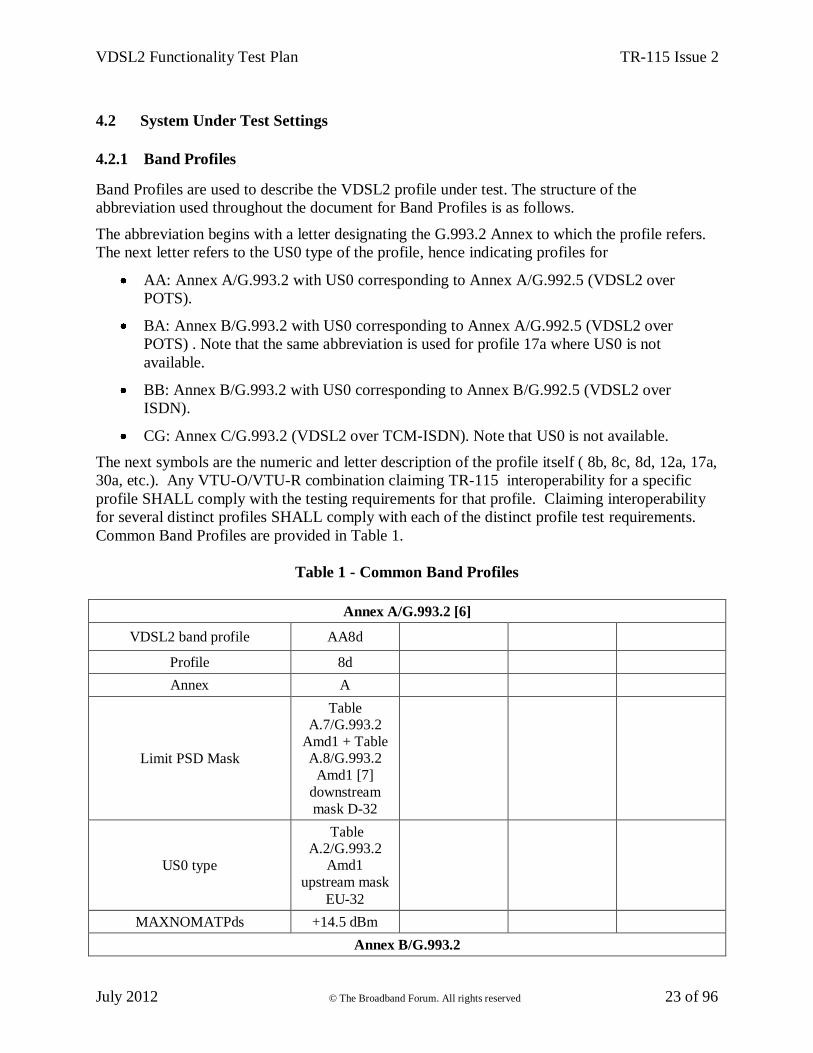
4.2.1 Band Profiles
Band Profiles are used to describe the VDSL2 profile under test. The structure of the
abbreviation used throughout the document for Band Profiles is as follows.
The abbreviation begins with a letter designating the G.993.2 Annex to which the profile refers.
The next letter refers to the US0 type of the profile, hence indicating profiles for
AA: Annex A/G.993.2 with US0 corresponding to Annex A/G.992.5 (VDSL2 over
POTS).
BA: Annex B/G.993.2 with US0 corresponding to Annex A/G.992.5 (VDSL2 over
POTS) . Note that the same abbreviation is used for profile 17a where US0 is not
available.
BB: Annex B/G.993.2 with US0 corresponding to Annex B/G.992.5 (VDSL2 over
ISDN).
CG: Annex C/G.993.2 (VDSL2 over TCM-ISDN). Note that US0 is not available.
The next symbols are the numeric and letter description of the profile itself ( 8b, 8c, 8d, 12a, 17a,
30a, etc.). Any VTU-O/VTU-R combination claiming TR-115 interoperability for a specific
profile SHALL comply with the testing requirements for that profile. Claiming interoperability
for several distinct profiles SHALL comply with each of the distinct profile test requirements.
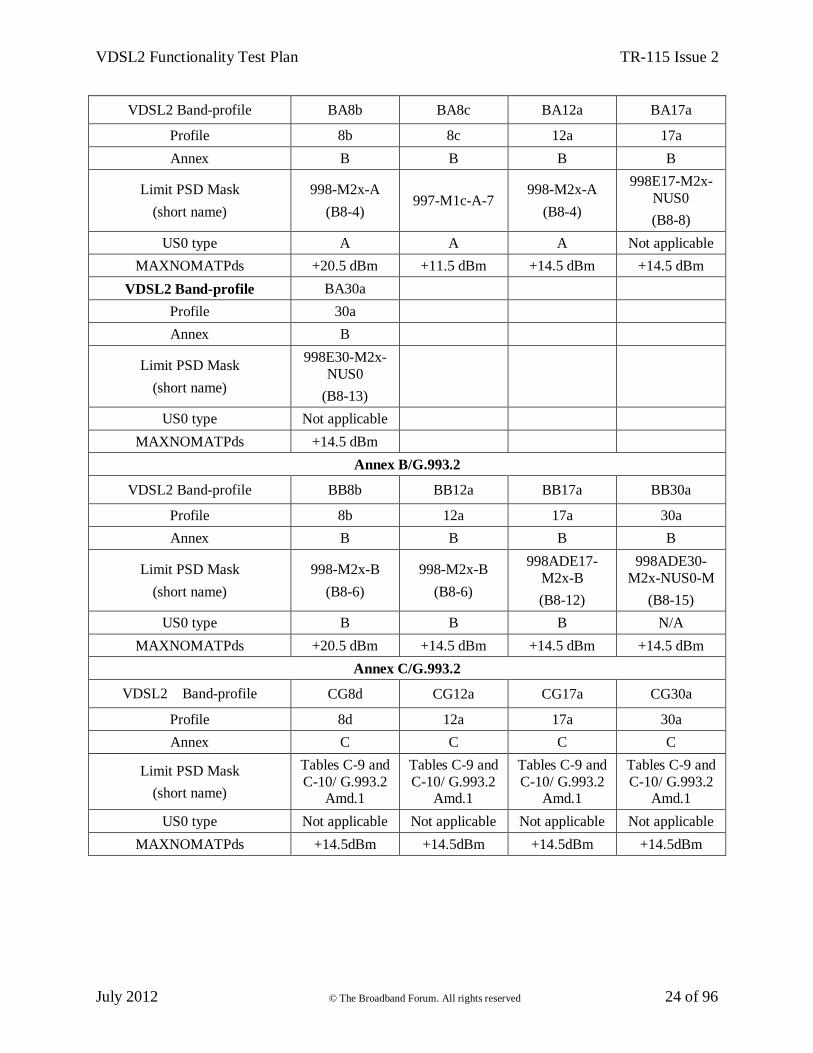
Common Band Profiles are provided in Table 1.
Table 1 - Common Band Profiles
Annex A/G.993.2 [6]
VDSL2 band profile AA8d
Profile 8d
Annex A
Limit PSD Mask
Table A.7/G.993.2
Amd1 + Table A.8/G.993.2
Amd1 [7]
downstream
mask D-32
US0 type
Table A.2/G.993.2
Amd1
upstream mask
EU-32
MAXNOMATPds +14.5 dBm
Annex B/G.993.2
VDSL2 Functionality Test Plan TR-115 Issue 2
July 2012 © The Broadband Forum. All rights reserved 24 of 96
VDSL2 Band-profile BA8b BA8c BA12a BA17a
Profile 8b 8c 12a 17a
Annex B B B B
Limit PSD Mask
(short name)
998-M2x-A
(B8-4) 997-M1c-A-7
998-M2x-A
(B8-4)
998E17-M2x-
NUS0
(B8-8)
US0 type A A A Not applicable
MAXNOMATPds +20.5 dBm +11.5 dBm +14.5 dBm +14.5 dBm
VDSL2 Band-profile BA30a
Profile 30a
Annex B
Limit PSD Mask
(short name)
998E30-M2x-
NUS0
(B8-13)
US0 type Not applicable
MAXNOMATPds +14.5 dBm
Annex B/G.993.2
VDSL2 Band-profile BB8b BB12a BB17a BB30a
Profile 8b 12a 17a 30a
Annex B B B B
Limit PSD Mask
(short name)
998-M2x-B
(B8-6)
998-M2x-B
(B8-6)
998ADE17-
M2x-B
(B8-12)
998ADE30-
M2x-NUS0-M
(B8-15)
US0 type B B B N/A
MAXNOMATPds +20.5 dBm +14.5 dBm +14.5 dBm +14.5 dBm
Annex C/G.993.2
VDSL2 Band-profile CG8d CG12a CG17a CG30a
Profile 8d 12a 17a 30a
Annex C C C C
Limit PSD Mask
(short name)
Tables C-9 and
C-10/ G.993.2 Amd.1
Tables C-9 and
C-10/ G.993.2 Amd.1
Tables C-9 and
C-10/ G.993.2 Amd.1
Tables C-9 and
C-10/ G.993.2 Amd.1
US0 type Not applicable Not applicable Not applicable Not applicable
MAXNOMATPds +14.5dBm +14.5dBm +14.5dBm +14.5dBm
VDSL2 Functionality Test Plan TR-115 Issue 2
July 2012 © The Broadband Forum. All rights reserved 25 of 96
4.2.2 Line Settings
4.2.2.1 Common Line Settings
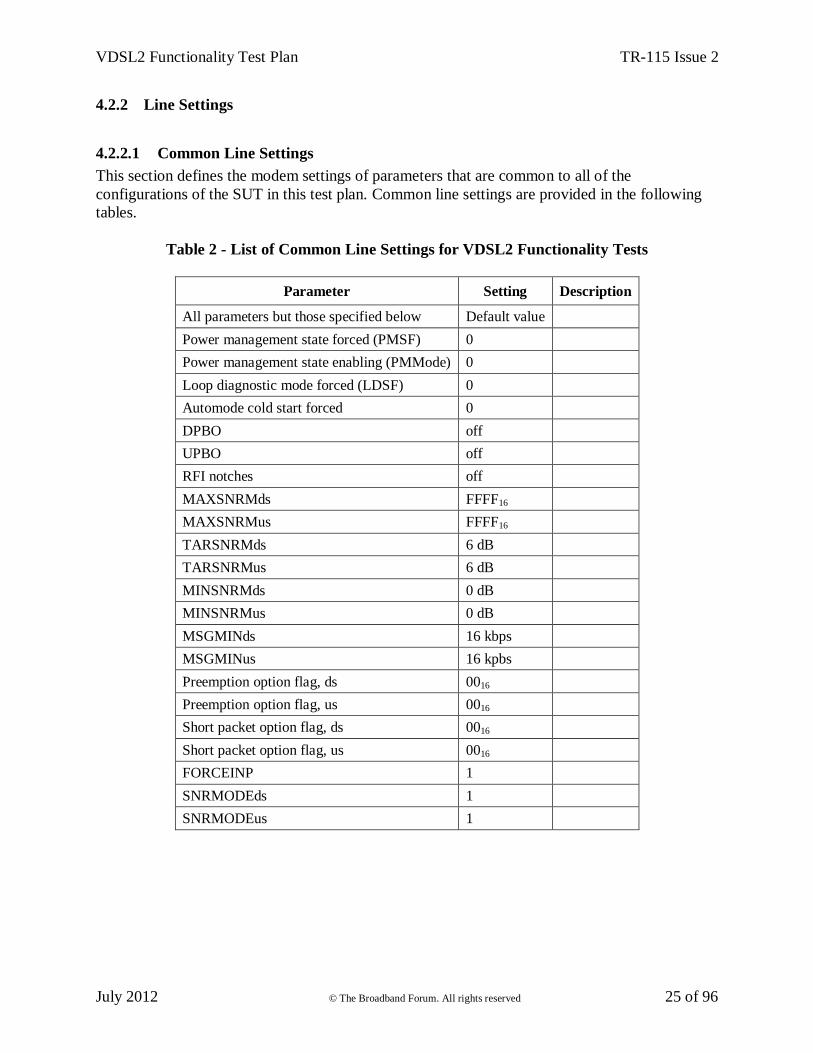
This section defines the modem settings of parameters that are common to all of the
configurations of the SUT in this test plan. Common line settings are provided in the following
tables.
Table 2 - List of Common Line Settings for VDSL2 Functionality Tests
Parameter Setting Description
All parameters but those specified below Default value
Power management state forced (PMSF) 0
Power management state enabling (PMMode) 0
Loop diagnostic mode forced (LDSF) 0
Automode cold start forced 0
DPBO off
UPBO off
RFI notches off
MAXSNRMds FFFF16
MAXSNRMus FFFF16
TARSNRMds 6 dB
TARSNRMus 6 dB
MINSNRMds 0 dB
MINSNRMus 0 dB
MSGMINds 16 kbps
MSGMINus 16 kpbs
Preemption option flag, ds 0016
Preemption option flag, us 0016
Short packet option flag, ds 0016
Short packet option flag, us 0016
FORCEINP 1
SNRMODEds 1
SNRMODEus 1
VDSL2 Functionality Test Plan TR-115 Issue 2
July 2012 © The Broadband Forum. All rights reserved 26 of 96
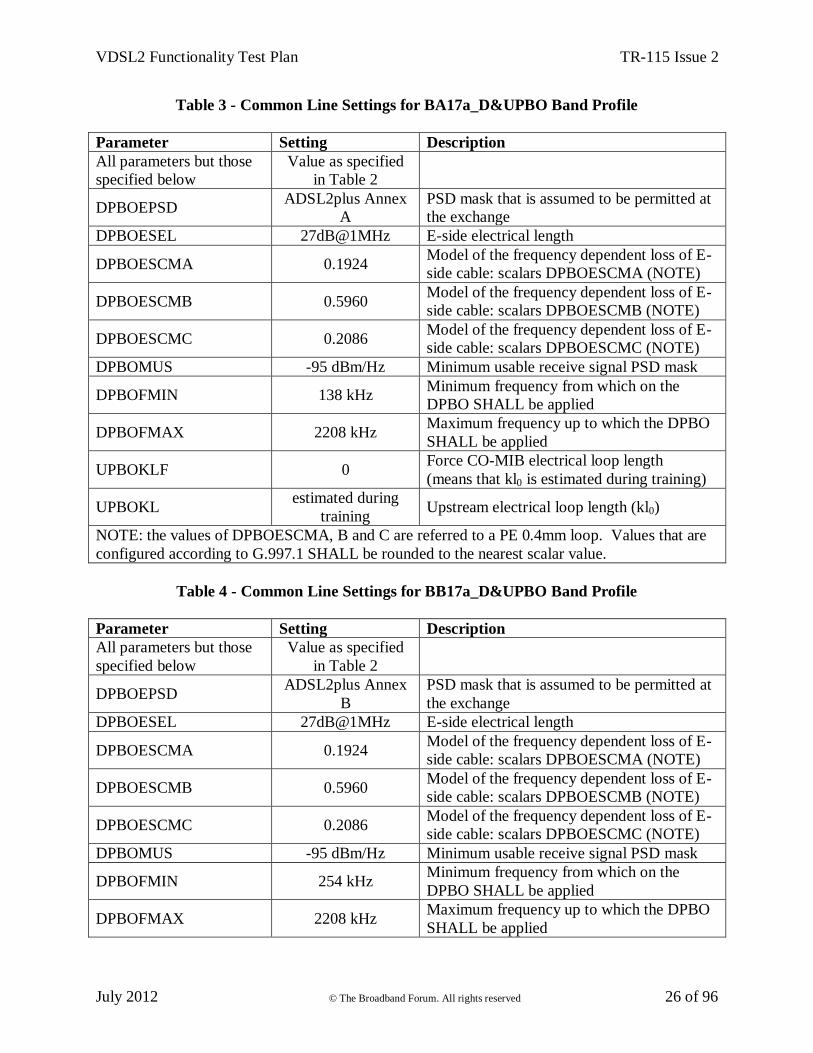
Table 3 - Common Line Settings for BA17a_D&UPBO Band Profile
Parameter Setting Description
All parameters but those
specified below
Value as specified
in Table 2
DPBOEPSD ADSL2plus Annex
A
PSD mask that is assumed to be permitted at
the exchange
DPBOESEL 27dB@1MHz E-side electrical length
DPBOESCMA 0.1924 Model of the frequency dependent loss of E-
side cable: scalars DPBOESCMA (NOTE)
DPBOESCMB 0.5960 Model of the frequency dependent loss of E-
side cable: scalars DPBOESCMB (NOTE)
DPBOESCMC 0.2086 Model of the frequency dependent loss of E-
side cable: scalars DPBOESCMC (NOTE)
DPBOMUS -95 dBm/Hz Minimum usable receive signal PSD mask
DPBOFMIN 138 kHz Minimum frequency from which on the
DPBO SHALL be applied
DPBOFMAX 2208 kHz Maximum frequency up to which the DPBO
SHALL be applied
UPBOKLF 0 Force CO-MIB electrical loop length
(means that kl0 is estimated during training)
UPBOKL estimated during
training Upstream electrical loop length (kl0)
NOTE: the values of DPBOESCMA, B and C are referred to a PE 0.4mm loop. Values that are
configured according to G.997.1 SHALL be rounded to the nearest scalar value.
Table 4 - Common Line Settings for BB17a_D&UPBO Band Profile
Parameter Setting Description
All parameters but those
specified below
Value as specified
in Table 2
DPBOEPSD ADSL2plus Annex
B
PSD mask that is assumed to be permitted at
the exchange
DPBOESEL 27dB@1MHz E-side electrical length
DPBOESCMA 0.1924 Model of the frequency dependent loss of E-
side cable: scalars DPBOESCMA (NOTE)
DPBOESCMB 0.5960 Model of the frequency dependent loss of E-
side cable: scalars DPBOESCMB (NOTE)
DPBOESCMC 0.2086 Model of the frequency dependent loss of E-
side cable: scalars DPBOESCMC (NOTE)
DPBOMUS -95 dBm/Hz Minimum usable receive signal PSD mask
DPBOFMIN 254 kHz Minimum frequency from which on the
DPBO SHALL be applied
DPBOFMAX 2208 kHz Maximum frequency up to which the DPBO
SHALL be applied
VDSL2 Functionality Test Plan TR-115 Issue 2
July 2012 © The Broadband Forum. All rights reserved 27 of 96
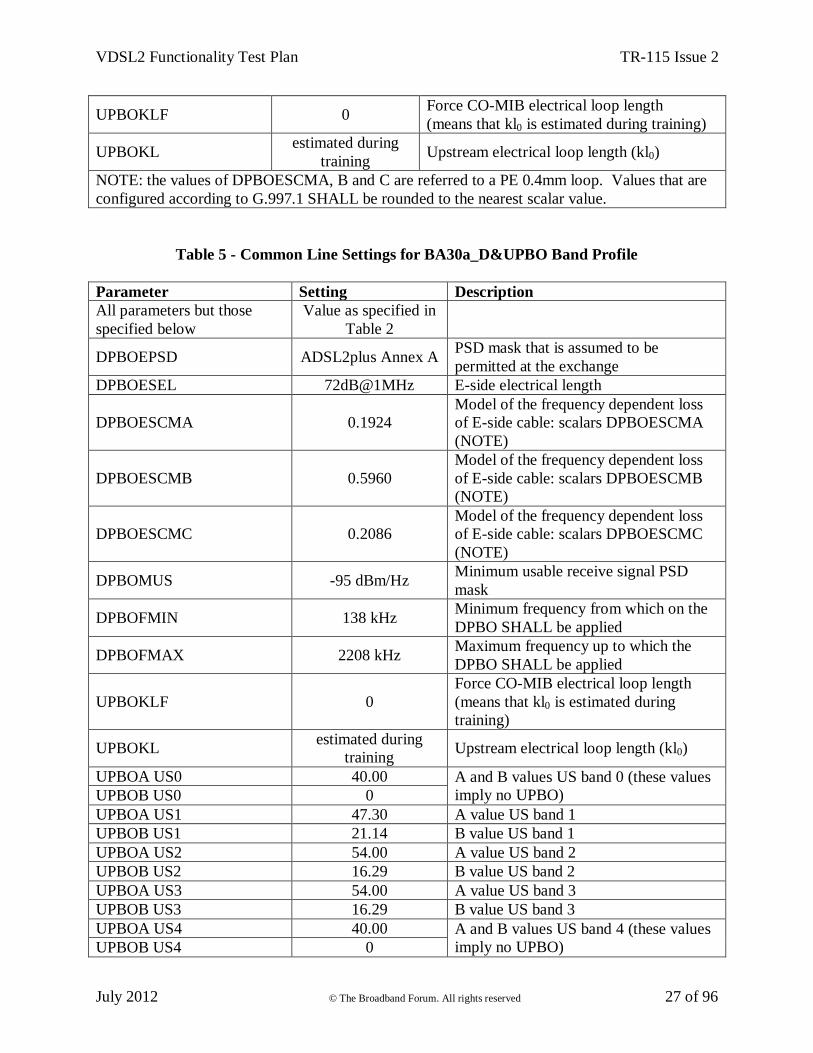
UPBOKLF 0 Force CO-MIB electrical loop length
(means that kl0 is estimated during training)
UPBOKL estimated during
training Upstream electrical loop length (kl0)
NOTE: the values of DPBOESCMA, B and C are referred to a PE 0.4mm loop. Values that are
configured according to G.997.1 SHALL be rounded to the nearest scalar value.
Table 5 - Common Line Settings for BA30a_D&UPBO Band Profile
Parameter Setting Description
All parameters but those
specified below
Value as specified in
Table 2
DPBOEPSD ADSL2plus Annex A PSD mask that is assumed to be
permitted at the exchange
DPBOESEL 72dB@1MHz E-side electrical length
DPBOESCMA 0.1924
Model of the frequency dependent loss
of E-side cable: scalars DPBOESCMA
(NOTE)
DPBOESCMB 0.5960
Model of the frequency dependent loss
of E-side cable: scalars DPBOESCMB
(NOTE)
DPBOESCMC 0.2086
Model of the frequency dependent loss
of E-side cable: scalars DPBOESCMC
(NOTE)
DPBOMUS -95 dBm/Hz Minimum usable receive signal PSD
mask
DPBOFMIN 138 kHz Minimum frequency from which on the
DPBO SHALL be applied
DPBOFMAX 2208 kHz Maximum frequency up to which the
DPBO SHALL be applied
UPBOKLF 0
Force CO-MIB electrical loop length
(means that kl0 is estimated during
training)
UPBOKL estimated during
training Upstream electrical loop length (kl0)
UPBOA US0 40.00 A and B values US band 0 (these values
imply no UPBO) UPBOB US0 0
UPBOA US1 47.30 A value US band 1
UPBOB US1 21.14 B value US band 1
UPBOA US2 54.00 A value US band 2
UPBOB US2 16.29 B value US band 2
UPBOA US3 54.00 A value US band 3
UPBOB US3 16.29 B value US band 3
UPBOA US4 40.00 A and B values US band 4 (these values
imply no UPBO) UPBOB US4 0
VDSL2 Functionality Test Plan TR-115 Issue 2
July 2012 © The Broadband Forum. All rights reserved 28 of 96
NOTE: the values of DPBOESCMA, B and C are referred to a PE 0.4mm loop. Values that are
configured according to G.997.1 SHALL be rounded to the nearest scalar value.
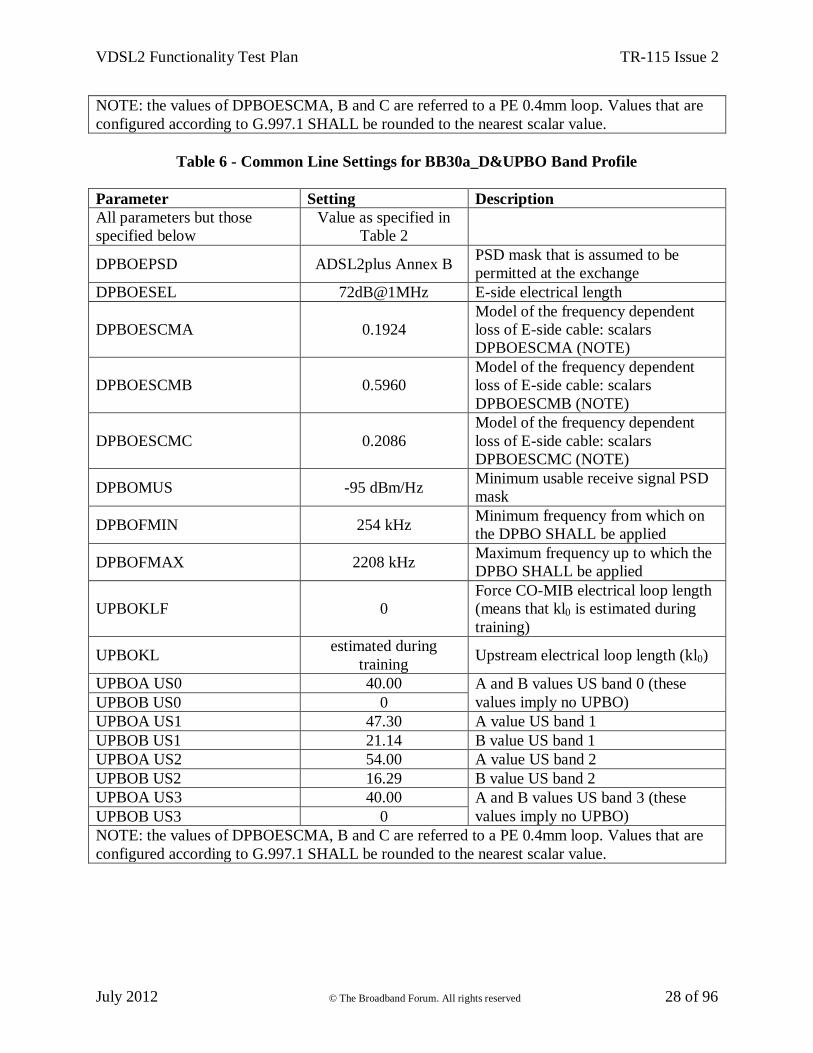
Table 6 - Common Line Settings for BB30a_D&UPBO Band Profile
Parameter Setting Description
All parameters but those
specified below
Value as specified in
Table 2
DPBOEPSD ADSL2plus Annex B PSD mask that is assumed to be
permitted at the exchange
DPBOESEL 72dB@1MHz E-side electrical length
DPBOESCMA 0.1924
Model of the frequency dependent
loss of E-side cable: scalars
DPBOESCMA (NOTE)
DPBOESCMB 0.5960
Model of the frequency dependent
loss of E-side cable: scalars
DPBOESCMB (NOTE)
DPBOESCMC 0.2086
Model of the frequency dependent
loss of E-side cable: scalars
DPBOESCMC (NOTE)
DPBOMUS -95 dBm/Hz Minimum usable receive signal PSD
mask
DPBOFMIN 254 kHz Minimum frequency from which on
the DPBO SHALL be applied
DPBOFMAX 2208 kHz Maximum frequency up to which the
DPBO SHALL be applied
UPBOKLF 0
Force CO-MIB electrical loop length
(means that kl0 is estimated during
training)
UPBOKL estimated during
training Upstream electrical loop length (kl0)
UPBOA US0 40.00 A and B values US band 0 (these
values imply no UPBO) UPBOB US0 0
UPBOA US1 47.30 A value US band 1
UPBOB US1 21.14 B value US band 1
UPBOA US2 54.00 A value US band 2
UPBOB US2 16.29 B value US band 2
UPBOA US3 40.00 A and B values US band 3 (these
values imply no UPBO) UPBOB US3 0
NOTE: the values of DPBOESCMA, B and C are referred to a PE 0.4mm loop. Values that are
configured according to G.997.1 SHALL be rounded to the nearest scalar value.
VDSL2 Functionality Test Plan TR-115 Issue 2
July 2012 © The Broadband Forum. All rights reserved 29 of 96
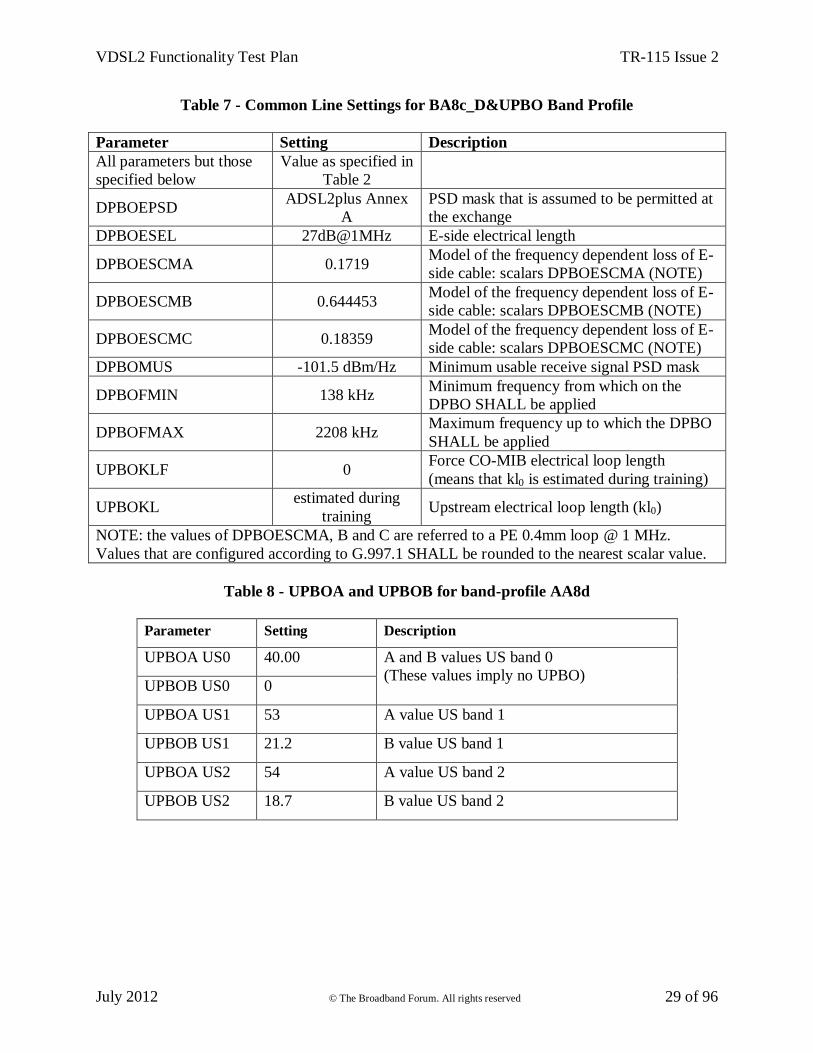
Table 7 - Common Line Settings for BA8c_D&UPBO Band Profile
Parameter Setting Description
All parameters but those
specified below
Value as specified in
Table 2
DPBOEPSD ADSL2plus Annex
A
PSD mask that is assumed to be permitted at
the exchange
DPBOESEL 27dB@1MHz E-side electrical length
DPBOESCMA 0.1719 Model of the frequency dependent loss of E-
side cable: scalars DPBOESCMA (NOTE)
DPBOESCMB 0.644453 Model of the frequency dependent loss of E-
side cable: scalars DPBOESCMB (NOTE)
DPBOESCMC 0.18359 Model of the frequency dependent loss of E-
side cable: scalars DPBOESCMC (NOTE)
DPBOMUS -101.5 dBm/Hz Minimum usable receive signal PSD mask
DPBOFMIN 138 kHz Minimum frequency from which on the
DPBO SHALL be applied
DPBOFMAX 2208 kHz Maximum frequency up to which the DPBO
SHALL be applied
UPBOKLF 0 Force CO-MIB electrical loop length
(means that kl0 is estimated during training)
UPBOKL estimated during
training Upstream electrical loop length (kl0)
NOTE: the values of DPBOESCMA, B and C are referred to a PE 0.4mm loop @ 1 MHz.
Values that are configured according to G.997.1 SHALL be rounded to the nearest scalar value.
Table 8 - UPBOA and UPBOB for band-profile AA8d
Parameter Setting Description
UPBOA US0 40.00 A and B values US band 0
(These values imply no UPBO) UPBOB US0 0
UPBOA US1 53 A value US band 1
UPBOB US1 21.2 B value US band 1
UPBOA US2 54 A value US band 2
UPBOB US2 18.7 B value US band 2
VDSL2 Functionality Test Plan TR-115 Issue 2
July 2012 © The Broadband Forum. All rights reserved 30 of 96
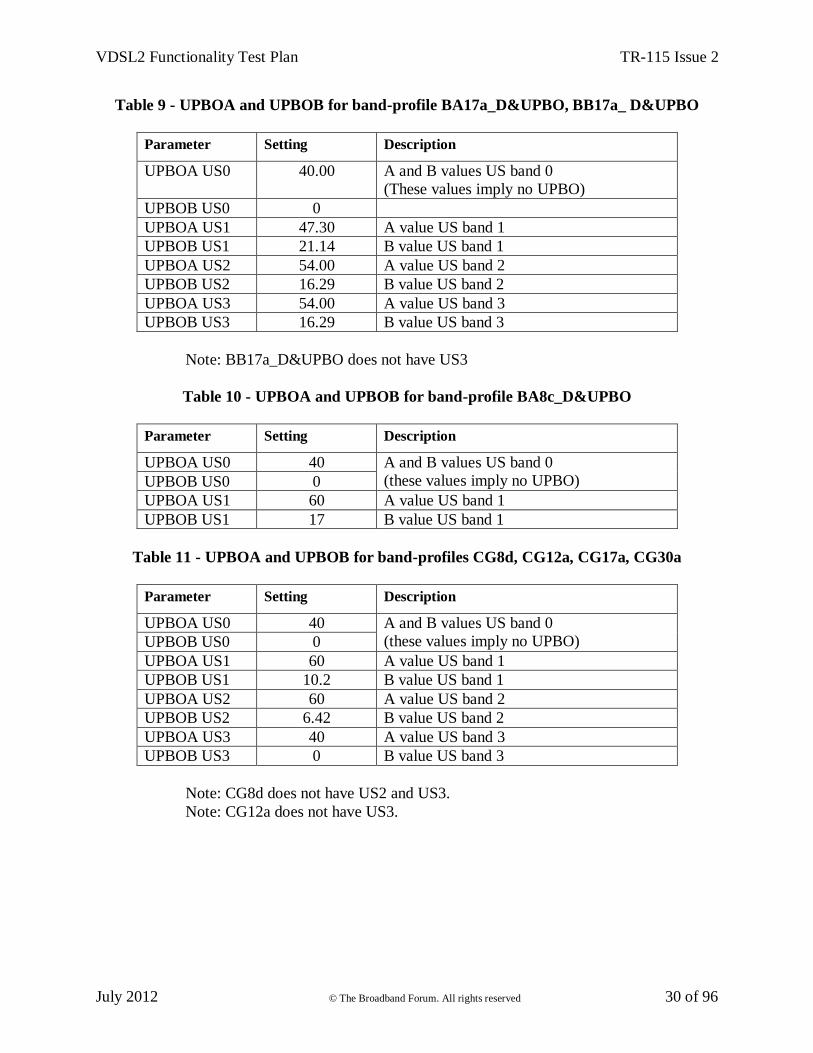
Table 9 - UPBOA and UPBOB for band-profile BA17a_D&UPBO, BB17a_ D&UPBO
Parameter Setting Description
UPBOA US0 40.00 A and B values US band 0
(These values imply no UPBO)
UPBOB US0 0
UPBOA US1 47.30 A value US band 1
UPBOB US1 21.14 B value US band 1
UPBOA US2 54.00 A value US band 2
UPBOB US2 16.29 B value US band 2
UPBOA US3 54.00 A value US band 3
UPBOB US3 16.29 B value US band 3
Note: BB17a_D&UPBO does not have US3
Table 10 - UPBOA and UPBOB for band-profile BA8c_D&UPBO
Parameter Setting Description
UPBOA US0 40 A and B values US band 0
(these values imply no UPBO) UPBOB US0 0
UPBOA US1 60 A value US band 1
UPBOB US1 17 B value US band 1
Table 11 - UPBOA and UPBOB for band-profiles CG8d, CG12a, CG17a, CG30a
Parameter Setting Description
UPBOA US0 40 A and B values US band 0
(these values imply no UPBO) UPBOB US0 0
UPBOA US1 60 A value US band 1
UPBOB US1 10.2 B value US band 1
UPBOA US2 60 A value US band 2
UPBOB US2 6.42 B value US band 2
UPBOA US3 40 A value US band 3
UPBOB US3 0 B value US band 3
Note: CG8d does not have US2 and US3.
Note: CG12a does not have US3.
VDSL2 Functionality Test Plan TR-115 Issue 2
July 2012 © The Broadband Forum. All rights reserved 31 of 96
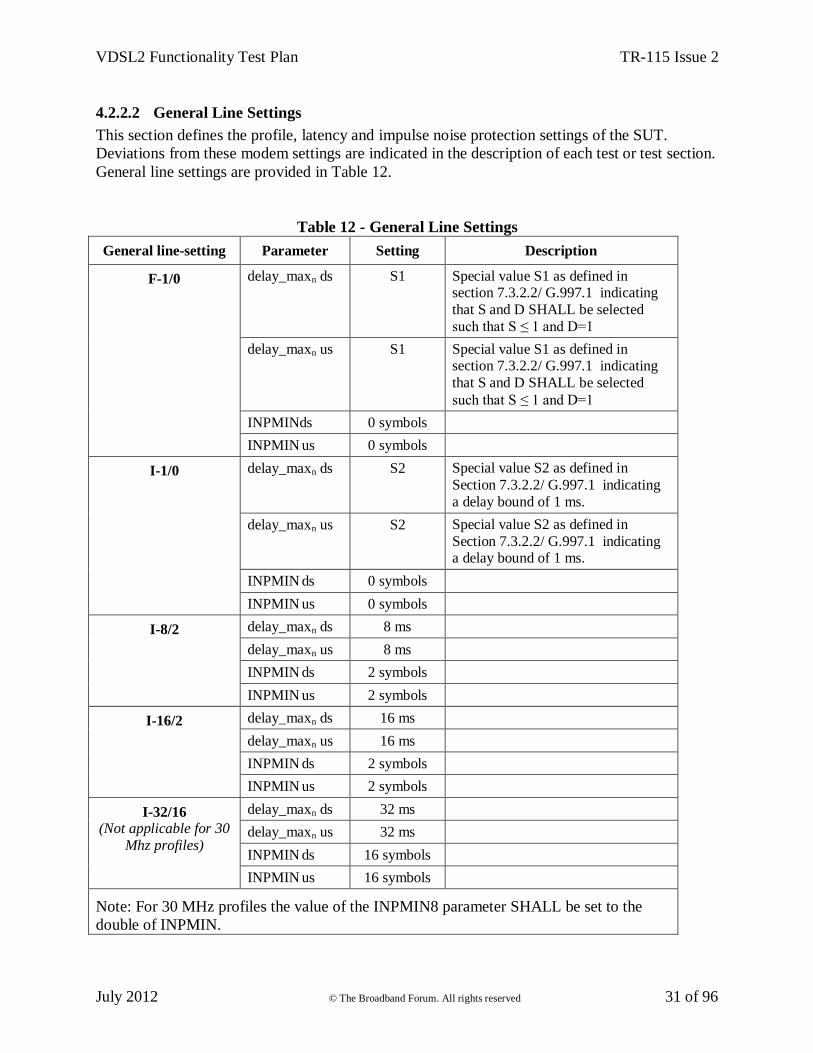
4.2.2.2 General Line Settings
This section defines the profile, latency and impulse noise protection settings of the SUT.
Deviations from these modem settings are indicated in the description of each test or test section.
General line settings are provided in Table 12.
Table 12 - General Line Settings
General line-setting Parameter Setting Description
F-1/0 delay_maxn ds S1 Special value S1 as defined in section 7.3.2.2/ G.997.1 indicating
that S and D SHALL be selected
such that S ≤ 1 and D=1
delay_maxn us S1 Special value S1 as defined in section 7.3.2.2/ G.997.1 indicating
that S and D SHALL be selected
such that S ≤ 1 and D=1
INPMINds 0 symbols
INPMIN us 0 symbols
I-1/0 delay_maxn ds S2 Special value S2 as defined in
Section 7.3.2.2/ G.997.1 indicating
a delay bound of 1 ms.
delay_maxn us S2 Special value S2 as defined in
Section 7.3.2.2/ G.997.1 indicating a delay bound of 1 ms.
INPMIN ds 0 symbols
INPMIN us 0 symbols
I-8/2 delay_maxn ds 8 ms
delay_maxn us 8 ms
INPMIN ds 2 symbols
INPMIN us 2 symbols
I-16/2 delay_maxn ds 16 ms
delay_maxn us 16 ms
INPMIN ds 2 symbols
INPMIN us 2 symbols
I-32/16 (Not applicable for 30
Mhz profiles)
delay_maxn ds 32 ms
delay_maxn us 32 ms
INPMIN ds 16 symbols
INPMIN us 16 symbols
Note: For 30 MHz profiles the value of the INPMIN8 parameter SHALL be set to the
double of INPMIN.
VDSL2 Functionality Test Plan TR-115 Issue 2
July 2012 © The Broadband Forum. All rights reserved 32 of 96
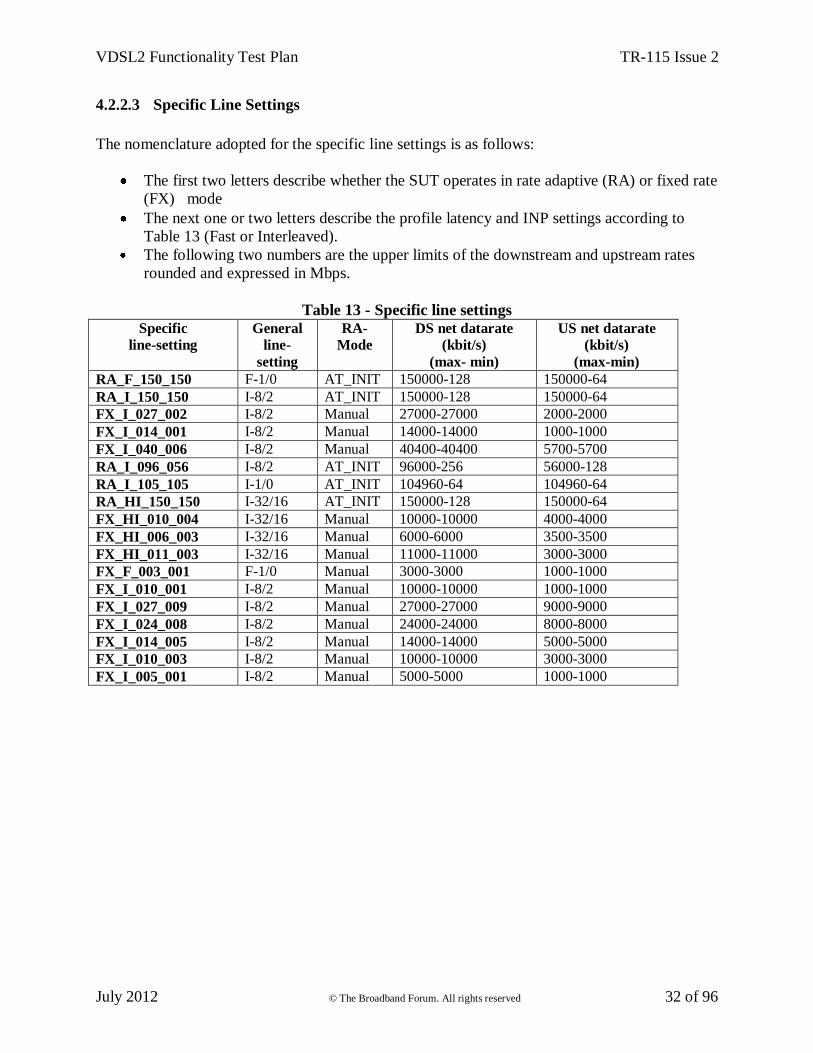
4.2.2.3 Specific Line Settings
The nomenclature adopted for the specific line settings is as follows:
The first two letters describe whether the SUT operates in rate adaptive (RA) or fixed rate
(FX) mode
The next one or two letters describe the profile latency and INP settings according to
Table 13 (Fast or Interleaved).
The following two numbers are the upper limits of the downstream and upstream rates
rounded and expressed in Mbps.
Table 13 - Specific line settings
Specific
line-setting
General
line-
setting
RA-
Mode
DS net datarate (kbit/s)
(max- min)
US net datarate
(kbit/s)
(max-min)
RA_F_150_150 F-1/0 AT_INIT 150000-128 150000-64
RA_I_150_150 I-8/2 AT_INIT 150000-128 150000-64
FX_I_027_002 I-8/2 Manual 27000-27000 2000-2000
FX_I_014_001 I-8/2 Manual 14000-14000 1000-1000
FX_I_040_006 I-8/2 Manual 40400-40400 5700-5700
RA_I_096_056 I-8/2 AT_INIT 96000-256 56000-128
RA_I_105_105 I-1/0 AT_INIT 104960-64 104960-64
RA_HI_150_150 I-32/16 AT_INIT 150000-128 150000-64
FX_HI_010_004 I-32/16 Manual 10000-10000 4000-4000
FX_HI_006_003 I-32/16 Manual 6000-6000 3500-3500
FX_HI_011_003 I-32/16 Manual 11000-11000 3000-3000
FX_F_003_001 F-1/0 Manual 3000-3000 1000-1000
FX_I_010_001 I-8/2 Manual 10000-10000 1000-1000
FX_I_027_009 I-8/2 Manual 27000-27000 9000-9000
FX_I_024_008 I-8/2 Manual 24000-24000 8000-8000
FX_I_014_005 I-8/2 Manual 14000-14000 5000-5000
FX_I_010_003 I-8/2 Manual 10000-10000 3000-3000
FX_I_005_001 I-8/2 Manual 5000-5000 1000-1000
VDSL2 Functionality Test Plan TR-115 Issue 2
July 2012 © The Broadband Forum. All rights reserved 33 of 96
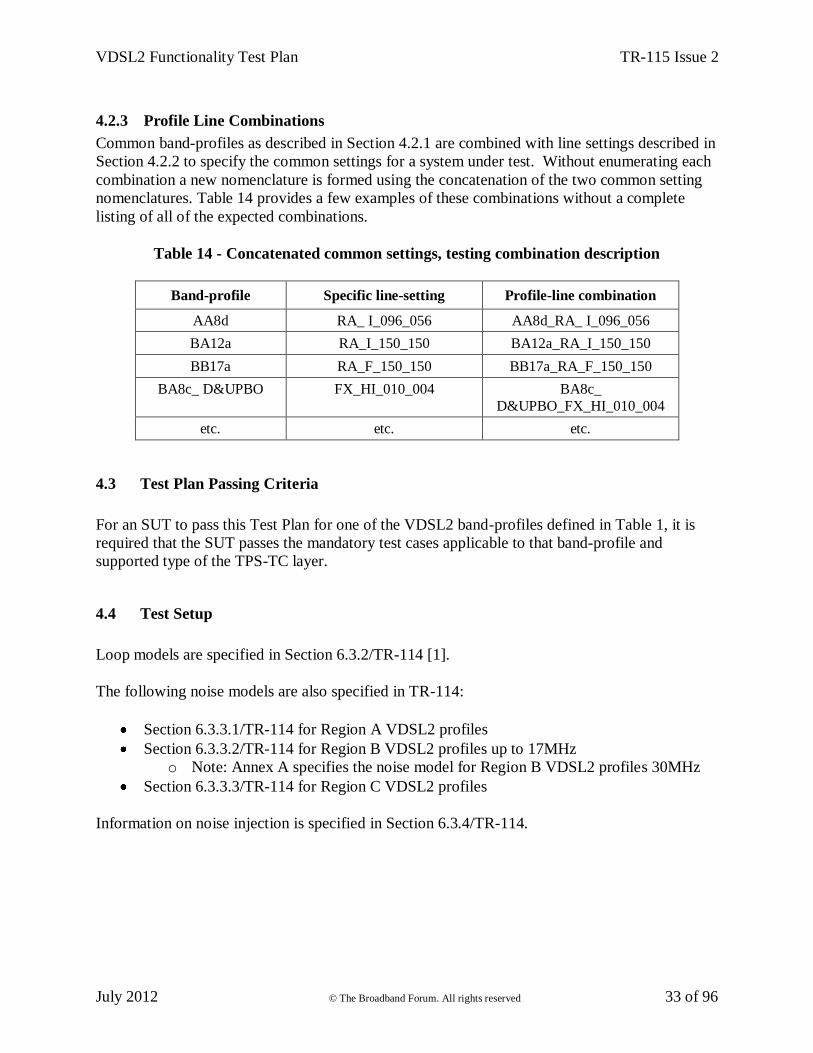
4.2.3 Profile Line Combinations
Common band-profiles as described in Section 4.2.1 are combined with line settings described in
Section 4.2.2 to specify the common settings for a system under test. Without enumerating each
combination a new nomenclature is formed using the concatenation of the two common setting
nomenclatures. Table 14 provides a few examples of these combinations without a complete
listing of all of the expected combinations.
Table 14 - Concatenated common settings, testing combination description
Band-profile Specific line-setting Profile-line combination
AA8d RA_ I_096_056 AA8d_RA_ I_096_056
BA12a RA_I_150_150 BA12a_RA_I_150_150
BB17a RA_F_150_150 BB17a_RA_F_150_150
BA8c_ D&UPBO FX_HI_010_004 BA8c_
D&UPBO_FX_HI_010_004
etc. etc. etc.
4.3 Test Plan Passing Criteria
For an SUT to pass this Test Plan for one of the VDSL2 band-profiles defined in Table 1, it is
required that the SUT passes the mandatory test cases applicable to that band-profile and
supported type of the TPS-TC layer.
4.4 Test Setup
Loop models are specified in Section 6.3.2/TR-114 [1].
The following noise models are also specified in TR-114:
Section 6.3.3.1/TR-114 for Region A VDSL2 profiles
Section 6.3.3.2/TR-114 for Region B VDSL2 profiles up to 17MHz
o Note: Annex A specifies the noise model for Region B VDSL2 profiles 30MHz
Section 6.3.3.3/TR-114 for Region C VDSL2 profiles
Information on noise injection is specified in Section 6.3.4/TR-114.
VDSL2 Functionality Test Plan TR-115 Issue 2
July 2012 © The Broadband Forum. All rights reserved 34 of 96
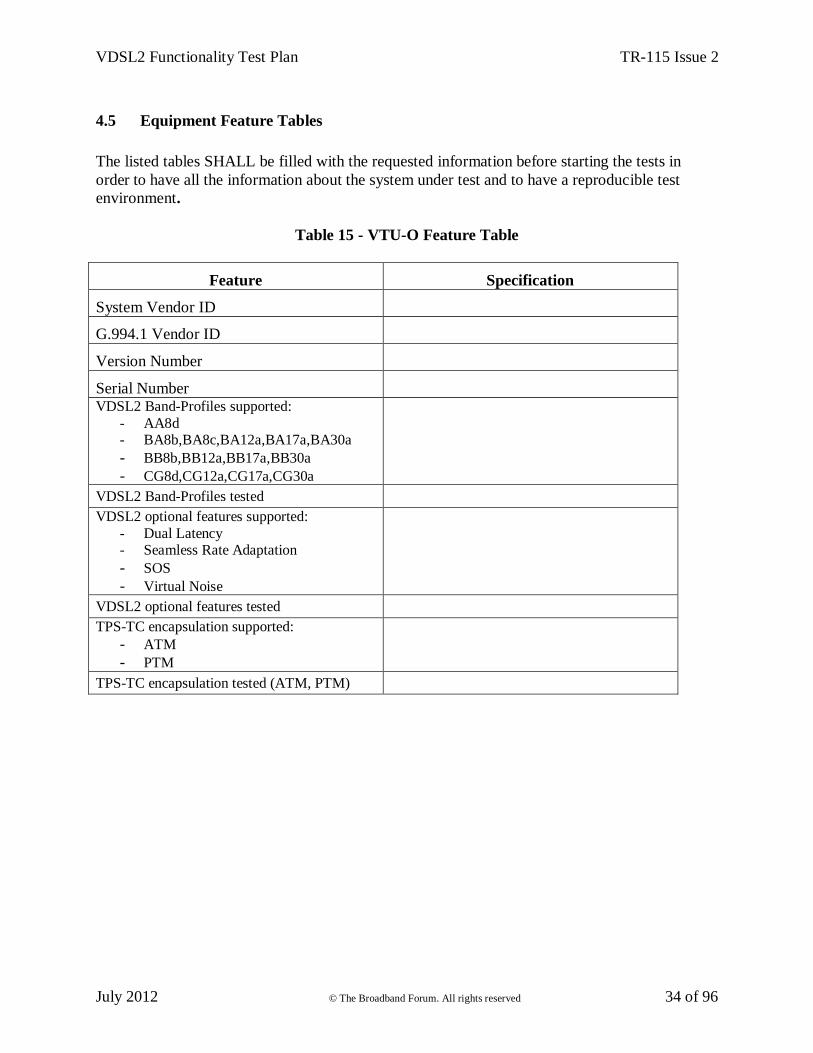
4.5 Equipment Feature Tables
The listed tables SHALL be filled with the requested information before starting the tests in
order to have all the information about the system under test and to have a reproducible test
environment.
Table 15 - VTU-O Feature Table
Feature Specification
System Vendor ID
G.994.1 Vendor ID
Version Number
Serial Number VDSL2 Band-Profiles supported:
- AA8d - BA8b,BA8c,BA12a,BA17a,BA30a
- BB8b,BB12a,BB17a,BB30a
- CG8d,CG12a,CG17a,CG30a
VDSL2 Band-Profiles tested
VDSL2 optional features supported:
- Dual Latency - Seamless Rate Adaptation
- SOS
- Virtual Noise
VDSL2 optional features tested
TPS-TC encapsulation supported:
- ATM
- PTM
TPS-TC encapsulation tested (ATM, PTM)
VDSL2 Functionality Test Plan TR-115 Issue 2
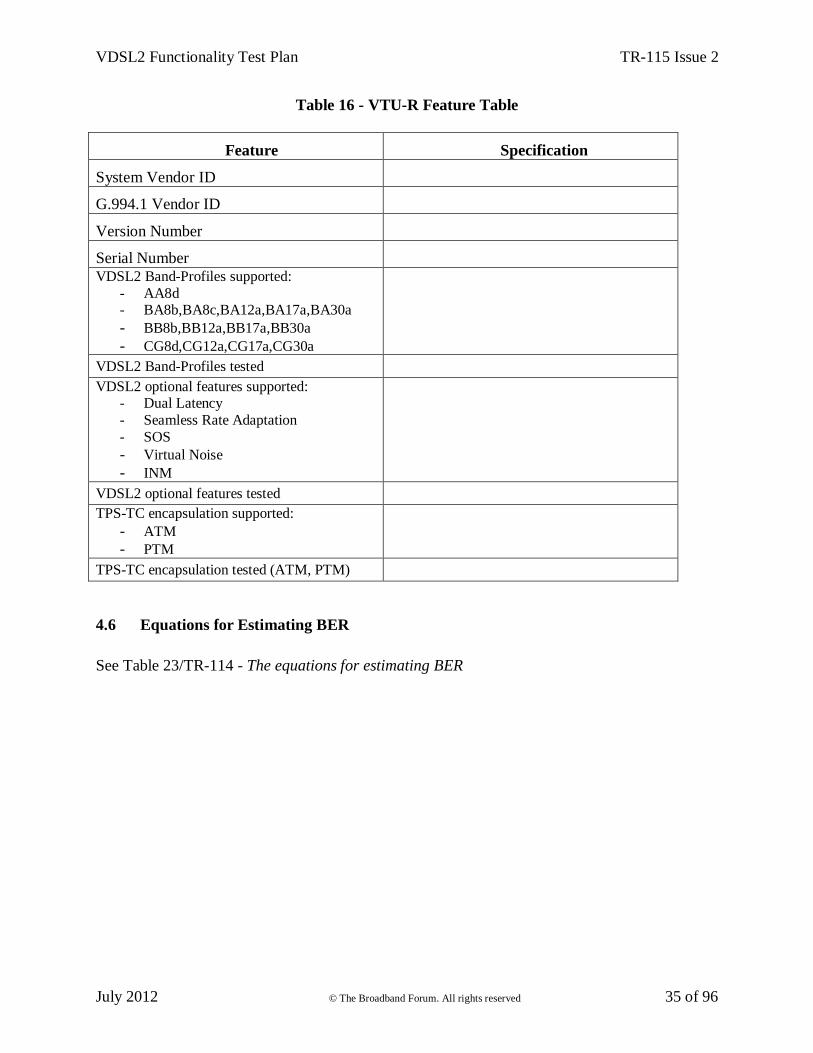
July 2012 © The Broadband Forum. All rights reserved 35 of 96
Table 16 - VTU-R Feature Table
Feature Specification
System Vendor ID
G.994.1 Vendor ID
Version Number
Serial Number VDSL2 Band-Profiles supported:
- AA8d - BA8b,BA8c,BA12a,BA17a,BA30a
- BB8b,BB12a,BB17a,BB30a
- CG8d,CG12a,CG17a,CG30a
VDSL2 Band-Profiles tested
VDSL2 optional features supported: - Dual Latency
- Seamless Rate Adaptation
- SOS
- Virtual Noise
- INM
VDSL2 optional features tested
TPS-TC encapsulation supported:
- ATM - PTM
TPS-TC encapsulation tested (ATM, PTM)
4.6 Equations for Estimating BER
See Table 23/TR-114 - The equations for estimating BER
VDSL2 Functionality Test Plan TR-115 Issue 2
July 2012 © The Broadband Forum. All rights reserved 36 of 96
5 Physical Layer Tests
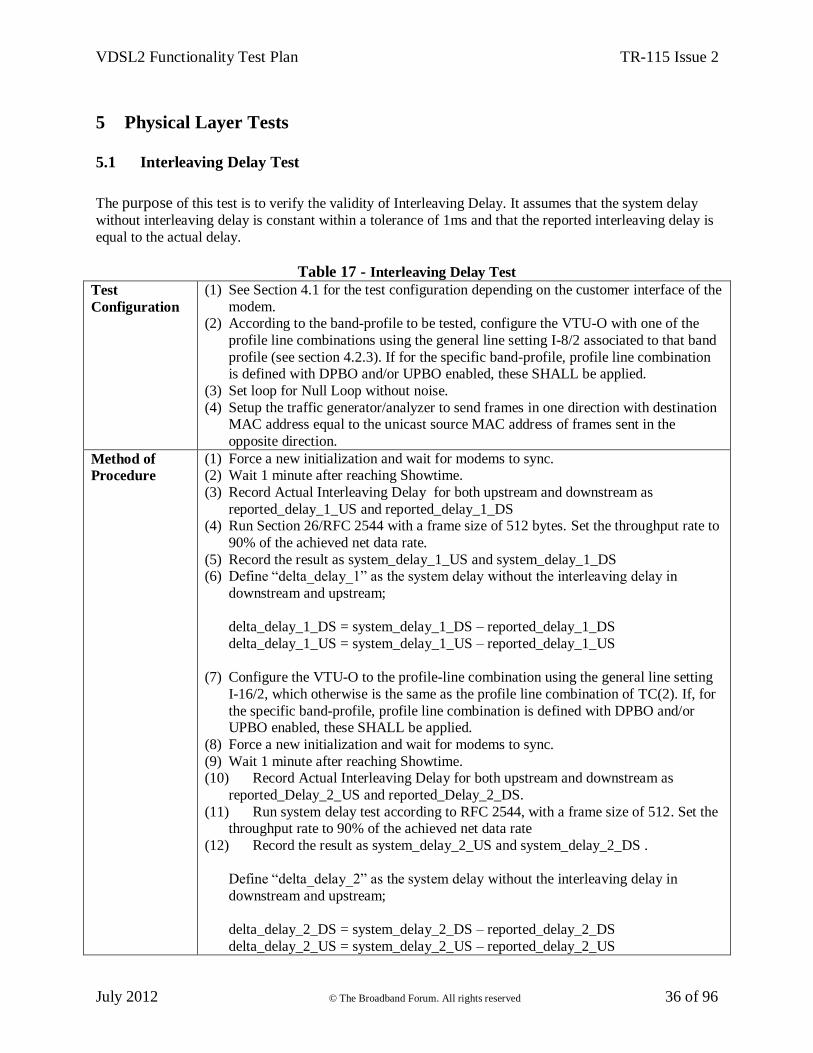
5.1 Interleaving Delay Test
The purpose of this test is to verify the validity of Interleaving Delay. It assumes that the system delay
without interleaving delay is constant within a tolerance of 1ms and that the reported interleaving delay is
equal to the actual delay.
Table 17 - Interleaving Delay Test
Test
Configuration
(1) See Section 4.1 for the test configuration depending on the customer interface of the
modem. (2) According to the band-profile to be tested, configure the VTU-O with one of the
profile line combinations using the general line setting I-8/2 associated to that band
profile (see section 4.2.3). If for the specific band-profile, profile line combination is defined with DPBO and/or UPBO enabled, these SHALL be applied.
(3) Set loop for Null Loop without noise.
(4) Setup the traffic generator/analyzer to send frames in one direction with destination MAC address equal to the unicast source MAC address of frames sent in the
opposite direction.
Method of
Procedure
(1) Force a new initialization and wait for modems to sync. (2) Wait 1 minute after reaching Showtime.
(3) Record Actual Interleaving Delay for both upstream and downstream as
reported_delay_1_US and reported_delay_1_DS (4) Run Section 26/RFC 2544 with a frame size of 512 bytes. Set the throughput rate to
90% of the achieved net data rate.
(5) Record the result as system_delay_1_US and system_delay_1_DS (6) Define “delta_delay_1” as the system delay without the interleaving delay in
downstream and upstream;
delta_delay_1_DS = system_delay_1_DS – reported_delay_1_DS
delta_delay_1_US = system_delay_1_US – reported_delay_1_US
(7) Configure the VTU-O to the profile-line combination using the general line setting
I-16/2, which otherwise is the same as the profile line combination of TC(2). If, for
the specific band-profile, profile line combination is defined with DPBO and/or UPBO enabled, these SHALL be applied.
(8) Force a new initialization and wait for modems to sync.
(9) Wait 1 minute after reaching Showtime. (10) Record Actual Interleaving Delay for both upstream and downstream as
reported_Delay_2_US and reported_Delay_2_DS.
(11) Run system delay test according to RFC 2544, with a frame size of 512. Set the throughput rate to 90% of the achieved net data rate
(12) Record the result as system_delay_2_US and system_delay_2_DS .
Define “delta_delay_2” as the system delay without the interleaving delay in
downstream and upstream;
delta_delay_2_DS = system_delay_2_DS – reported_delay_2_DS
delta_delay_2_US = system_delay_2_US – reported_delay_2_US
VDSL2 Functionality Test Plan TR-115 Issue 2
July 2012 © The Broadband Forum. All rights reserved 37 of 96
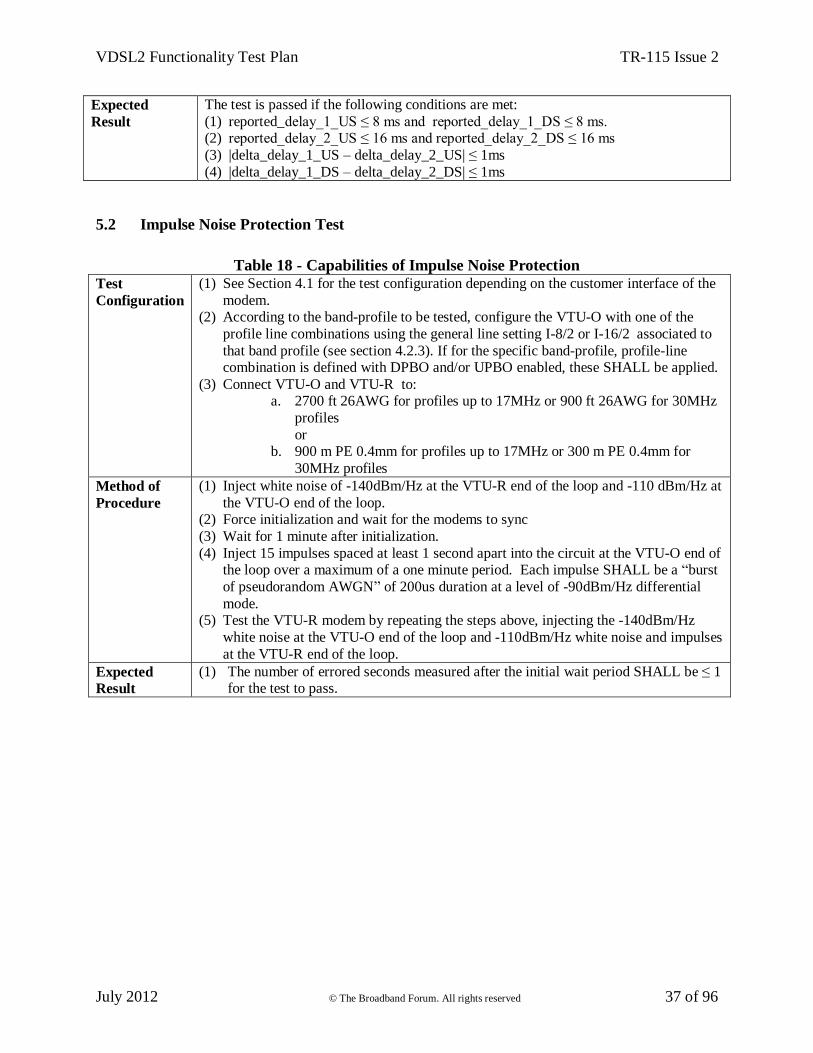
Expected
Result
The test is passed if the following conditions are met:
(1) reported_delay_1_US ≤ 8 ms and reported_delay_1_DS ≤ 8 ms. (2) reported_delay_2_US ≤ 16 ms and reported_delay_2_DS ≤ 16 ms
(3) |delta_delay_1_US – delta_delay_2_US| ≤ 1ms
(4) |delta_delay_1_DS – delta_delay_2_DS| ≤ 1ms
5.2 Impulse Noise Protection Test
Table 18 - Capabilities of Impulse Noise Protection
Test
Configuration
(1) See Section 4.1 for the test configuration depending on the customer interface of the
modem. (2) According to the band-profile to be tested, configure the VTU-O with one of the
profile line combinations using the general line setting I-8/2 or I-16/2 associated to
that band profile (see section 4.2.3). If for the specific band-profile, profile-line combination is defined with DPBO and/or UPBO enabled, these SHALL be applied.
(3) Connect VTU-O and VTU-R to: a. 2700 ft 26AWG for profiles up to 17MHz or 900 ft 26AWG for 30MHz
profiles
or b. 900 m PE 0.4mm for profiles up to 17MHz or 300 m PE 0.4mm for
30MHz profiles
Method of
Procedure
(1) Inject white noise of -140dBm/Hz at the VTU-R end of the loop and -110 dBm/Hz at
the VTU-O end of the loop. (2) Force initialization and wait for the modems to sync
(3) Wait for 1 minute after initialization.
(4) Inject 15 impulses spaced at least 1 second apart into the circuit at the VTU-O end of the loop over a maximum of a one minute period. Each impulse SHALL be a “burst
of pseudorandom AWGN” of 200us duration at a level of -90dBm/Hz differential
mode. (5) Test the VTU-R modem by repeating the steps above, injecting the -140dBm/Hz
white noise at the VTU-O end of the loop and -110dBm/Hz white noise and impulses
at the VTU-R end of the loop.
Expected
Result
(1) The number of errored seconds measured after the initial wait period SHALL be ≤ 1 for the test to pass.
VDSL2 Functionality Test Plan TR-115 Issue 2
July 2012 © The Broadband Forum. All rights reserved 38 of 96
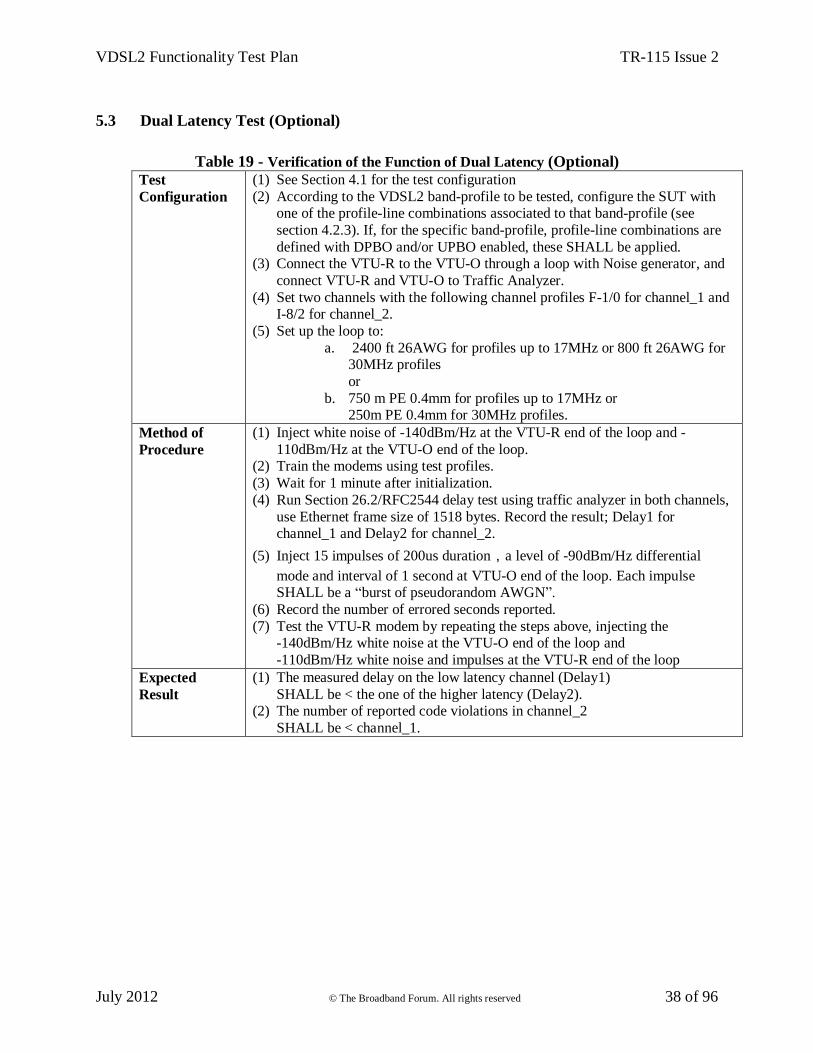
5.3 Dual Latency Test (Optional)
Table 19 - Verification of the Function of Dual Latency (Optional)
Test
Configuration
(1) See Section 4.1 for the test configuration
(2) According to the VDSL2 band-profile to be tested, configure the SUT with one of the profile-line combinations associated to that band-profile (see
section 4.2.3). If, for the specific band-profile, profile-line combinations are
defined with DPBO and/or UPBO enabled, these SHALL be applied. (3) Connect the VTU-R to the VTU-O through a loop with Noise generator, and
connect VTU-R and VTU-O to Traffic Analyzer.
(4) Set two channels with the following channel profiles F-1/0 for channel_1 and I-8/2 for channel_2.
(5) Set up the loop to:
a. 2400 ft 26AWG for profiles up to 17MHz or 800 ft 26AWG for 30MHz profiles
or
b. 750 m PE 0.4mm for profiles up to 17MHz or 250m PE 0.4mm for 30MHz profiles.
Method of
Procedure
(1) Inject white noise of -140dBm/Hz at the VTU-R end of the loop and -
110dBm/Hz at the VTU-O end of the loop. (2) Train the modems using test profiles.
(3) Wait for 1 minute after initialization.
(4) Run Section 26.2/RFC2544 delay test using traffic analyzer in both channels,
use Ethernet frame size of 1518 bytes. Record the result; Delay1 for channel_1 and Delay2 for channel_2.
(5) Inject 15 impulses of 200us duration,a level of -90dBm/Hz differential
mode and interval of 1 second at VTU-O end of the loop. Each impulse SHALL be a “burst of pseudorandom AWGN”.
(6) Record the number of errored seconds reported.
(7) Test the VTU-R modem by repeating the steps above, injecting the -140dBm/Hz white noise at the VTU-O end of the loop and
-110dBm/Hz white noise and impulses at the VTU-R end of the loop
Expected
Result
(1) The measured delay on the low latency channel (Delay1)
SHALL be < the one of the higher latency (Delay2). (2) The number of reported code violations in channel_2
SHALL be < channel_1.
VDSL2 Functionality Test Plan TR-115 Issue 2
July 2012 © The Broadband Forum. All rights reserved 39 of 96
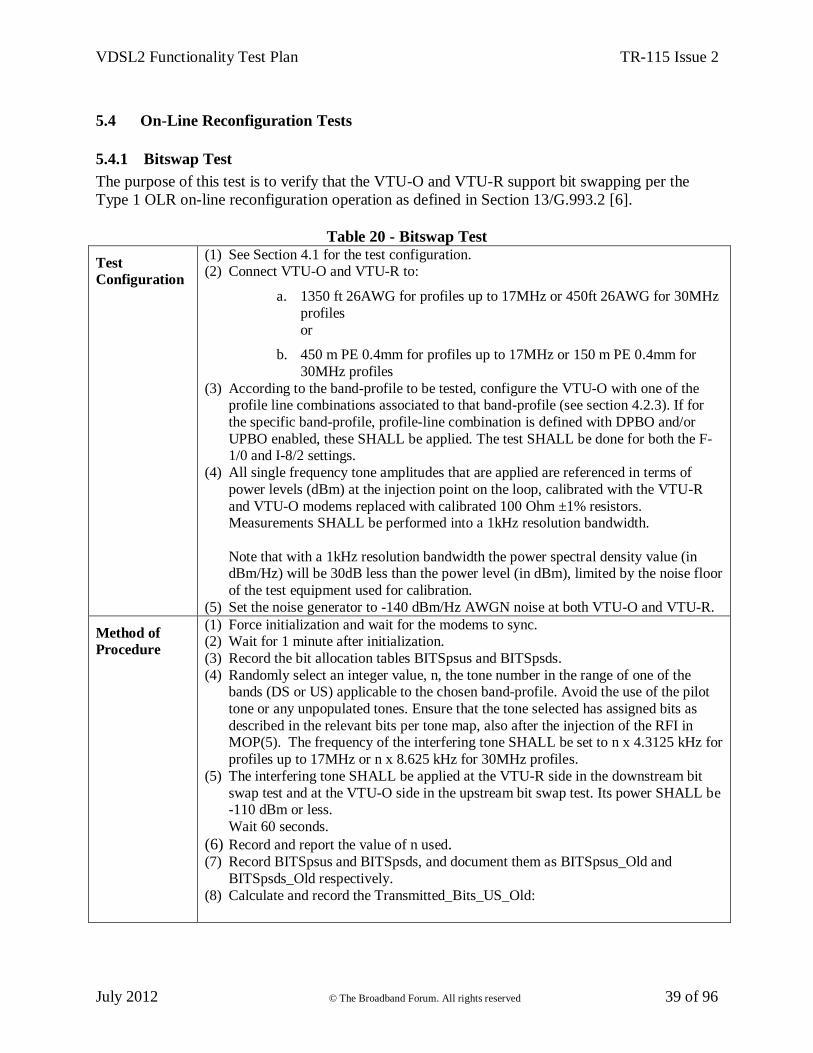
5.4 On-Line Reconfiguration Tests
5.4.1 Bitswap Test
The purpose of this test is to verify that the VTU-O and VTU-R support bit swapping per the
Type 1 OLR on-line reconfiguration operation as defined in Section 13/G.993.2 [6].
Table 20 - Bitswap Test
Test
Configuration
(1) See Section 4.1 for the test configuration. (2) Connect VTU-O and VTU-R to:
a. 1350 ft 26AWG for profiles up to 17MHz or 450ft 26AWG for 30MHz
profiles
or
b. 450 m PE 0.4mm for profiles up to 17MHz or 150 m PE 0.4mm for
30MHz profiles
(3) According to the band-profile to be tested, configure the VTU-O with one of the profile line combinations associated to that band-profile (see section 4.2.3). If for
the specific band-profile, profile-line combination is defined with DPBO and/or
UPBO enabled, these SHALL be applied. The test SHALL be done for both the F-1/0 and I-8/2 settings.
(4) All single frequency tone amplitudes that are applied are referenced in terms of
power levels (dBm) at the injection point on the loop, calibrated with the VTU-R
and VTU-O modems replaced with calibrated 100 Ohm ±1% resistors. Measurements SHALL be performed into a 1kHz resolution bandwidth.
Note that with a 1kHz resolution bandwidth the power spectral density value (in dBm/Hz) will be 30dB less than the power level (in dBm), limited by the noise floor
of the test equipment used for calibration.
(5) Set the noise generator to -140 dBm/Hz AWGN noise at both VTU-O and VTU-R.
Method of
Procedure
(1) Force initialization and wait for the modems to sync. (2) Wait for 1 minute after initialization.
(3) Record the bit allocation tables BITSpsus and BITSpsds.
(4) Randomly select an integer value, n, the tone number in the range of one of the bands (DS or US) applicable to the chosen band-profile. Avoid the use of the pilot
tone or any unpopulated tones. Ensure that the tone selected has assigned bits as
described in the relevant bits per tone map, also after the injection of the RFI in MOP(5). The frequency of the interfering tone SHALL be set to n x 4.3125 kHz for
profiles up to 17MHz or n x 8.625 kHz for 30MHz profiles.
(5) The interfering tone SHALL be applied at the VTU-R side in the downstream bit
swap test and at the VTU-O side in the upstream bit swap test. Its power SHALL be -110 dBm or less.
Wait 60 seconds.
(6) Record and report the value of n used. (7) Record BITSpsus and BITSpsds, and document them as BITSpsus_Old and
BITSpsds_Old respectively.
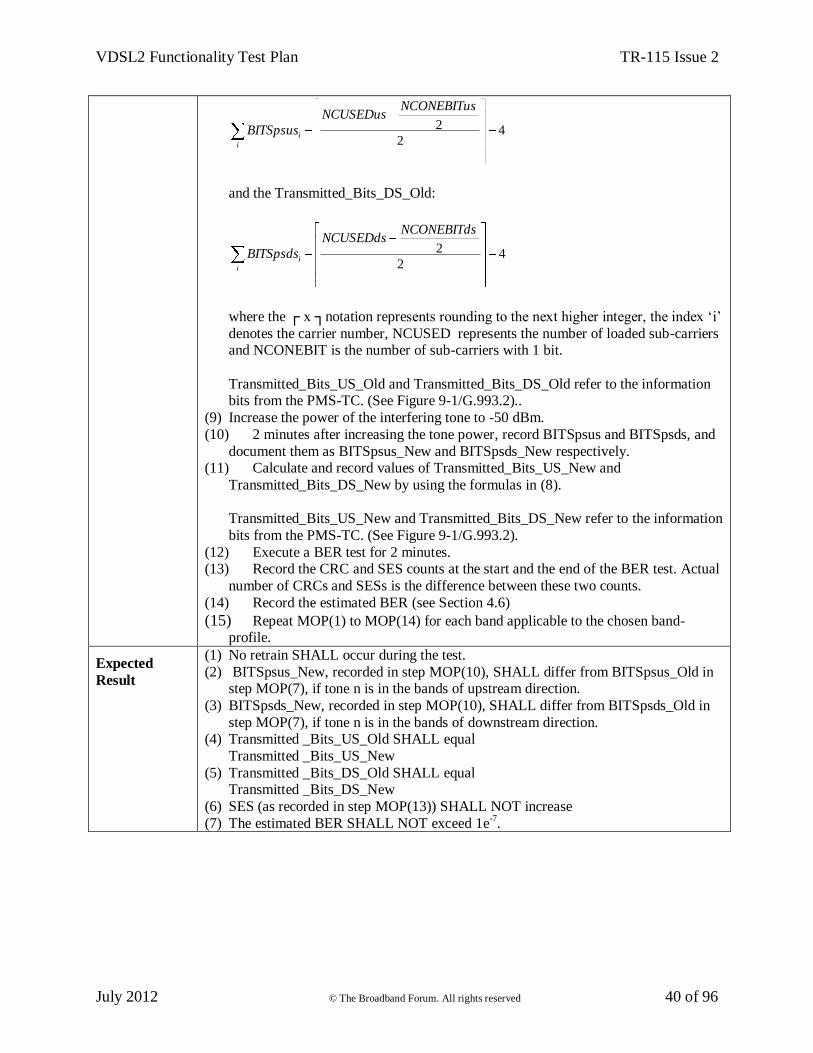
(8) Calculate and record the Transmitted_Bits_US_Old:
VDSL2 Functionality Test Plan TR-115 Issue 2
July 2012 © The Broadband Forum. All rights reserved 40 of 96
42
2
NCONEBITusNCUSEDus
BITSpsusi
i
and the Transmitted_Bits_DS_Old:
42
2
NCONEBITdsNCUSEDds
BITSpsdsi
i
where the ┌ x ┐notation represents rounding to the next higher integer, the index ‘i’
denotes the carrier number, NCUSED represents the number of loaded sub-carriers and NCONEBIT is the number of sub-carriers with 1 bit.
Transmitted_Bits_US_Old and Transmitted_Bits_DS_Old refer to the information bits from the PMS-TC. (See Figure 9-1/G.993.2)..
(9) Increase the power of the interfering tone to -50 dBm.
(10) 2 minutes after increasing the tone power, record BITSpsus and BITSpsds, and
document them as BITSpsus_New and BITSpsds_New respectively. (11) Calculate and record values of Transmitted_Bits_US_New and
Transmitted_Bits_DS_New by using the formulas in (8).
Transmitted_Bits_US_New and Transmitted_Bits_DS_New refer to the information
bits from the PMS-TC. (See Figure 9-1/G.993.2).
(12) Execute a BER test for 2 minutes. (13) Record the CRC and SES counts at the start and the end of the BER test. Actual
number of CRCs and SESs is the difference between these two counts.
(14) Record the estimated BER (see Section 4.6)
(15) Repeat MOP(1) to MOP(14) for each band applicable to the chosen band-profile.
Expected
Result
(1) No retrain SHALL occur during the test.
(2) BITSpsus_New, recorded in step MOP(10), SHALL differ from BITSpsus_Old in step MOP(7), if tone n is in the bands of upstream direction.
(3) BITSpsds_New, recorded in step MOP(10), SHALL differ from BITSpsds_Old in
step MOP(7), if tone n is in the bands of downstream direction. (4) Transmitted _Bits_US_Old SHALL equal
Transmitted _Bits_US_New
(5) Transmitted _Bits_DS_Old SHALL equal Transmitted _Bits_DS_New
(6) SES (as recorded in step MOP(13)) SHALL NOT increase
(7) The estimated BER SHALL NOT exceed 1e-7.
VDSL2 Functionality Test Plan TR-115 Issue 2
July 2012 © The Broadband Forum. All rights reserved 41 of 96
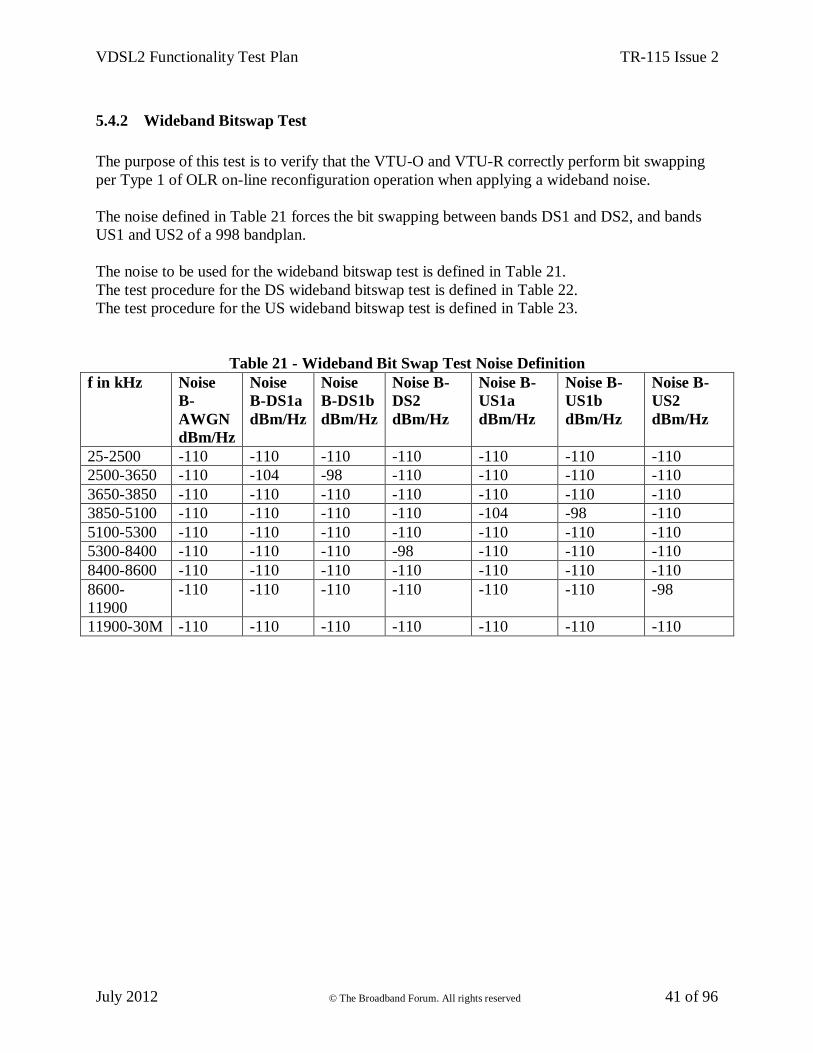
5.4.2 Wideband Bitswap Test
The purpose of this test is to verify that the VTU-O and VTU-R correctly perform bit swapping
per Type 1 of OLR on-line reconfiguration operation when applying a wideband noise.
The noise defined in Table 21 forces the bit swapping between bands DS1 and DS2, and bands
US1 and US2 of a 998 bandplan.
The noise to be used for the wideband bitswap test is defined in Table 21.
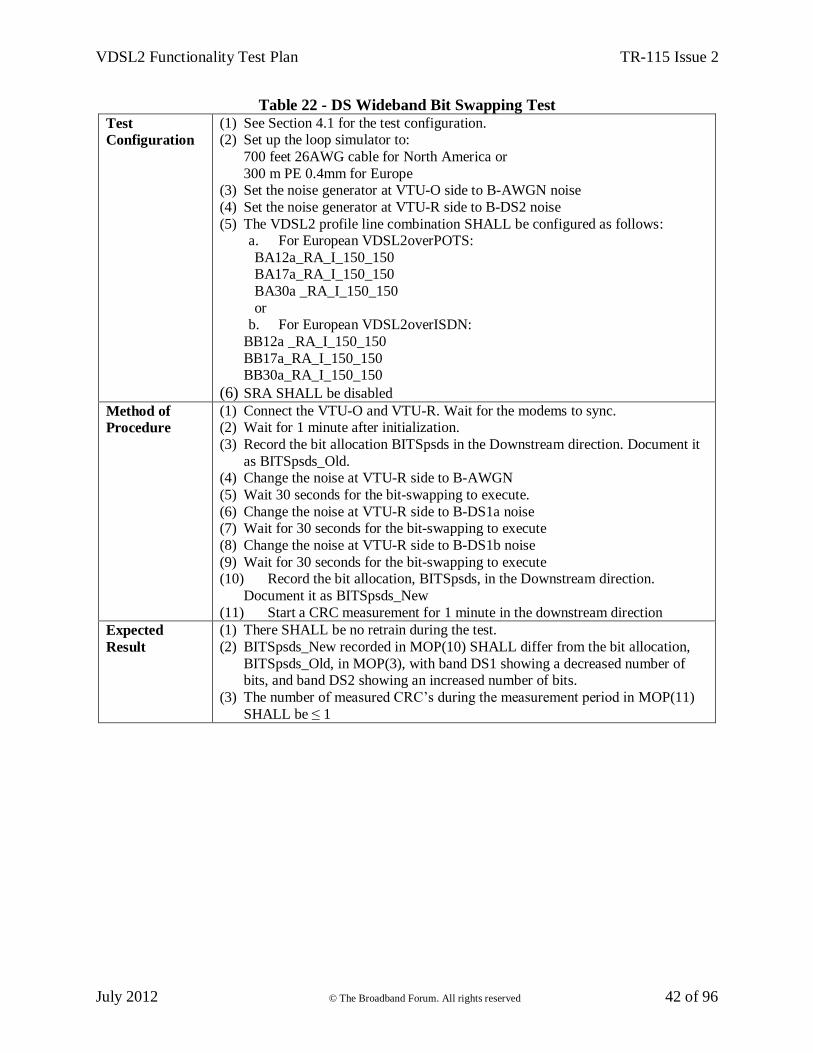
The test procedure for the DS wideband bitswap test is defined in Table 22.
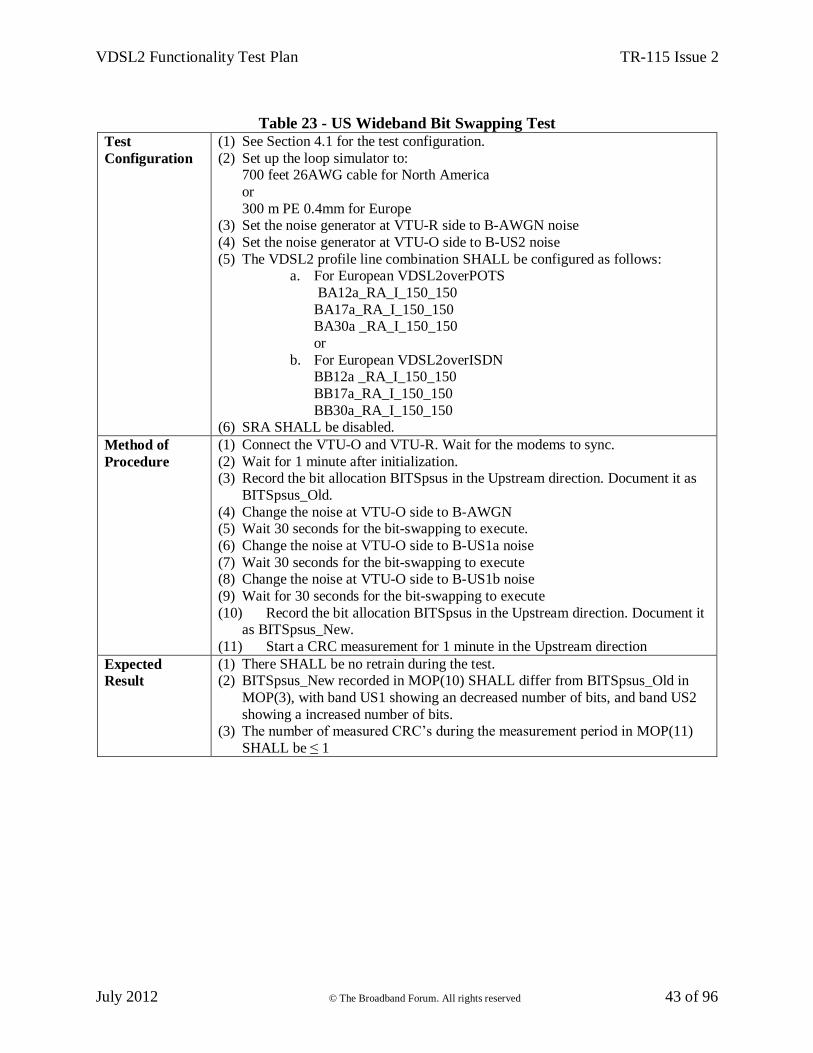
The test procedure for the US wideband bitswap test is defined in Table 23.
Table 21 - Wideband Bit Swap Test Noise Definition
f in kHz Noise
B-
AWGN
dBm/Hz
Noise
B-DS1a
dBm/Hz
Noise
B-DS1b
dBm/Hz
Noise B-
DS2
dBm/Hz
Noise B-
US1a
dBm/Hz
Noise B-
US1b
dBm/Hz
Noise B-
US2
dBm/Hz
25-2500 -110 -110 -110 -110 -110 -110 -110
2500-3650 -110 -104 -98 -110 -110 -110 -110
3650-3850 -110 -110 -110 -110 -110 -110 -110
3850-5100 -110 -110 -110 -110 -104 -98 -110
5100-5300 -110 -110 -110 -110 -110 -110 -110
5300-8400 -110 -110 -110 -98 -110 -110 -110
8400-8600 -110 -110 -110 -110 -110 -110 -110
8600-
11900
-110 -110 -110 -110 -110 -110 -98
11900-30M -110 -110 -110 -110 -110 -110 -110
VDSL2 Functionality Test Plan TR-115 Issue 2
July 2012 © The Broadband Forum. All rights reserved 42 of 96
Table 22 - DS Wideband Bit Swapping Test
Test
Configuration
(1) See Section 4.1 for the test configuration. (2) Set up the loop simulator to:
700 feet 26AWG cable for North America or
300 m PE 0.4mm for Europe (3) Set the noise generator at VTU-O side to B-AWGN noise
(4) Set the noise generator at VTU-R side to B-DS2 noise
(5) The VDSL2 profile line combination SHALL be configured as follows: a. For European VDSL2overPOTS:
BA12a_RA_I_150_150 BA17a_RA_I_150_150
BA30a _RA_I_150_150
or b. For European VDSL2overISDN:
BB12a _RA_I_150_150
BB17a_RA_I_150_150 BB30a_RA_I_150_150
(6) SRA SHALL be disabled Method of
Procedure
(1) Connect the VTU-O and VTU-R. Wait for the modems to sync. (2) Wait for 1 minute after initialization.
(3) Record the bit allocation BITSpsds in the Downstream direction. Document it
as BITSpsds_Old. (4) Change the noise at VTU-R side to B-AWGN
(5) Wait 30 seconds for the bit-swapping to execute.
(6) Change the noise at VTU-R side to B-DS1a noise (7) Wait for 30 seconds for the bit-swapping to execute
(8) Change the noise at VTU-R side to B-DS1b noise
(9) Wait for 30 seconds for the bit-swapping to execute (10) Record the bit allocation, BITSpsds, in the Downstream direction.
Document it as BITSpsds_New
(11) Start a CRC measurement for 1 minute in the downstream direction
Expected
Result
(1) There SHALL be no retrain during the test.
(2) BITSpsds_New recorded in MOP(10) SHALL differ from the bit allocation,
BITSpsds_Old, in MOP(3), with band DS1 showing a decreased number of bits, and band DS2 showing an increased number of bits.
(3) The number of measured CRC’s during the measurement period in MOP(11)
SHALL be ≤ 1
VDSL2 Functionality Test Plan TR-115 Issue 2
July 2012 © The Broadband Forum. All rights reserved 43 of 96
Table 23 - US Wideband Bit Swapping Test
Test
Configuration
(1) See Section 4.1 for the test configuration.
(2) Set up the loop simulator to: 700 feet 26AWG cable for North America
or
300 m PE 0.4mm for Europe (3) Set the noise generator at VTU-R side to B-AWGN noise
(4) Set the noise generator at VTU-O side to B-US2 noise
(5) The VDSL2 profile line combination SHALL be configured as follows: a. For European VDSL2overPOTS
BA12a_RA_I_150_150
BA17a_RA_I_150_150 BA30a _RA_I_150_150
or
b. For European VDSL2overISDN BB12a _RA_I_150_150
BB17a_RA_I_150_150
BB30a_RA_I_150_150 (6) SRA SHALL be disabled.
Method of
Procedure
(1) Connect the VTU-O and VTU-R. Wait for the modems to sync.
(2) Wait for 1 minute after initialization. (3) Record the bit allocation BITSpsus in the Upstream direction. Document it as
BITSpsus_Old.
(4) Change the noise at VTU-O side to B-AWGN (5) Wait 30 seconds for the bit-swapping to execute.
(6) Change the noise at VTU-O side to B-US1a noise
(7) Wait 30 seconds for the bit-swapping to execute (8) Change the noise at VTU-O side to B-US1b noise
(9) Wait for 30 seconds for the bit-swapping to execute
(10) Record the bit allocation BITSpsus in the Upstream direction. Document it as BITSpsus_New.
(11) Start a CRC measurement for 1 minute in the Upstream direction
Expected
Result
(1) There SHALL be no retrain during the test. (2) BITSpsus_New recorded in MOP(10) SHALL differ from BITSpsus_Old in
MOP(3), with band US1 showing an decreased number of bits, and band US2
showing a increased number of bits. (3) The number of measured CRC’s during the measurement period in MOP(11)
SHALL be ≤ 1
VDSL2 Functionality Test Plan TR-115 Issue 2
July 2012 © The Broadband Forum. All rights reserved 44 of 96
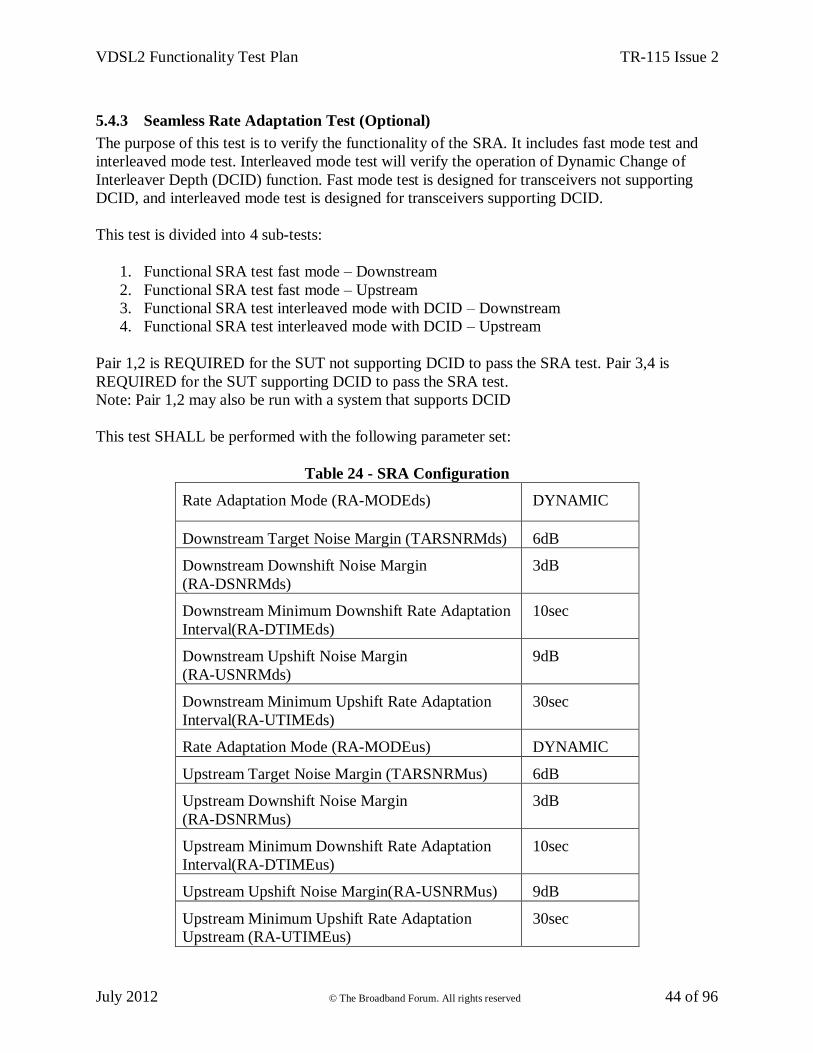
5.4.3 Seamless Rate Adaptation Test (Optional)
The purpose of this test is to verify the functionality of the SRA. It includes fast mode test and
interleaved mode test. Interleaved mode test will verify the operation of Dynamic Change of
Interleaver Depth (DCID) function. Fast mode test is designed for transceivers not supporting
DCID, and interleaved mode test is designed for transceivers supporting DCID.
This test is divided into 4 sub-tests:
1. Functional SRA test fast mode – Downstream
2. Functional SRA test fast mode – Upstream
3. Functional SRA test interleaved mode with DCID – Downstream
4. Functional SRA test interleaved mode with DCID – Upstream
Pair 1,2 is REQUIRED for the SUT not supporting DCID to pass the SRA test. Pair 3,4 is
REQUIRED for the SUT supporting DCID to pass the SRA test.
Note: Pair 1,2 may also be run with a system that supports DCID
This test SHALL be performed with the following parameter set:
Table 24 - SRA Configuration
Rate Adaptation Mode (RA-MODEds) DYNAMIC
Downstream Target Noise Margin (TARSNRMds) 6dB
Downstream Downshift Noise Margin
(RA-DSNRMds)
3dB
Downstream Minimum Downshift Rate Adaptation
Interval(RA-DTIMEds)
10sec
Downstream Upshift Noise Margin
(RA-USNRMds)
9dB
Downstream Minimum Upshift Rate Adaptation
Interval(RA-UTIMEds)
30sec
Rate Adaptation Mode (RA-MODEus) DYNAMIC
Upstream Target Noise Margin (TARSNRMus) 6dB
Upstream Downshift Noise Margin
(RA-DSNRMus)
3dB
Upstream Minimum Downshift Rate Adaptation
Interval(RA-DTIMEus)
10sec
Upstream Upshift Noise Margin(RA-USNRMus) 9dB
Upstream Minimum Upshift Rate Adaptation
Upstream (RA-UTIMEus)
30sec
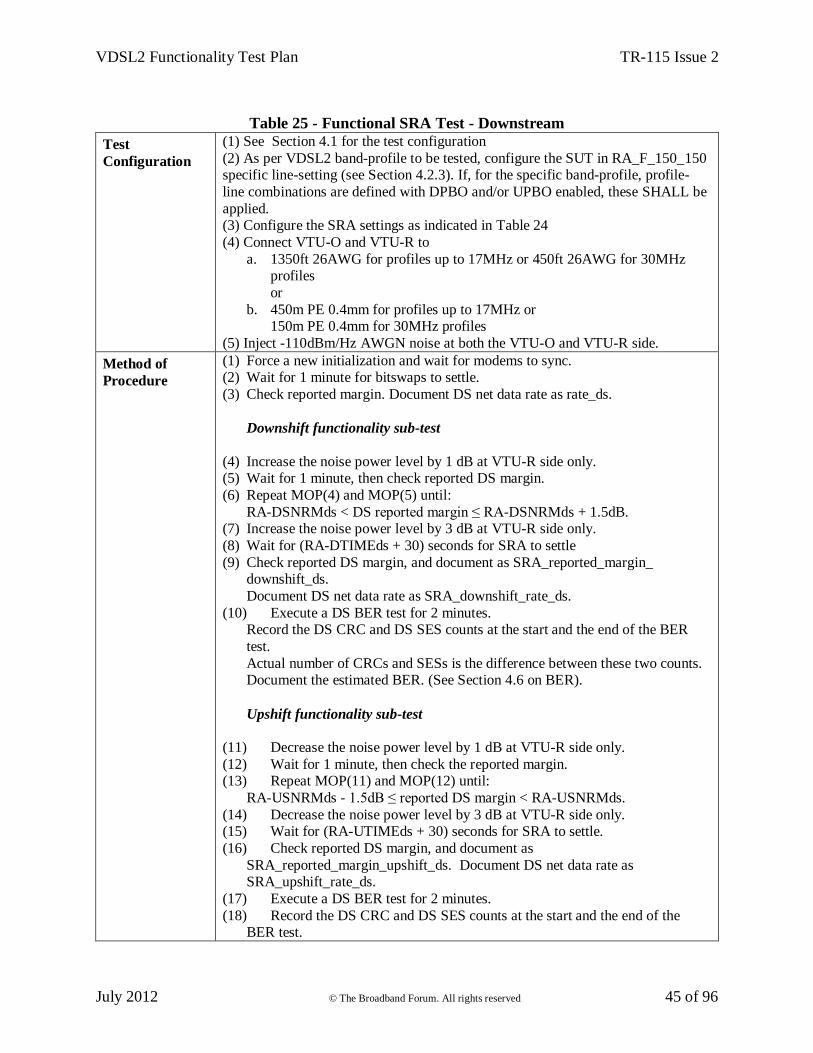
VDSL2 Functionality Test Plan TR-115 Issue 2
July 2012 © The Broadband Forum. All rights reserved 45 of 96
Table 25 - Functional SRA Test - Downstream
Test
Configuration
(1) See Section 4.1 for the test configuration
(2) As per VDSL2 band-profile to be tested, configure the SUT in RA_F_150_150 specific line-setting (see Section 4.2.3). If, for the specific band-profile, profile-
line combinations are defined with DPBO and/or UPBO enabled, these SHALL be
applied. (3) Configure the SRA settings as indicated in Table 24
(4) Connect VTU-O and VTU-R to
a. 1350ft 26AWG for profiles up to 17MHz or 450ft 26AWG for 30MHz profiles
or
b. 450m PE 0.4mm for profiles up to 17MHz or 150m PE 0.4mm for 30MHz profiles
(5) Inject -110dBm/Hz AWGN noise at both the VTU-O and VTU-R side.
Method of
Procedure
(1) Force a new initialization and wait for modems to sync. (2) Wait for 1 minute for bitswaps to settle.
(3) Check reported margin. Document DS net data rate as rate_ds.
Downshift functionality sub-test
(4) Increase the noise power level by 1 dB at VTU-R side only. (5) Wait for 1 minute, then check reported DS margin.
(6) Repeat MOP(4) and MOP(5) until:
RA-DSNRMds < DS reported margin ≤ RA-DSNRMds + 1.5dB. (7) Increase the noise power level by 3 dB at VTU-R side only.
(8) Wait for (RA-DTIMEds + 30) seconds for SRA to settle
(9) Check reported DS margin, and document as SRA_reported_margin_ downshift_ds.
Document DS net data rate as SRA_downshift_rate_ds.
(10) Execute a DS BER test for 2 minutes. Record the DS CRC and DS SES counts at the start and the end of the BER
test.
Actual number of CRCs and SESs is the difference between these two counts. Document the estimated BER. (See Section 4.6 on BER).
Upshift functionality sub-test
(11) Decrease the noise power level by 1 dB at VTU-R side only.
(12) Wait for 1 minute, then check the reported margin. (13) Repeat MOP(11) and MOP(12) until:
RA-USNRMds - 1.5dB ≤ reported DS margin < RA-USNRMds.
(14) Decrease the noise power level by 3 dB at VTU-R side only. (15) Wait for (RA-UTIMEds + 30) seconds for SRA to settle.
(16) Check reported DS margin, and document as
SRA_reported_margin_upshift_ds. Document DS net data rate as SRA_upshift_rate_ds.
(17) Execute a DS BER test for 2 minutes.
(18) Record the DS CRC and DS SES counts at the start and the end of the BER test.
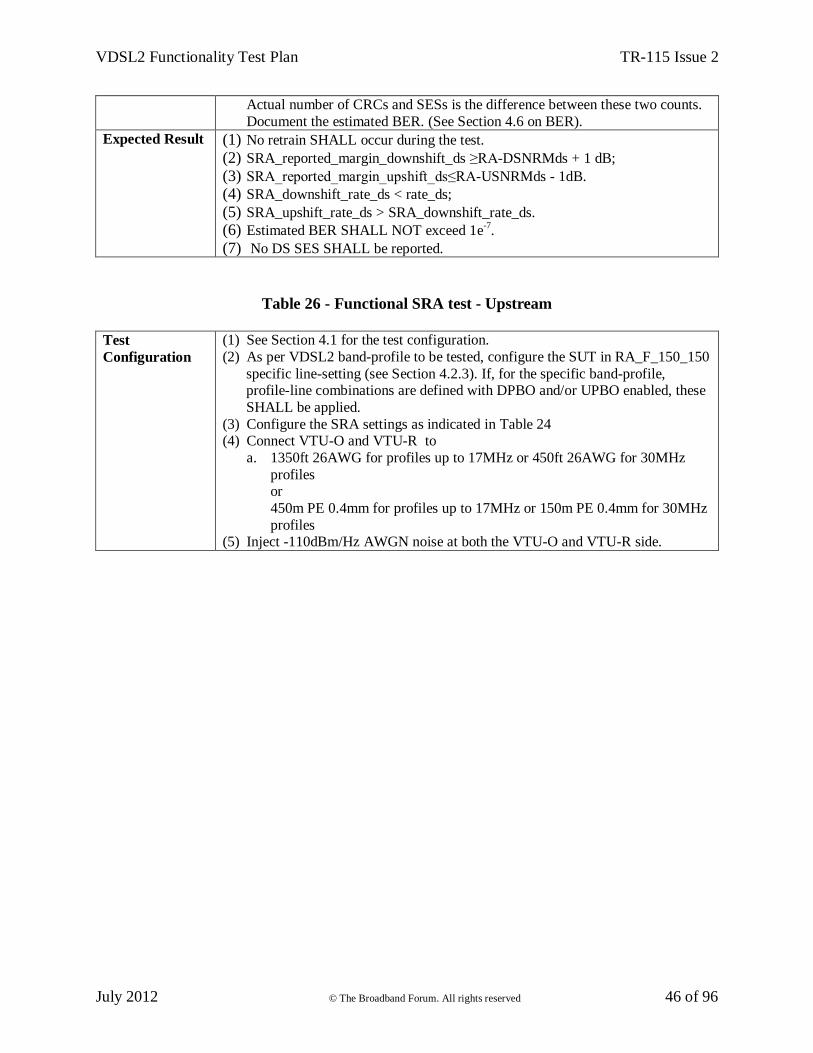
VDSL2 Functionality Test Plan TR-115 Issue 2
July 2012 © The Broadband Forum. All rights reserved 46 of 96
Actual number of CRCs and SESs is the difference between these two counts.
Document the estimated BER. (See Section 4.6 on BER).
Expected Result (1) No retrain SHALL occur during the test.
(2) SRA_reported_margin_downshift_ds ≥RA-DSNRMds + 1 dB;
(3) SRA_reported_margin_upshift_ds≤RA-USNRMds - 1dB.
(4) SRA_downshift_rate_ds < rate_ds;
(5) SRA_upshift_rate_ds > SRA_downshift_rate_ds.
(6) Estimated BER SHALL NOT exceed 1e-7.
(7) No DS SES SHALL be reported.
Table 26 - Functional SRA test - Upstream
Test
Configuration
(1) See Section 4.1 for the test configuration.
(2) As per VDSL2 band-profile to be tested, configure the SUT in RA_F_150_150
specific line-setting (see Section 4.2.3). If, for the specific band-profile, profile-line combinations are defined with DPBO and/or UPBO enabled, these
SHALL be applied.
(3) Configure the SRA settings as indicated in Table 24 (4) Connect VTU-O and VTU-R to
a. 1350ft 26AWG for profiles up to 17MHz or 450ft 26AWG for 30MHz
profiles or
450m PE 0.4mm for profiles up to 17MHz or 150m PE 0.4mm for 30MHz
profiles (5) Inject -110dBm/Hz AWGN noise at both the VTU-O and VTU-R side.
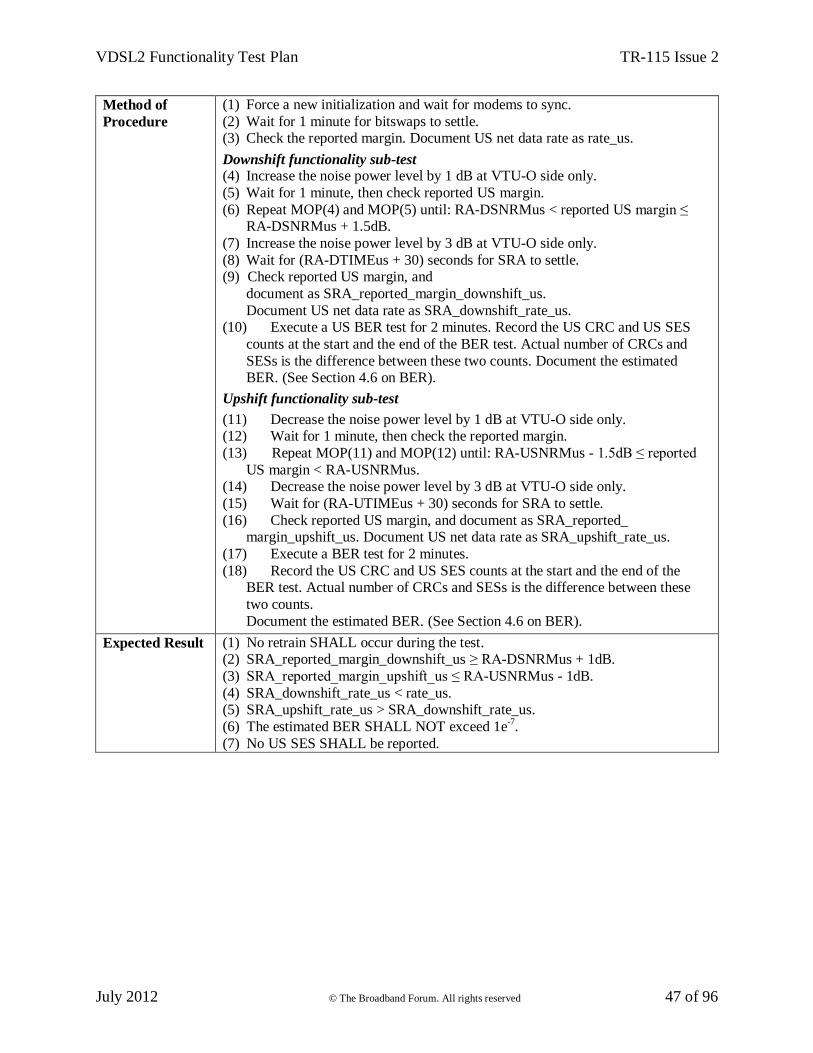
VDSL2 Functionality Test Plan TR-115 Issue 2
July 2012 © The Broadband Forum. All rights reserved 47 of 96
Method of
Procedure
(1) Force a new initialization and wait for modems to sync.
(2) Wait for 1 minute for bitswaps to settle. (3) Check the reported margin. Document US net data rate as rate_us.
Downshift functionality sub-test (4) Increase the noise power level by 1 dB at VTU-O side only.
(5) Wait for 1 minute, then check reported US margin.
(6) Repeat MOP(4) and MOP(5) until: RA-DSNRMus < reported US margin ≤ RA-DSNRMus + 1.5dB.
(7) Increase the noise power level by 3 dB at VTU-O side only.
(8) Wait for (RA-DTIMEus + 30) seconds for SRA to settle. (9) Check reported US margin, and
document as SRA_reported_margin_downshift_us.
Document US net data rate as SRA_downshift_rate_us. (10) Execute a US BER test for 2 minutes. Record the US CRC and US SES
counts at the start and the end of the BER test. Actual number of CRCs and
SESs is the difference between these two counts. Document the estimated BER. (See Section 4.6 on BER).
Upshift functionality sub-test
(11) Decrease the noise power level by 1 dB at VTU-O side only. (12) Wait for 1 minute, then check the reported margin.
(13) Repeat MOP(11) and MOP(12) until: RA-USNRMus - 1.5dB ≤ reported
US margin < RA-USNRMus. (14) Decrease the noise power level by 3 dB at VTU-O side only.
(15) Wait for (RA-UTIMEus + 30) seconds for SRA to settle.
(16) Check reported US margin, and document as SRA_reported_ margin_upshift_us. Document US net data rate as SRA_upshift_rate_us.
(17) Execute a BER test for 2 minutes.
(18) Record the US CRC and US SES counts at the start and the end of the BER test. Actual number of CRCs and SESs is the difference between these
two counts.
Document the estimated BER. (See Section 4.6 on BER).
Expected Result (1) No retrain SHALL occur during the test. (2) SRA_reported_margin_downshift_us ≥ RA-DSNRMus + 1dB.
(3) SRA_reported_margin_upshift_us ≤ RA-USNRMus - 1dB.
(4) SRA_downshift_rate_us < rate_us. (5) SRA_upshift_rate_us > SRA_downshift_rate_us.
(6) The estimated BER SHALL NOT exceed 1e-7.
(7) No US SES SHALL be reported.
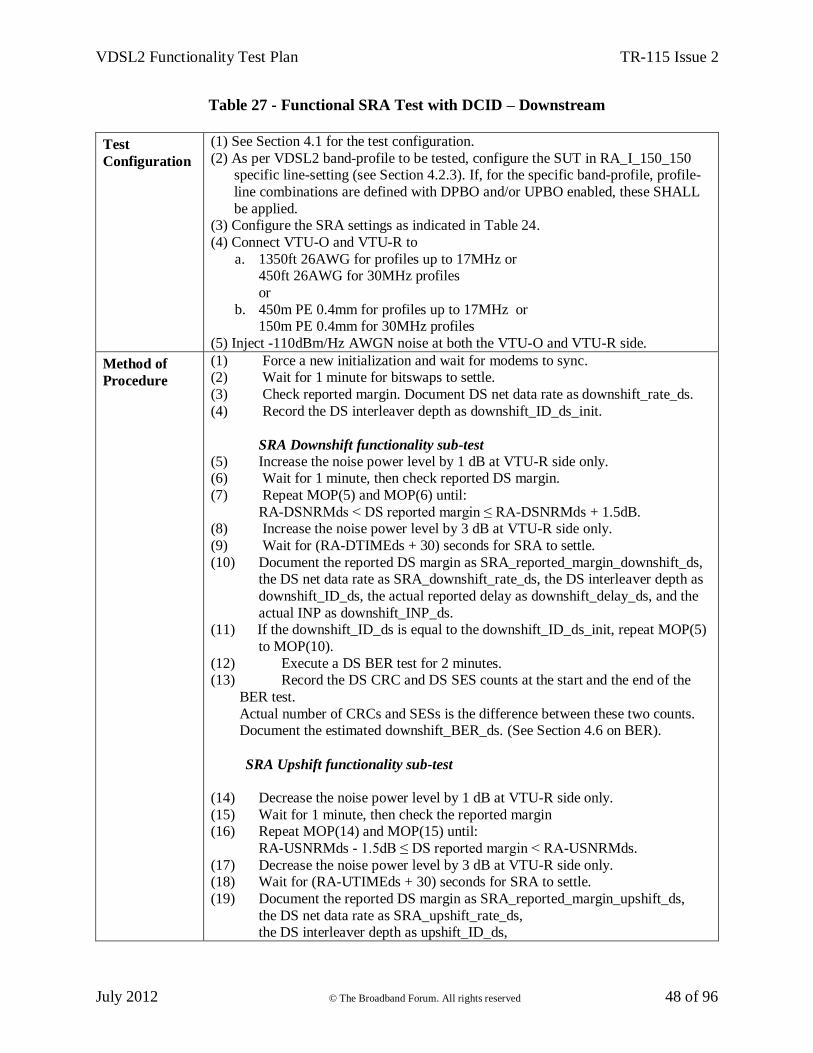
VDSL2 Functionality Test Plan TR-115 Issue 2
July 2012 © The Broadband Forum. All rights reserved 48 of 96
Table 27 - Functional SRA Test with DCID – Downstream
Test
Configuration
(1) See Section 4.1 for the test configuration.
(2) As per VDSL2 band-profile to be tested, configure the SUT in RA_I_150_150 specific line-setting (see Section 4.2.3). If, for the specific band-profile, profile-
line combinations are defined with DPBO and/or UPBO enabled, these SHALL
be applied. (3) Configure the SRA settings as indicated in Table 24.
(4) Connect VTU-O and VTU-R to
a. 1350ft 26AWG for profiles up to 17MHz or 450ft 26AWG for 30MHz profiles
or
b. 450m PE 0.4mm for profiles up to 17MHz or 150m PE 0.4mm for 30MHz profiles
(5) Inject -110dBm/Hz AWGN noise at both the VTU-O and VTU-R side.
Method of
Procedure
(1) Force a new initialization and wait for modems to sync. (2) Wait for 1 minute for bitswaps to settle.
(3) Check reported margin. Document DS net data rate as downshift_rate_ds.
(4) Record the DS interleaver depth as downshift_ID_ds_init.
SRA Downshift functionality sub-test (5) Increase the noise power level by 1 dB at VTU-R side only. (6) Wait for 1 minute, then check reported DS margin.
(7) Repeat MOP(5) and MOP(6) until:
RA-DSNRMds < DS reported margin ≤ RA-DSNRMds + 1.5dB. (8) Increase the noise power level by 3 dB at VTU-R side only.
(9) Wait for (RA-DTIMEds + 30) seconds for SRA to settle.
(10) Document the reported DS margin as SRA_reported_margin_downshift_ds, the DS net data rate as SRA_downshift_rate_ds, the DS interleaver depth as
downshift_ID_ds, the actual reported delay as downshift_delay_ds, and the
actual INP as downshift_INP_ds. (11) If the downshift_ID_ds is equal to the downshift_ID_ds_init, repeat MOP(5)
to MOP(10).
(12) Execute a DS BER test for 2 minutes. (13) Record the DS CRC and DS SES counts at the start and the end of the
BER test.
Actual number of CRCs and SESs is the difference between these two counts. Document the estimated downshift_BER_ds. (See Section 4.6 on BER).
SRA Upshift functionality sub-test
(14) Decrease the noise power level by 1 dB at VTU-R side only.
(15) Wait for 1 minute, then check the reported margin (16) Repeat MOP(14) and MOP(15) until:
RA-USNRMds - 1.5dB ≤ DS reported margin < RA-USNRMds.
(17) Decrease the noise power level by 3 dB at VTU-R side only. (18) Wait for (RA-UTIMEds + 30) seconds for SRA to settle.
(19) Document the reported DS margin as SRA_reported_margin_upshift_ds,
the DS net data rate as SRA_upshift_rate_ds, the DS interleaver depth as upshift_ID_ds,
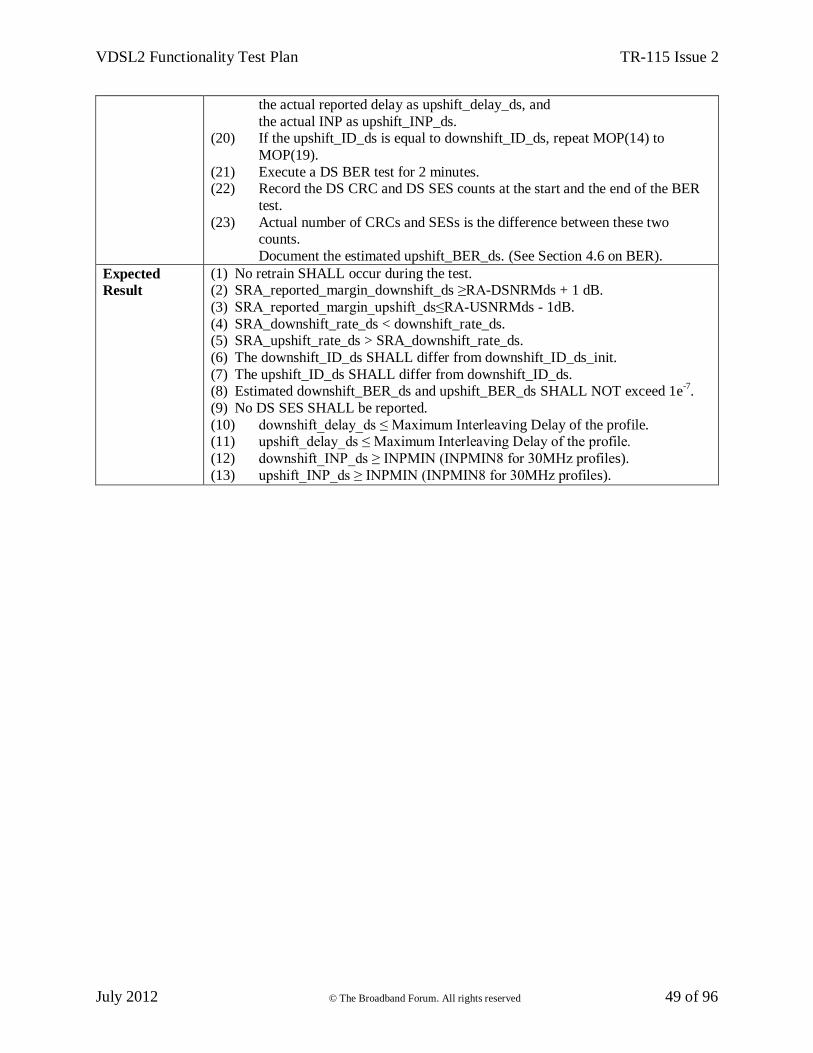
VDSL2 Functionality Test Plan TR-115 Issue 2
July 2012 © The Broadband Forum. All rights reserved 49 of 96
the actual reported delay as upshift_delay_ds, and
the actual INP as upshift_INP_ds. (20) If the upshift_ID_ds is equal to downshift_ID_ds, repeat MOP(14) to
MOP(19).
(21) Execute a DS BER test for 2 minutes. (22) Record the DS CRC and DS SES counts at the start and the end of the BER
test.
(23) Actual number of CRCs and SESs is the difference between these two counts.
Document the estimated upshift_BER_ds. (See Section 4.6 on BER).
Expected
Result
(1) No retrain SHALL occur during the test. (2) SRA_reported_margin_downshift_ds ≥RA-DSNRMds + 1 dB.
(3) SRA_reported_margin_upshift_ds≤RA-USNRMds - 1dB.
(4) SRA_downshift_rate_ds < downshift_rate_ds. (5) SRA_upshift_rate_ds > SRA_downshift_rate_ds.
(6) The downshift_ID_ds SHALL differ from downshift_ID_ds_init.
(7) The upshift_ID_ds SHALL differ from downshift_ID_ds. (8) Estimated downshift_BER_ds and upshift_BER_ds SHALL NOT exceed 1e
-7.
(9) No DS SES SHALL be reported.
(10) downshift_delay_ds ≤ Maximum Interleaving Delay of the profile. (11) upshift_delay_ds ≤ Maximum Interleaving Delay of the profile.
(12) downshift_INP_ds ≥ INPMIN (INPMIN8 for 30MHz profiles).
(13) upshift_INP_ds ≥ INPMIN (INPMIN8 for 30MHz profiles).
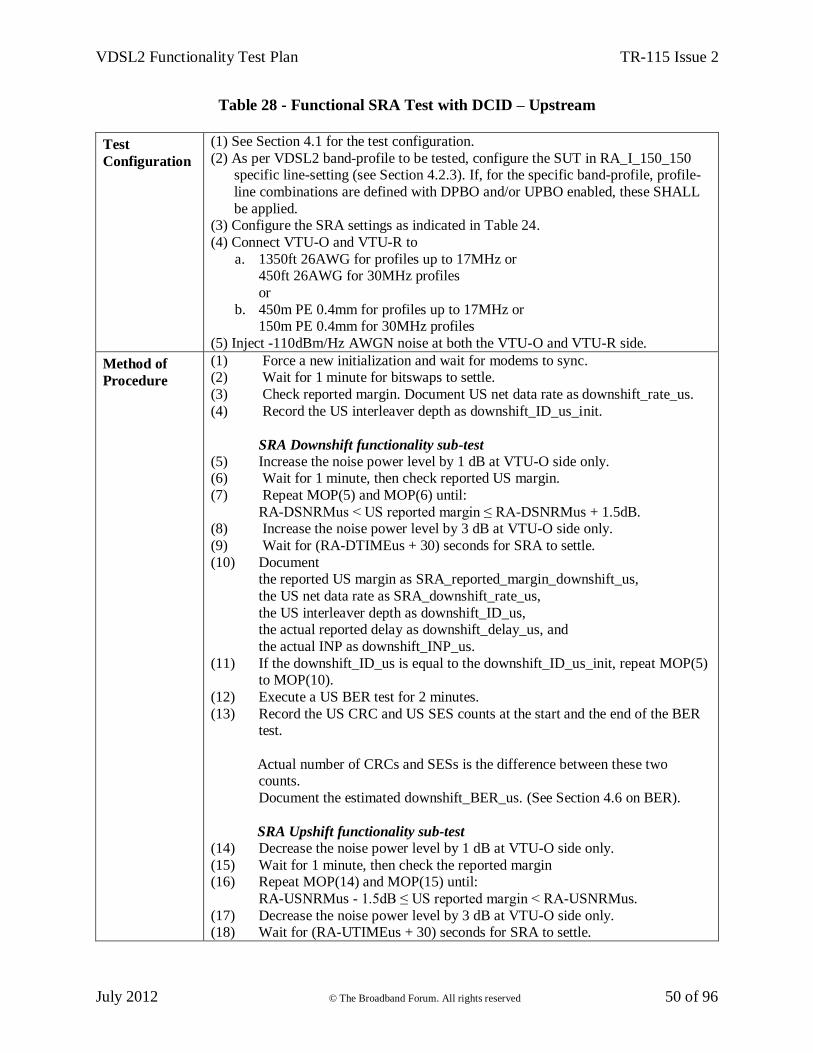
VDSL2 Functionality Test Plan TR-115 Issue 2
July 2012 © The Broadband Forum. All rights reserved 50 of 96
Table 28 - Functional SRA Test with DCID – Upstream
Test
Configuration
(1) See Section 4.1 for the test configuration.
(2) As per VDSL2 band-profile to be tested, configure the SUT in RA_I_150_150 specific line-setting (see Section 4.2.3). If, for the specific band-profile, profile-
line combinations are defined with DPBO and/or UPBO enabled, these SHALL
be applied. (3) Configure the SRA settings as indicated in Table 24.
(4) Connect VTU-O and VTU-R to
a. 1350ft 26AWG for profiles up to 17MHz or 450ft 26AWG for 30MHz profiles
or
b. 450m PE 0.4mm for profiles up to 17MHz or 150m PE 0.4mm for 30MHz profiles
(5) Inject -110dBm/Hz AWGN noise at both the VTU-O and VTU-R side.
Method of
Procedure
(1) Force a new initialization and wait for modems to sync. (2) Wait for 1 minute for bitswaps to settle.
(3) Check reported margin. Document US net data rate as downshift_rate_us.
(4) Record the US interleaver depth as downshift_ID_us_init.
SRA Downshift functionality sub-test (5) Increase the noise power level by 1 dB at VTU-O side only. (6) Wait for 1 minute, then check reported US margin.
(7) Repeat MOP(5) and MOP(6) until:
RA-DSNRMus < US reported margin ≤ RA-DSNRMus + 1.5dB. (8) Increase the noise power level by 3 dB at VTU-O side only.
(9) Wait for (RA-DTIMEus + 30) seconds for SRA to settle.
(10) Document the reported US margin as SRA_reported_margin_downshift_us,
the US net data rate as SRA_downshift_rate_us,
the US interleaver depth as downshift_ID_us, the actual reported delay as downshift_delay_us, and
the actual INP as downshift_INP_us.
(11) If the downshift_ID_us is equal to the downshift_ID_us_init, repeat MOP(5) to MOP(10).
(12) Execute a US BER test for 2 minutes.
(13) Record the US CRC and US SES counts at the start and the end of the BER test.
Actual number of CRCs and SESs is the difference between these two counts.
Document the estimated downshift_BER_us. (See Section 4.6 on BER).
SRA Upshift functionality sub-test (14) Decrease the noise power level by 1 dB at VTU-O side only.
(15) Wait for 1 minute, then check the reported margin (16) Repeat MOP(14) and MOP(15) until:
RA-USNRMus - 1.5dB ≤ US reported margin < RA-USNRMus.
(17) Decrease the noise power level by 3 dB at VTU-O side only. (18) Wait for (RA-UTIMEus + 30) seconds for SRA to settle.
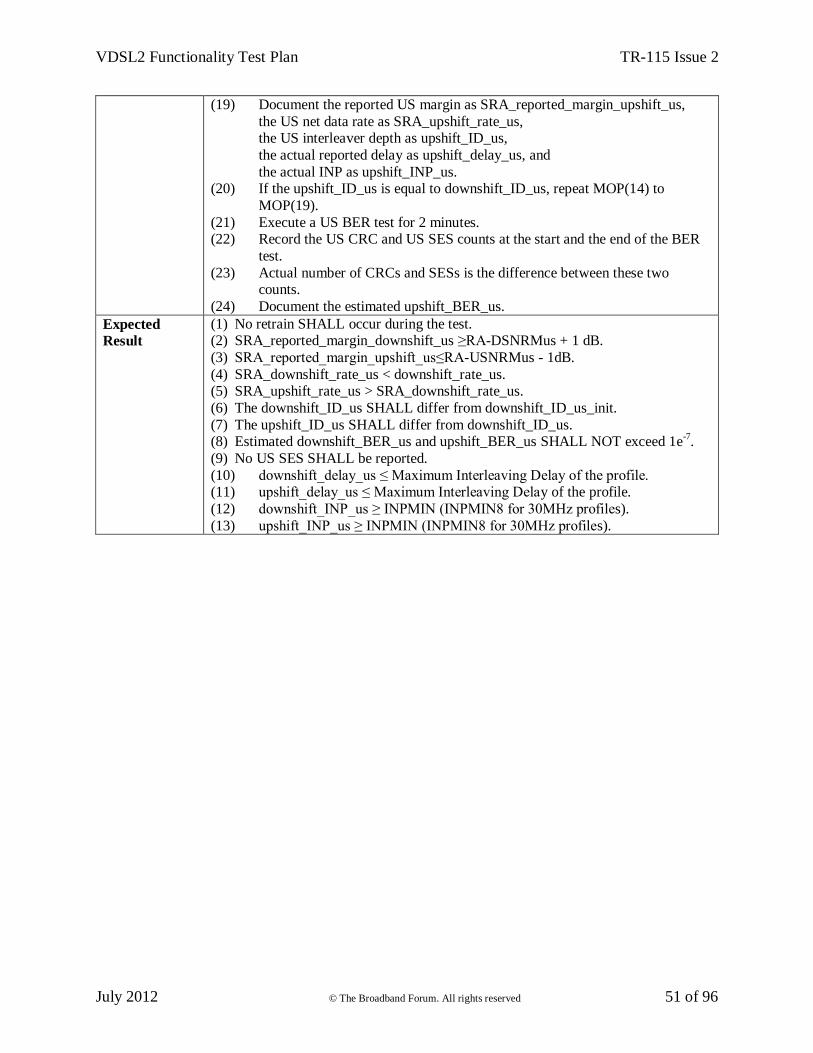
VDSL2 Functionality Test Plan TR-115 Issue 2
July 2012 © The Broadband Forum. All rights reserved 51 of 96
(19) Document the reported US margin as SRA_reported_margin_upshift_us,
the US net data rate as SRA_upshift_rate_us, the US interleaver depth as upshift_ID_us,
the actual reported delay as upshift_delay_us, and
the actual INP as upshift_INP_us. (20) If the upshift_ID_us is equal to downshift_ID_us, repeat MOP(14) to
MOP(19).
(21) Execute a US BER test for 2 minutes. (22) Record the US CRC and US SES counts at the start and the end of the BER
test.
(23) Actual number of CRCs and SESs is the difference between these two counts.
(24) Document the estimated upshift_BER_us.
Expected
Result
(1) No retrain SHALL occur during the test. (2) SRA_reported_margin_downshift_us ≥RA-DSNRMus + 1 dB.
(3) SRA_reported_margin_upshift_us≤RA-USNRMus - 1dB.
(4) SRA_downshift_rate_us < downshift_rate_us. (5) SRA_upshift_rate_us > SRA_downshift_rate_us.
(6) The downshift_ID_us SHALL differ from downshift_ID_us_init.
(7) The upshift_ID_us SHALL differ from downshift_ID_us. (8) Estimated downshift_BER_us and upshift_BER_us SHALL NOT exceed 1e
-7.
(9) No US SES SHALL be reported.
(10) downshift_delay_us ≤ Maximum Interleaving Delay of the profile. (11) upshift_delay_us ≤ Maximum Interleaving Delay of the profile.
(12) downshift_INP_us ≥ INPMIN (INPMIN8 for 30MHz profiles).
(13) upshift_INP_us ≥ INPMIN (INPMIN8 for 30MHz profiles).
VDSL2 Functionality Test Plan TR-115 Issue 2
July 2012 © The Broadband Forum. All rights reserved 52 of 96
5.4.4 SOS Test (Optional)
The purpose of this test is to verify that the optional OLR mechanism SOS is implemented
according to the directions of Amendment 3 of ITU-T G.993.2. The test SHALL apply to the
SOS functionality with enabled ROC (robust overhead channel).
NOTE – For the following test configuration, the MIN-SOS-BR is configured to be greater than
Min-NDR.
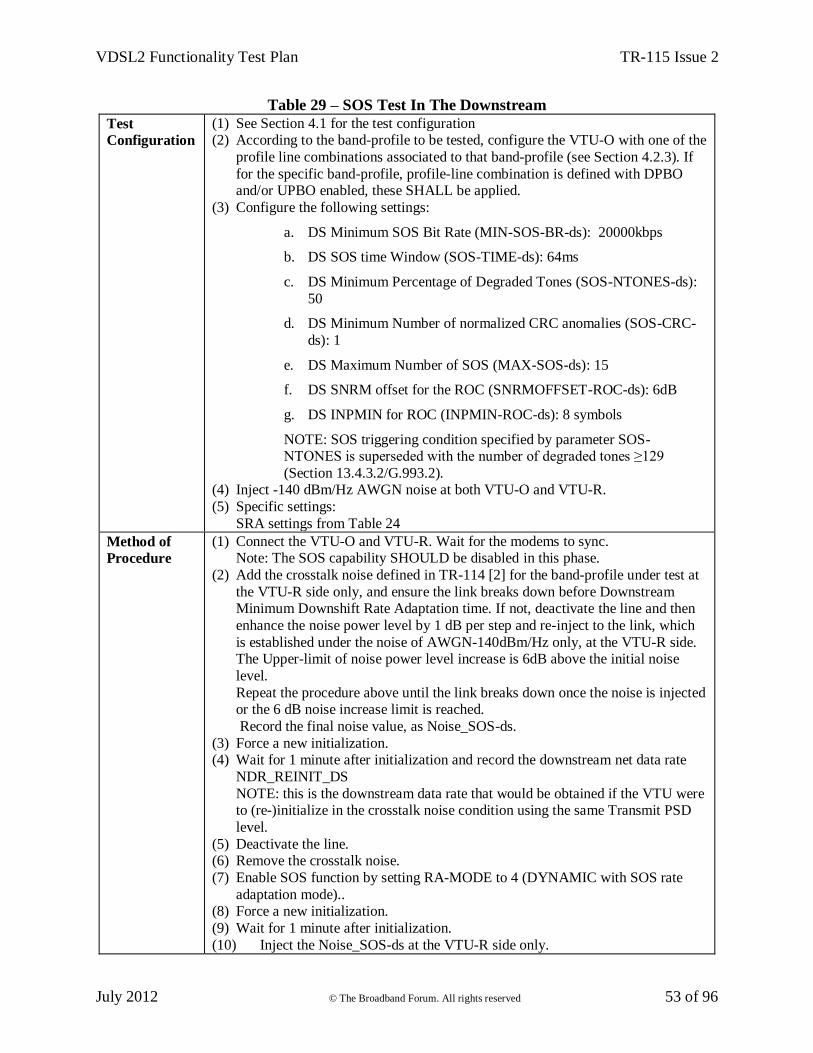
VDSL2 Functionality Test Plan TR-115 Issue 2
July 2012 © The Broadband Forum. All rights reserved 53 of 96
Table 29 – SOS Test In The Downstream
Test
Configuration
(1) See Section 4.1 for the test configuration (2) According to the band-profile to be tested, configure the VTU-O with one of the
profile line combinations associated to that band-profile (see Section 4.2.3). If
for the specific band-profile, profile-line combination is defined with DPBO and/or UPBO enabled, these SHALL be applied.
(3) Configure the following settings:
a. DS Minimum SOS Bit Rate (MIN-SOS-BR-ds): 20000kbps
b. DS SOS time Window (SOS-TIME-ds): 64ms
c. DS Minimum Percentage of Degraded Tones (SOS-NTONES-ds):
50
d. DS Minimum Number of normalized CRC anomalies (SOS-CRC-
ds): 1
e. DS Maximum Number of SOS (MAX-SOS-ds): 15
f. DS SNRM offset for the ROC (SNRMOFFSET-ROC-ds): 6dB
g. DS INPMIN for ROC (INPMIN-ROC-ds): 8 symbols
NOTE: SOS triggering condition specified by parameter SOS-NTONES is superseded with the number of degraded tones ≥129
(Section 13.4.3.2/G.993.2). (4) Inject -140 dBm/Hz AWGN noise at both VTU-O and VTU-R.
(5) Specific settings:
SRA settings from Table 24
Method of
Procedure
(1) Connect the VTU-O and VTU-R. Wait for the modems to sync. Note: The SOS capability SHOULD be disabled in this phase.
(2) Add the crosstalk noise defined in TR-114 [2] for the band-profile under test at
the VTU-R side only, and ensure the link breaks down before Downstream Minimum Downshift Rate Adaptation time. If not, deactivate the line and then
enhance the noise power level by 1 dB per step and re-inject to the link, which
is established under the noise of AWGN-140dBm/Hz only, at the VTU-R side. The Upper-limit of noise power level increase is 6dB above the initial noise
level.
Repeat the procedure above until the link breaks down once the noise is injected or the 6 dB noise increase limit is reached.
Record the final noise value, as Noise_SOS-ds.
(3) Force a new initialization. (4) Wait for 1 minute after initialization and record the downstream net data rate
NDR_REINIT_DS
NOTE: this is the downstream data rate that would be obtained if the VTU were to (re-)initialize in the crosstalk noise condition using the same Transmit PSD
level.
(5) Deactivate the line. (6) Remove the crosstalk noise.
(7) Enable SOS function by setting RA-MODE to 4 (DYNAMIC with SOS rate
adaptation mode).. (8) Force a new initialization.
(9) Wait for 1 minute after initialization.
(10) Inject the Noise_SOS-ds at the VTU-R side only.
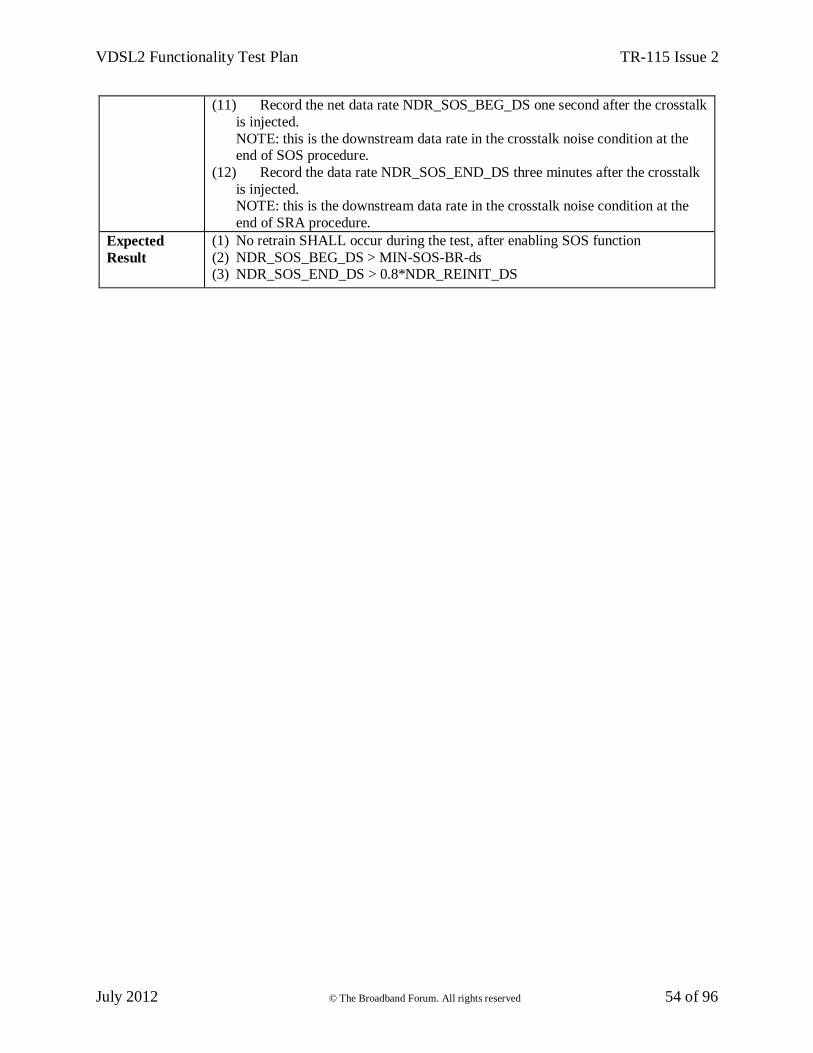
VDSL2 Functionality Test Plan TR-115 Issue 2
July 2012 © The Broadband Forum. All rights reserved 54 of 96
(11) Record the net data rate NDR_SOS_BEG_DS one second after the crosstalk
is injected.
NOTE: this is the downstream data rate in the crosstalk noise condition at the end of SOS procedure.
(12) Record the data rate NDR_SOS_END_DS three minutes after the crosstalk
is injected. NOTE: this is the downstream data rate in the crosstalk noise condition at the
end of SRA procedure.
Expected
Result
(1) No retrain SHALL occur during the test, after enabling SOS function
(2) NDR_SOS_BEG_DS > MIN-SOS-BR-ds (3) NDR_SOS_END_DS > 0.8*NDR_REINIT_DS
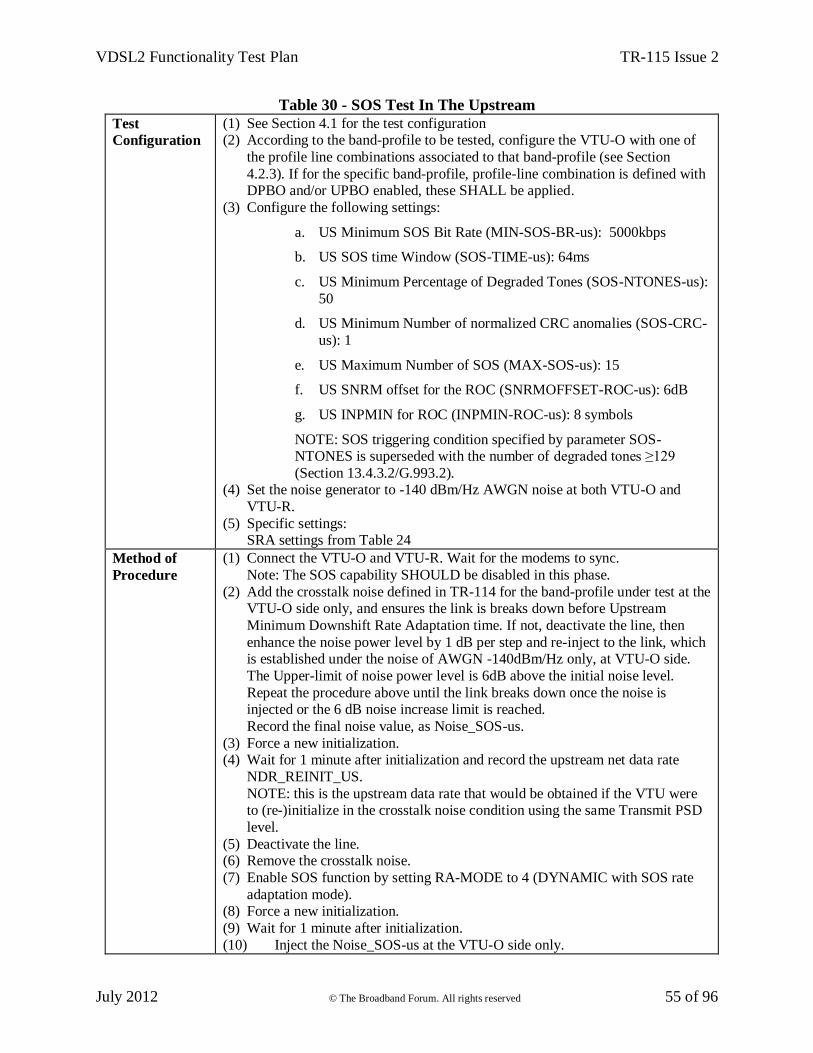
VDSL2 Functionality Test Plan TR-115 Issue 2
July 2012 © The Broadband Forum. All rights reserved 55 of 96
Table 30 - SOS Test In The Upstream
Test
Configuration
(1) See Section 4.1 for the test configuration (2) According to the band-profile to be tested, configure the VTU-O with one of
the profile line combinations associated to that band-profile (see Section
4.2.3). If for the specific band-profile, profile-line combination is defined with DPBO and/or UPBO enabled, these SHALL be applied.
(3) Configure the following settings:
a. US Minimum SOS Bit Rate (MIN-SOS-BR-us): 5000kbps
b. US SOS time Window (SOS-TIME-us): 64ms
c. US Minimum Percentage of Degraded Tones (SOS-NTONES-us):
50
d. US Minimum Number of normalized CRC anomalies (SOS-CRC-
us): 1
e. US Maximum Number of SOS (MAX-SOS-us): 15
f. US SNRM offset for the ROC (SNRMOFFSET-ROC-us): 6dB
g. US INPMIN for ROC (INPMIN-ROC-us): 8 symbols
NOTE: SOS triggering condition specified by parameter SOS-NTONES is superseded with the number of degraded tones ≥129
(Section 13.4.3.2/G.993.2). (4) Set the noise generator to -140 dBm/Hz AWGN noise at both VTU-O and
VTU-R.
(5) Specific settings: SRA settings from Table 24
Method of
Procedure
(1) Connect the VTU-O and VTU-R. Wait for the modems to sync.
Note: The SOS capability SHOULD be disabled in this phase.
(2) Add the crosstalk noise defined in TR-114 for the band-profile under test at the VTU-O side only, and ensures the link is breaks down before Upstream
Minimum Downshift Rate Adaptation time. If not, deactivate the line, then
enhance the noise power level by 1 dB per step and re-inject to the link, which is established under the noise of AWGN -140dBm/Hz only, at VTU-O side.
The Upper-limit of noise power level is 6dB above the initial noise level.
Repeat the procedure above until the link breaks down once the noise is injected or the 6 dB noise increase limit is reached.
Record the final noise value, as Noise_SOS-us.
(3) Force a new initialization. (4) Wait for 1 minute after initialization and record the upstream net data rate
NDR_REINIT_US.
NOTE: this is the upstream data rate that would be obtained if the VTU were to (re-)initialize in the crosstalk noise condition using the same Transmit PSD
level.
(5) Deactivate the line. (6) Remove the crosstalk noise.
(7) Enable SOS function by setting RA-MODE to 4 (DYNAMIC with SOS rate
adaptation mode). (8) Force a new initialization.
(9) Wait for 1 minute after initialization.
(10) Inject the Noise_SOS-us at the VTU-O side only.
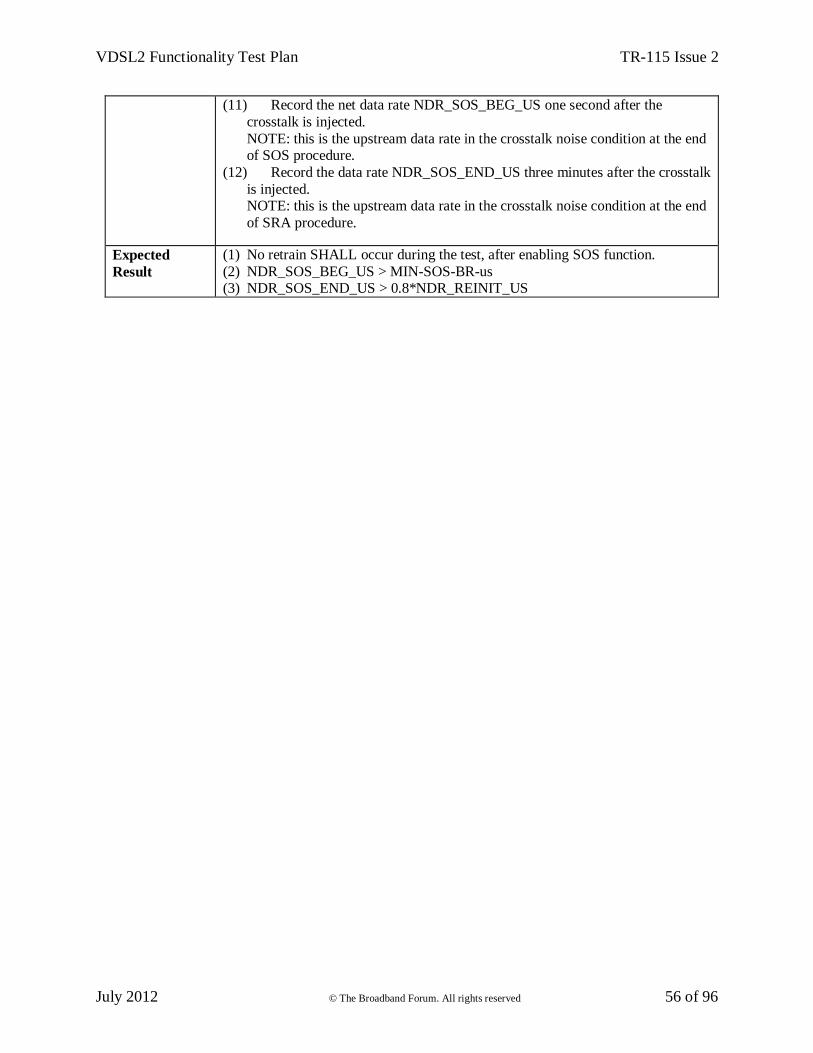
VDSL2 Functionality Test Plan TR-115 Issue 2
July 2012 © The Broadband Forum. All rights reserved 56 of 96
(11) Record the net data rate NDR_SOS_BEG_US one second after the
crosstalk is injected.
NOTE: this is the upstream data rate in the crosstalk noise condition at the end of SOS procedure.
(12) Record the data rate NDR_SOS_END_US three minutes after the crosstalk
is injected. NOTE: this is the upstream data rate in the crosstalk noise condition at the end
of SRA procedure.
Expected
Result
(1) No retrain SHALL occur during the test, after enabling SOS function.
(2) NDR_SOS_BEG_US > MIN-SOS-BR-us (3) NDR_SOS_END_US > 0.8*NDR_REINIT_US
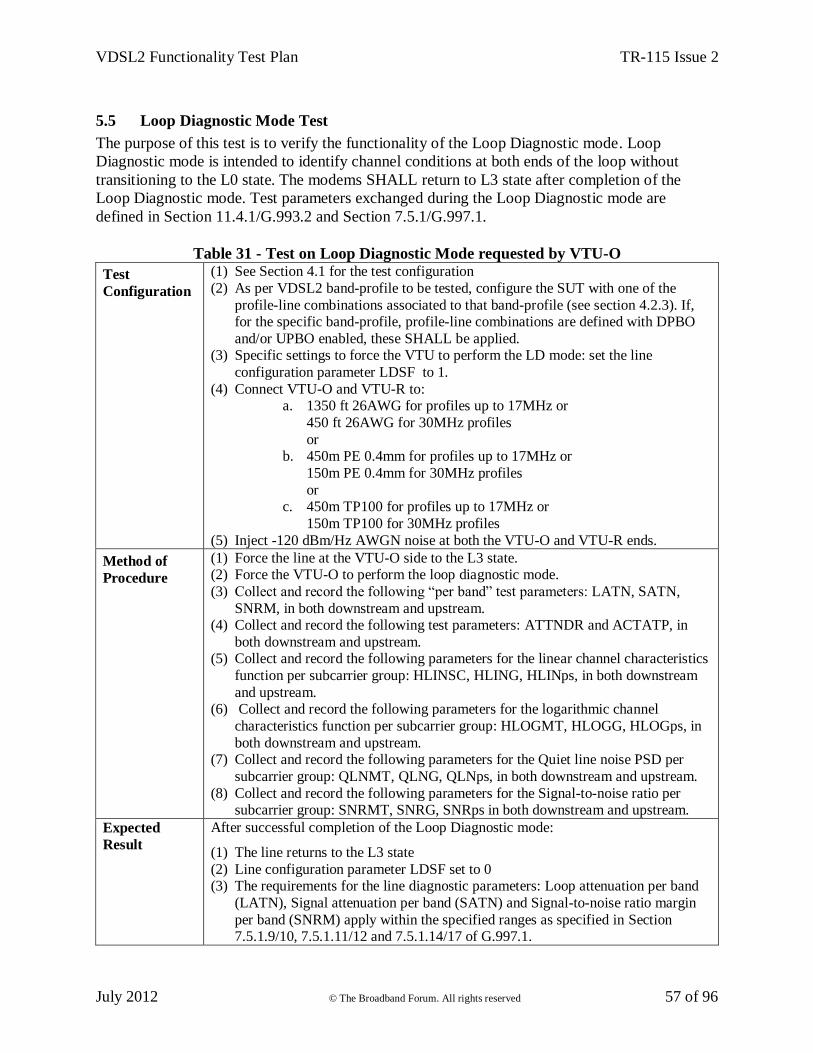
VDSL2 Functionality Test Plan TR-115 Issue 2
July 2012 © The Broadband Forum. All rights reserved 57 of 96
5.5 Loop Diagnostic Mode Test
The purpose of this test is to verify the functionality of the Loop Diagnostic mode. Loop
Diagnostic mode is intended to identify channel conditions at both ends of the loop without
transitioning to the L0 state. The modems SHALL return to L3 state after completion of the
Loop Diagnostic mode. Test parameters exchanged during the Loop Diagnostic mode are
defined in Section 11.4.1/G.993.2 and Section 7.5.1/G.997.1.
Table 31 - Test on Loop Diagnostic Mode requested by VTU-O
Test
Configuration
(1) See Section 4.1 for the test configuration
(2) As per VDSL2 band-profile to be tested, configure the SUT with one of the
profile-line combinations associated to that band-profile (see section 4.2.3). If, for the specific band-profile, profile-line combinations are defined with DPBO
and/or UPBO enabled, these SHALL be applied. (3) Specific settings to force the VTU to perform the LD mode: set the line
configuration parameter LDSF to 1.
(4) Connect VTU-O and VTU-R to: a. 1350 ft 26AWG for profiles up to 17MHz or
450 ft 26AWG for 30MHz profiles
or b. 450m PE 0.4mm for profiles up to 17MHz or
150m PE 0.4mm for 30MHz profiles
or c. 450m TP100 for profiles up to 17MHz or
150m TP100 for 30MHz profiles
(5) Inject -120 dBm/Hz AWGN noise at both the VTU-O and VTU-R ends.
Method of
Procedure
(1) Force the line at the VTU-O side to the L3 state. (2) Force the VTU-O to perform the loop diagnostic mode.
(3) Collect and record the following “per band” test parameters: LATN, SATN,
SNRM, in both downstream and upstream. (4) Collect and record the following test parameters: ATTNDR and ACTATP, in
both downstream and upstream. (5) Collect and record the following parameters for the linear channel characteristics
function per subcarrier group: HLINSC, HLING, HLINps, in both downstream
and upstream. (6) Collect and record the following parameters for the logarithmic channel
characteristics function per subcarrier group: HLOGMT, HLOGG, HLOGps, in
both downstream and upstream. (7) Collect and record the following parameters for the Quiet line noise PSD per
subcarrier group: QLNMT, QLNG, QLNps, in both downstream and upstream.
(8) Collect and record the following parameters for the Signal-to-noise ratio per subcarrier group: SNRMT, SNRG, SNRps in both downstream and upstream.
Expected
Result
After successful completion of the Loop Diagnostic mode:
(1) The line returns to the L3 state
(2) Line configuration parameter LDSF set to 0 (3) The requirements for the line diagnostic parameters: Loop attenuation per band
(LATN), Signal attenuation per band (SATN) and Signal-to-noise ratio margin
per band (SNRM) apply within the specified ranges as specified in Section 7.5.1.9/10, 7.5.1.11/12 and 7.5.1.14/17 of G.997.1.
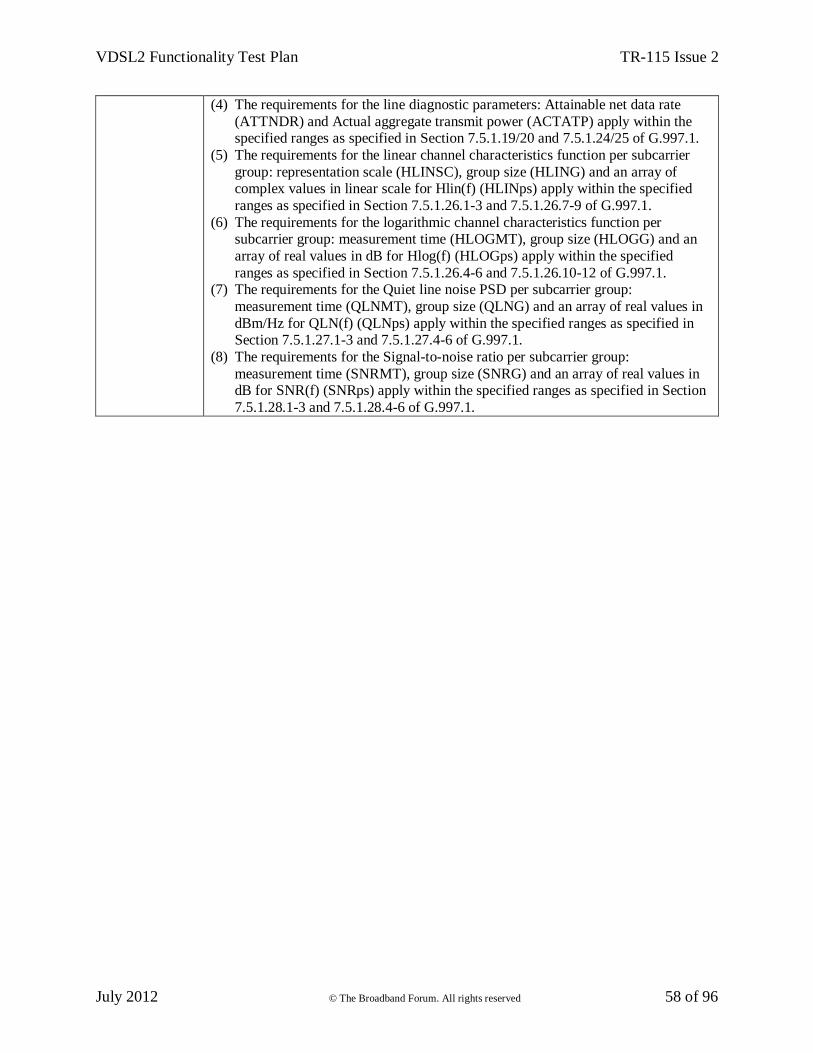
VDSL2 Functionality Test Plan TR-115 Issue 2
July 2012 © The Broadband Forum. All rights reserved 58 of 96
(4) The requirements for the line diagnostic parameters: Attainable net data rate
(ATTNDR) and Actual aggregate transmit power (ACTATP) apply within the specified ranges as specified in Section 7.5.1.19/20 and 7.5.1.24/25 of G.997.1.
(5) The requirements for the linear channel characteristics function per subcarrier
group: representation scale (HLINSC), group size (HLING) and an array of complex values in linear scale for Hlin(f) (HLINps) apply within the specified
ranges as specified in Section 7.5.1.26.1-3 and 7.5.1.26.7-9 of G.997.1.
(6) The requirements for the logarithmic channel characteristics function per subcarrier group: measurement time (HLOGMT), group size (HLOGG) and an
array of real values in dB for Hlog(f) (HLOGps) apply within the specified
ranges as specified in Section 7.5.1.26.4-6 and 7.5.1.26.10-12 of G.997.1. (7) The requirements for the Quiet line noise PSD per subcarrier group:
measurement time (QLNMT), group size (QLNG) and an array of real values in
dBm/Hz for QLN(f) (QLNps) apply within the specified ranges as specified in Section 7.5.1.27.1-3 and 7.5.1.27.4-6 of G.997.1.
(8) The requirements for the Signal-to-noise ratio per subcarrier group:
measurement time (SNRMT), group size (SNRG) and an array of real values in dB for SNR(f) (SNRps) apply within the specified ranges as specified in Section
7.5.1.28.1-3 and 7.5.1.28.4-6 of G.997.1.
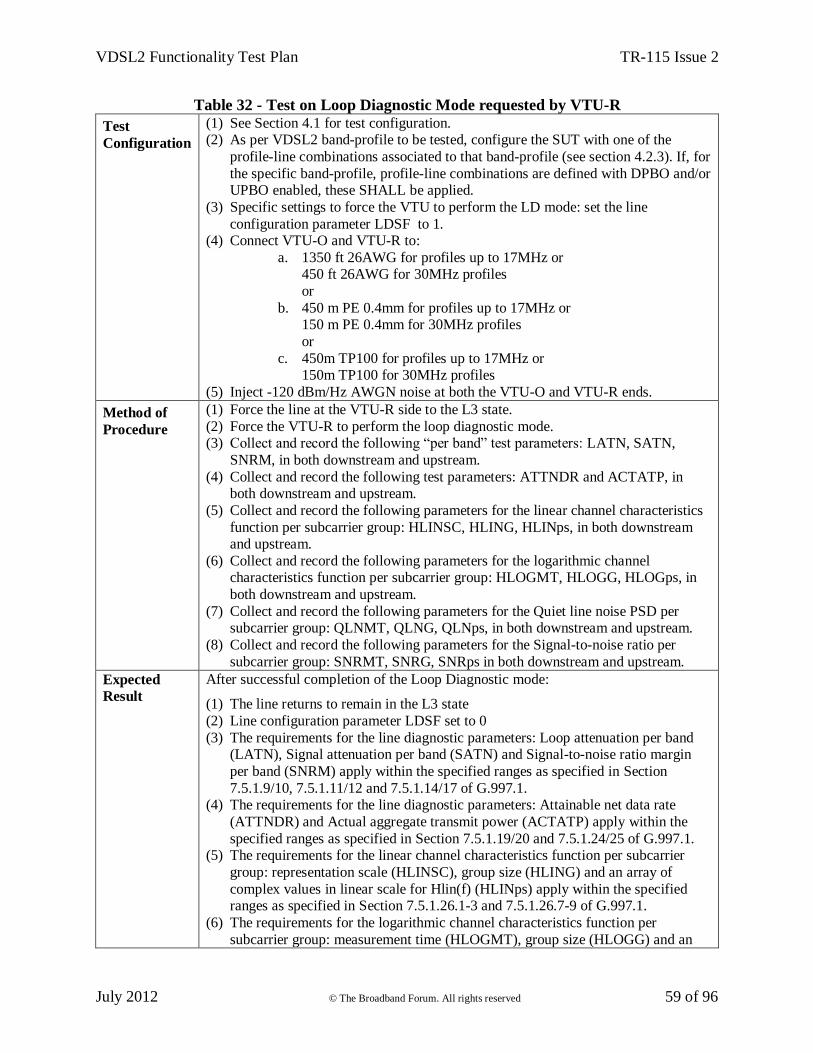
VDSL2 Functionality Test Plan TR-115 Issue 2
July 2012 © The Broadband Forum. All rights reserved 59 of 96
Table 32 - Test on Loop Diagnostic Mode requested by VTU-R
Test
Configuration
(1) See Section 4.1 for test configuration. (2) As per VDSL2 band-profile to be tested, configure the SUT with one of the
profile-line combinations associated to that band-profile (see section 4.2.3). If, for
the specific band-profile, profile-line combinations are defined with DPBO and/or UPBO enabled, these SHALL be applied.
(3) Specific settings to force the VTU to perform the LD mode: set the line
configuration parameter LDSF to 1. (4) Connect VTU-O and VTU-R to:
a. 1350 ft 26AWG for profiles up to 17MHz or 450 ft 26AWG for 30MHz profiles
or
b. 450 m PE 0.4mm for profiles up to 17MHz or 150 m PE 0.4mm for 30MHz profiles
or
c. 450m TP100 for profiles up to 17MHz or 150m TP100 for 30MHz profiles
(5) Inject -120 dBm/Hz AWGN noise at both the VTU-O and VTU-R ends.
Method of
Procedure
(1) Force the line at the VTU-R side to the L3 state.
(2) Force the VTU-R to perform the loop diagnostic mode. (3) Collect and record the following “per band” test parameters: LATN, SATN,
SNRM, in both downstream and upstream.
(4) Collect and record the following test parameters: ATTNDR and ACTATP, in both downstream and upstream.
(5) Collect and record the following parameters for the linear channel characteristics
function per subcarrier group: HLINSC, HLING, HLINps, in both downstream and upstream.
(6) Collect and record the following parameters for the logarithmic channel characteristics function per subcarrier group: HLOGMT, HLOGG, HLOGps, in
both downstream and upstream.
(7) Collect and record the following parameters for the Quiet line noise PSD per subcarrier group: QLNMT, QLNG, QLNps, in both downstream and upstream.
(8) Collect and record the following parameters for the Signal-to-noise ratio per
subcarrier group: SNRMT, SNRG, SNRps in both downstream and upstream.
Expected
Result
After successful completion of the Loop Diagnostic mode:
(1) The line returns to remain in the L3 state
(2) Line configuration parameter LDSF set to 0
(3) The requirements for the line diagnostic parameters: Loop attenuation per band (LATN), Signal attenuation per band (SATN) and Signal-to-noise ratio margin
per band (SNRM) apply within the specified ranges as specified in Section
7.5.1.9/10, 7.5.1.11/12 and 7.5.1.14/17 of G.997.1. (4) The requirements for the line diagnostic parameters: Attainable net data rate
(ATTNDR) and Actual aggregate transmit power (ACTATP) apply within the
specified ranges as specified in Section 7.5.1.19/20 and 7.5.1.24/25 of G.997.1. (5) The requirements for the linear channel characteristics function per subcarrier
group: representation scale (HLINSC), group size (HLING) and an array of
complex values in linear scale for Hlin(f) (HLINps) apply within the specified ranges as specified in Section 7.5.1.26.1-3 and 7.5.1.26.7-9 of G.997.1.
(6) The requirements for the logarithmic channel characteristics function per
subcarrier group: measurement time (HLOGMT), group size (HLOGG) and an
VDSL2 Functionality Test Plan TR-115 Issue 2
July 2012 © The Broadband Forum. All rights reserved 60 of 96
array of real values in dB for Hlog(f) (HLOGps) apply within the specified ranges
as specified in Section 7.5.1.26.4-6 and 7.5.1.26.10-12 of G.997.1. (7) The requirements for the Quiet line noise PSD per subcarrier group: measurement
time (QLNMT), group size (QLNG) and an array of real values in dBm/Hz for
QLN(f) (QLNps) apply within the specified ranges as specified in Section 7.5.1.27.1-3 and 7.5.1.27.4-6 of G.997.1.
(8) The requirements for the Signal-to-noise ratio per subcarrier group: measurement
time (SNRMT), group size (SNRG) and an array of real values in dB for SNR(f) (SNRps) apply within the specified ranges as specified in Section 7.5.1.28.1-3
and 7.5.1.28.4-6 of G.997.1.
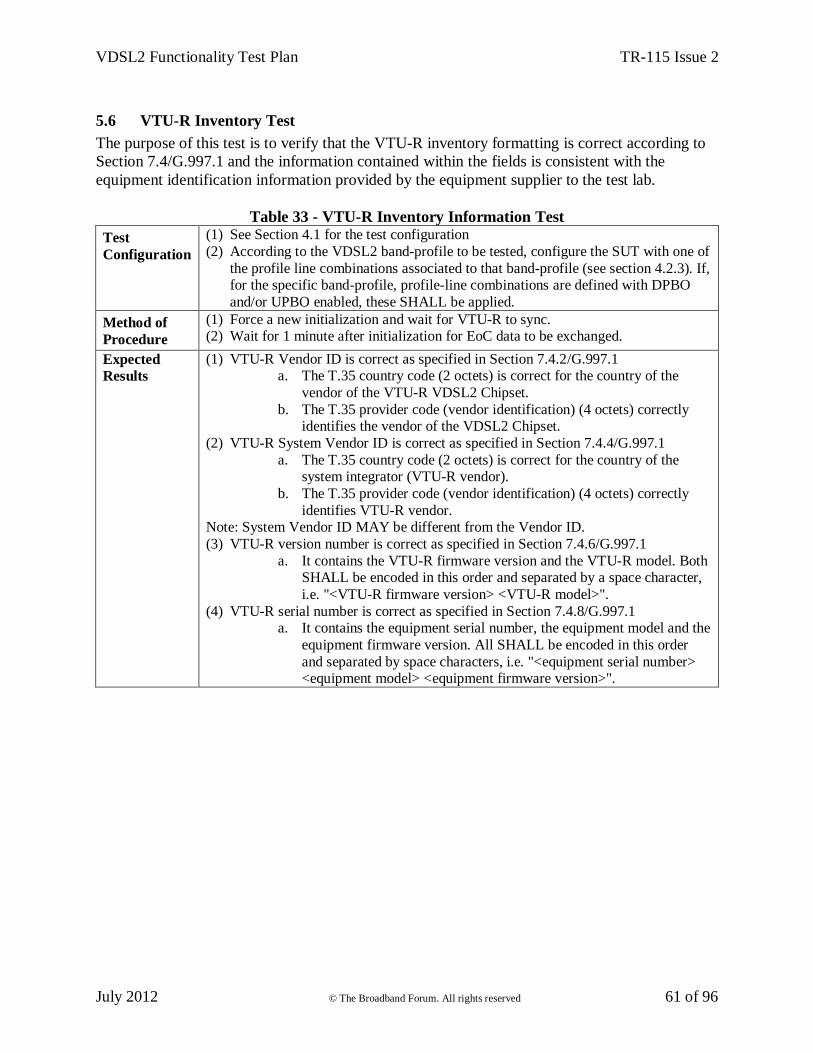
VDSL2 Functionality Test Plan TR-115 Issue 2
July 2012 © The Broadband Forum. All rights reserved 61 of 96
5.6 VTU-R Inventory Test
The purpose of this test is to verify that the VTU-R inventory formatting is correct according to
Section 7.4/G.997.1 and the information contained within the fields is consistent with the
equipment identification information provided by the equipment supplier to the test lab.
Table 33 - VTU-R Inventory Information Test
Test
Configuration
(1) See Section 4.1 for the test configuration
(2) According to the VDSL2 band-profile to be tested, configure the SUT with one of
the profile line combinations associated to that band-profile (see section 4.2.3). If, for the specific band-profile, profile-line combinations are defined with DPBO
and/or UPBO enabled, these SHALL be applied.
Method of
Procedure
(1) Force a new initialization and wait for VTU-R to sync. (2) Wait for 1 minute after initialization for EoC data to be exchanged.
Expected
Results
(1) VTU-R Vendor ID is correct as specified in Section 7.4.2/G.997.1 a. The T.35 country code (2 octets) is correct for the country of the
vendor of the VTU-R VDSL2 Chipset.
b. The T.35 provider code (vendor identification) (4 octets) correctly identifies the vendor of the VDSL2 Chipset.
(2) VTU-R System Vendor ID is correct as specified in Section 7.4.4/G.997.1
a. The T.35 country code (2 octets) is correct for the country of the system integrator (VTU-R vendor).
b. The T.35 provider code (vendor identification) (4 octets) correctly
identifies VTU-R vendor. Note: System Vendor ID MAY be different from the Vendor ID.
(3) VTU-R version number is correct as specified in Section 7.4.6/G.997.1
a. It contains the VTU-R firmware version and the VTU-R model. Both SHALL be encoded in this order and separated by a space character,
i.e. "<VTU-R firmware version> <VTU-R model>".
(4) VTU-R serial number is correct as specified in Section 7.4.8/G.997.1 a. It contains the equipment serial number, the equipment model and the
equipment firmware version. All SHALL be encoded in this order
and separated by space characters, i.e. "<equipment serial number> <equipment model> <equipment firmware version>".
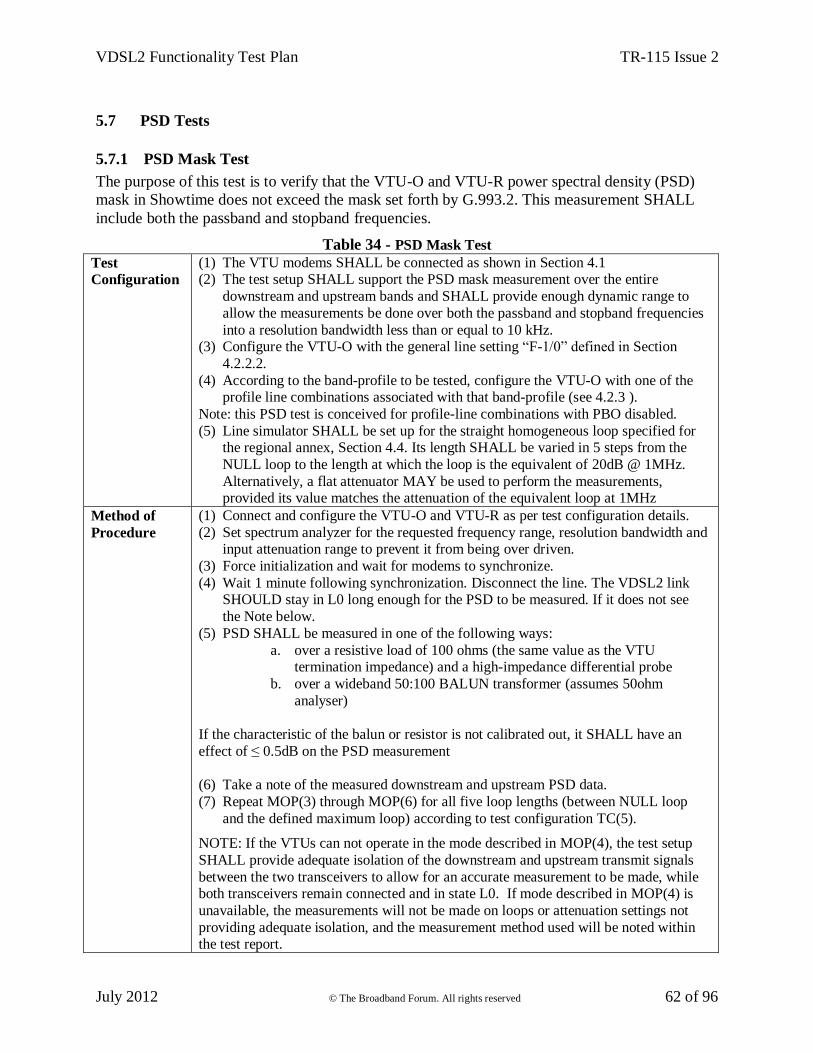
VDSL2 Functionality Test Plan TR-115 Issue 2
July 2012 © The Broadband Forum. All rights reserved 62 of 96
5.7 PSD Tests
5.7.1 PSD Mask Test
The purpose of this test is to verify that the VTU-O and VTU-R power spectral density (PSD)
mask in Showtime does not exceed the mask set forth by G.993.2. This measurement SHALL
include both the passband and stopband frequencies.
Table 34 - PSD Mask Test
Test
Configuration
(1) The VTU modems SHALL be connected as shown in Section 4.1 (2) The test setup SHALL support the PSD mask measurement over the entire
downstream and upstream bands and SHALL provide enough dynamic range to
allow the measurements be done over both the passband and stopband frequencies
into a resolution bandwidth less than or equal to 10 kHz. (3) Configure the VTU-O with the general line setting “F-1/0” defined in Section
4.2.2.2.
(4) According to the band-profile to be tested, configure the VTU-O with one of the profile line combinations associated with that band-profile (see 4.2.3 ).
Note: this PSD test is conceived for profile-line combinations with PBO disabled.
(5) Line simulator SHALL be set up for the straight homogeneous loop specified for the regional annex, Section 4.4. Its length SHALL be varied in 5 steps from the
NULL loop to the length at which the loop is the equivalent of 20dB @ 1MHz.
Alternatively, a flat attenuator MAY be used to perform the measurements, provided its value matches the attenuation of the equivalent loop at 1MHz
Method of
Procedure
(1) Connect and configure the VTU-O and VTU-R as per test configuration details.
(2) Set spectrum analyzer for the requested frequency range, resolution bandwidth and input attenuation range to prevent it from being over driven.
(3) Force initialization and wait for modems to synchronize.
(4) Wait 1 minute following synchronization. Disconnect the line. The VDSL2 link SHOULD stay in L0 long enough for the PSD to be measured. If it does not see
the Note below.
(5) PSD SHALL be measured in one of the following ways:
a. over a resistive load of 100 ohms (the same value as the VTU termination impedance) and a high-impedance differential probe
b. over a wideband 50:100 BALUN transformer (assumes 50ohm
analyser)
If the characteristic of the balun or resistor is not calibrated out, it SHALL have an
effect of ≤ 0.5dB on the PSD measurement
(6) Take a note of the measured downstream and upstream PSD data.
(7) Repeat MOP(3) through MOP(6) for all five loop lengths (between NULL loop
and the defined maximum loop) according to test configuration TC(5).
NOTE: If the VTUs can not operate in the mode described in MOP(4), the test setup
SHALL provide adequate isolation of the downstream and upstream transmit signals
between the two transceivers to allow for an accurate measurement to be made, while both transceivers remain connected and in state L0. If mode described in MOP(4) is
unavailable, the measurements will not be made on loops or attenuation settings not
providing adequate isolation, and the measurement method used will be noted within the test report.
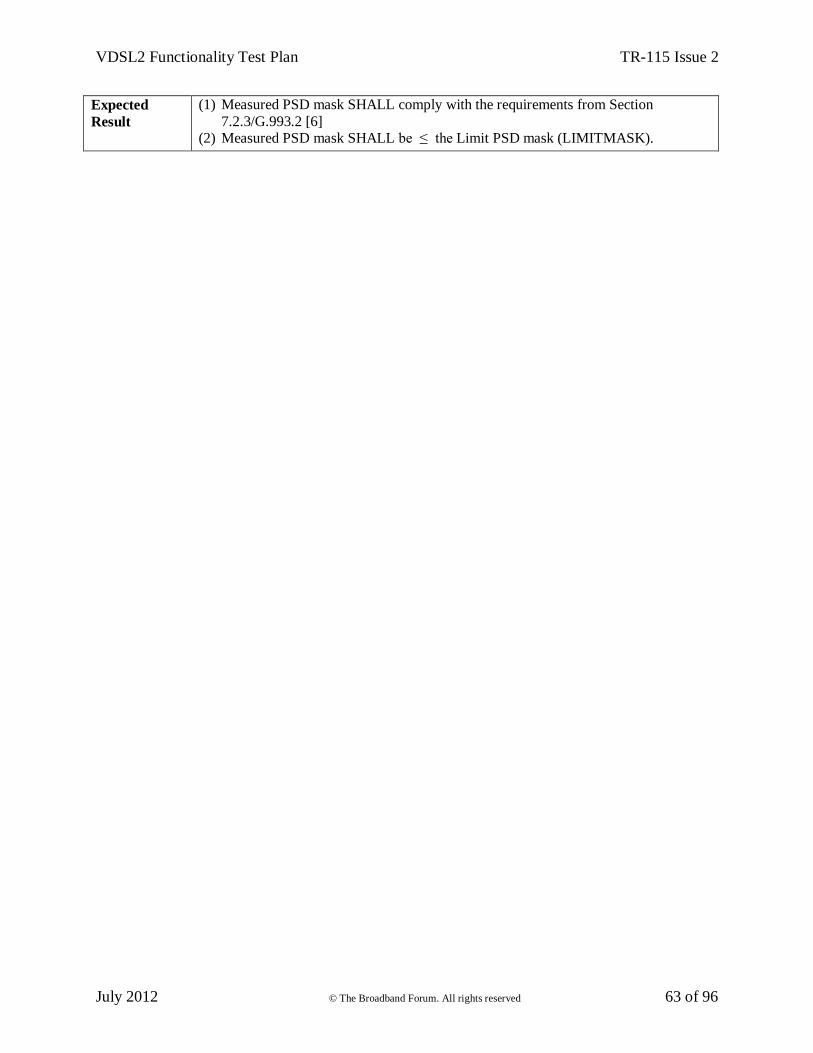
VDSL2 Functionality Test Plan TR-115 Issue 2
July 2012 © The Broadband Forum. All rights reserved 63 of 96
Expected
Result
(1) Measured PSD mask SHALL comply with the requirements from Section
7.2.3/G.993.2 [6] (2) Measured PSD mask SHALL be ≤ the Limit PSD mask (LIMITMASK).
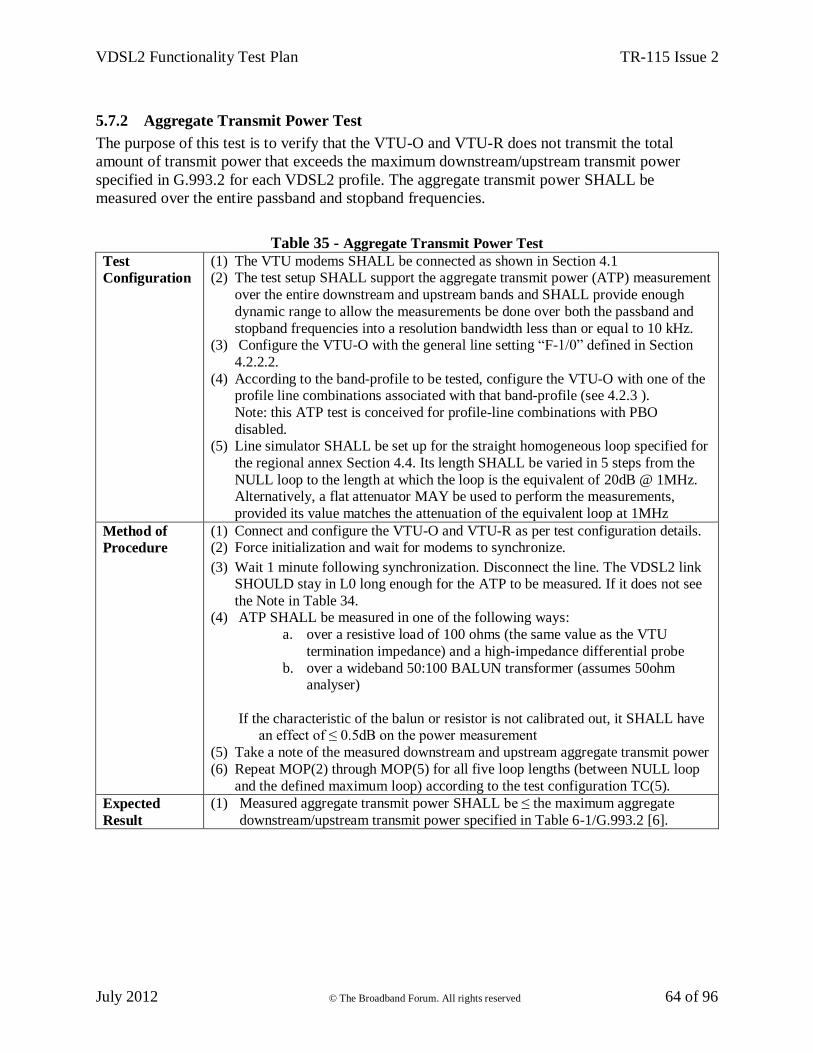
VDSL2 Functionality Test Plan TR-115 Issue 2
July 2012 © The Broadband Forum. All rights reserved 64 of 96
5.7.2 Aggregate Transmit Power Test
The purpose of this test is to verify that the VTU-O and VTU-R does not transmit the total
amount of transmit power that exceeds the maximum downstream/upstream transmit power
specified in G.993.2 for each VDSL2 profile. The aggregate transmit power SHALL be
measured over the entire passband and stopband frequencies.
Table 35 - Aggregate Transmit Power Test
Test
Configuration
(1) The VTU modems SHALL be connected as shown in Section 4.1 (2) The test setup SHALL support the aggregate transmit power (ATP) measurement
over the entire downstream and upstream bands and SHALL provide enough
dynamic range to allow the measurements be done over both the passband and
stopband frequencies into a resolution bandwidth less than or equal to 10 kHz. (3) Configure the VTU-O with the general line setting “F-1/0” defined in Section
4.2.2.2.
(4) According to the band-profile to be tested, configure the VTU-O with one of the profile line combinations associated with that band-profile (see 4.2.3 ).
Note: this ATP test is conceived for profile-line combinations with PBO
disabled. (5) Line simulator SHALL be set up for the straight homogeneous loop specified for
the regional annex Section 4.4. Its length SHALL be varied in 5 steps from the
NULL loop to the length at which the loop is the equivalent of 20dB @ 1MHz. Alternatively, a flat attenuator MAY be used to perform the measurements,
provided its value matches the attenuation of the equivalent loop at 1MHz
Method of
Procedure
(1) Connect and configure the VTU-O and VTU-R as per test configuration details. (2) Force initialization and wait for modems to synchronize.
(3) Wait 1 minute following synchronization. Disconnect the line. The VDSL2 link SHOULD stay in L0 long enough for the ATP to be measured. If it does not see
the Note in Table 34. (4) ATP SHALL be measured in one of the following ways:
a. over a resistive load of 100 ohms (the same value as the VTU
termination impedance) and a high-impedance differential probe
b. over a wideband 50:100 BALUN transformer (assumes 50ohm analyser)
If the characteristic of the balun or resistor is not calibrated out, it SHALL have an effect of ≤ 0.5dB on the power measurement
(5) Take a note of the measured downstream and upstream aggregate transmit power
(6) Repeat MOP(2) through MOP(5) for all five loop lengths (between NULL loop
and the defined maximum loop) according to the test configuration TC(5).
Expected
Result
(1) Measured aggregate transmit power SHALL be ≤ the maximum aggregate
downstream/upstream transmit power specified in Table 6-1/G.993.2 [6].
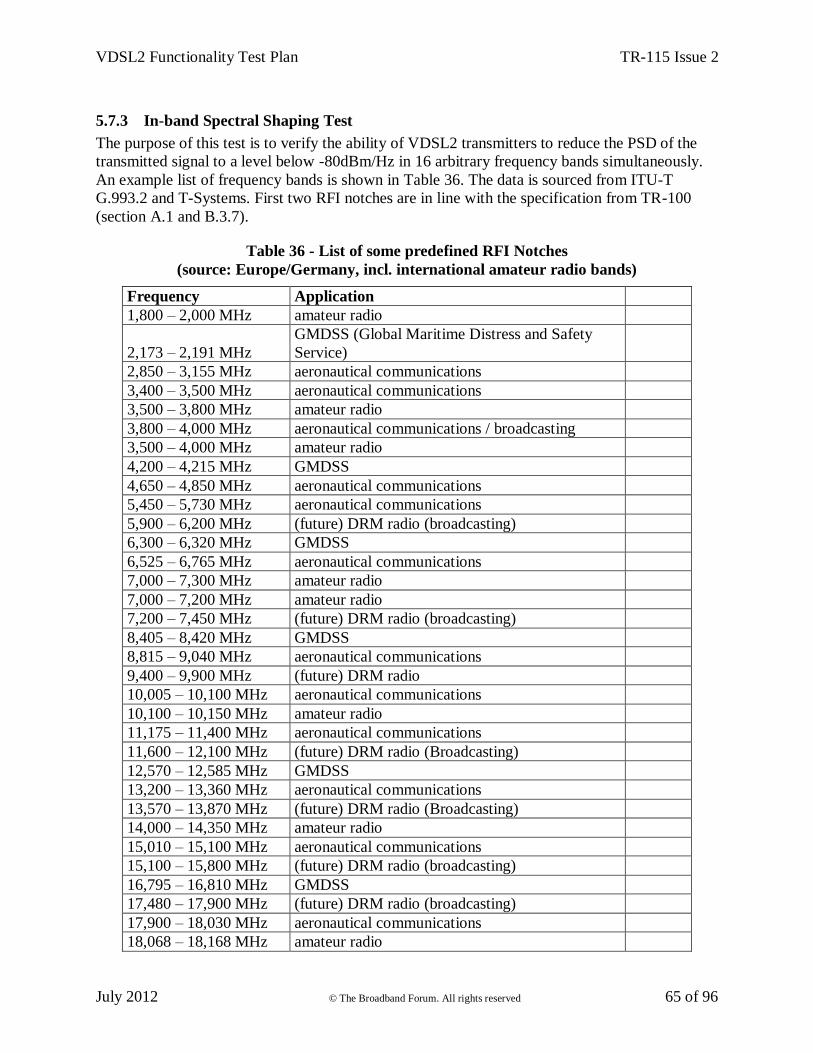
VDSL2 Functionality Test Plan TR-115 Issue 2
July 2012 © The Broadband Forum. All rights reserved 65 of 96
5.7.3 In-band Spectral Shaping Test
The purpose of this test is to verify the ability of VDSL2 transmitters to reduce the PSD of the
transmitted signal to a level below -80dBm/Hz in 16 arbitrary frequency bands simultaneously.
An example list of frequency bands is shown in Table 36. The data is sourced from ITU-T
G.993.2 and T-Systems. First two RFI notches are in line with the specification from TR-100
(section A.1 and B.3.7).
Table 36 - List of some predefined RFI Notches
(source: Europe/Germany, incl. international amateur radio bands)
Frequency Application
1,800 – 2,000 MHz amateur radio
2,173 – 2,191 MHz
GMDSS (Global Maritime Distress and Safety
Service)
2,850 – 3,155 MHz aeronautical communications
3,400 – 3,500 MHz aeronautical communications
3,500 – 3,800 MHz amateur radio
3,800 – 4,000 MHz aeronautical communications / broadcasting
3,500 – 4,000 MHz amateur radio
4,200 – 4,215 MHz GMDSS
4,650 – 4,850 MHz aeronautical communications
5,450 – 5,730 MHz aeronautical communications
5,900 – 6,200 MHz (future) DRM radio (broadcasting)
6,300 – 6,320 MHz GMDSS
6,525 – 6,765 MHz aeronautical communications
7,000 – 7,300 MHz amateur radio
7,000 – 7,200 MHz amateur radio
7,200 – 7,450 MHz (future) DRM radio (broadcasting)
8,405 – 8,420 MHz GMDSS
8,815 – 9,040 MHz aeronautical communications
9,400 – 9,900 MHz (future) DRM radio
10,005 – 10,100 MHz aeronautical communications
10,100 – 10,150 MHz amateur radio
11,175 – 11,400 MHz aeronautical communications
11,600 – 12,100 MHz (future) DRM radio (Broadcasting)
12,570 – 12,585 MHz GMDSS
13,200 – 13,360 MHz aeronautical communications
13,570 – 13,870 MHz (future) DRM radio (Broadcasting)
14,000 – 14,350 MHz amateur radio
15,010 – 15,100 MHz aeronautical communications
15,100 – 15,800 MHz (future) DRM radio (broadcasting)
16,795 – 16,810 MHz GMDSS
17,480 – 17,900 MHz (future) DRM radio (broadcasting)
17,900 – 18,030 MHz aeronautical communications
18,068 – 18,168 MHz amateur radio
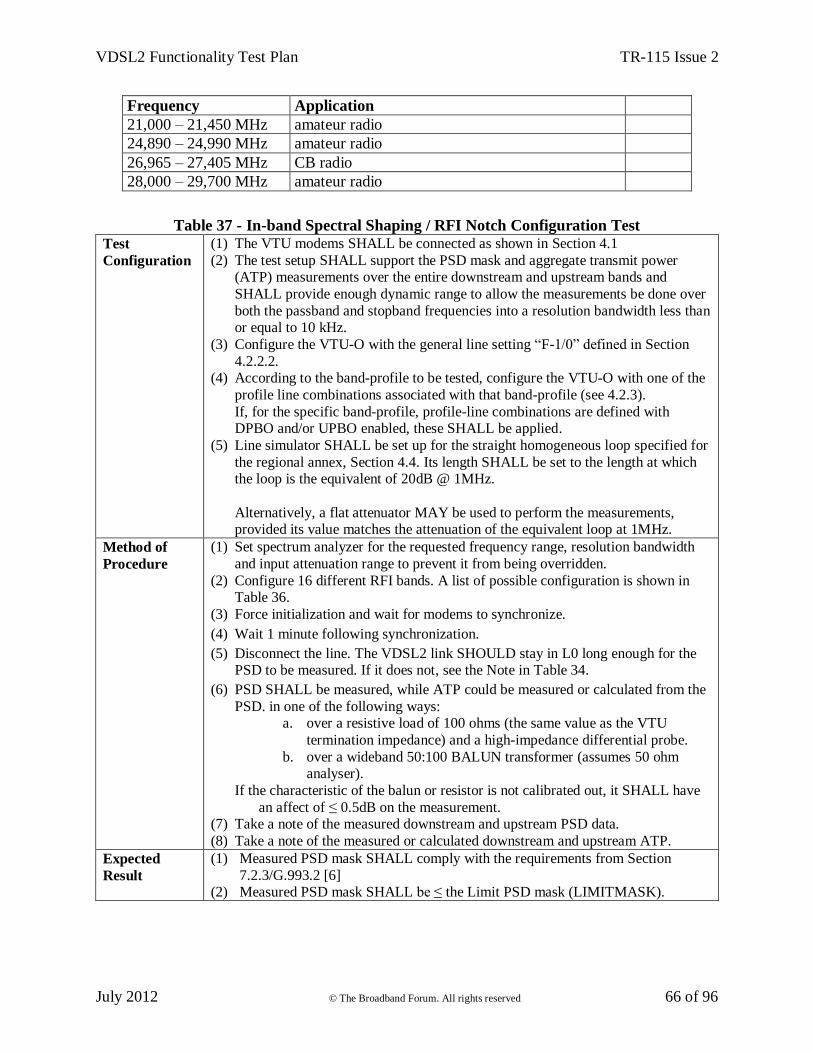
VDSL2 Functionality Test Plan TR-115 Issue 2
July 2012 © The Broadband Forum. All rights reserved 66 of 96
Frequency Application
21,000 – 21,450 MHz amateur radio
24,890 – 24,990 MHz amateur radio
26,965 – 27,405 MHz CB radio
28,000 – 29,700 MHz amateur radio
Table 37 - In-band Spectral Shaping / RFI Notch Configuration Test
Test
Configuration
(1) The VTU modems SHALL be connected as shown in Section 4.1
(2) The test setup SHALL support the PSD mask and aggregate transmit power (ATP) measurements over the entire downstream and upstream bands and
SHALL provide enough dynamic range to allow the measurements be done over
both the passband and stopband frequencies into a resolution bandwidth less than or equal to 10 kHz.
(3) Configure the VTU-O with the general line setting “F-1/0” defined in Section
4.2.2.2. (4) According to the band-profile to be tested, configure the VTU-O with one of the
profile line combinations associated with that band-profile (see 4.2.3).
If, for the specific band-profile, profile-line combinations are defined with DPBO and/or UPBO enabled, these SHALL be applied.
(5) Line simulator SHALL be set up for the straight homogeneous loop specified for
the regional annex, Section 4.4. Its length SHALL be set to the length at which the loop is the equivalent of 20dB @ 1MHz.
Alternatively, a flat attenuator MAY be used to perform the measurements, provided its value matches the attenuation of the equivalent loop at 1MHz.
Method of
Procedure
(1) Set spectrum analyzer for the requested frequency range, resolution bandwidth
and input attenuation range to prevent it from being overridden.
(2) Configure 16 different RFI bands. A list of possible configuration is shown in Table 36.
(3) Force initialization and wait for modems to synchronize.
(4) Wait 1 minute following synchronization.
(5) Disconnect the line. The VDSL2 link SHOULD stay in L0 long enough for the PSD to be measured. If it does not, see the Note in Table 34.
(6) PSD SHALL be measured, while ATP could be measured or calculated from the
PSD. in one of the following ways: a. over a resistive load of 100 ohms (the same value as the VTU
termination impedance) and a high-impedance differential probe.
b. over a wideband 50:100 BALUN transformer (assumes 50 ohm analyser).
If the characteristic of the balun or resistor is not calibrated out, it SHALL have
an affect of ≤ 0.5dB on the measurement. (7) Take a note of the measured downstream and upstream PSD data.
(8) Take a note of the measured or calculated downstream and upstream ATP.
Expected
Result
(1) Measured PSD mask SHALL comply with the requirements from Section
7.2.3/G.993.2 [6] (2) Measured PSD mask SHALL be ≤ the Limit PSD mask (LIMITMASK).
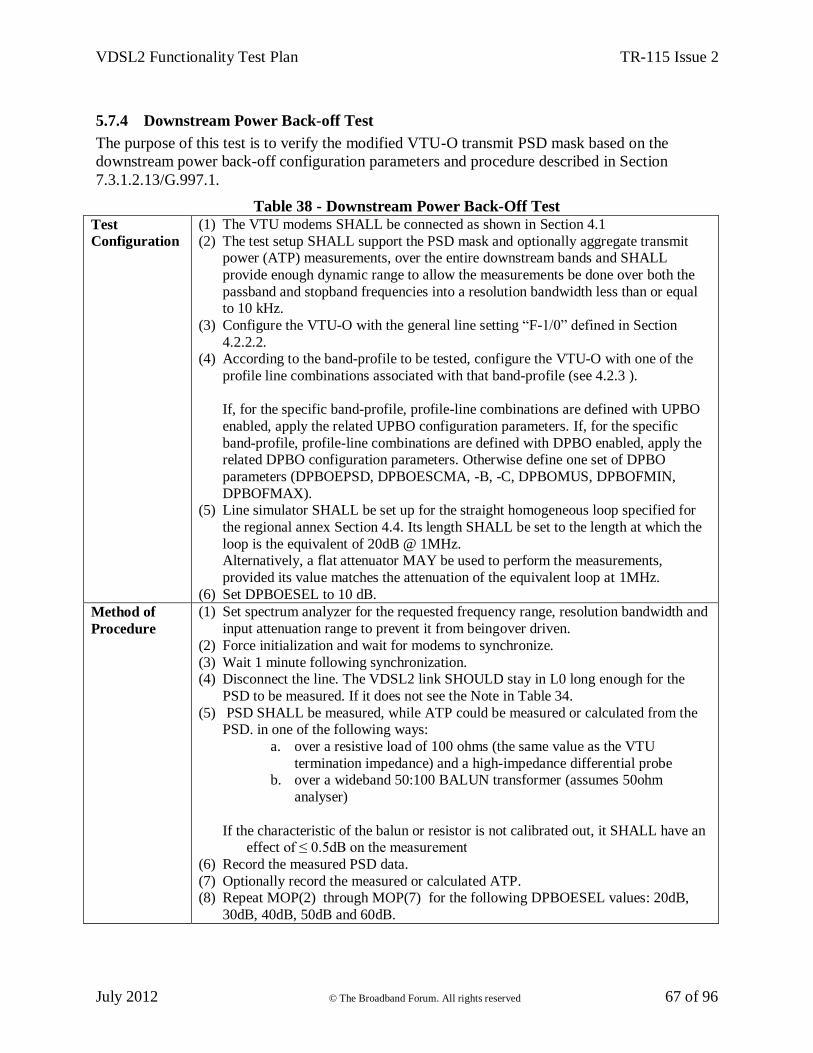
VDSL2 Functionality Test Plan TR-115 Issue 2
July 2012 © The Broadband Forum. All rights reserved 67 of 96
5.7.4 Downstream Power Back-off Test
The purpose of this test is to verify the modified VTU-O transmit PSD mask based on the
downstream power back-off configuration parameters and procedure described in Section
7.3.1.2.13/G.997.1.
Table 38 - Downstream Power Back-Off Test
Test
Configuration
(1) The VTU modems SHALL be connected as shown in Section 4.1
(2) The test setup SHALL support the PSD mask and optionally aggregate transmit power (ATP) measurements, over the entire downstream bands and SHALL
provide enough dynamic range to allow the measurements be done over both the
passband and stopband frequencies into a resolution bandwidth less than or equal to 10 kHz.
(3) Configure the VTU-O with the general line setting “F-1/0” defined in Section
4.2.2.2. (4) According to the band-profile to be tested, configure the VTU-O with one of the
profile line combinations associated with that band-profile (see 4.2.3 ).
If, for the specific band-profile, profile-line combinations are defined with UPBO
enabled, apply the related UPBO configuration parameters. If, for the specific
band-profile, profile-line combinations are defined with DPBO enabled, apply the related DPBO configuration parameters. Otherwise define one set of DPBO
parameters (DPBOEPSD, DPBOESCMA, -B, -C, DPBOMUS, DPBOFMIN,
DPBOFMAX). (5) Line simulator SHALL be set up for the straight homogeneous loop specified for
the regional annex Section 4.4. Its length SHALL be set to the length at which the
loop is the equivalent of 20dB @ 1MHz. Alternatively, a flat attenuator MAY be used to perform the measurements,
provided its value matches the attenuation of the equivalent loop at 1MHz.
(6) Set DPBOESEL to 10 dB.
Method of
Procedure
(1) Set spectrum analyzer for the requested frequency range, resolution bandwidth and
input attenuation range to prevent it from beingover driven.
(2) Force initialization and wait for modems to synchronize.
(3) Wait 1 minute following synchronization. (4) Disconnect the line. The VDSL2 link SHOULD stay in L0 long enough for the
PSD to be measured. If it does not see the Note in Table 34.
(5) PSD SHALL be measured, while ATP could be measured or calculated from the PSD. in one of the following ways:
a. over a resistive load of 100 ohms (the same value as the VTU
termination impedance) and a high-impedance differential probe b. over a wideband 50:100 BALUN transformer (assumes 50ohm
analyser)
If the characteristic of the balun or resistor is not calibrated out, it SHALL have an effect of ≤ 0.5dB on the measurement
(6) Record the measured PSD data.
(7) Optionally record the measured or calculated ATP. (8) Repeat MOP(2) through MOP(7) for the following DPBOESEL values: 20dB,
30dB, 40dB, 50dB and 60dB.
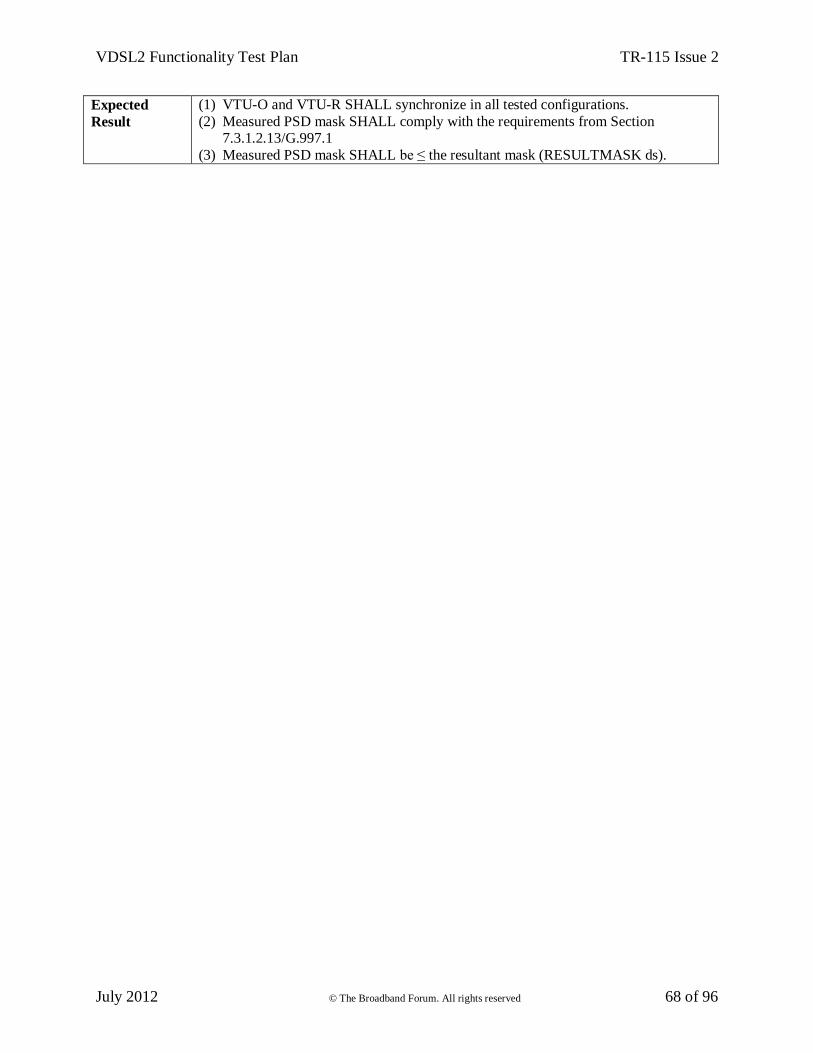
VDSL2 Functionality Test Plan TR-115 Issue 2
July 2012 © The Broadband Forum. All rights reserved 68 of 96
Expected
Result
(1) VTU-O and VTU-R SHALL synchronize in all tested configurations.
(2) Measured PSD mask SHALL comply with the requirements from Section 7.3.1.2.13/G.997.1
(3) Measured PSD mask SHALL be ≤ the resultant mask (RESULTMASK ds).
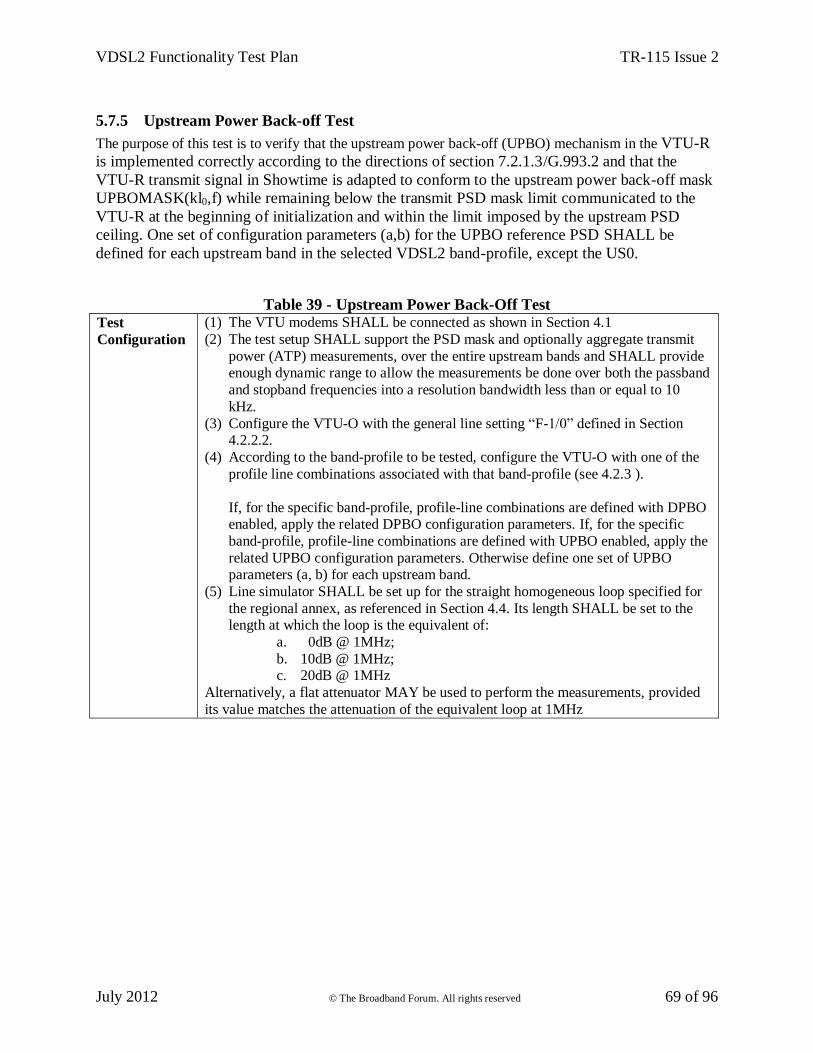
VDSL2 Functionality Test Plan TR-115 Issue 2
July 2012 © The Broadband Forum. All rights reserved 69 of 96
5.7.5 Upstream Power Back-off Test
The purpose of this test is to verify that the upstream power back-off (UPBO) mechanism in the VTU-R
is implemented correctly according to the directions of section 7.2.1.3/G.993.2 and that the
VTU-R transmit signal in Showtime is adapted to conform to the upstream power back-off mask
UPBOMASK(kl0,f) while remaining below the transmit PSD mask limit communicated to the
VTU-R at the beginning of initialization and within the limit imposed by the upstream PSD
ceiling. One set of configuration parameters (a,b) for the UPBO reference PSD SHALL be
defined for each upstream band in the selected VDSL2 band-profile, except the US0.
Table 39 - Upstream Power Back-Off Test Test
Configuration
(1) The VTU modems SHALL be connected as shown in Section 4.1
(2) The test setup SHALL support the PSD mask and optionally aggregate transmit
power (ATP) measurements, over the entire upstream bands and SHALL provide enough dynamic range to allow the measurements be done over both the passband
and stopband frequencies into a resolution bandwidth less than or equal to 10
kHz.
(3) Configure the VTU-O with the general line setting “F-1/0” defined in Section 4.2.2.2.
(4) According to the band-profile to be tested, configure the VTU-O with one of the
profile line combinations associated with that band-profile (see 4.2.3 ).
If, for the specific band-profile, profile-line combinations are defined with DPBO enabled, apply the related DPBO configuration parameters. If, for the specific
band-profile, profile-line combinations are defined with UPBO enabled, apply the
related UPBO configuration parameters. Otherwise define one set of UPBO parameters (a, b) for each upstream band.
(5) Line simulator SHALL be set up for the straight homogeneous loop specified for
the regional annex, as referenced in Section 4.4. Its length SHALL be set to the length at which the loop is the equivalent of:
a. 0dB @ 1MHz;
b. 10dB @ 1MHz; c. 20dB @ 1MHz
Alternatively, a flat attenuator MAY be used to perform the measurements, provided
its value matches the attenuation of the equivalent loop at 1MHz
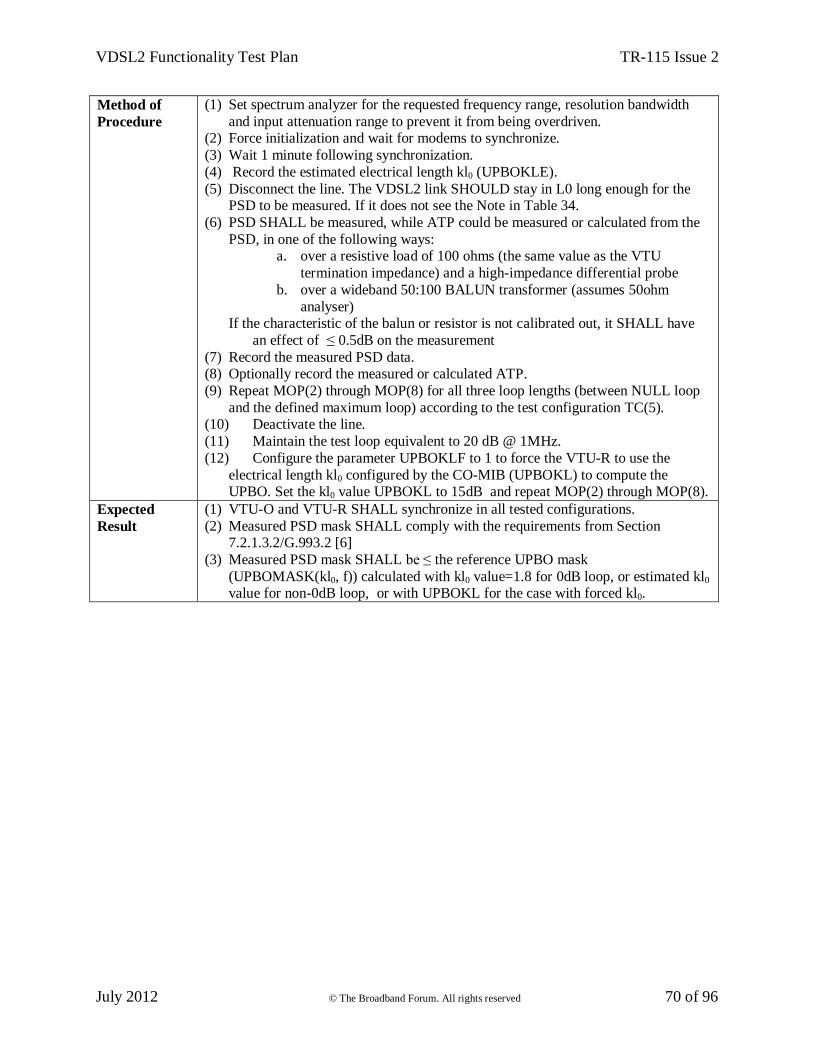
VDSL2 Functionality Test Plan TR-115 Issue 2
July 2012 © The Broadband Forum. All rights reserved 70 of 96
Method of
Procedure
(1) Set spectrum analyzer for the requested frequency range, resolution bandwidth
and input attenuation range to prevent it from being overdriven. (2) Force initialization and wait for modems to synchronize.
(3) Wait 1 minute following synchronization.
(4) Record the estimated electrical length kl0 (UPBOKLE).
(5) Disconnect the line. The VDSL2 link SHOULD stay in L0 long enough for the PSD to be measured. If it does not see the Note in Table 34.
(6) PSD SHALL be measured, while ATP could be measured or calculated from the
PSD, in one of the following ways: a. over a resistive load of 100 ohms (the same value as the VTU
termination impedance) and a high-impedance differential probe
b. over a wideband 50:100 BALUN transformer (assumes 50ohm
analyser) If the characteristic of the balun or resistor is not calibrated out, it SHALL have
an effect of ≤ 0.5dB on the measurement
(7) Record the measured PSD data. (8) Optionally record the measured or calculated ATP.
(9) Repeat MOP(2) through MOP(8) for all three loop lengths (between NULL loop
and the defined maximum loop) according to the test configuration TC(5). (10) Deactivate the line.
(11) Maintain the test loop equivalent to 20 dB @ 1MHz.
(12) Configure the parameter UPBOKLF to 1 to force the VTU-R to use the
electrical length kl0 configured by the CO-MIB (UPBOKL) to compute the UPBO. Set the kl0 value UPBOKL to 15dB and repeat MOP(2) through MOP(8).
Expected
Result
(1) VTU-O and VTU-R SHALL synchronize in all tested configurations.
(2) Measured PSD mask SHALL comply with the requirements from Section 7.2.1.3.2/G.993.2 [6]
(3) Measured PSD mask SHALL be ≤ the reference UPBO mask
(UPBOMASK(kl0, f)) calculated with kl0 value=1.8 for 0dB loop, or estimated kl0 value for non-0dB loop, or with UPBOKL for the case with forced kl0.
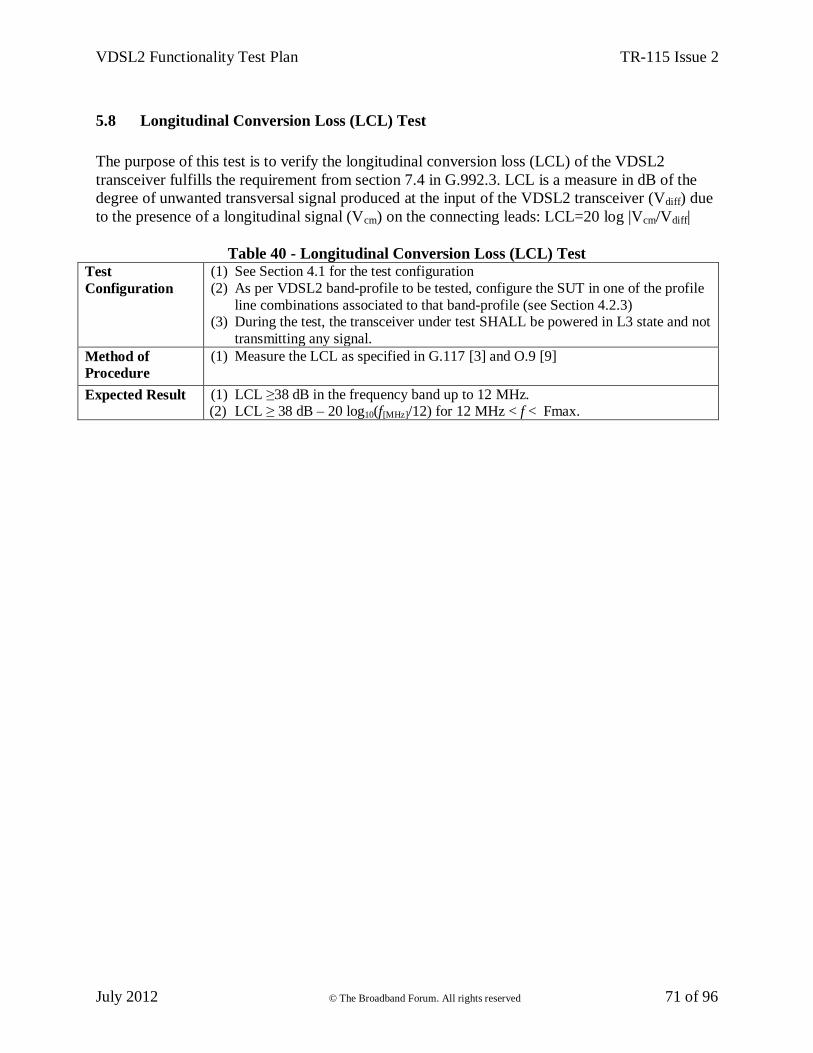
VDSL2 Functionality Test Plan TR-115 Issue 2
July 2012 © The Broadband Forum. All rights reserved 71 of 96
5.8 Longitudinal Conversion Loss (LCL) Test
The purpose of this test is to verify the longitudinal conversion loss (LCL) of the VDSL2
transceiver fulfills the requirement from section 7.4 in G.992.3. LCL is a measure in dB of the
degree of unwanted transversal signal produced at the input of the VDSL2 transceiver (Vdiff) due
to the presence of a longitudinal signal (Vcm) on the connecting leads: LCL=20 log |Vcm/Vdiff|
Table 40 - Longitudinal Conversion Loss (LCL) Test Test
Configuration
(1) See Section 4.1 for the test configuration
(2) As per VDSL2 band-profile to be tested, configure the SUT in one of the profile
line combinations associated to that band-profile (see Section 4.2.3) (3) During the test, the transceiver under test SHALL be powered in L3 state and not
transmitting any signal.
Method of
Procedure
(1) Measure the LCL as specified in G.117 [3] and O.9 [9]
Expected Result (1) LCL ≥38 dB in the frequency band up to 12 MHz. (2) LCL ≥ 38 dB – 20 log10(f[MHz]/12) for 12 MHz < f < Fmax.
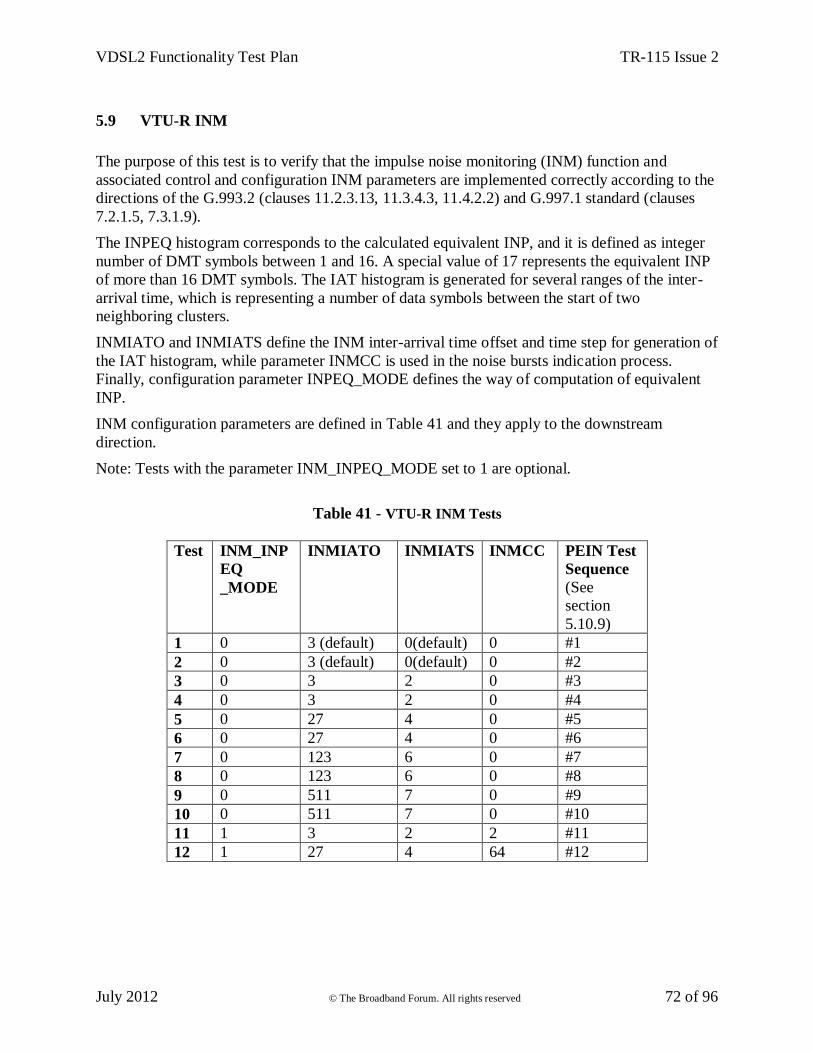
VDSL2 Functionality Test Plan TR-115 Issue 2
July 2012 © The Broadband Forum. All rights reserved 72 of 96
5.9 VTU-R INM
The purpose of this test is to verify that the impulse noise monitoring (INM) function and
associated control and configuration INM parameters are implemented correctly according to the
directions of the G.993.2 (clauses 11.2.3.13, 11.3.4.3, 11.4.2.2) and G.997.1 standard (clauses
7.2.1.5, 7.3.1.9).
The INPEQ histogram corresponds to the calculated equivalent INP, and it is defined as integer
number of DMT symbols between 1 and 16. A special value of 17 represents the equivalent INP
of more than 16 DMT symbols. The IAT histogram is generated for several ranges of the inter-
arrival time, which is representing a number of data symbols between the start of two
neighboring clusters.
INMIATO and INMIATS define the INM inter-arrival time offset and time step for generation of
the IAT histogram, while parameter INMCC is used in the noise bursts indication process.
Finally, configuration parameter INPEQ_MODE defines the way of computation of equivalent
INP.
INM configuration parameters are defined in Table 41 and they apply to the downstream
direction.
Note: Tests with the parameter INM_INPEQ_MODE set to 1 are optional.
Table 41 - VTU-R INM Tests
Test INM_INP
EQ
_MODE
INMIATO INMIATS INMCC PEIN Test
Sequence
(See
section
5.10.9)
1 0 3 (default) 0(default) 0 #1
2 0 3 (default) 0(default) 0 #2
3 0 3 2 0 #3
4 0 3 2 0 #4
5 0 27 4 0 #5
6 0 27 4 0 #6
7 0 123 6 0 #7
8 0 123 6 0 #8
9 0 511 7 0 #9
10 0 511 7 0 #10
11 1 3 2 2 #11
12 1 27 4 64 #12
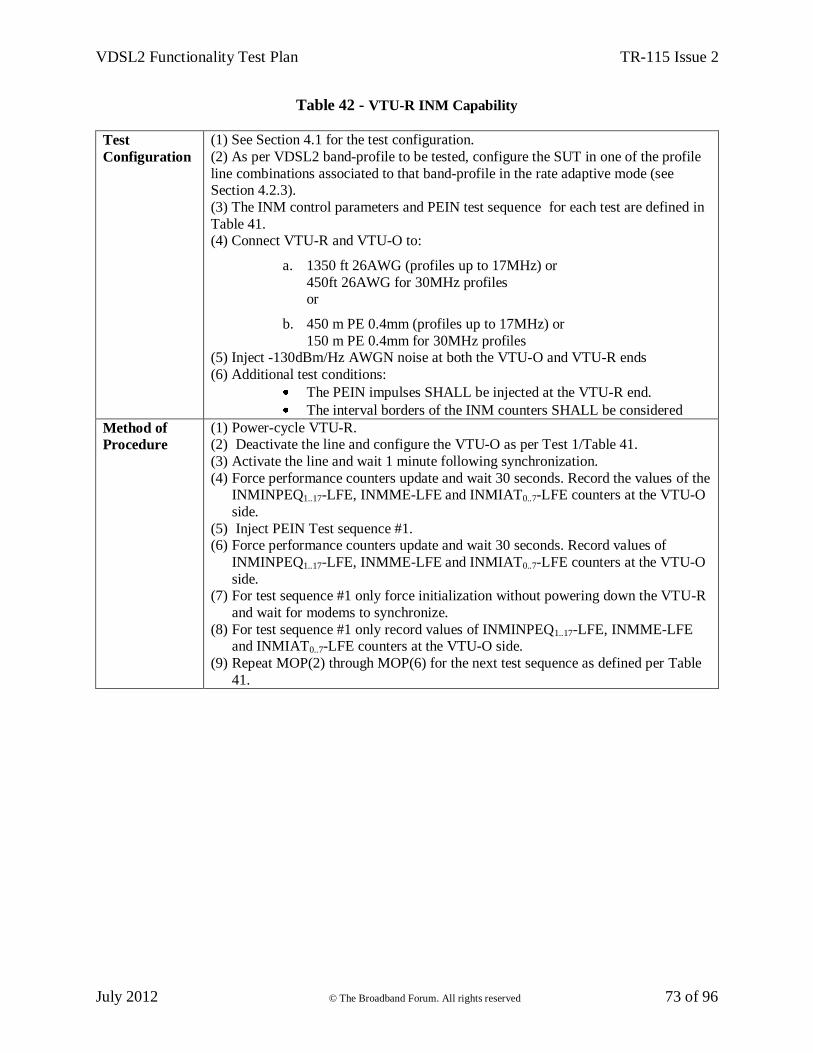
VDSL2 Functionality Test Plan TR-115 Issue 2
July 2012 © The Broadband Forum. All rights reserved 73 of 96
Table 42 - VTU-R INM Capability
Test
Configuration
(1) See Section 4.1 for the test configuration.
(2) As per VDSL2 band-profile to be tested, configure the SUT in one of the profile
line combinations associated to that band-profile in the rate adaptive mode (see Section 4.2.3).
(3) The INM control parameters and PEIN test sequence for each test are defined in
Table 41. (4) Connect VTU-R and VTU-O to:
a. 1350 ft 26AWG (profiles up to 17MHz) or
450ft 26AWG for 30MHz profiles or
b. 450 m PE 0.4mm (profiles up to 17MHz) or
150 m PE 0.4mm for 30MHz profiles (5) Inject -130dBm/Hz AWGN noise at both the VTU-O and VTU-R ends
(6) Additional test conditions:
The PEIN impulses SHALL be injected at the VTU-R end.
The interval borders of the INM counters SHALL be considered
Method of
Procedure
(1) Power-cycle VTU-R. (2) Deactivate the line and configure the VTU-O as per Test 1/Table 41.
(3) Activate the line and wait 1 minute following synchronization.
(4) Force performance counters update and wait 30 seconds. Record the values of the INMINPEQ1..17-LFE, INMME-LFE and INMIAT0..7-LFE counters at the VTU-O
side.
(5) Inject PEIN Test sequence #1. (6) Force performance counters update and wait 30 seconds. Record values of
INMINPEQ1..17-LFE, INMME-LFE and INMIAT0..7-LFE counters at the VTU-O
side. (7) For test sequence #1 only force initialization without powering down the VTU-R
and wait for modems to synchronize.
(8) For test sequence #1 only record values of INMINPEQ1..17-LFE, INMME-LFE and INMIAT0..7-LFE counters at the VTU-O side.
(9) Repeat MOP(2) through MOP(6) for the next test sequence as defined per Table
41.
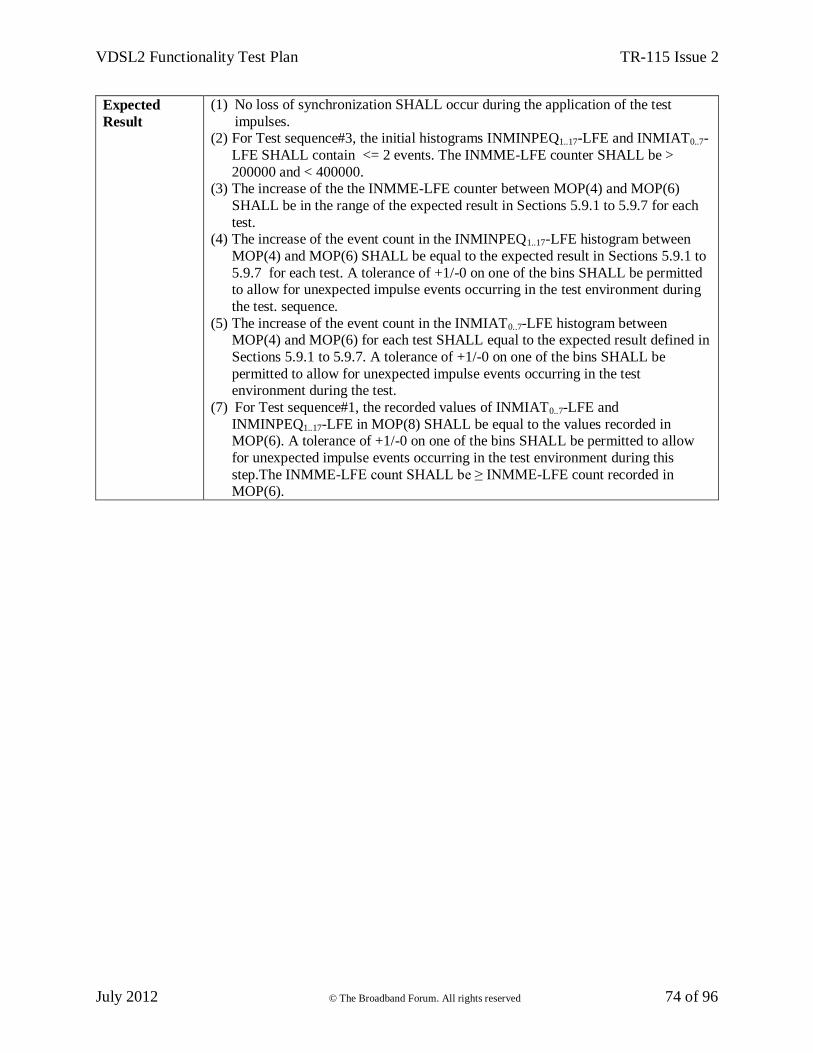
VDSL2 Functionality Test Plan TR-115 Issue 2
July 2012 © The Broadband Forum. All rights reserved 74 of 96
Expected
Result
(1) No loss of synchronization SHALL occur during the application of the test
impulses. (2) For Test sequence#3, the initial histograms INMINPEQ1..17-LFE and INMIAT0..7-
LFE SHALL contain <= 2 events. The INMME-LFE counter SHALL be >
200000 and < 400000. (3) The increase of the the INMME-LFE counter between MOP(4) and MOP(6)
SHALL be in the range of the expected result in Sections 5.9.1 to 5.9.7 for each
test. (4) The increase of the event count in the INMINPEQ1..17-LFE histogram between
MOP(4) and MOP(6) SHALL be equal to the expected result in Sections 5.9.1 to
5.9.7 for each test. A tolerance of +1/-0 on one of the bins SHALL be permitted to allow for unexpected impulse events occurring in the test environment during
the test. sequence.
(5) The increase of the event count in the INMIAT0..7-LFE histogram between MOP(4) and MOP(6) for each test SHALL equal to the expected result defined in
Sections 5.9.1 to 5.9.7. A tolerance of +1/-0 on one of the bins SHALL be
permitted to allow for unexpected impulse events occurring in the test environment during the test.
(7) For Test sequence#1, the recorded values of INMIAT0..7-LFE and
INMINPEQ1..17-LFE in MOP(8) SHALL be equal to the values recorded in MOP(6). A tolerance of +1/-0 on one of the bins SHALL be permitted to allow
for unexpected impulse events occurring in the test environment during this
step.The INMME-LFE count SHALL be ≥ INMME-LFE count recorded in MOP(6).
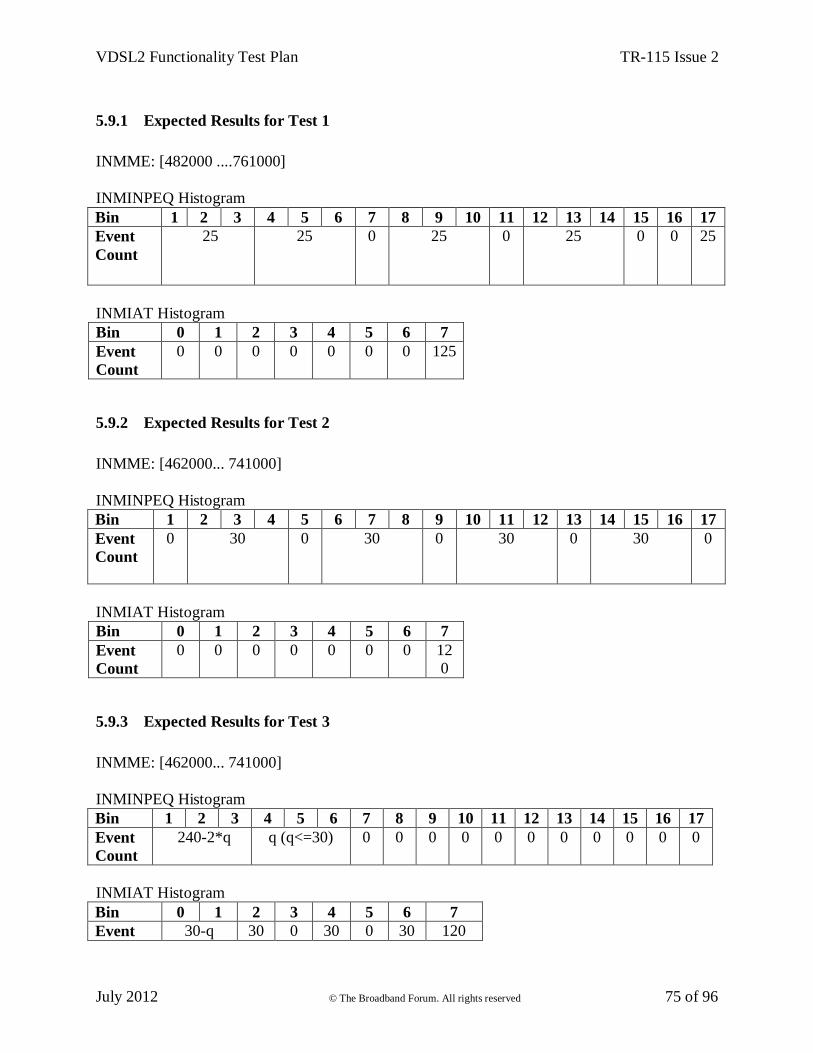
VDSL2 Functionality Test Plan TR-115 Issue 2
July 2012 © The Broadband Forum. All rights reserved 75 of 96
5.9.1 Expected Results for Test 1
INMME: [482000 ....761000]
INMINPEQ Histogram
Bin 1 2 3 4 5 6 7 8 9 10 11 12 13 14 15 16 17
Event
Count
25
25 0 25 0 25 0 0 25
INMIAT Histogram
Bin 0 1 2 3 4 5 6 7
Event
Count
0 0 0 0 0 0 0 125
5.9.2 Expected Results for Test 2
INMME: [462000... 741000]
INMINPEQ Histogram
Bin 1 2 3 4 5 6 7 8 9 10 11 12 13 14 15 16 17
Event
Count
0 30 0 30 0 30 0 30 0
INMIAT Histogram
Bin 0 1 2 3 4 5 6 7
Event
Count
0 0 0 0 0 0 0 12
0
5.9.3 Expected Results for Test 3
INMME: [462000... 741000]
INMINPEQ Histogram
Bin 1 2 3 4 5 6 7 8 9 10 11 12 13 14 15 16 17
Event
Count
240-2*q q (q<=30) 0 0 0 0 0 0 0 0 0 0 0
INMIAT Histogram
Bin 0 1 2 3 4 5 6 7
Event 30-q 30 0 30 0 30 120
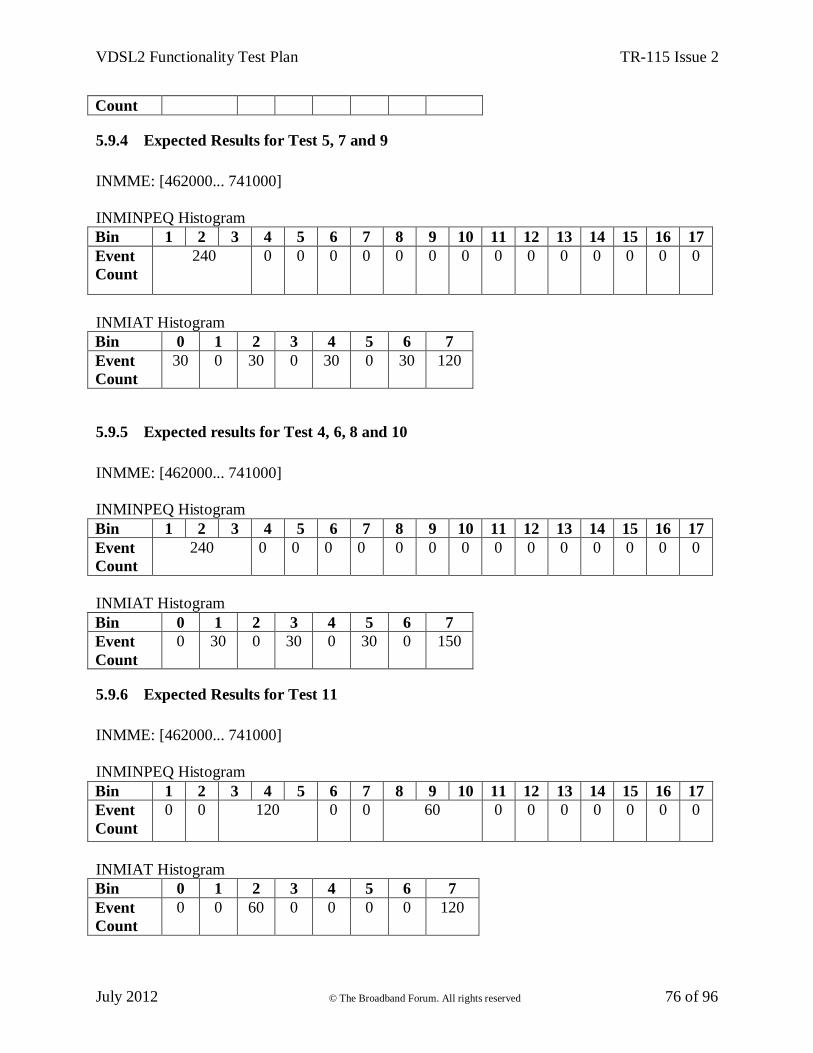
VDSL2 Functionality Test Plan TR-115 Issue 2
July 2012 © The Broadband Forum. All rights reserved 76 of 96
Count
5.9.4 Expected Results for Test 5, 7 and 9
INMME: [462000... 741000]
INMINPEQ Histogram
Bin 1 2 3 4 5 6 7 8 9 10 11 12 13 14 15 16 17
Event
Count
240
0 0 0 0 0 0 0 0 0 0 0 0 0 0
INMIAT Histogram
Bin 0 1 2 3 4 5 6 7
Event
Count
30 0 30 0 30 0 30 120
5.9.5 Expected results for Test 4, 6, 8 and 10
INMME: [462000... 741000]
INMINPEQ Histogram
Bin 1 2 3 4 5 6 7 8 9 10 11 12 13 14 15 16 17
Event
Count
240
0 0 0 0 0 0 0 0 0 0 0 0 0 0
INMIAT Histogram
Bin 0 1 2 3 4 5 6 7
Event
Count
0 30 0 30 0 30 0 150
5.9.6 Expected Results for Test 11
INMME: [462000... 741000]
INMINPEQ Histogram
Bin 1 2 3 4 5 6 7 8 9 10 11 12 13 14 15 16 17
Event
Count
0 0 120 0 0 60
0 0 0 0 0 0 0
INMIAT Histogram
Bin 0 1 2 3 4 5 6 7
Event
Count
0 0 60 0 0 0 0 120
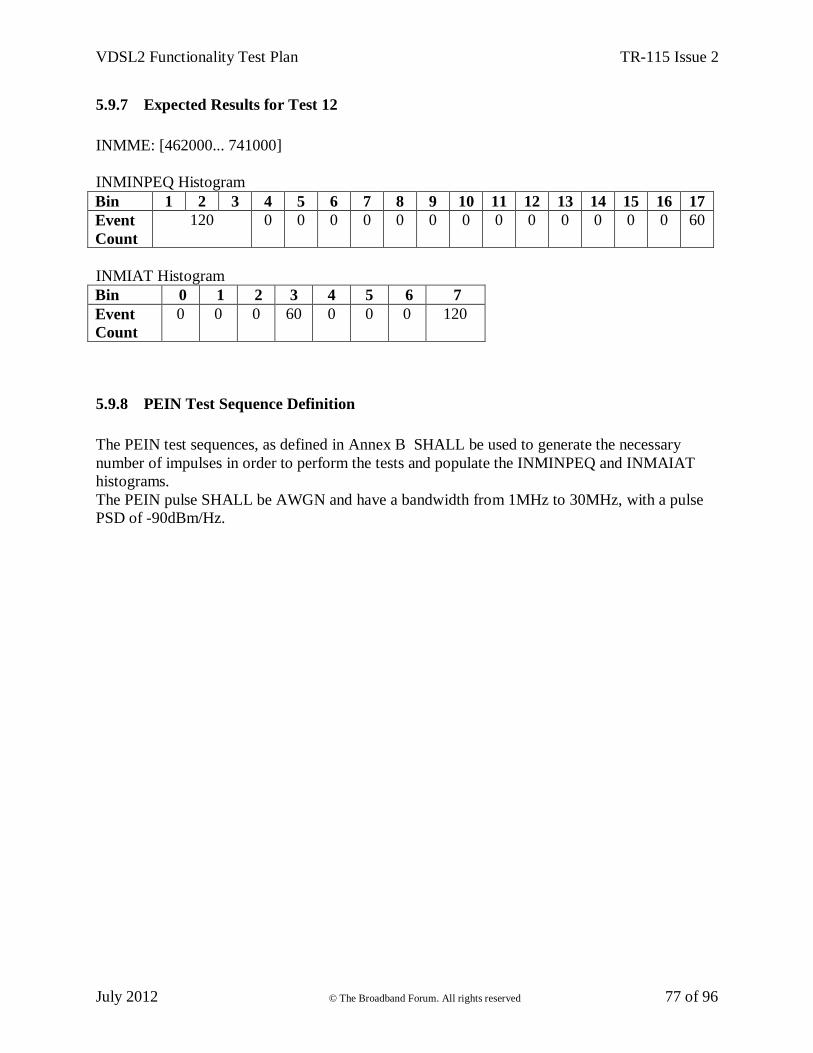
VDSL2 Functionality Test Plan TR-115 Issue 2
July 2012 © The Broadband Forum. All rights reserved 77 of 96
5.9.7 Expected Results for Test 12
INMME: [462000... 741000]
INMINPEQ Histogram
Bin 1 2 3 4 5 6 7 8 9 10 11 12 13 14 15 16 17
Event
Count
120
0 0 0 0 0 0 0 0 0 0 0 0 0 60
INMIAT Histogram
Bin 0 1 2 3 4 5 6 7
Event
Count
0 0 0 60 0 0 0 120
5.9.8 PEIN Test Sequence Definition
The PEIN test sequences, as defined in Annex B SHALL be used to generate the necessary
number of impulses in order to perform the tests and populate the INMINPEQ and INMAIAT
histograms.
The PEIN pulse SHALL be AWGN and have a bandwidth from 1MHz to 30MHz, with a pulse
PSD of -90dBm/Hz.
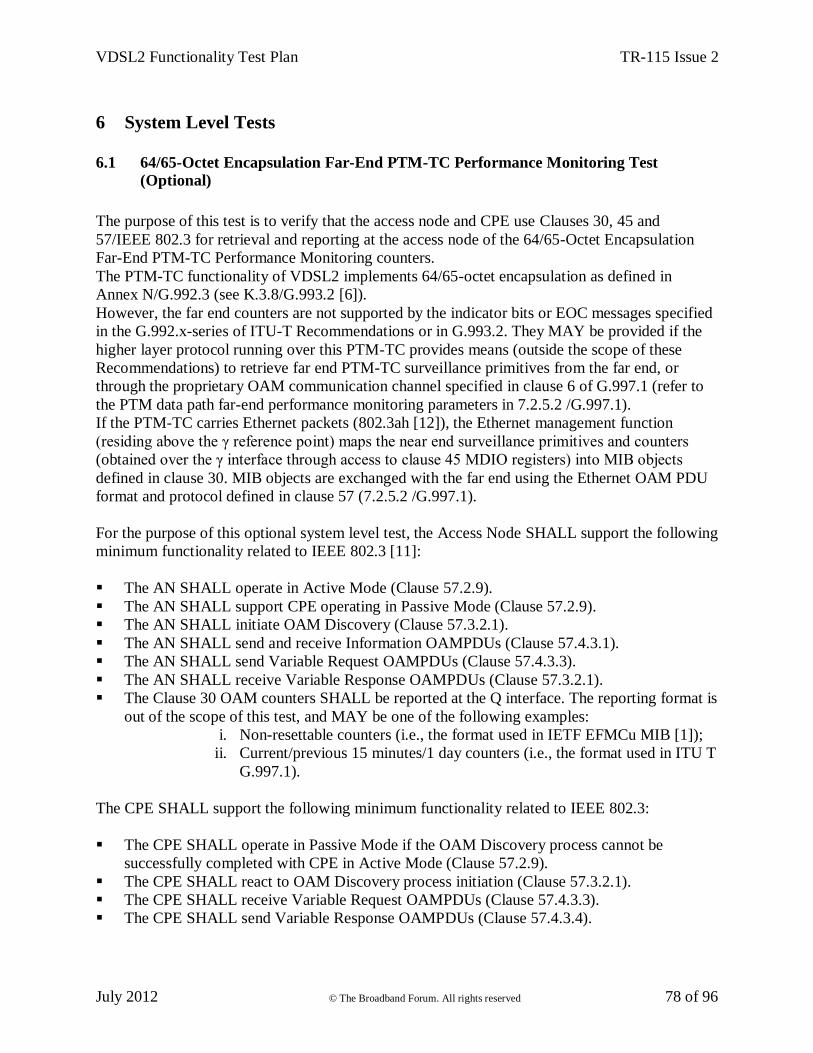
VDSL2 Functionality Test Plan TR-115 Issue 2
July 2012 © The Broadband Forum. All rights reserved 78 of 96
6 System Level Tests
6.1 64/65-Octet Encapsulation Far-End PTM-TC Performance Monitoring Test
(Optional)
The purpose of this test is to verify that the access node and CPE use Clauses 30, 45 and
57/IEEE 802.3 for retrieval and reporting at the access node of the 64/65-Octet Encapsulation
Far-End PTM-TC Performance Monitoring counters.
The PTM-TC functionality of VDSL2 implements 64/65-octet encapsulation as defined in
Annex N/G.992.3 (see K.3.8/G.993.2 [6]).
However, the far end counters are not supported by the indicator bits or EOC messages specified
in the G.992.x-series of ITU-T Recommendations or in G.993.2. They MAY be provided if the
higher layer protocol running over this PTM-TC provides means (outside the scope of these
Recommendations) to retrieve far end PTM-TC surveillance primitives from the far end, or
through the proprietary OAM communication channel specified in clause 6 of G.997.1 (refer to
the PTM data path far-end performance monitoring parameters in 7.2.5.2 /G.997.1).
If the PTM-TC carries Ethernet packets (802.3ah [12]), the Ethernet management function
(residing above the γ reference point) maps the near end surveillance primitives and counters
(obtained over the γ interface through access to clause 45 MDIO registers) into MIB objects
defined in clause 30. MIB objects are exchanged with the far end using the Ethernet OAM PDU
format and protocol defined in clause 57 (7.2.5.2 /G.997.1).
For the purpose of this optional system level test, the Access Node SHALL support the following
minimum functionality related to IEEE 802.3 [11]:
The AN SHALL operate in Active Mode (Clause 57.2.9).
The AN SHALL support CPE operating in Passive Mode (Clause 57.2.9).
The AN SHALL initiate OAM Discovery (Clause 57.3.2.1).
The AN SHALL send and receive Information OAMPDUs (Clause 57.4.3.1).
The AN SHALL send Variable Request OAMPDUs (Clause 57.4.3.3).
The AN SHALL receive Variable Response OAMPDUs (Clause 57.3.2.1).
The Clause 30 OAM counters SHALL be reported at the Q interface. The reporting format is
out of the scope of this test, and MAY be one of the following examples:
i. Non-resettable counters (i.e., the format used in IETF EFMCu MIB [1]);
ii. Current/previous 15 minutes/1 day counters (i.e., the format used in ITU T
G.997.1).
The CPE SHALL support the following minimum functionality related to IEEE 802.3:
The CPE SHALL operate in Passive Mode if the OAM Discovery process cannot be
successfully completed with CPE in Active Mode (Clause 57.2.9).
The CPE SHALL react to OAM Discovery process initiation (Clause 57.3.2.1).
The CPE SHALL receive Variable Request OAMPDUs (Clause 57.4.3.3).
The CPE SHALL send Variable Response OAMPDUs (Clause 57.4.3.4).
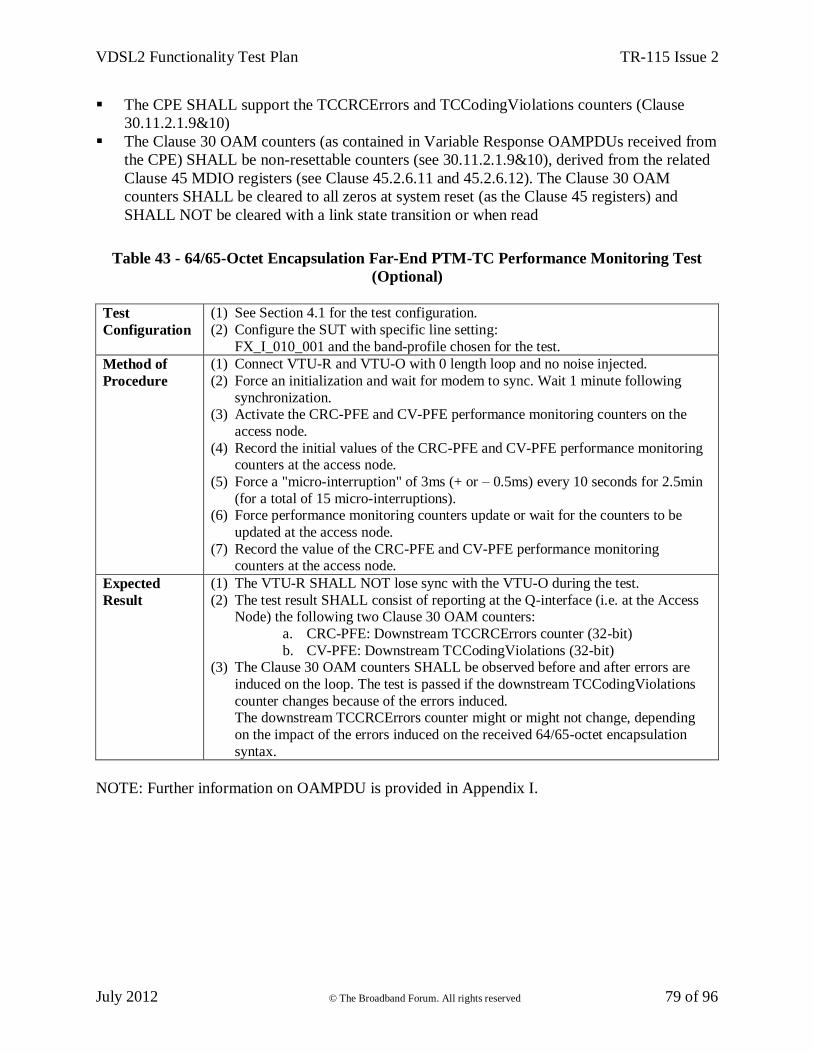
VDSL2 Functionality Test Plan TR-115 Issue 2
July 2012 © The Broadband Forum. All rights reserved 79 of 96
The CPE SHALL support the TCCRCErrors and TCCodingViolations counters (Clause
30.11.2.1.9&10)
The Clause 30 OAM counters (as contained in Variable Response OAMPDUs received from
the CPE) SHALL be non-resettable counters (see 30.11.2.1.9&10), derived from the related
Clause 45 MDIO registers (see Clause 45.2.6.11 and 45.2.6.12). The Clause 30 OAM
counters SHALL be cleared to all zeros at system reset (as the Clause 45 registers) and
SHALL NOT be cleared with a link state transition or when read
Table 43 - 64/65-Octet Encapsulation Far-End PTM-TC Performance Monitoring Test
(Optional)
Test
Configuration
(1) See Section 4.1 for the test configuration.
(2) Configure the SUT with specific line setting:
FX_I_010_001 and the band-profile chosen for the test.
Method of
Procedure
(1) Connect VTU-R and VTU-O with 0 length loop and no noise injected.
(2) Force an initialization and wait for modem to sync. Wait 1 minute following
synchronization. (3) Activate the CRC-PFE and CV-PFE performance monitoring counters on the
access node.
(4) Record the initial values of the CRC-PFE and CV-PFE performance monitoring counters at the access node.
(5) Force a "micro-interruption" of 3ms (+ or – 0.5ms) every 10 seconds for 2.5min
(for a total of 15 micro-interruptions). (6) Force performance monitoring counters update or wait for the counters to be
updated at the access node.
(7) Record the value of the CRC-PFE and CV-PFE performance monitoring counters at the access node.
Expected
Result
(1) The VTU-R SHALL NOT lose sync with the VTU-O during the test.
(2) The test result SHALL consist of reporting at the Q-interface (i.e. at the Access Node) the following two Clause 30 OAM counters:
a. CRC-PFE: Downstream TCCRCErrors counter (32-bit)
b. CV-PFE: Downstream TCCodingViolations (32-bit) (3) The Clause 30 OAM counters SHALL be observed before and after errors are
induced on the loop. The test is passed if the downstream TCCodingViolations
counter changes because of the errors induced. The downstream TCCRCErrors counter might or might not change, depending
on the impact of the errors induced on the received 64/65-octet encapsulation
syntax.
NOTE: Further information on OAMPDU is provided in Appendix I.
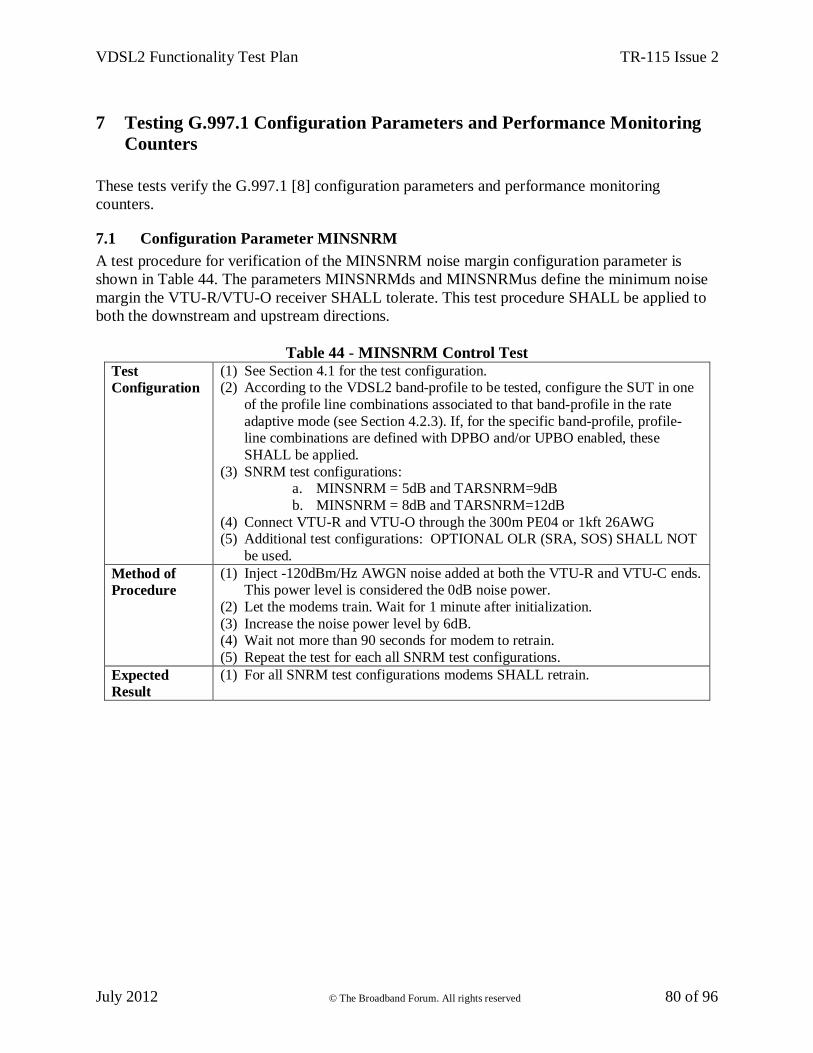
VDSL2 Functionality Test Plan TR-115 Issue 2
July 2012 © The Broadband Forum. All rights reserved 80 of 96
7 Testing G.997.1 Configuration Parameters and Performance Monitoring
Counters
These tests verify the G.997.1 [8] configuration parameters and performance monitoring
counters.
7.1 Configuration Parameter MINSNRM
A test procedure for verification of the MINSNRM noise margin configuration parameter is
shown in Table 44. The parameters MINSNRMds and MINSNRMus define the minimum noise
margin the VTU-R/VTU-O receiver SHALL tolerate. This test procedure SHALL be applied to
both the downstream and upstream directions.
Table 44 - MINSNRM Control Test
Test
Configuration
(1) See Section 4.1 for the test configuration. (2) According to the VDSL2 band-profile to be tested, configure the SUT in one
of the profile line combinations associated to that band-profile in the rate
adaptive mode (see Section 4.2.3). If, for the specific band-profile, profile-line combinations are defined with DPBO and/or UPBO enabled, these
SHALL be applied.
(3) SNRM test configurations: a. MINSNRM = 5dB and TARSNRM=9dB
b. MINSNRM = 8dB and TARSNRM=12dB
(4) Connect VTU-R and VTU-O through the 300m PE04 or 1kft 26AWG (5) Additional test configurations: OPTIONAL OLR (SRA, SOS) SHALL NOT
be used.
Method of
Procedure
(1) Inject -120dBm/Hz AWGN noise added at both the VTU-R and VTU-C ends. This power level is considered the 0dB noise power.
(2) Let the modems train. Wait for 1 minute after initialization.
(3) Increase the noise power level by 6dB. (4) Wait not more than 90 seconds for modem to retrain.
(5) Repeat the test for each all SNRM test configurations.
Expected
Result
(1) For all SNRM test configurations modems SHALL retrain.
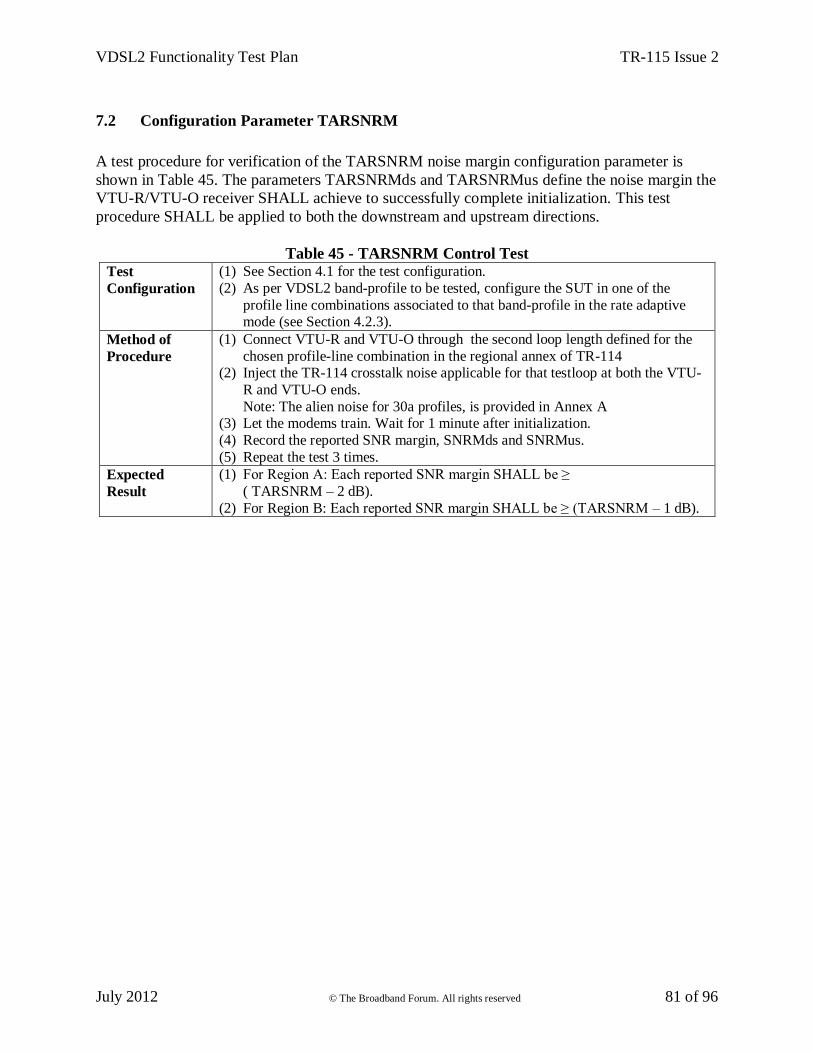
VDSL2 Functionality Test Plan TR-115 Issue 2
July 2012 © The Broadband Forum. All rights reserved 81 of 96
7.2 Configuration Parameter TARSNRM
A test procedure for verification of the TARSNRM noise margin configuration parameter is
shown in Table 45. The parameters TARSNRMds and TARSNRMus define the noise margin the
VTU-R/VTU-O receiver SHALL achieve to successfully complete initialization. This test
procedure SHALL be applied to both the downstream and upstream directions.
Table 45 - TARSNRM Control Test Test
Configuration
(1) See Section 4.1 for the test configuration.
(2) As per VDSL2 band-profile to be tested, configure the SUT in one of the
profile line combinations associated to that band-profile in the rate adaptive mode (see Section 4.2.3).
Method of
Procedure
(1) Connect VTU-R and VTU-O through the second loop length defined for the
chosen profile-line combination in the regional annex of TR-114 (2) Inject the TR-114 crosstalk noise applicable for that testloop at both the VTU-
R and VTU-O ends.
Note: The alien noise for 30a profiles, is provided in Annex A (3) Let the modems train. Wait for 1 minute after initialization.
(4) Record the reported SNR margin, SNRMds and SNRMus.
(5) Repeat the test 3 times.
Expected
Result
(1) For Region A: Each reported SNR margin SHALL be ≥
( TARSNRM – 2 dB).
(2) For Region B: Each reported SNR margin SHALL be ≥ (TARSNRM – 1 dB).
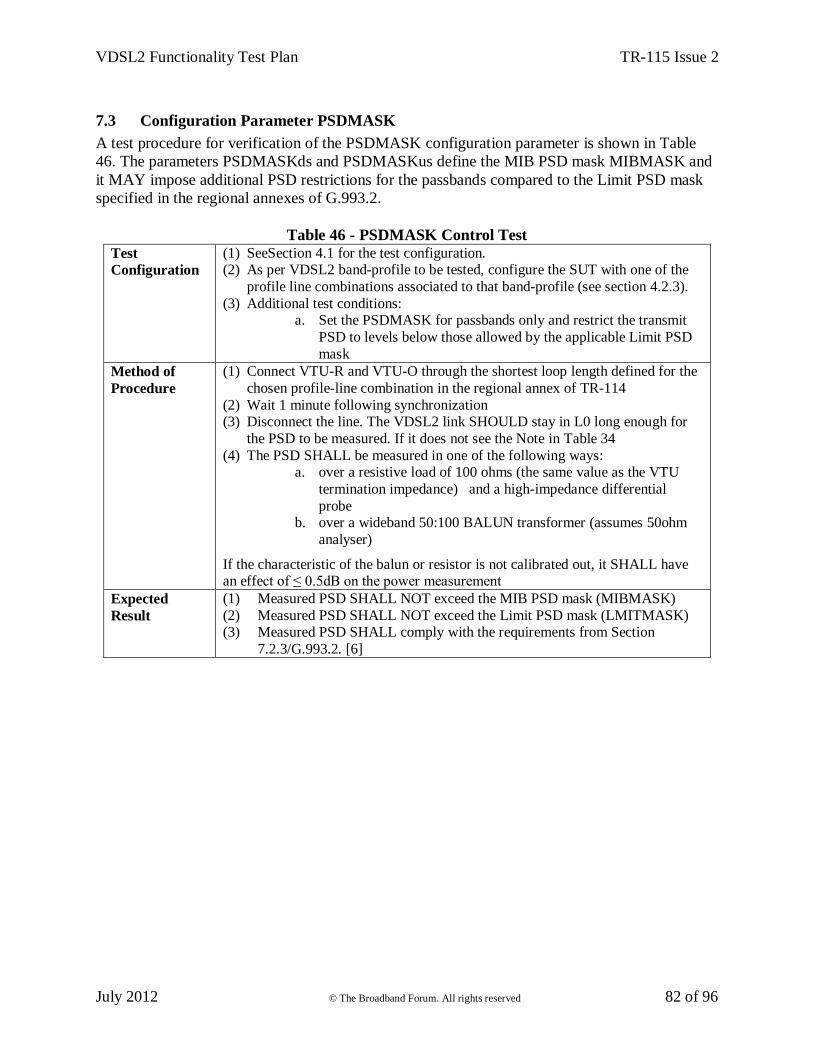
VDSL2 Functionality Test Plan TR-115 Issue 2
July 2012 © The Broadband Forum. All rights reserved 82 of 96
7.3 Configuration Parameter PSDMASK
A test procedure for verification of the PSDMASK configuration parameter is shown in Table
46. The parameters PSDMASKds and PSDMASKus define the MIB PSD mask MIBMASK and
it MAY impose additional PSD restrictions for the passbands compared to the Limit PSD mask
specified in the regional annexes of G.993.2.
Table 46 - PSDMASK Control Test
Test
Configuration (1) SeeSection 4.1 for the test configuration. (2) As per VDSL2 band-profile to be tested, configure the SUT with one of the
profile line combinations associated to that band-profile (see section 4.2.3).
(3) Additional test conditions: a. Set the PSDMASK for passbands only and restrict the transmit
PSD to levels below those allowed by the applicable Limit PSD
mask
Method of
Procedure
(1) Connect VTU-R and VTU-O through the shortest loop length defined for the
chosen profile-line combination in the regional annex of TR-114
(2) Wait 1 minute following synchronization (3) Disconnect the line. The VDSL2 link SHOULD stay in L0 long enough for
the PSD to be measured. If it does not see the Note in Table 34
(4) The PSD SHALL be measured in one of the following ways: a. over a resistive load of 100 ohms (the same value as the VTU
termination impedance) and a high-impedance differential
probe b. over a wideband 50:100 BALUN transformer (assumes 50ohm
analyser)
If the characteristic of the balun or resistor is not calibrated out, it SHALL have an effect of ≤ 0.5dB on the power measurement
Expected
Result
(1) Measured PSD SHALL NOT exceed the MIB PSD mask (MIBMASK)
(2) Measured PSD SHALL NOT exceed the Limit PSD mask (LMITMASK) (3) Measured PSD SHALL comply with the requirements from Section
7.2.3/G.993.2. [6]
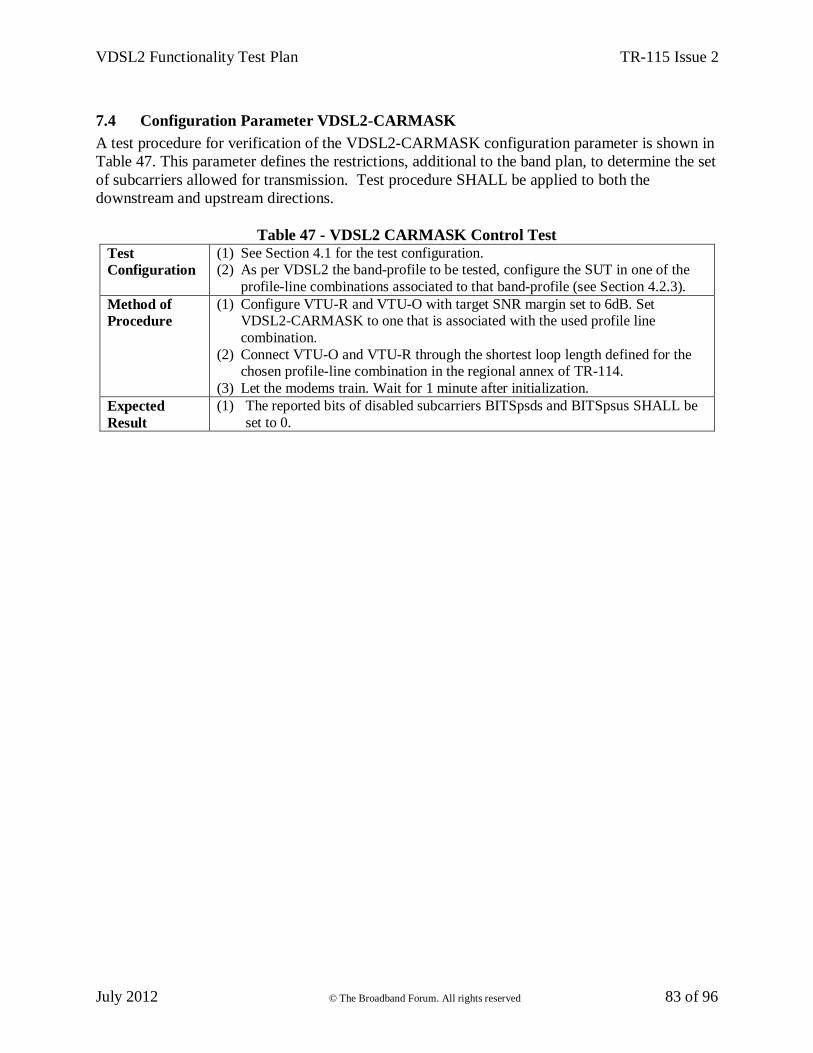
VDSL2 Functionality Test Plan TR-115 Issue 2
July 2012 © The Broadband Forum. All rights reserved 83 of 96
7.4 Configuration Parameter VDSL2-CARMASK
A test procedure for verification of the VDSL2-CARMASK configuration parameter is shown in
Table 47. This parameter defines the restrictions, additional to the band plan, to determine the set
of subcarriers allowed for transmission. Test procedure SHALL be applied to both the
downstream and upstream directions.
Table 47 - VDSL2 CARMASK Control Test
Test
Configuration
(1) See Section 4.1 for the test configuration. (2) As per VDSL2 the band-profile to be tested, configure the SUT in one of the
profile-line combinations associated to that band-profile (see Section 4.2.3).
Method of
Procedure
(1) Configure VTU-R and VTU-O with target SNR margin set to 6dB. Set VDSL2-CARMASK to one that is associated with the used profile line
combination.
(2) Connect VTU-O and VTU-R through the shortest loop length defined for the chosen profile-line combination in the regional annex of TR-114.
(3) Let the modems train. Wait for 1 minute after initialization.
Expected
Result
(1) The reported bits of disabled subcarriers BITSpsds and BITSpsus SHALL be
set to 0.
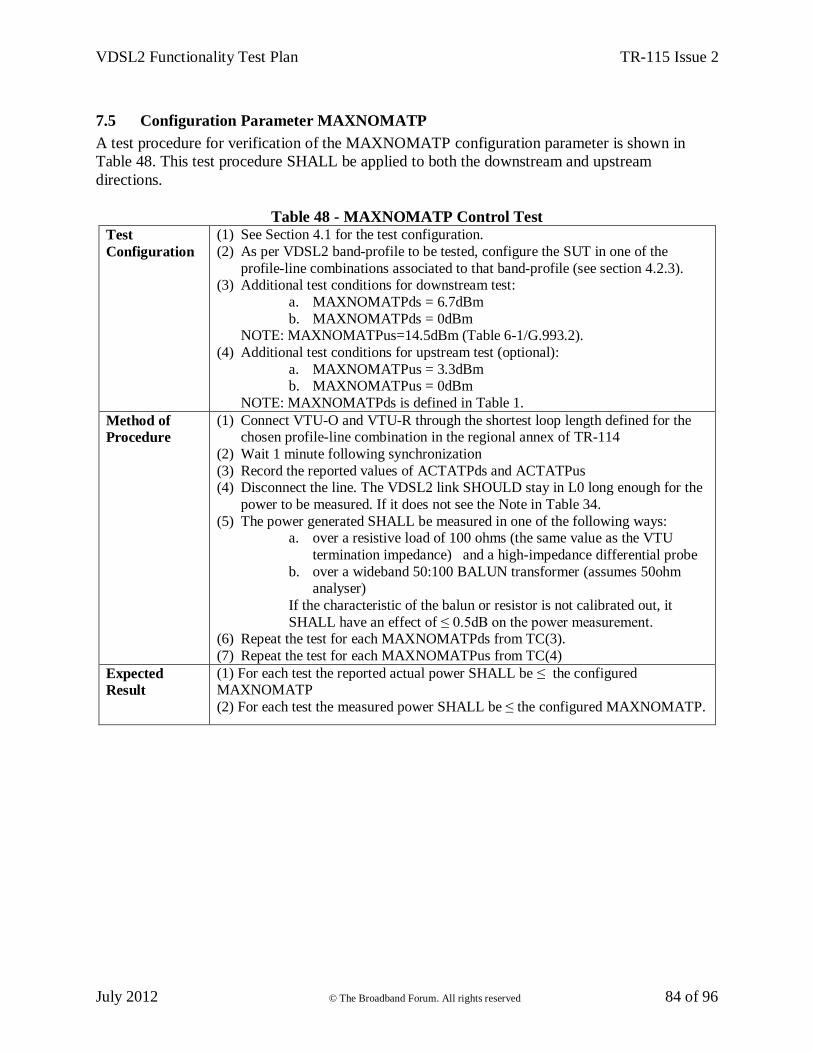
VDSL2 Functionality Test Plan TR-115 Issue 2
July 2012 © The Broadband Forum. All rights reserved 84 of 96
7.5 Configuration Parameter MAXNOMATP
A test procedure for verification of the MAXNOMATP configuration parameter is shown in
Table 48. This test procedure SHALL be applied to both the downstream and upstream
directions.
Table 48 - MAXNOMATP Control Test Test
Configuration
(1) See Section 4.1 for the test configuration.
(2) As per VDSL2 band-profile to be tested, configure the SUT in one of the
profile-line combinations associated to that band-profile (see section 4.2.3). (3) Additional test conditions for downstream test:
a. MAXNOMATPds = 6.7dBm
b. MAXNOMATPds = 0dBm NOTE: MAXNOMATPus=14.5dBm (Table 6-1/G.993.2).
(4) Additional test conditions for upstream test (optional):
a. MAXNOMATPus = 3.3dBm b. MAXNOMATPus = 0dBm
NOTE: MAXNOMATPds is defined in Table 1.
Method of
Procedure
(1) Connect VTU-O and VTU-R through the shortest loop length defined for the chosen profile-line combination in the regional annex of TR-114
(2) Wait 1 minute following synchronization
(3) Record the reported values of ACTATPds and ACTATPus (4) Disconnect the line. The VDSL2 link SHOULD stay in L0 long enough for the
power to be measured. If it does not see the Note in Table 34.
(5) The power generated SHALL be measured in one of the following ways: a. over a resistive load of 100 ohms (the same value as the VTU
termination impedance) and a high-impedance differential probe
b. over a wideband 50:100 BALUN transformer (assumes 50ohm analyser)
If the characteristic of the balun or resistor is not calibrated out, it
SHALL have an effect of ≤ 0.5dB on the power measurement. (6) Repeat the test for each MAXNOMATPds from TC(3).
(7) Repeat the test for each MAXNOMATPus from TC(4)
Expected
Result
(1) For each test the reported actual power SHALL be ≤ the configured MAXNOMATP
(2) For each test the measured power SHALL be ≤ the configured MAXNOMATP.
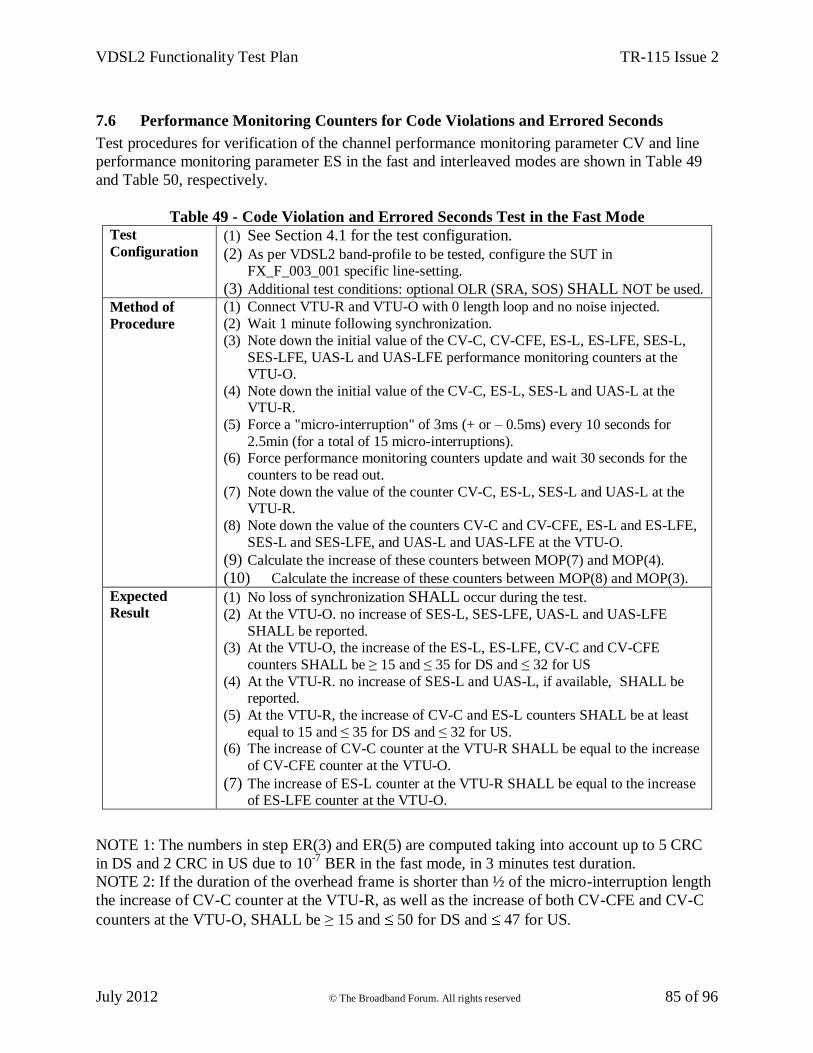
VDSL2 Functionality Test Plan TR-115 Issue 2
July 2012 © The Broadband Forum. All rights reserved 85 of 96
7.6 Performance Monitoring Counters for Code Violations and Errored Seconds
Test procedures for verification of the channel performance monitoring parameter CV and line
performance monitoring parameter ES in the fast and interleaved modes are shown in Table 49
and Table 50, respectively.
Table 49 - Code Violation and Errored Seconds Test in the Fast Mode Test
Configuration (1) See Section 4.1 for the test configuration.
(2) As per VDSL2 band-profile to be tested, configure the SUT in FX_F_003_001 specific line-setting.
(3) Additional test conditions: optional OLR (SRA, SOS) SHALL NOT be used. Method of
Procedure
(1) Connect VTU-R and VTU-O with 0 length loop and no noise injected.
(2) Wait 1 minute following synchronization.
(3) Note down the initial value of the CV-C, CV-CFE, ES-L, ES-LFE, SES-L,
SES-LFE, UAS-L and UAS-LFE performance monitoring counters at the VTU-O.
(4) Note down the initial value of the CV-C, ES-L, SES-L and UAS-L at the VTU-R.
(5) Force a "micro-interruption" of 3ms (+ or – 0.5ms) every 10 seconds for
2.5min (for a total of 15 micro-interruptions). (6) Force performance monitoring counters update and wait 30 seconds for the
counters to be read out.
(7) Note down the value of the counter CV-C, ES-L, SES-L and UAS-L at the VTU-R.
(8) Note down the value of the counters CV-C and CV-CFE, ES-L and ES-LFE,
SES-L and SES-LFE, and UAS-L and UAS-LFE at the VTU-O.
(9) Calculate the increase of these counters between MOP(7) and MOP(4).
(10) Calculate the increase of these counters between MOP(8) and MOP(3). Expected
Result (1) No loss of synchronization SHALL occur during the test.
(2) At the VTU-O. no increase of SES-L, SES-LFE, UAS-L and UAS-LFE
SHALL be reported. (3) At the VTU-O, the increase of the ES-L, ES-LFE, CV-C and CV-CFE
counters SHALL be ≥ 15 and ≤ 35 for DS and ≤ 32 for US
(4) At the VTU-R. no increase of SES-L and UAS-L, if available, SHALL be reported.
(5) At the VTU-R, the increase of CV-C and ES-L counters SHALL be at least
equal to 15 and ≤ 35 for DS and ≤ 32 for US. (6) The increase of CV-C counter at the VTU-R SHALL be equal to the increase
of CV-CFE counter at the VTU-O.
(7) The increase of ES-L counter at the VTU-R SHALL be equal to the increase of ES-LFE counter at the VTU-O.
NOTE 1: The numbers in step ER(3) and ER(5) are computed taking into account up to 5 CRC
in DS and 2 CRC in US due to 10-7
BER in the fast mode, in 3 minutes test duration.
NOTE 2: If the duration of the overhead frame is shorter than ½ of the micro-interruption length
the increase of CV-C counter at the VTU-R, as well as the increase of both CV-CFE and CV-C
counters at the VTU-O, SHALL be ≥ 15 and 50 for DS and 47 for US.
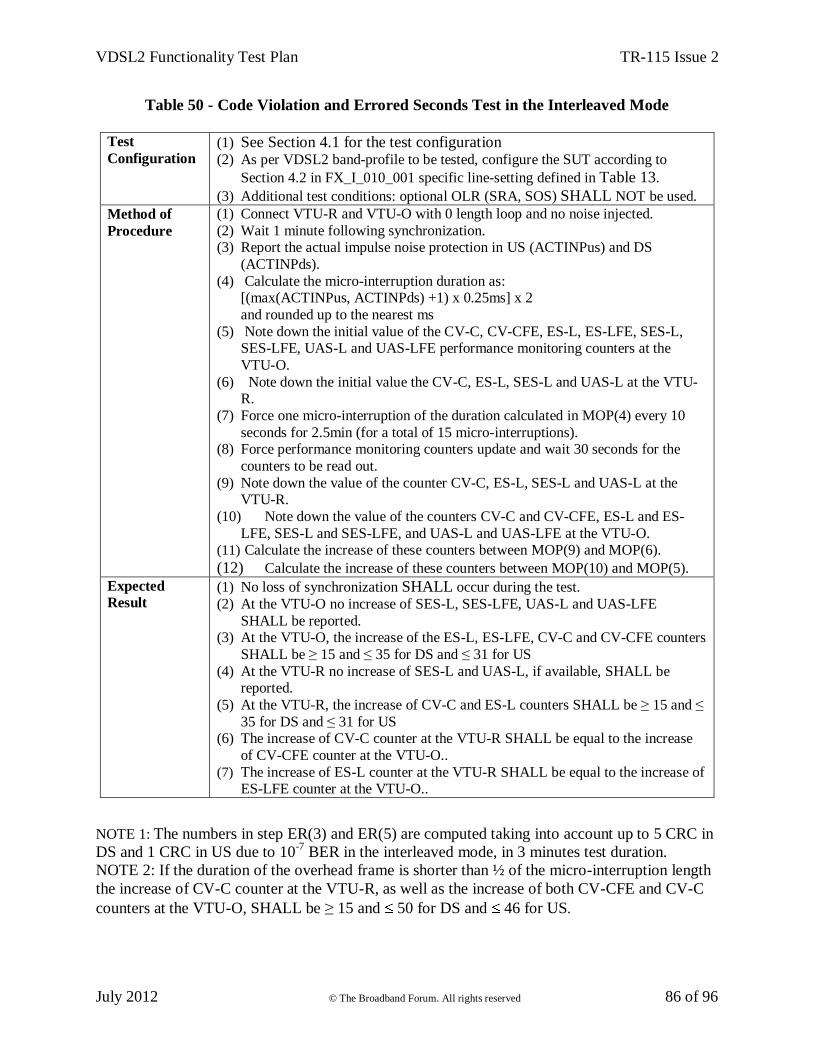
VDSL2 Functionality Test Plan TR-115 Issue 2
July 2012 © The Broadband Forum. All rights reserved 86 of 96
Table 50 - Code Violation and Errored Seconds Test in the Interleaved Mode
Test
Configuration (1) See Section 4.1 for the test configuration
(2) As per VDSL2 band-profile to be tested, configure the SUT according to
Section 4.2 in FX_I_010_001 specific line-setting defined in Table 13.
(3) Additional test conditions: optional OLR (SRA, SOS) SHALL NOT be used.
Method of
Procedure
(1) Connect VTU-R and VTU-O with 0 length loop and no noise injected.
(2) Wait 1 minute following synchronization. (3) Report the actual impulse noise protection in US (ACTINPus) and DS
(ACTINPds).
(4) Calculate the micro-interruption duration as: [(max(ACTINPus, ACTINPds) +1) x 0.25ms] x 2
and rounded up to the nearest ms
(5) Note down the initial value of the CV-C, CV-CFE, ES-L, ES-LFE, SES-L, SES-LFE, UAS-L and UAS-LFE performance monitoring counters at the
VTU-O.
(6) Note down the initial value the CV-C, ES-L, SES-L and UAS-L at the VTU-R.
(7) Force one micro-interruption of the duration calculated in MOP(4) every 10
seconds for 2.5min (for a total of 15 micro-interruptions). (8) Force performance monitoring counters update and wait 30 seconds for the
counters to be read out.
(9) Note down the value of the counter CV-C, ES-L, SES-L and UAS-L at the VTU-R.
(10) Note down the value of the counters CV-C and CV-CFE, ES-L and ES-
LFE, SES-L and SES-LFE, and UAS-L and UAS-LFE at the VTU-O. (11) Calculate the increase of these counters between MOP(9) and MOP(6).
(12) Calculate the increase of these counters between MOP(10) and MOP(5). Expected
Result (1) No loss of synchronization SHALL occur during the test.
(2) At the VTU-O no increase of SES-L, SES-LFE, UAS-L and UAS-LFE
SHALL be reported. (3) At the VTU-O, the increase of the ES-L, ES-LFE, CV-C and CV-CFE counters
SHALL be ≥ 15 and ≤ 35 for DS and ≤ 31 for US
(4) At the VTU-R no increase of SES-L and UAS-L, if available, SHALL be reported.
(5) At the VTU-R, the increase of CV-C and ES-L counters SHALL be ≥ 15 and ≤
35 for DS and ≤ 31 for US (6) The increase of CV-C counter at the VTU-R SHALL be equal to the increase
of CV-CFE counter at the VTU-O..
(7) The increase of ES-L counter at the VTU-R SHALL be equal to the increase of ES-LFE counter at the VTU-O..
NOTE 1: The numbers in step ER(3) and ER(5) are computed taking into account up to 5 CRC in
DS and 1 CRC in US due to 10-7
BER in the interleaved mode, in 3 minutes test duration.
NOTE 2: If the duration of the overhead frame is shorter than ½ of the micro-interruption length
the increase of CV-C counter at the VTU-R, as well as the increase of both CV-CFE and CV-C
counters at the VTU-O, SHALL be ≥ 15 and 50 for DS and 46 for US.
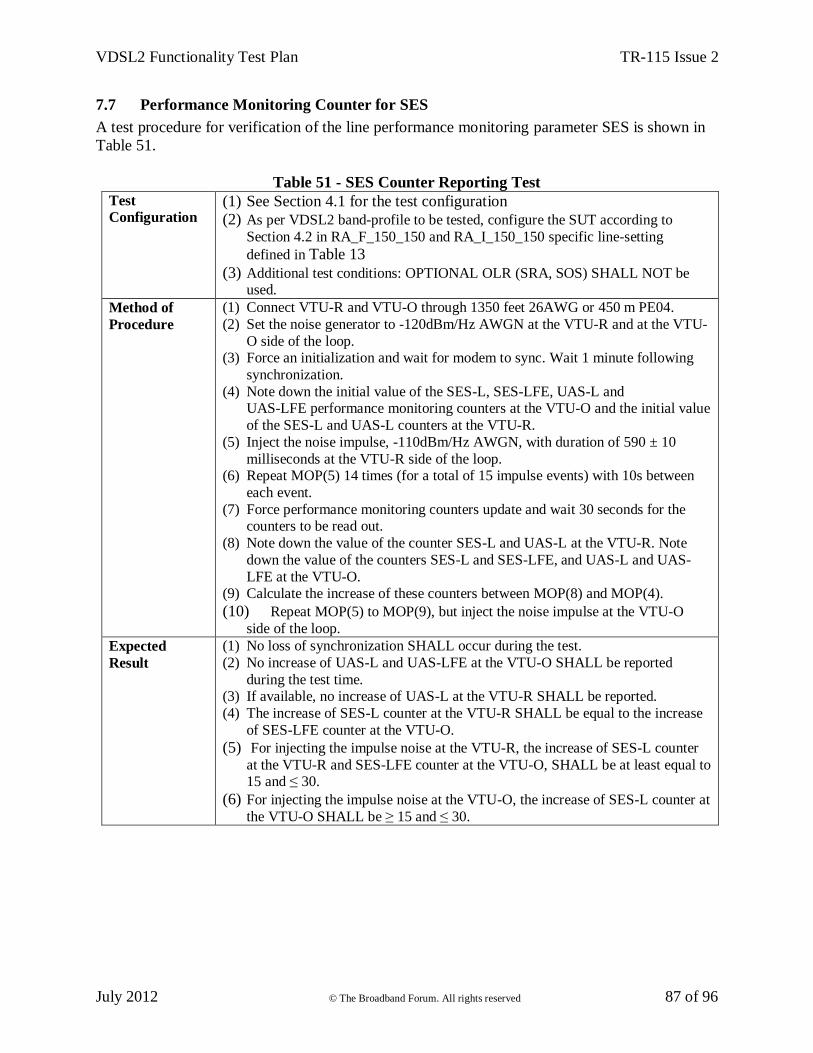
VDSL2 Functionality Test Plan TR-115 Issue 2
July 2012 © The Broadband Forum. All rights reserved 87 of 96
7.7 Performance Monitoring Counter for SES
A test procedure for verification of the line performance monitoring parameter SES is shown in
Table 51.
Table 51 - SES Counter Reporting Test
Test
Configuration (1) See Section 4.1 for the test configuration
(2) As per VDSL2 band-profile to be tested, configure the SUT according to
Section 4.2 in RA_F_150_150 and RA_I_150_150 specific line-setting
defined in Table 13
(3) Additional test conditions: OPTIONAL OLR (SRA, SOS) SHALL NOT be used.
Method of
Procedure
(1) Connect VTU-R and VTU-O through 1350 feet 26AWG or 450 m PE04.
(2) Set the noise generator to -120dBm/Hz AWGN at the VTU-R and at the VTU-
O side of the loop. (3) Force an initialization and wait for modem to sync. Wait 1 minute following
synchronization.
(4) Note down the initial value of the SES-L, SES-LFE, UAS-L and UAS-LFE performance monitoring counters at the VTU-O and the initial value
of the SES-L and UAS-L counters at the VTU-R.
(5) Inject the noise impulse, -110dBm/Hz AWGN, with duration of 590 ± 10
milliseconds at the VTU-R side of the loop. (6) Repeat MOP(5) 14 times (for a total of 15 impulse events) with 10s between
each event.
(7) Force performance monitoring counters update and wait 30 seconds for the counters to be read out.
(8) Note down the value of the counter SES-L and UAS-L at the VTU-R. Note
down the value of the counters SES-L and SES-LFE, and UAS-L and UAS-
LFE at the VTU-O. (9) Calculate the increase of these counters between MOP(8) and MOP(4).
(10) Repeat MOP(5) to MOP(9), but inject the noise impulse at the VTU-O
side of the loop. Expected
Result
(1) No loss of synchronization SHALL occur during the test.
(2) No increase of UAS-L and UAS-LFE at the VTU-O SHALL be reported
during the test time. (3) If available, no increase of UAS-L at the VTU-R SHALL be reported.
(4) The increase of SES-L counter at the VTU-R SHALL be equal to the increase
of SES-LFE counter at the VTU-O.
(5) For injecting the impulse noise at the VTU-R, the increase of SES-L counter
at the VTU-R and SES-LFE counter at the VTU-O, SHALL be at least equal to 15 and ≤ 30.
(6) For injecting the impulse noise at the VTU-O, the increase of SES-L counter at
the VTU-O SHALL be ≥ 15 and ≤ 30.
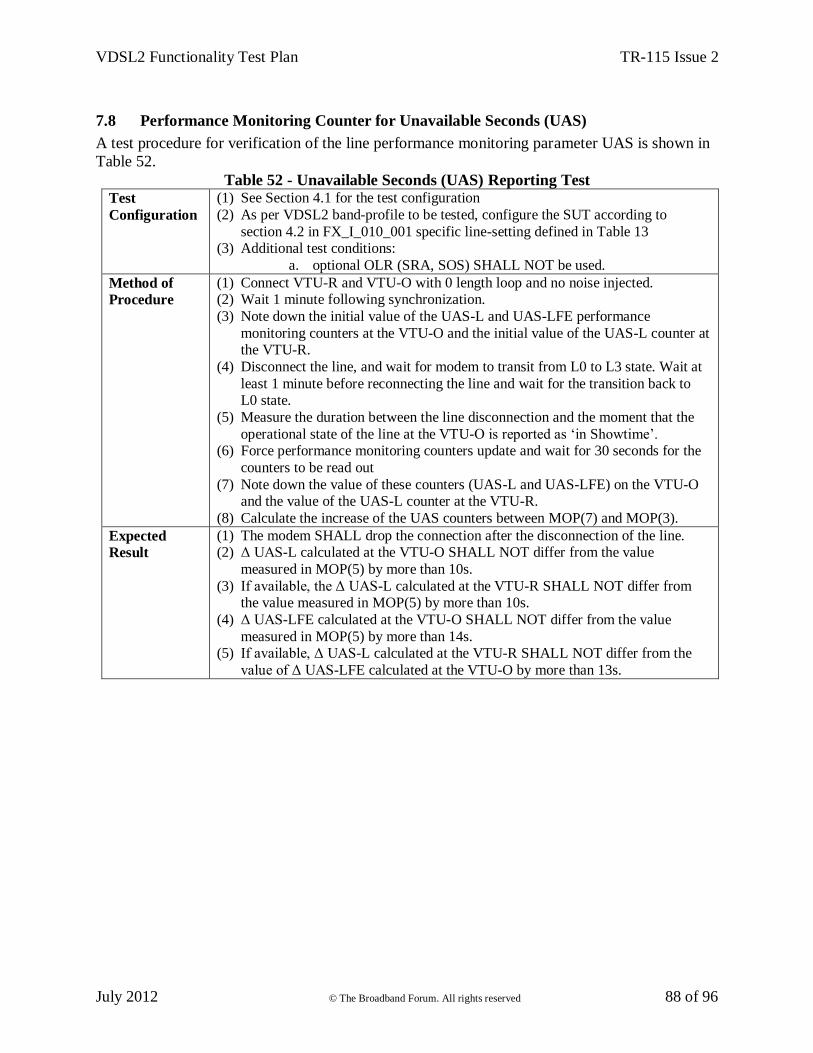
VDSL2 Functionality Test Plan TR-115 Issue 2
July 2012 © The Broadband Forum. All rights reserved 88 of 96
7.8 Performance Monitoring Counter for Unavailable Seconds (UAS)
A test procedure for verification of the line performance monitoring parameter UAS is shown in
Table 52.
Table 52 - Unavailable Seconds (UAS) Reporting Test Test
Configuration
(1) See Section 4.1 for the test configuration
(2) As per VDSL2 band-profile to be tested, configure the SUT according to
section 4.2 in FX_I_010_001 specific line-setting defined in Table 13 (3) Additional test conditions:
a. optional OLR (SRA, SOS) SHALL NOT be used.
Method of
Procedure
(1) Connect VTU-R and VTU-O with 0 length loop and no noise injected. (2) Wait 1 minute following synchronization.
(3) Note down the initial value of the UAS-L and UAS-LFE performance
monitoring counters at the VTU-O and the initial value of the UAS-L counter at the VTU-R.
(4) Disconnect the line, and wait for modem to transit from L0 to L3 state. Wait at
least 1 minute before reconnecting the line and wait for the transition back to L0 state.
(5) Measure the duration between the line disconnection and the moment that the
operational state of the line at the VTU-O is reported as ‘in Showtime’. (6) Force performance monitoring counters update and wait for 30 seconds for the
counters to be read out
(7) Note down the value of these counters (UAS-L and UAS-LFE) on the VTU-O and the value of the UAS-L counter at the VTU-R.
(8) Calculate the increase of the UAS counters between MOP(7) and MOP(3).
Expected
Result
(1) The modem SHALL drop the connection after the disconnection of the line. (2) Δ UAS-L calculated at the VTU-O SHALL NOT differ from the value
measured in MOP(5) by more than 10s.
(3) If available, the Δ UAS-L calculated at the VTU-R SHALL NOT differ from the value measured in MOP(5) by more than 10s.
(4) Δ UAS-LFE calculated at the VTU-O SHALL NOT differ from the value
measured in MOP(5) by more than 14s. (5) If available, Δ UAS-L calculated at the VTU-R SHALL NOT differ from the
value of Δ UAS-LFE calculated at the VTU-O by more than 13s.
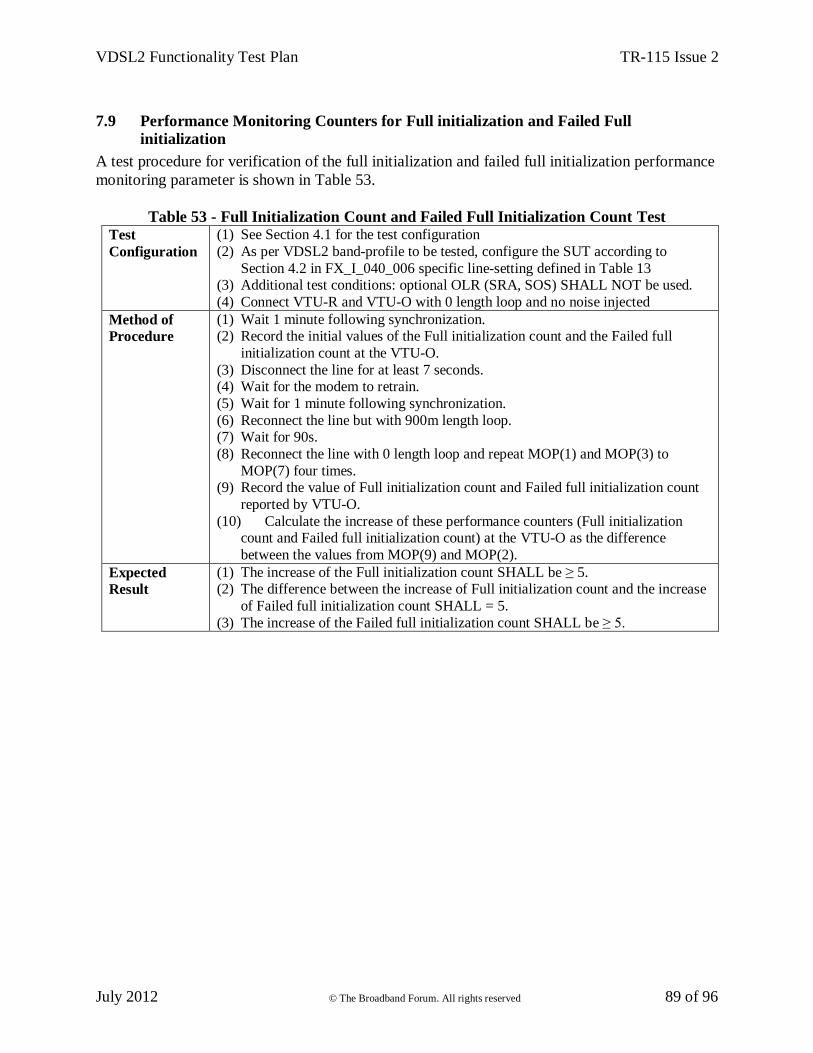
VDSL2 Functionality Test Plan TR-115 Issue 2
July 2012 © The Broadband Forum. All rights reserved 89 of 96
7.9 Performance Monitoring Counters for Full initialization and Failed Full
initialization
A test procedure for verification of the full initialization and failed full initialization performance
monitoring parameter is shown in Table 53.
Table 53 - Full Initialization Count and Failed Full Initialization Count Test Test
Configuration
(1) See Section 4.1 for the test configuration
(2) As per VDSL2 band-profile to be tested, configure the SUT according to
Section 4.2 in FX_I_040_006 specific line-setting defined in Table 13 (3) Additional test conditions: optional OLR (SRA, SOS) SHALL NOT be used.
(4) Connect VTU-R and VTU-O with 0 length loop and no noise injected
Method of
Procedure
(1) Wait 1 minute following synchronization. (2) Record the initial values of the Full initialization count and the Failed full
initialization count at the VTU-O.
(3) Disconnect the line for at least 7 seconds. (4) Wait for the modem to retrain.
(5) Wait for 1 minute following synchronization.
(6) Reconnect the line but with 900m length loop. (7) Wait for 90s.
(8) Reconnect the line with 0 length loop and repeat MOP(1) and MOP(3) to
MOP(7) four times. (9) Record the value of Full initialization count and Failed full initialization count
reported by VTU-O.
(10) Calculate the increase of these performance counters (Full initialization count and Failed full initialization count) at the VTU-O as the difference
between the values from MOP(9) and MOP(2).
Expected
Result
(1) The increase of the Full initialization count SHALL be ≥ 5. (2) The difference between the increase of Full initialization count and the increase
of Failed full initialization count SHALL = 5.
(3) The increase of the Failed full initialization count SHALL be ≥ 5.
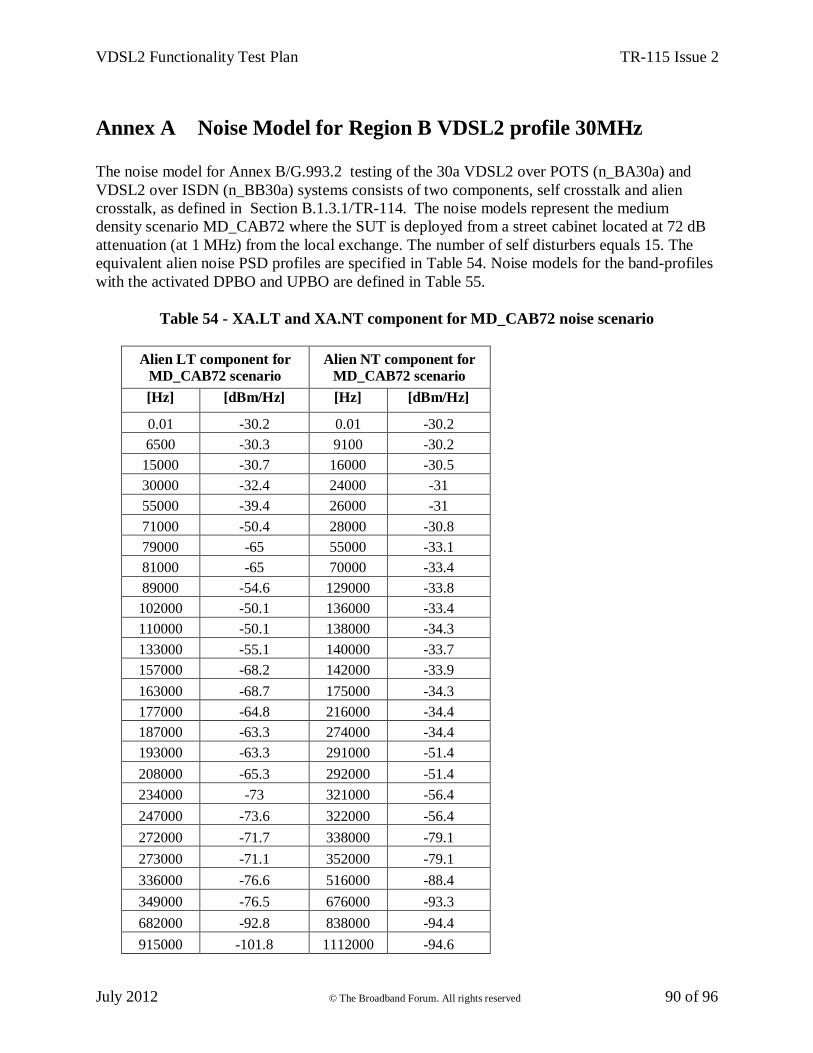
VDSL2 Functionality Test Plan TR-115 Issue 2
July 2012 © The Broadband Forum. All rights reserved 90 of 96
Annex A Noise Model for Region B VDSL2 profile 30MHz
The noise model for Annex B/G.993.2 testing of the 30a VDSL2 over POTS (n_BA30a) and
VDSL2 over ISDN (n_BB30a) systems consists of two components, self crosstalk and alien
crosstalk, as defined in Section B.1.3.1/TR-114. The noise models represent the medium
density scenario MD_CAB72 where the SUT is deployed from a street cabinet located at 72 dB
attenuation (at 1 MHz) from the local exchange. The number of self disturbers equals 15. The
equivalent alien noise PSD profiles are specified in Table 54. Noise models for the band-profiles
with the activated DPBO and UPBO are defined in Table 55.
Table 54 - XA.LT and XA.NT component for MD_CAB72 noise scenario
Alien LT component for
MD_CAB72 scenario
Alien NT component for
MD_CAB72 scenario
[Hz] [dBm/Hz] [Hz] [dBm/Hz]
0.01 -30.2 0.01 -30.2
6500 -30.3 9100 -30.2
15000 -30.7 16000 -30.5
30000 -32.4 24000 -31
55000 -39.4 26000 -31
71000 -50.4 28000 -30.8
79000 -65 55000 -33.1
81000 -65 70000 -33.4
89000 -54.6 129000 -33.8
102000 -50.1 136000 -33.4
110000 -50.1 138000 -34.3
133000 -55.1 140000 -33.7
157000 -68.2 142000 -33.9
163000 -68.7 175000 -34.3
177000 -64.8 216000 -34.4
187000 -63.3 274000 -34.4
193000 -63.3 291000 -51.4
208000 -65.3 292000 -51.4
234000 -73 321000 -56.4
247000 -73.6 322000 -56.4
272000 -71.7 338000 -79.1
273000 -71.1 352000 -79.1
336000 -76.6 516000 -88.4
349000 -76.5 676000 -93.3
682000 -92.8 838000 -94.4
915000 -101.8 1112000 -94.6
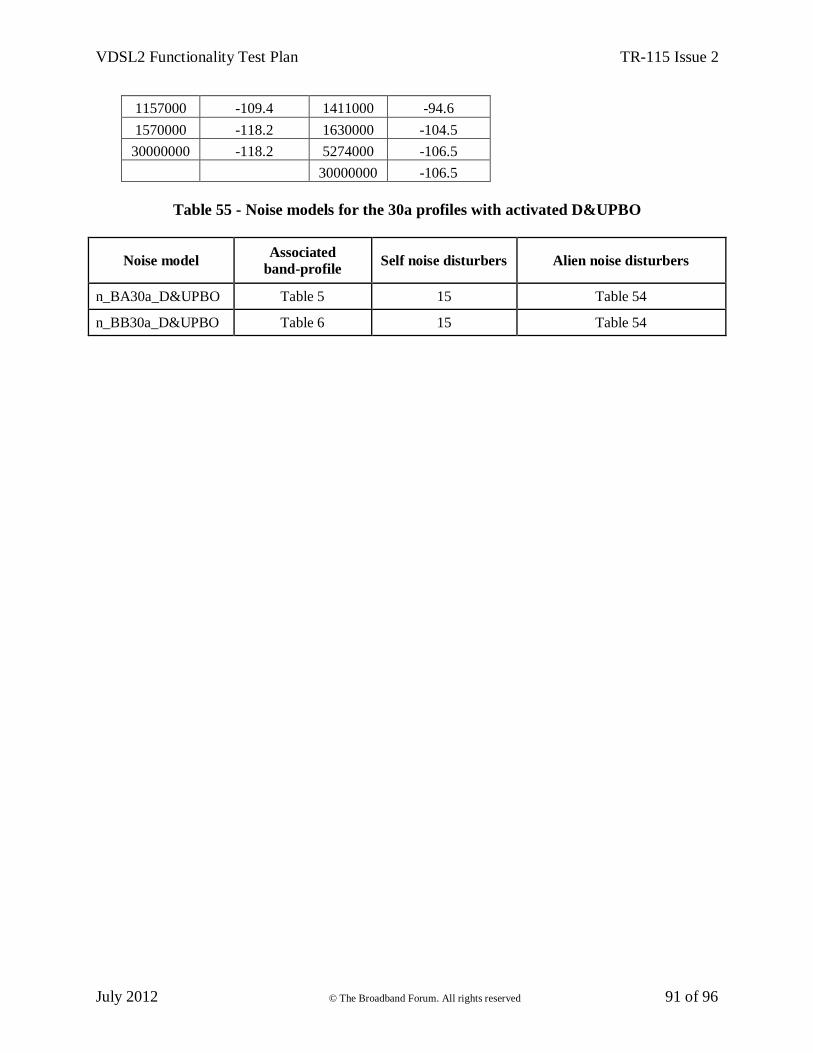
VDSL2 Functionality Test Plan TR-115 Issue 2
July 2012 © The Broadband Forum. All rights reserved 91 of 96
1157000 -109.4 1411000 -94.6
1570000 -118.2 1630000 -104.5
30000000 -118.2 5274000 -106.5
30000000 -106.5
Table 55 - Noise models for the 30a profiles with activated D&UPBO
Noise model Associated
band-profile Self noise disturbers Alien noise disturbers
n_BA30a_D&UPBO Table 5 15 Table 54
n_BB30a_D&UPBO Table 6 15 Table 54
VDSL2 Functionality Test Plan TR-115 Issue 2
July 2012 © The Broadband Forum. All rights reserved 92 of 96
Annex B Annex B PEIN Test Sequence
PEIN Test Sequence is contained in TR-115_Issue-2.xls, which can be found on the Technical
Reports page at www.broadband-forum.org.
VDSL2 Functionality Test Plan TR-115 Issue 2
July 2012 © The Broadband Forum. All rights reserved 93 of 96
Appendix I Additional Information about OAM Protocol Data
Unit (OAMPDU) (informative)
The Information OAMPDU at the end of the Discovery process is shown in Table 56 for both
downstream (-O side transmit) and upstream (-R side transmit). In this example, the capabilities
reflect the minimum functionality required in Section 6.1. However, other capabilities that are
not essential to perform this test might also be indicated.
The Variable Request and Variable Response OAMPDUs to retrieve both counters are shown in
Table 57 through Table 60, These examples show the basic single request/response OAMPDUs.
However, a Variable Request OAMPDU MAY contain multiple Variable Descriptors, and a
Variable Response OAMPDU MAY contain multiple Variable Containers, in order to retrieve
multiple counter values at once.
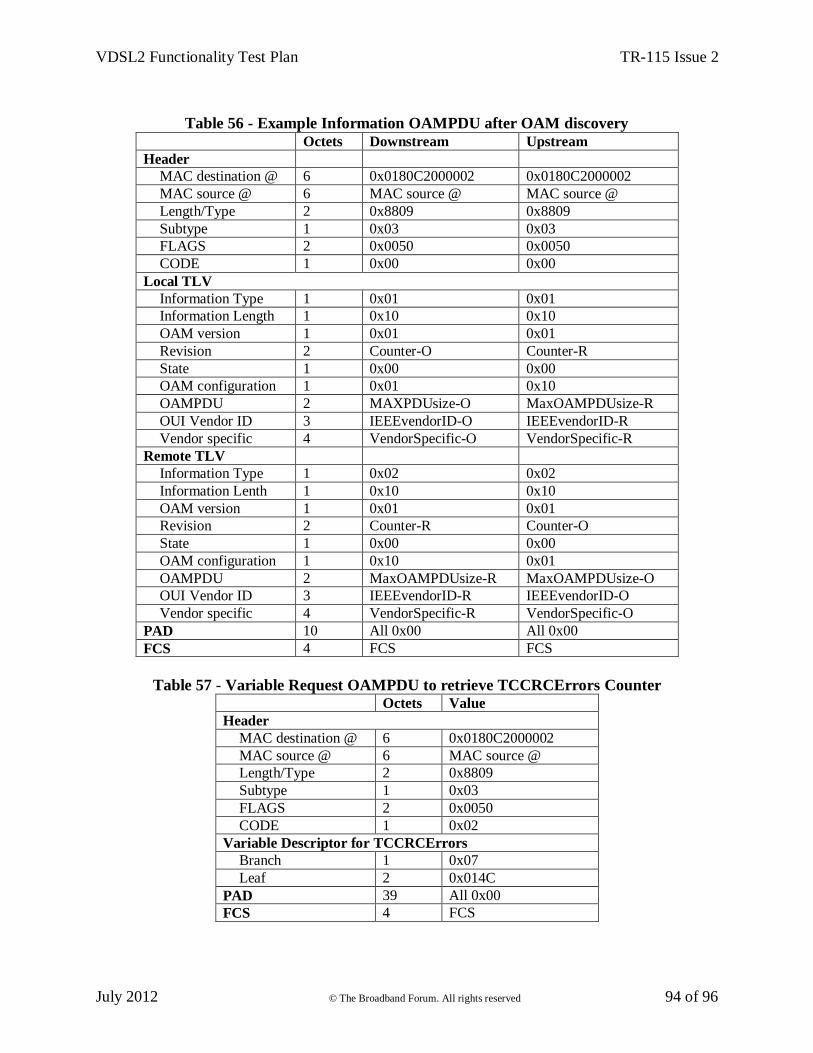
VDSL2 Functionality Test Plan TR-115 Issue 2
July 2012 © The Broadband Forum. All rights reserved 94 of 96
Table 56 - Example Information OAMPDU after OAM discovery
Octets Downstream Upstream
Header
MAC destination @ 6 0x0180C2000002 0x0180C2000002
MAC source @ 6 MAC source @ MAC source @
Length/Type 2 0x8809 0x8809
Subtype 1 0x03 0x03
FLAGS 2 0x0050 0x0050
CODE 1 0x00 0x00
Local TLV
Information Type 1 0x01 0x01
Information Length 1 0x10 0x10
OAM version 1 0x01 0x01
Revision 2 Counter-O Counter-R
State 1 0x00 0x00
OAM configuration 1 0x01 0x10
OAMPDU 2 MAXPDUsize-O MaxOAMPDUsize-R
OUI Vendor ID 3 IEEEvendorID-O IEEEvendorID-R
Vendor specific 4 VendorSpecific-O VendorSpecific-R
Remote TLV
Information Type 1 0x02 0x02
Information Lenth 1 0x10 0x10
OAM version 1 0x01 0x01
Revision 2 Counter-R Counter-O
State 1 0x00 0x00
OAM configuration 1 0x10 0x01
OAMPDU 2 MaxOAMPDUsize-R MaxOAMPDUsize-O
OUI Vendor ID 3 IEEEvendorID-R IEEEvendorID-O
Vendor specific 4 VendorSpecific-R VendorSpecific-O
PAD 10 All 0x00 All 0x00
FCS 4 FCS FCS
Table 57 - Variable Request OAMPDU to retrieve TCCRCErrors Counter Octets Value
Header
MAC destination @ 6 0x0180C2000002
MAC source @ 6 MAC source @
Length/Type 2 0x8809
Subtype 1 0x03
FLAGS 2 0x0050
CODE 1 0x02
Variable Descriptor for TCCRCErrors
Branch 1 0x07
Leaf 2 0x014C
PAD 39 All 0x00
FCS 4 FCS
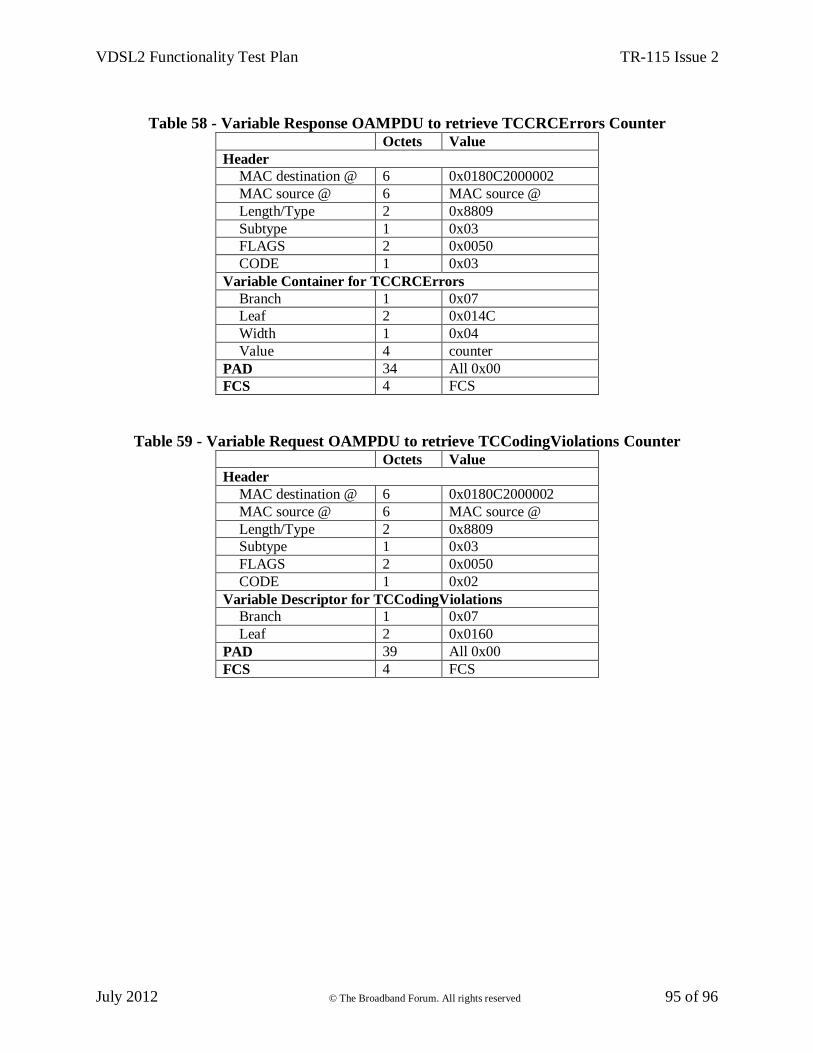
VDSL2 Functionality Test Plan TR-115 Issue 2
July 2012 © The Broadband Forum. All rights reserved 95 of 96
Table 58 - Variable Response OAMPDU to retrieve TCCRCErrors Counter
Octets Value
Header
MAC destination @ 6 0x0180C2000002
MAC source @ 6 MAC source @
Length/Type 2 0x8809
Subtype 1 0x03
FLAGS 2 0x0050
CODE 1 0x03
Variable Container for TCCRCErrors
Branch 1 0x07
Leaf 2 0x014C
Width 1 0x04
Value 4 counter
PAD 34 All 0x00
FCS 4 FCS
Table 59 - Variable Request OAMPDU to retrieve TCCodingViolations Counter
Octets Value
Header
MAC destination @ 6 0x0180C2000002
MAC source @ 6 MAC source @
Length/Type 2 0x8809
Subtype 1 0x03
FLAGS 2 0x0050
CODE 1 0x02
Variable Descriptor for TCCodingViolations
Branch 1 0x07
Leaf 2 0x0160
PAD 39 All 0x00
FCS 4 FCS
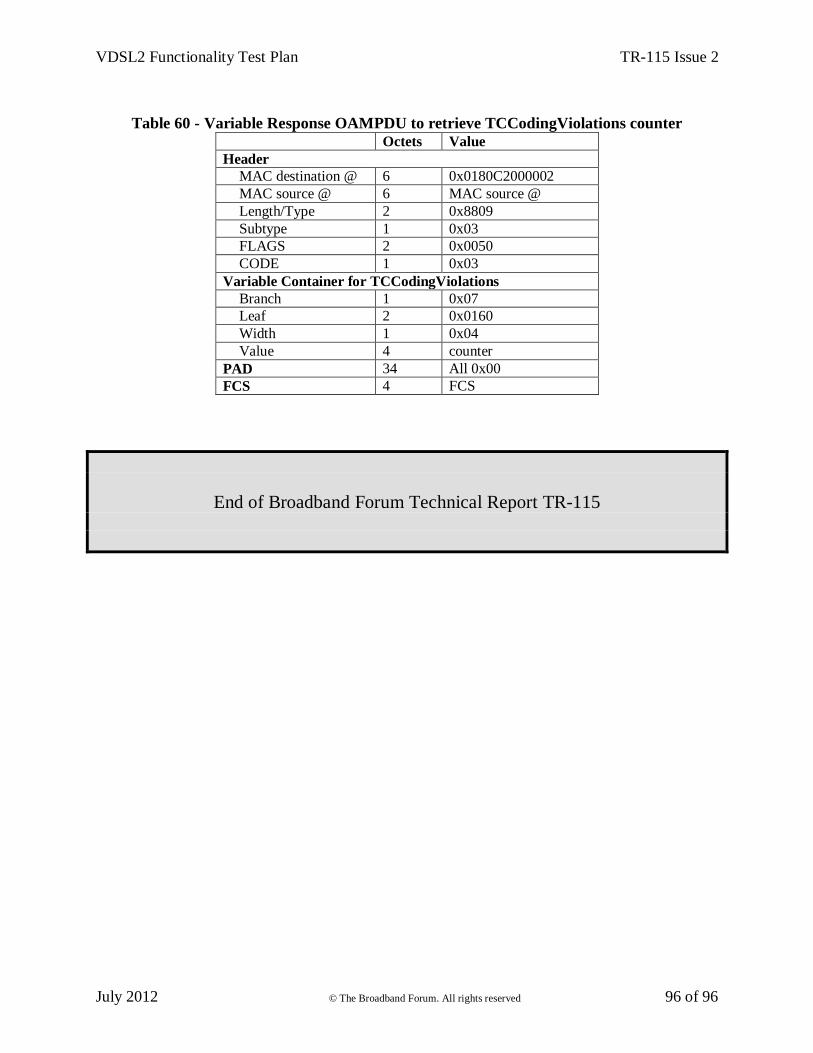
VDSL2 Functionality Test Plan TR-115 Issue 2
July 2012 © The Broadband Forum. All rights reserved 96 of 96
Table 60 - Variable Response OAMPDU to retrieve TCCodingViolations counter
Octets Value
Header
MAC destination @ 6 0x0180C2000002
MAC source @ 6 MAC source @
Length/Type 2 0x8809
Subtype 1 0x03
FLAGS 2 0x0050
CODE 1 0x03
Variable Container for TCCodingViolations
Branch 1 0x07
Leaf 2 0x0160
Width 1 0x04
Value 4 counter
PAD 34 All 0x00
FCS 4 FCS
End of Broadband Forum Technical Report TR-115


![Welcome [] · VDSL2 with weak FEXT VDSL2 with strong FEXT VDSL2, theoretical with Vectoring Dämpfung FEXT. Downstream [Mbps] – VDSL2 Profile 17a Reichweite Mit Vectoring kann fast](https://img.pdfslide.us/doc/110x75/5e1e042510f3b012214f201d/welcome-vdsl2-with-weak-fext-vdsl2-with-strong-fext-vdsl2-theoretical-with.jpg)