Embed Size (px)
Citation preview

VC/M&A Tech Multiples - France 2021© 2021 Avolta Partners // www.avoltapartners.com
VC/M&A Tech MultiplesFrance 2021

VC/M&A Tech Multiples - France 2021© 2021 Avolta Partners // www.avoltapartners.com
Introduction
2
A “J” curb more than a “V” curb
After a bumpy but promising 2020, 2021 has been the true blossom of theEuropean Tech ecosystem. With more than €60bn in funding at the end ofQ3-21, it already represents almost a 2x growth from the 2020 full year figure(€32bn). On the current trend, Europe should reach €80bn in total funding, i.e.a 2.5x growth.Europe also became a substantial contributor to the worldwide herd ofunicorns with 115 members (incl. 39 newcomers in 2021) out of 850worldwide.
France has contributed to the European growth and one can clearly see thatthe French Tech ecosystem has matured with €8.2bn in total funding YTD and11 new unicorns. On the current trend, France would be around €11bn at theend of the year. Quite impressive! Yet, that’s only a 2x growth vs last year.Less that Europe’s 2.5x. Less than UK’s 2.4x (€28bn expected for 2021). Andless than the astonishing Germany’s 3x (€15bn expected for 2021).
In a broader perspective, we expect worldwide VC funding to rise up to€500bn in 2021, growing 2x from 2020 – just the same trend as France.
On the exit-side, we’ve seen some encouraging developments with theBelieve IPO on Euronext Paris for €2bn and the expected IPO of OVH in Q4-21 at €3.5bn. 2021 should reach €7.6bn in total exit, which would be the bestyear ever for the French ecosystem.
Arthur Porré, Co-Founder and Managing Partner, Oct. 11th, 2021
Tech exits transactions
Invested amount (€m) Deal count (#)
Deal Value (€m) Deal count (#)
VC fundraisings
Jan. Feb. Mar. Apr. May Jun. Jul. Aug. Sept.
Jan. Feb. Mar. Apr. May Jun. Jul. Aug. Sept.

VC/M&A Tech Multiples - France 2021© 2021 Avolta Partners // www.avoltapartners.com
VC trends

VC/M&A Tech Multiples - France 2021© 2021 Avolta Partners // www.avoltapartners.com
European startup fundraising is expected to growth 2x in 2021
Overview of European VC fundraising
4
VC trends
Invested amount (€bn)
Mega rounds are still mainly in the UK
Mega rounds > €100m (#)
€60bnInvested in Europe
(2021 YTD)
39New Unicorns
0 10 20 30 40 50
2017
2018
2019
2020
2021 YTD
UK Germany France
0
20
40
60
80
100
120
140
0
5
10
15
20
25
2011 2012 2013 2014 2015 2016 2017 2018 2019 2020 2021 YTD
France Germany UK Rest of Europe Nb. of European unicorns
Nb. of European unicorns (#)

VC/M&A Tech Multiples - France 2021© 2021 Avolta Partners // www.avoltapartners.com
French VC fundraising has grown at a 47% CAGR since 2014 and is estimated to reach €10.5bn in 2021
Overview of French VC fundraising
5
VC trends
Invested amount (€bn) Deal count (#)
0.7
1.5
2.1 2.1
2.9
4.6
5.6
10.5
0
100
200
300
400
500
600
700
800
900
0
2
4
6
8
10
12
2014 2015 2016 2017 2018 2019 2020 2021e

VC/M&A Tech Multiples - France 2021© 2021 Avolta Partners // www.avoltapartners.com
Top 5 funding rounds of 2021
VC deals: 536 funding rounds in 2021 for €8.3bn in total deal value
6
VC trendsRecord year for French VC fundraisings
Invested amount (€m)
Fundraising amounts continue to increase
Median deal value (€m)
€574m
led by SoftBank
Deal count (#)
€472m
led by SoftBank
€408m
led by Eurazeo
€310m
led by Draper Esprit
€300m
led by General Atlantic
Top 3 Top 10 Others No. deals

VC/M&A Tech Multiples - France 2021© 2021 Avolta Partners // www.avoltapartners.com
Fewer seed deals in the ecosystem
VC investments by type of series (1/2)
7
VC trends
Proportion of deals (%)
Seed
Series A
Series B
Series C
Series D+

VC/M&A Tech Multiples - France 2021© 2021 Avolta Partners // www.avoltapartners.com
Median fundraisings keep rising especially for Series B+
VC investments by type of series (2/2)
8
VC trends
Median fundraising amount (€m) Seed Series A Series B Series C Series D+

VC/M&A Tech Multiples - France 2021© 2021 Avolta Partners // www.avoltapartners.com
1 out of 4 startups goes on to raise a 2nd round of financing
Startup cohorts and profiles by round
9
VC trends
Base 100
100
27
83 1 0.3
0
10
20
30
40
50
60
70
80
90
100
Round 1 Round 2 Round 3 Round 4 Round 5 Round 6
Seed Series A Series B Series C Series D
Median TTM revenue €0.7m €1.3m €2.4m €5.6m €12.5m
Median fundraising €1.0m €3.0m €7.0m €18.3m €40.5m
Median pre-money valuation €3.5m €9.0m €17.5m €52.0m €179.5m
Median dilution 29% 28% 27% 22% 21%
Median age (years) 3 4 5 7 8

VC/M&A Tech Multiples - France 2021© 2021 Avolta Partners // www.avoltapartners.com
Subscription and Commission models continue to attract the majority of investments
Distribution of deals by business model
10
VC trends
Proportion of deals by business model (%)
Subscription
Commission
Manufacturing
E-commerce
Service
Research
Others
VC/M&A Tech Multiples - France 2021© 2021 Avolta Partners // www.avoltapartners.com
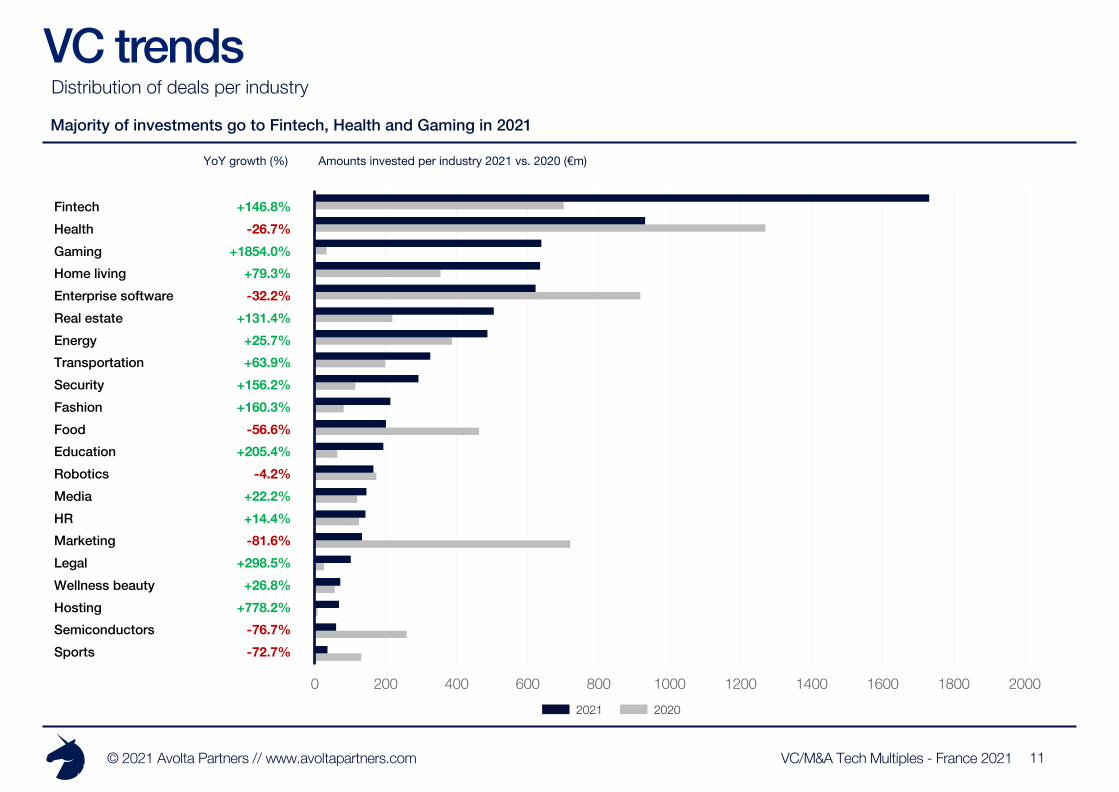
Majority of investments go to Fintech, Health and Gaming in 2021
Distribution of deals per industry
11
VC trends
Amounts invested per industry 2021 vs. 2020 (€m)
0 200 400 600 800 1000 1200 1400 1600 1800 2000
sportssemiconductors
hostingwellness beauty
Legalmarketing
jobs recruitmentmedia
roboticseducation
foodfashionsecurity
transportationenergy
real estateenterprise software
home livinggaming
healthfintech
YoY growth (%)
Fintech +146.8%Health -26.7%Gaming +1854.0%Home living +79.3%Enterprise software -32.2%Real estate +131.4%Energy +25.7%Transportation +63.9%Security +156.2%Fashion +160.3%Food -56.6%Education +205.4%Robotics -4.2%Media +22.2%HR +14.4%Marketing -81.6%Legal +298.5%Wellness beauty +26.8%Hosting +778.2%Semiconductors -76.7%Sports -72.7%
2021 2020
VC/M&A Tech Multiples - France 2021© 2021 Avolta Partners // www.avoltapartners.com
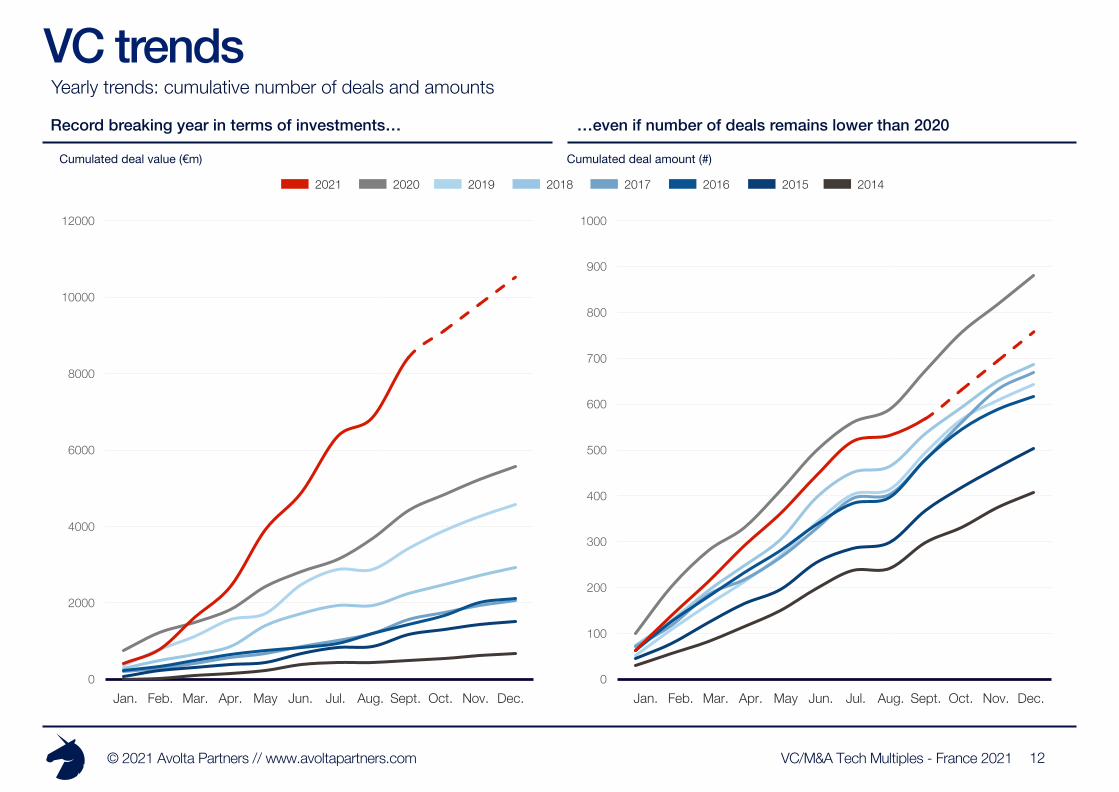
Record breaking year in terms of investments…
Yearly trends: cumulative number of deals and amounts
12
VC trends
Cumulated deal value (€m)
…even if number of deals remains lower than 2020
Cumulated deal amount (#)
2021 201620182020 2019 2017 2015 2014
0
100
200
300
400
500
600
700
800
900
1000
1 2 3 4 5 6 7 8 9 10 11 120
2000
4000
6000
8000
10000
12000
1 2 3 4 5 6 7 8 9 10 11 12Jan. Feb. Mar. Apr. May Jun. Jul. Aug. Sept. Oct. Nov. Dec. Jan. Feb. Mar. Apr. May Jun. Jul. Aug. Sept. Oct. Nov. Dec.

VC/M&A Tech Multiples - France 2021© 2021 Avolta Partners // www.avoltapartners.com
3.93.7
2.9
2.52.3 2.2
1.91.7 1.7
1.5 1.4 1.41.2 1.2 1.1 1.1 1.1 >1 >1 1.0 1.0
0.0
0.5
1.0
1.5
2.0
2.5
3.0
3.5
4.0
4.5
French unicorns by last round valuation
11 startups have reached unicorn status in 2021, France being the home of 21 unicorns
13
VC trends
Last round valuation (€bn)
Unicorn status reached in 2021 Unicorn status reached before 2021
1Headquarters in the U.S 2Exact amount not communicated by the company
1
1
1
2 2

VC/M&A Tech Multiples - France 2021© 2021 Avolta Partners // www.avoltapartners.com
Avolta Next 20: who will be France’s next unicorns?
14
VC trendsPossible French unicorns by last amount raised
Jul. 21 – Series C€142m
Sep. 20 – Series C€140m
Oct. 20 – Series C€315m
Nov. 16 – Series C€100m
Apr. 21 – Series C€100m
Jul. 21 – Series C€100m
Mar. 21 – Series D€90m
Jan. 20 – Series C€104m
May 21 – Series C€80m
Sep. 20 – Series C€77m
Dec. 20 – Series B€72m
May 21 – Series B€84m
Jun. 20 – Series C€70m
Jun. 21 – Series C€63m
Jan. 20 – Series C€63m
Dec. 20 – Series B€50m
Apr. 21 – Series C€70m
May 21 – Series B€82m
Jan. 19 – Series C€72m
Apr. 19 – Series B€36m

VC/M&A Tech Multiples - France 2021© 2021 Avolta Partners // www.avoltapartners.com
530 active investors on the market in France, with increasing amount of foreigners
Active investor trends and league tables
15
VC trends
# of active investors (excl. business angels)
Top 10 active VCs (last 12 months)
70 deals
20 deals
13 deals
13 deals
12 deals
11 deals
11 deals
11 deals
10 deals
9 deals
1.
2.
3.
3.
5.
6.
6.
6.
9.
10.
-
50
100
150
200
250
300
350
2014 2015 2016 2017 2018 2019 2020 2021e
French active investors Foreign active investors

VC/M&A Tech Multiples - France 2021© 2021 Avolta Partners // www.avoltapartners.com
1.9x
3.0x
9.2x
12.4x
-
5.0
10.0
15.0
20.0
25.0
-
5.0
10.0
15.0
20.0
25.0
French investorsonly
At least one foreigninvestor
The French ecosystem is attracting more foreign investors
Participation of foreign VCs in French rounds
16
VC trends
% of series with a foreign investor
EV/TTM revenue multiples
6.3x
4.2x
0%
5%
10%
15%
20%
25%
30%
35%
40%
Q114
Q214
Q314
Q414
Q115
Q215
Q315
Q415
Q116
Q216
Q316
Q416
Q117
Q217
Q317
Q417
Q118
Q218
Q318
Q418
Q119
Q219
Q319
Q419
Q120
Q220
Q320
Q420
Q121
Q221
Q321
North America United Kingdom Germany Asia Foreign1st Quartile 3rd Quartile
Med.

VC/M&A Tech Multiples - France 2021© 2021 Avolta Partners // www.avoltapartners.com
Top 5 new VC funds raised in 2021Record year for new VC funds raised
Overview of French VC funds
17
VC trends
Funds raised by French VCs (€bn)
€1.6bnRaised in Jul. 2021
€300m Raised in Feb. 2021
€250m Raised in Sep. 2021
€225m Raised in Mar. 2021
€660m Raised in Feb. 2021
0.3 0.2
0.40.3
1.10.9
2.1
1.7
1.0
1.3
3.6
0
1
2
3
4
2011 2012 2013 2014 2015 2016 2017 2018 2019 2020 2021 YTD

VC/M&A Tech Multiples - France 2021© 2021 Avolta Partners // www.avoltapartners.com
0.9x
0.9x
1.5x
2.1x
2.7x
2.0x
4.5x
7.2x
7.8x
10.8x
- 2.0 4.0 6.0 8.0 10.0 12.0 14.0
- 2.0 4.0 6.0 8.0 10.0 12.0 14.0
VC multiples by business model and industry over the last 24 months
18
VC trendsEV/TTM revenue by business model EV/TTM revenue by industry
4.7x
Subscription
3.9x
Commission
2.6x
Manufacturing
2.2x
E-Commerce
1.5x
Service
Median Quartile 1 Quartile 3
Med.
7.9x
Fintech
6.4x
Health
4.8x
Enterprise software
3.6x
Marketing
2.6x
Food
2.1x
Transportation
3.1x
Real Estate
3.5x
HR
2.0x
1.6x
1.5x
1.7x
2.6x
2.3x
2.4x
5.3x
6.7x
10.9x
3.1x
6.8x
8.1x
6.3x
11.2x
12.2x
- 2.0 4.0 6.0 8.0 10.0 12.0 14.0
- 2.0 4.0 6.0 8.0 10.0 12.0 14.0

VC/M&A Tech Multiples - France 2021© 2021 Avolta Partners // www.avoltapartners.com
Tech exit trends

VC/M&A Tech Multiples - France 2021© 2021 Avolta Partners // www.avoltapartners.com
French exits trends remain stable over the last 5 years
Overview of French exits
20
Tech exit trends
Deal value (€bn) Deal count (#)
5.8
4.5
4.9
5.5
7.6
0
50
100
150
200
250
300
350
400
0
1
2
3
4
5
6
7
8
9
2017 2018 2019 2020 2021e

VC/M&A Tech Multiples - France 2021© 2021 Avolta Partners // www.avoltapartners.com
Top 5 tech exits in 2021 YTD
Tech exit activity: 234 deals in 2021 for €3.5bn in deal value
21
Tech exit trendsIncreasing exits trends mostly driven by top deals
Deal value (€m) Deal count (#)
€1.9bnIPO Euronext Paris
by Cegid
by Marlin Equity Partners
IPO Euronext Paris
€450m
€200m
€119m
€106m
by Altus Group
Median EV remains stable
Median EV (€m)
Top 1 Top 3 Others Nb. deals

VC/M&A Tech Multiples - France 2021© 2021 Avolta Partners // www.avoltapartners.com
3.2x
1.0x
1.4x
13.1x
4.0x
5.1x
- 5.0 10.0 15.0
- 5.0 10.0 15.0
Still few IPOs
Distribution of deals by deal type
22
Tech exit trends
Percentage of deals (%)
Larger exits for IPOs and sponsor deals
EV/TTM revenue by deal type
Median EV at exit (€m)
2.5x
Corporate Dev
2.4x
Sponsor
6.1x
IPO
Median 1st Q. 1 3rd Q.Med.
IPO Sponsor Corporate Dev
17
62 59
CorporateDevelopment
Sponsor IPO

VC/M&A Tech Multiples - France 2021© 2021 Avolta Partners // www.avoltapartners.com
Tech exit deal value is comparable to previous years…
Yearly trends: cumulative number of deals and amounts
23
Tech exit trends
Cumulated deal value (€m)
…but greater number of deals
Cumulated deal count (#)
2021 2020Year of Date in Press 20182019 2017
Jan. Feb. Mar. Apr. May Jun. Jul. Aug. Sept. Oct. Nov. Dec. Jan. Feb. Mar. Apr. May Jun. Jul. Aug. Sept. Oct. Nov. Dec.
0
50
100
150
200
250
300
350
1 2 3 4 5 6 7 8 9 10 11 120
1000
2000
3000
4000
5000
6000
7000
1 2 3 4 5 6 7 8 9 10 11 12

VC/M&A Tech Multiples - France 2021© 2021 Avolta Partners // www.avoltapartners.com
0%
10%
20%
30%
40%
50%
60%
70%
80%
90%
100%
0% 2% 4% 6% 7% 9% 11%
13%
14%
16%
18%
20%
22%
23%
25%
27%
29%
30%
32%
34%
36%
37%
39%
41%
43%
45%
46%
48%
50%
52%
53%
55%
57%
59%
60%
62%
64%
66%
67%
69%
71%
73%
75%
76%
78%
80%
82%
83%
85%
87%
89%
90%
92%
94%
96%
98%
99%
13% of deals are over €150m EV
Distribution of deals by EV
24
Tech exit trends
% of deal value
3
2
1
<€50m
<€50m-€150m
>€150m
63%
25%
13%
% of deals
Exit value % of panel Var. YoY
3
2
1 The Happy Few
The Breakaways
The Peloton -14%
+56%
+18%
0% 25% 50% 75% 100%

VC/M&A Tech Multiples - France 2021© 2021 Avolta Partners // www.avoltapartners.com
Rank Investor # exits
#1 21
#2 11
#3 10
#4 8
#5 7
#5 7
#5 7
#6 6
#7 5
#7 5
The majority of exits are bootstrapped companies…
VC-backed vs. non-backed exits
25
Tech exit trends
…however, VC-backed exits show higher performance, size and time to exit
Top 10 VCs by no. of exits (last 12 months)
Median EV/TTM Revenue Median EV Median time to exit
4.2x
1.8x
-
1.00
2.00
3.00
4.00
5.00
1 2
€48.1m
€23.8m
-
10.00
20.00
30.00
40.00
50.00
60.00
1 2
8 years
11 years
-
2.00
4.00
6.00
8.00
10.00
12.00
1 2VC backed Bootstrapped VC backed Bootstrapped VC backed Bootstrapped
VC-backedBootstrapped
0%
10%
20%
30%
40%
50%
60%
70%
80%
90%
100%
2017 2018 2019 2020 2021 YTD

VC/M&A Tech Multiples - France 2021© 2021 Avolta Partners // www.avoltapartners.com
Targets’ characteristics
Tech exits characteristics
26
Tech exit trendsExits are gaining maturity
TTM revenue at exit (€m)
Median EV has increased over the last 5 years
Median EV (€m)
10 yearsmedian years to exit
€3mmedian funds1 raised at
exit
1Sample is based on companies who have raised funds
59%of companies are
profitable
€3.0m
€5.3m €4.8m
€9.2m
0
1
2
3
4
5
6
7
8
9
10
2017 2018 2019 2020
€18m €25m €18m
€61m
€31m
0
20
40
60
80
100
2017 2018 2019 2020 2021 YTD

VC/M&A Tech Multiples - France 2021© 2021 Avolta Partners // www.avoltapartners.com
Around 70% of acquirers are French…
Distribution of acquirers by geography
27
Tech exit trends
Deal count
…but foreign countries acquire the most value
Deal value
France AsiaEurope North America
Top acquirers since 2017 (#) Top acquirers since 2017 (€m)
4
4
4
4
5
5
5
5
7
7
YTD YTD

VC/M&A Tech Multiples - France 2021© 2021 Avolta Partners // www.avoltapartners.com
Public tech companies show high performance
Avolta Partners’ Public French Tech Index1
28
Tech exit trends
Index value
1Index represents returns of an equally-weighted portfolio of all tech IPOs since Jan. 2017
0
20
40
60
80
100
120
140
160
180
Jan-17 Jul-17 Jan-18 Jul-18 Jan-19 Jul-19 Jan-20 Jul-20 Jan-21 Jul-21
IPO characteristics & breakdown
+55.0%
+30.4%
€55mmedian EV at IPO
34%of companies show positive
returns since IPO
Tech index CAC Small
14%
8%
6%
6%
3%2%
2%9%
HealthEnergyRoboticsTelecomTransportationGamingMarketingOther
+570.2% for the B.V.P. Nasdaq Emerging Cloud Index (U.S) over the same period

VC/M&A Tech Multiples - France 2021© 2021 Avolta Partners // www.avoltapartners.com
0.9x
1.1x
1.3x
1.7x
2.0x
2.7x
1.5x
4.8x
8.4x
10.5x
- 2.0 4.0 6.0 8.0 10.0 12.0 14.0
- 2.0 4.0 6.0 8.0 10.0 12.0 14.0 0.8x
2.7x
1.4x
1.6x
1.6x
2.1x
2.5x
2.9x
1.6x
5.2x
5.1x
5.7x
3.4x
13.4x
8.4x
15.0x
- 2.0 4.0 6.0 8.0 10.0 12.0 14.0
- 2.0 4.0 6.0 8.0 10.0 12.0 14.0
EV/TTM revenue by business model
Exit multiples by business model and industry
29
Tech exit trendsEV/TTM revenue by industry
Median 1st Quartile 3rd Quartile
Med.
3.2x
Subscription
3.8x
Commission
2.1x
Manufacturing
1.3x
E-Commerce
1.1x
Service
4.6x
Fintech
3.5x
Health
4.2x
Enterprise software
2.3x
Marketing
3.6x
Food
2.8x
Transportation
3.2x
Real Estate
1.5x
HR

VC/M&A Tech Multiples - France 2021© 2021 Avolta Partners // www.avoltapartners.com
Contact us
30
Research team
Arthur PorréFounding Partner
Pascal FarrugiaDirector
Alexandre MeiersSenior Analyst
Victor EbersoldSenior Analyst
Julien GakpeAnalyst
David KaddouchAnalyst
Jacques-Henri ChecriAnalyst
Matthieu SionAnalyst
Déborah BourgeotSenior Analyst
Naomi DarkoSenior Analyst
Pierre PinsaultAnalyst

VC/M&A Tech Multiples - France 2021© 2021 Avolta Partners // www.avoltapartners.com 31
Building a platform for Tech corporate finance
With 80 deals closed in 6 years, we chose from the beginning to be pan-Europeanand data-driven. So we built Avolta.io, a unique platform to automate processesand scale our ability to help fast-growing tech companies in Europe.
Our platform concatenates European deals in the Tech Industry with information onvaluation, revenues and structuration. We source this private data from our networkof providers, business partners and investors, combining it with unique insights fromour team of analysts.
We extracted from our 10,000+ deals private database all Tech companiesmonitored from Q1-14 to Q3-21 for companies headquartered in France.
Enterprise Value (EV)Calculated as Equity Value + Net Debt when legal information is found. Otherwiseestimated EV from several sources: dealroom.co, Mergermarket, Crunchbase,CFNews, Avolta’s private networks and public media.
Exit types
• Corporate dev: the acquirer is a corporate• PE fund: the acquirer is a private equity fund (non-leveraged, LBO,
MBO, OBO)• IPO: Initial Public Offering though financial markets
Business Models
• Subscription: SaaS or more traditional licensing revenue• Commission: platform debiting a defined take rate from its flows• Manufacturing: production and resale of goods• Performance: built around usage from a recurring user community• eCommerce: buy and online resale of goods• Audience: traffic-based revenue• Service: margin between labor cost and service invoice price• Research: strong R&D focus to keep high barriers to entry
Data. Data. Data.Methodology
Leveraging quality data providers

VC/M&A Tech Multiples - France 2021© 2021 Avolta Partners // www.avoltapartners.com 32
§ 80 deals / €1bn completed in 6 years- Incl. 15 deals / €300m in the last 12 months- 20 deals for €600m in our current portfolio
(€30m avg. transaction)
§ All types of transactions (€10-€300m EV)- M&A & LBO: 50% of our deals- Fundraising (Series A/B/C+) : 50% of our deals
§ 70% cross-border deals
§ 100% Tech companies, with major focus on:- Fintech / Insurtech- Mobility- B2B SaaS- Marketplace/eCommerce- Deeptech (AI, Blockchain, Space, etc.)- FoodTech/Agtech- Consumer brand- HR/EdTech- Health- Proptech
Leading M&A Advisor in Tech in Europe on €10-300m DealsAbout Avolta Partners

VC/M&A Tech Multiples - France 2021© 2021 Avolta Partners // www.avoltapartners.com
Alexandre MeiersSenior [email protected]
Disclaimer
The information contained in this report has been produced by Avolta Partners based on third-party information. While Avolta Partners has made every effort to ensure the reliability of thedata included in this report, Avolta Partners cannot guarantee the accuracy of the informationcollected and presented. Therefore, the Avolta Partners cannot accept responsibility for anydecision made or action taken based upon this report or the information provided herein.This presentation is for the exclusive use of the people to whom it is addressed and isintended for general information purposes only. It is not intended to constitute legal or otherprofessional advice and should not be treated as such.Appropriate legal advice must be sought before making any decision, taking any action orrefraining from taking any action in reliance on the information contained in this presentation.Avolta Partners does not assume any responsibility for any person’s reliance upon theinformation contained herein.
© Copyright Avolta Partners 2021
Avolta Partners
With more than 80 deals closed in 6 years, Avolta Partners has proven to be one of the most active M&Aboutique in Europe in the Tech Industry. As a result, our team of 20 people has learned how to maximise thevalue of a deal – both valuation and legal conditions – thanks to a proven methodology and hard-nosednegotiations.
Dedicated team
Arthur PorréManaging [email protected]
Pascal [email protected]
Victor EbersoldSenior [email protected]


![[vc 1037 - listing.archiviolocation.com · [vc 1037] ARCHIVIOLOCATION.COM [vc 1037] ARCHIVIOLOCATION.COM [vc 1037] ARCHIVIOLOCATION.COM [vc 1037] ARCHIVIOLOCATION.COM. archivio location](https://img.pdfslide.us/doc/110x75/5fcd99d1df347e1ae154645c/vc-1037-vc-1037-archiviolocationcom-vc-1037-archiviolocationcom-vc-1037.jpg)