Embed Size (px)
Citation preview
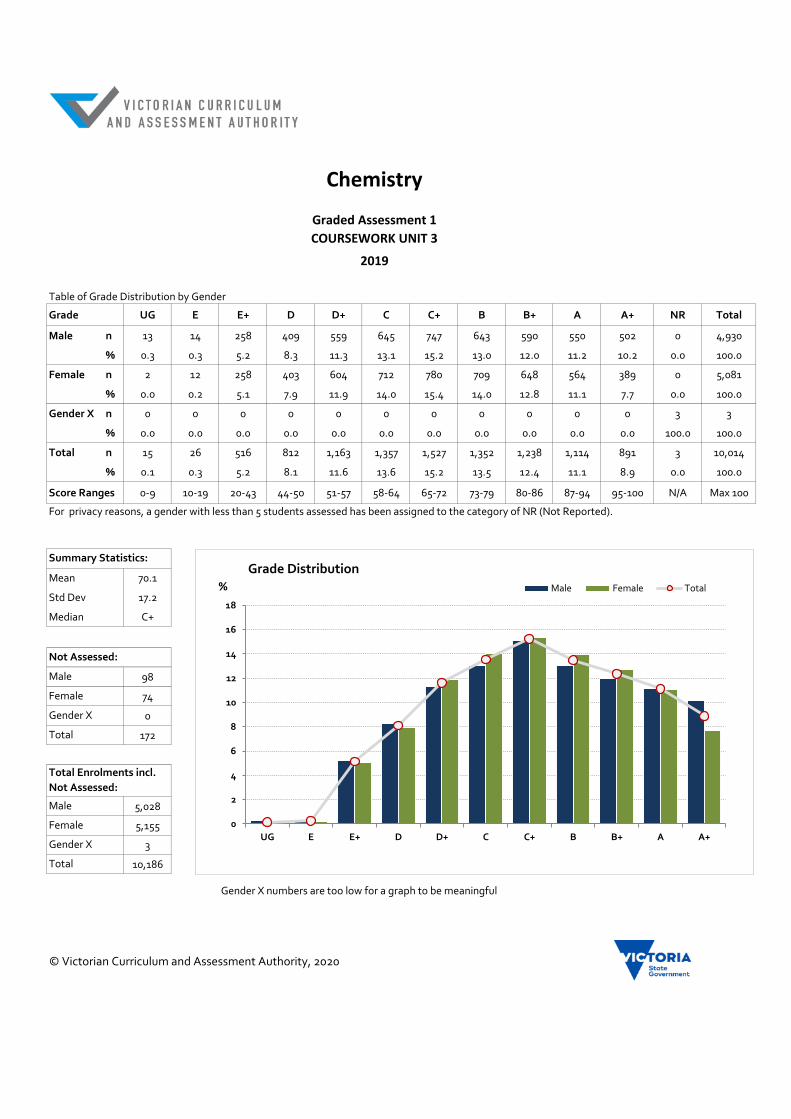
Table of Grade Distribution by Gender
Grade UG E E+ D D+ C C+ B B+ A A+ NR Total
Male n 13 14 258 409 559 645 747 643 590 550 502 0 4,930
% 0.3 0.3 5.2 8.3 11.3 13.1 15.2 13.0 12.0 11.2 10.2 0.0 100.0
Female n 2 12 258 403 604 712 780 709 648 564 389 0 5,081
% 0.0 0.2 5.1 7.9 11.9 14.0 15.4 14.0 12.8 11.1 7.7 0.0 100.0
Gender X n 0 0 0 0 0 0 0 0 0 0 0 3 3
% 0.0 0.0 0.0 0.0 0.0 0.0 0.0 0.0 0.0 0.0 0.0 100.0 100.0
Total n 15 26 516 812 1,163 1,357 1,527 1,352 1,238 1,114 891 3 10,014
% 0.1 0.3 5.2 8.1 11.6 13.6 15.2 13.5 12.4 11.1 8.9 0.0 100.0
Score Ranges 0-9 10-19 20-43 44-50 51-57 58-64 65-72 73-79 80-86 87-94 95-100 N/A Max 100
Mean 70.1
Std Dev 17.2
Median C+
98
74
0
172
5,028
5,155
3
10,186
Gender X
Total
Gender X numbers are too low for a graph to be meaningful
© Victorian Curriculum and Assessment Authority, 2020
Male
Female
Gender X
Total
Total Enrolments incl.
Not Assessed:
Male
Female
Chemistry
Graded Assessment 1
COURSEWORK UNIT 3
2019
Not Assessed:
Summary Statistics:
For privacy reasons, a gender with less than 5 students assessed has been assigned to the category of NR (Not Reported).
No graph is supplied for this GA as student numbers are too small for a graph to be meaningfull.
0
2
4
6
8
10
12
14
16
18
UG E E+ D D+ C C+ B B+ A A+
%
Grade Distribution
Male Female Total
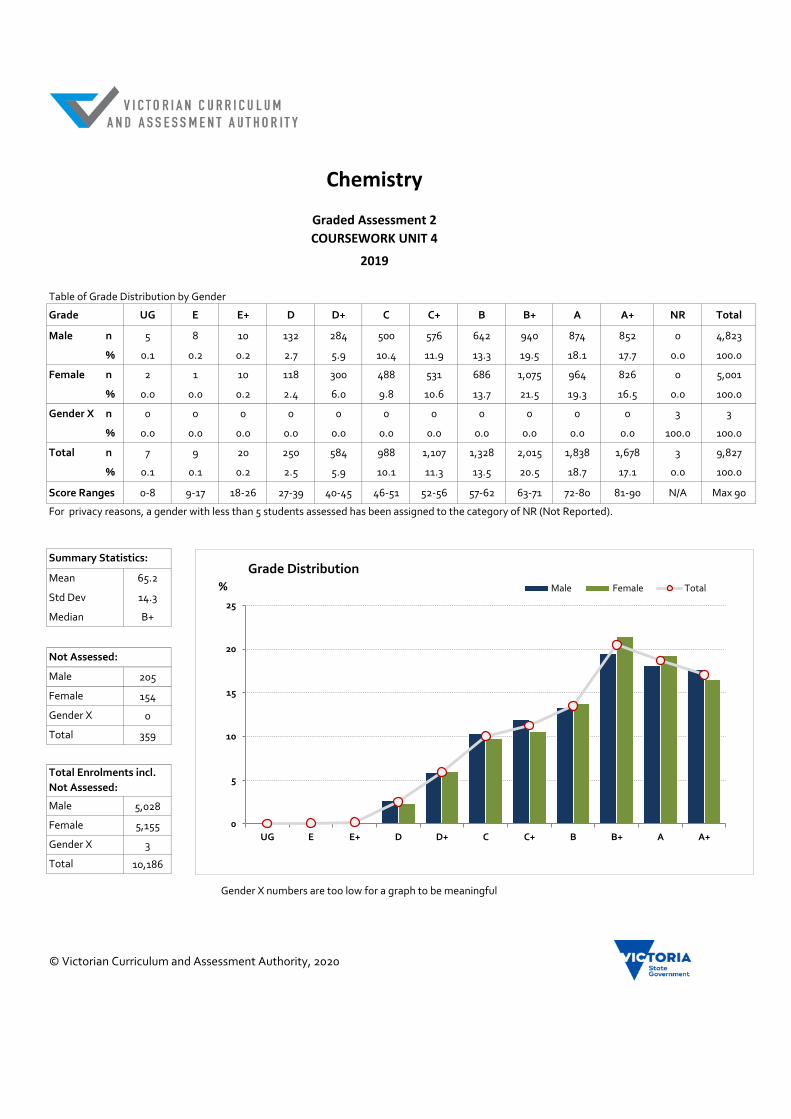
Table of Grade Distribution by Gender
Grade UG E E+ D D+ C C+ B B+ A A+ NR Total
Male n 5 8 10 132 284 500 576 642 940 874 852 0 4,823
% 0.1 0.2 0.2 2.7 5.9 10.4 11.9 13.3 19.5 18.1 17.7 0.0 100.0
Female n 2 1 10 118 300 488 531 686 1,075 964 826 0 5,001
% 0.0 0.0 0.2 2.4 6.0 9.8 10.6 13.7 21.5 19.3 16.5 0.0 100.0
Gender X n 0 0 0 0 0 0 0 0 0 0 0 3 3
% 0.0 0.0 0.0 0.0 0.0 0.0 0.0 0.0 0.0 0.0 0.0 100.0 100.0
Total n 7 9 20 250 584 988 1,107 1,328 2,015 1,838 1,678 3 9,827
% 0.1 0.1 0.2 2.5 5.9 10.1 11.3 13.5 20.5 18.7 17.1 0.0 100.0
Score Ranges 0-8 9-17 18-26 27-39 40-45 46-51 52-56 57-62 63-71 72-80 81-90 N/A Max 90
Mean 65.2
Std Dev 14.3
Median B+
205
154
0
359
5,028
5,155
3
10,186
Gender X
Total
Gender X numbers are too low for a graph to be meaningful
© Victorian Curriculum and Assessment Authority, 2020
Male
Female
Gender X
Total
Total Enrolments incl.
Not Assessed:
Male
Female
Chemistry
Graded Assessment 2
COURSEWORK UNIT 4
2019
Not Assessed:
Summary Statistics:
For privacy reasons, a gender with less than 5 students assessed has been assigned to the category of NR (Not Reported).
No graph is supplied for this GA as student numbers are too small for a graph to be meaningfull.
0
5
10
15
20
25
UG E E+ D D+ C C+ B B+ A A+
%
Grade Distribution
Male Female Total
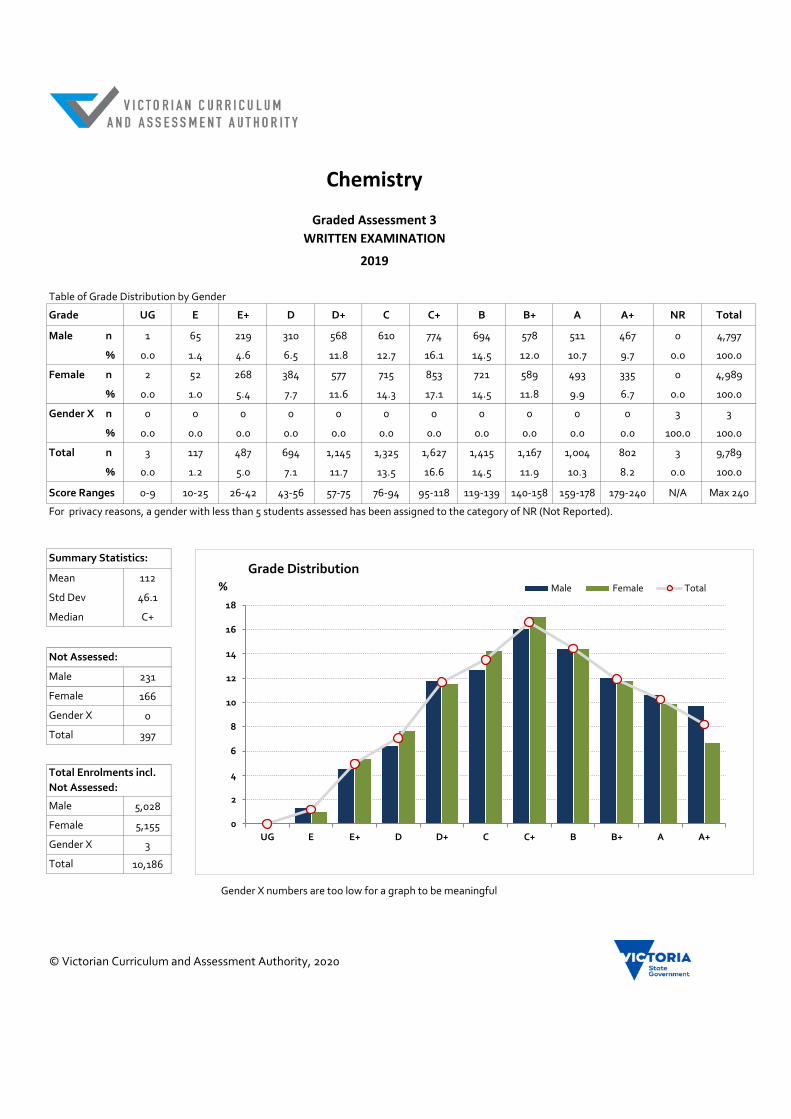
Table of Grade Distribution by Gender
Grade UG E E+ D D+ C C+ B B+ A A+ NR Total
Male n 1 65 219 310 568 610 774 694 578 511 467 0 4,797
% 0.0 1.4 4.6 6.5 11.8 12.7 16.1 14.5 12.0 10.7 9.7 0.0 100.0
Female n 2 52 268 384 577 715 853 721 589 493 335 0 4,989
% 0.0 1.0 5.4 7.7 11.6 14.3 17.1 14.5 11.8 9.9 6.7 0.0 100.0
Gender X n 0 0 0 0 0 0 0 0 0 0 0 3 3
% 0.0 0.0 0.0 0.0 0.0 0.0 0.0 0.0 0.0 0.0 0.0 100.0 100.0
Total n 3 117 487 694 1,145 1,325 1,627 1,415 1,167 1,004 802 3 9,789
% 0.0 1.2 5.0 7.1 11.7 13.5 16.6 14.5 11.9 10.3 8.2 0.0 100.0
Score Ranges 0-9 10-25 26-42 43-56 57-75 76-94 95-118 119-139 140-158 159-178 179-240 N/A Max 240
Mean 112
Std Dev 46.1
Median C+
231
166
0
397
5,028
5,155
3
10,186
Gender X
Total
Gender X numbers are too low for a graph to be meaningful
© Victorian Curriculum and Assessment Authority, 2020
Male
Female
Gender X
Total
Total Enrolments incl.
Not Assessed:
Male
Female
Chemistry
Graded Assessment 3
WRITTEN EXAMINATION
2019
Not Assessed:
Summary Statistics:
For privacy reasons, a gender with less than 5 students assessed has been assigned to the category of NR (Not Reported).
No graph is supplied for this GA as student numbers are too small for a graph to be meaningfull.
0
2
4
6
8
10
12
14
16
18
UG E E+ D D+ C C+ B B+ A A+
%
Grade Distribution
Male Female Total