Embed Size (px)
Citation preview
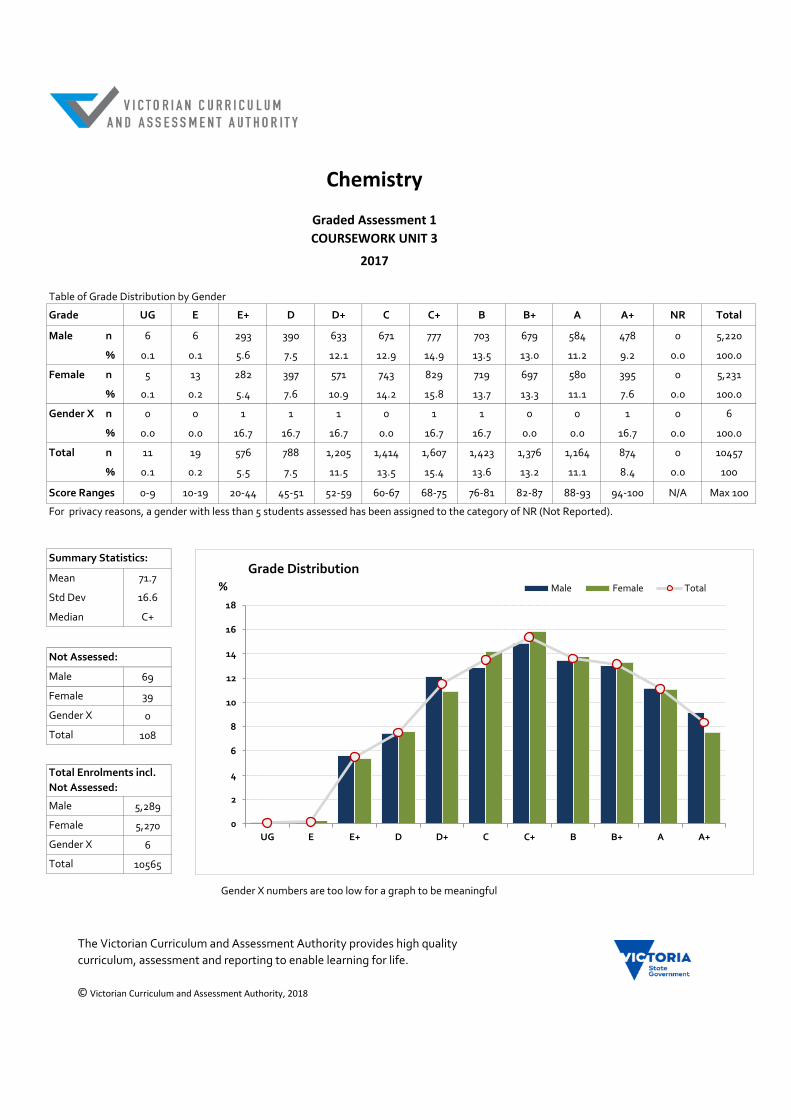
Table of Grade Distribution by Gender
Grade UG E E+ D D+ C C+ B B+ A A+ NR Total
Male n 6 6 293 390 633 671 777 703 679 584 478 0 5,220
% 0.1 0.1 5.6 7.5 12.1 12.9 14.9 13.5 13.0 11.2 9.2 0.0 100.0
Female n 5 13 282 397 571 743 829 719 697 580 395 0 5,231
% 0.1 0.2 5.4 7.6 10.9 14.2 15.8 13.7 13.3 11.1 7.6 0.0 100.0
Gender X n 0 0 1 1 1 0 1 1 0 0 1 0 6
% 0.0 0.0 16.7 16.7 16.7 0.0 16.7 16.7 0.0 0.0 16.7 0.0 100.0
Total n 11 19 576 788 1,205 1,414 1,607 1,423 1,376 1,164 874 0 10457
% 0.1 0.2 5.5 7.5 11.5 13.5 15.4 13.6 13.2 11.1 8.4 0.0 100
Score Ranges 0-9 10-19 20-44 45-51 52-59 60-67 68-75 76-81 82-87 88-93 94-100 N/A Max 100
Mean 71.7
Std Dev 16.6
Median C+
69
39
0
108
5,289
5,270
6
10565
Gender X
Total
Gender X numbers are too low for a graph to be meaningful
Chemistry
Graded Assessment 1
COURSEWORK UNIT 3
2017
Not Assessed:
Summary Statistics:
Male
Female
Gender X
Total
For privacy reasons, a gender with less than 5 students assessed has been assigned to the category of NR (Not Reported).
Total Enrolments incl.
Not Assessed:
Male
Female
No graph is supplied for this GA as student numbers are too small for a graph to be meaningfull.
0
2
4
6
8
10
12
14
16
18
UG E E+ D D+ C C+ B B+ A A+
%
Grade Distribution
Male Female Total
The Victorian Curriculum and Assessment Authority provides high quality
curriculum, assessment and reporting to enable learning for life.
© Victorian Curriculum and Assessment Authority, 2018
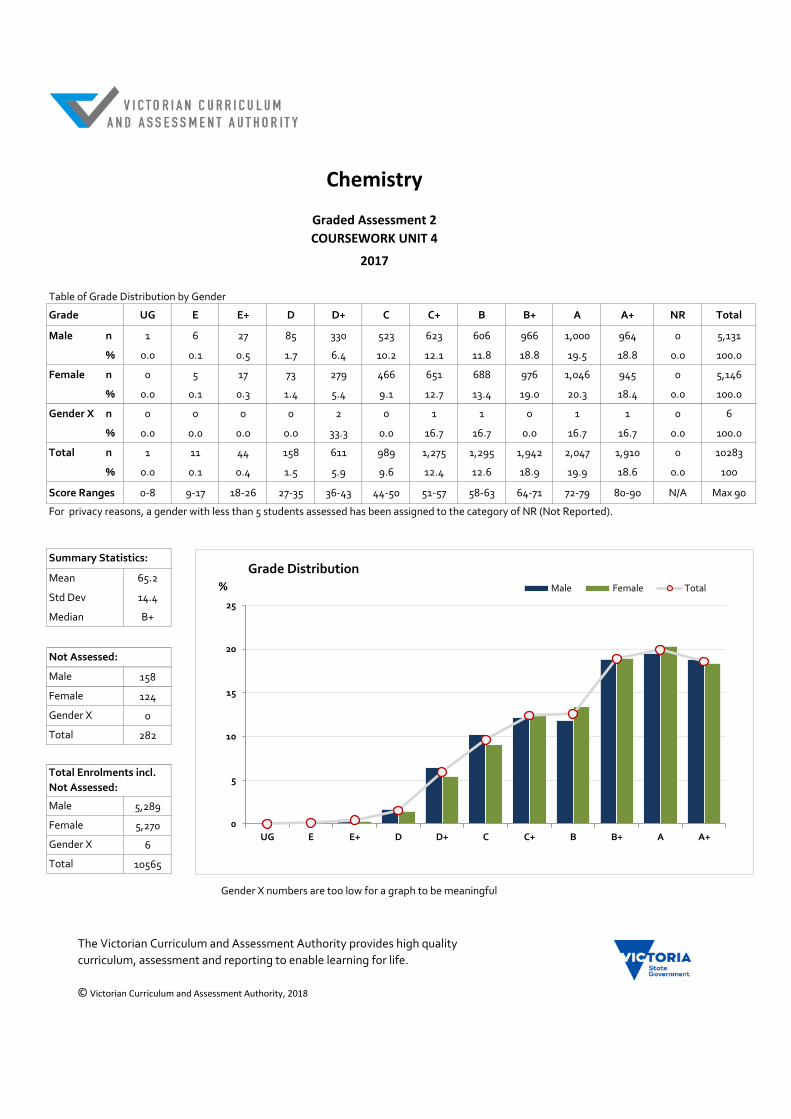
Table of Grade Distribution by Gender
Grade UG E E+ D D+ C C+ B B+ A A+ NR Total
Male n 1 6 27 85 330 523 623 606 966 1,000 964 0 5,131
% 0.0 0.1 0.5 1.7 6.4 10.2 12.1 11.8 18.8 19.5 18.8 0.0 100.0
Female n 0 5 17 73 279 466 651 688 976 1,046 945 0 5,146
% 0.0 0.1 0.3 1.4 5.4 9.1 12.7 13.4 19.0 20.3 18.4 0.0 100.0
Gender X n 0 0 0 0 2 0 1 1 0 1 1 0 6
% 0.0 0.0 0.0 0.0 33.3 0.0 16.7 16.7 0.0 16.7 16.7 0.0 100.0
Total n 1 11 44 158 611 989 1,275 1,295 1,942 2,047 1,910 0 10283
% 0.0 0.1 0.4 1.5 5.9 9.6 12.4 12.6 18.9 19.9 18.6 0.0 100
Score Ranges 0-8 9-17 18-26 27-35 36-43 44-50 51-57 58-63 64-71 72-79 80-90 N/A Max 90
Mean 65.2
Std Dev 14.4
Median B+
158
124
0
282
5,289
5,270
6
10565
Gender X
Total
Gender X numbers are too low for a graph to be meaningful
Chemistry
Graded Assessment 2
COURSEWORK UNIT 4
2017
Not Assessed:
Summary Statistics:
Male
Female
Gender X
Total
For privacy reasons, a gender with less than 5 students assessed has been assigned to the category of NR (Not Reported).
Total Enrolments incl.
Not Assessed:
Male
Female
No graph is supplied for this GA as student numbers are too small for a graph to be meaningfull.
0
5
10
15
20
25
UG E E+ D D+ C C+ B B+ A A+
%
Grade Distribution
Male Female Total
The Victorian Curriculum and Assessment Authority provides high quality
curriculum, assessment and reporting to enable learning for life.
© Victorian Curriculum and Assessment Authority, 2018

Table of Grade Distribution by Gender
Grade UG E E+ D D+ C C+ B B+ A A+ NR Total
Male n 23 74 223 349 547 689 788 706 641 573 482 0 5,095
% 0.5 1.5 4.4 6.8 10.7 13.5 15.5 13.9 12.6 11.2 9.5 0.0 100.0
Female n 26 88 255 395 543 668 842 736 615 531 418 0 5,117
% 0.5 1.7 5.0 7.7 10.6 13.1 16.5 14.4 12.0 10.4 8.2 0.0 100.0
Gender X n 0 0 1 1 1 0 1 1 0 0 1 0 6
% 0.0 0.0 16.7 16.7 16.7 0.0 16.7 16.7 0.0 0.0 16.7 0.0 100.0
Total n 49 162 479 745 1,091 1,357 1,631 1,443 1,256 1,104 901 0 10218
% 0.5 1.6 4.7 7.3 10.7 13.3 16.0 14.1 12.3 10.8 8.8 0.0 100
Score Ranges 0-21 22-31 32-48 49-66 67-87 88-111 112-136 137-155 156-172 173-189 190-240 N/A Max 240
Mean 126
Std Dev 48.1
Median C+
194
153
0
347
5,289
5,270
6
10565
Gender X
Total
Gender X numbers are too low for a graph to be meaningful
Chemistry
Graded Assessment 3
WRITTEN EXAMINATION
2017
Not Assessed:
Summary Statistics:
Male
Female
Gender X
Total
For privacy reasons, a gender with less than 5 students assessed has been assigned to the category of NR (Not Reported).
Total Enrolments incl.
Not Assessed:
Male
Female
No graph is supplied for this GA as student numbers are too small for a graph to be meaningfull.
0
2
4
6
8
10
12
14
16
18
UG E E+ D D+ C C+ B B+ A A+
%
Grade Distribution
Male Female Total
The Victorian Curriculum and Assessment Authority provides high quality
curriculum, assessment and reporting to enable learning for life.
© Victorian Curriculum and Assessment Authority, 2018