Embed Size (px)
DESCRIPTION
Part of the VCAL Youth Eco-Challenge curriculum resource.
Citation preview
Page 1 of 5
Developed by
Unit 3: Energy Production and Use
Bead game
activity guide & worksheet
This project was funded by the Department of Sustainability and Environment.
This work is licensed under Creative Commons Attribution 2.5 Australia licence. A copy of this licence is available at http://creativecommons.org/licenses/by‐nc/2.5/au/ or by writing to [email protected]. However logos are protected by copyright.
Page 2 of 5
Unit 3: Energy Production and Use
Bead game activity guide and worksheet Estimated duration: 30 minutes
Aim • To introduce students to the different sources of electricity production • To make the distinction between renewable and non‐renewable energy
sources.
Outcome By the end of this session, students will be able to:
• Understand the relative contributions of renewable and non‐renewable energy sources in electricity production.
• Describe the availability of different fuel sources over different periods of time.
Resources • Stopwatch • Student worksheet (included below) • About 1/4 cup of corn seeds, to represent solar energy (Group 1)
• Large coloured beads in the following proportions:
81% brown (about 250 beads) to represent coal (Group 2)
16% red (about 50 beads) to represent uranium (Group 3)
2% white (about 7 beads) to represent natural gas (Group 4)
1% black (about 4 beads) to represent oil (Group 5) These proportions approximately represent the non‐renewable energy reserves in Australia.
Activity Description 1. Hide all the beads in the classroom before the lesson commences. 2. Divide the class into five equal groups to represents a company searching for a particular resource and then assign them their colour (see above).
Page 3 of 5
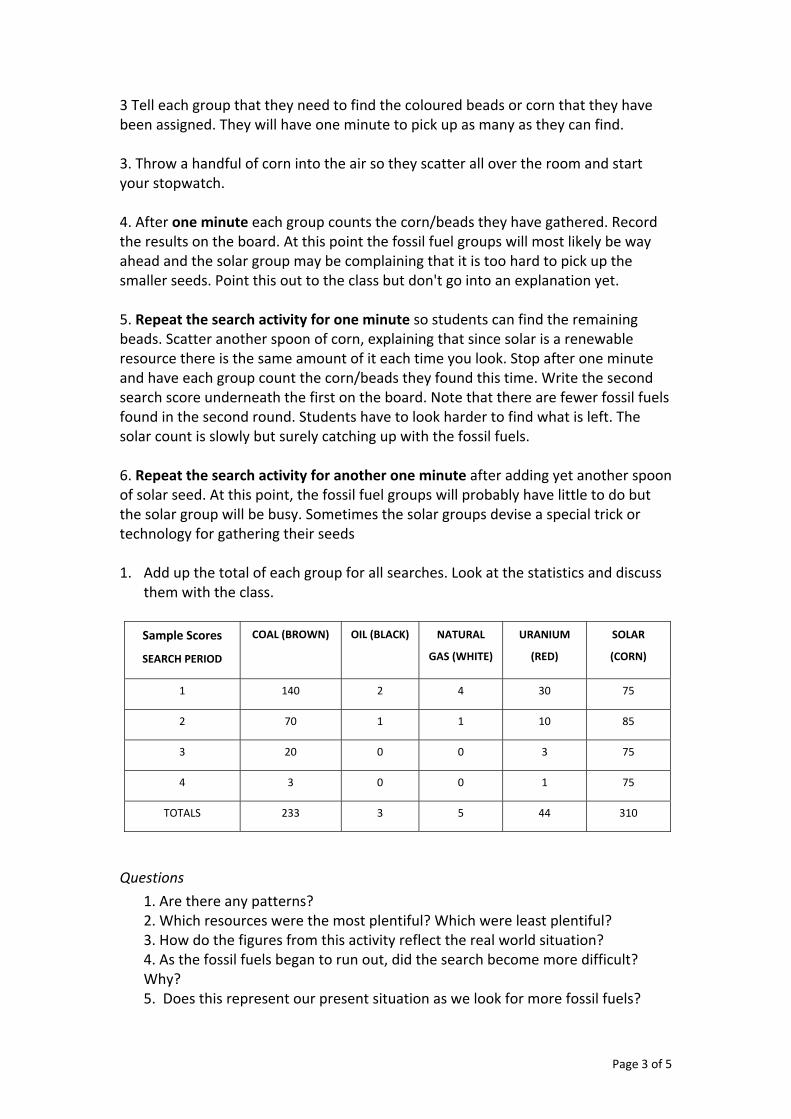
3 Tell each group that they need to find the coloured beads or corn that they have been assigned. They will have one minute to pick up as many as they can find. 3. Throw a handful of corn into the air so they scatter all over the room and start your stopwatch. 4. After one minute each group counts the corn/beads they have gathered. Record the results on the board. At this point the fossil fuel groups will most likely be way ahead and the solar group may be complaining that it is too hard to pick up the smaller seeds. Point this out to the class but don't go into an explanation yet. 5. Repeat the search activity for one minute so students can find the remaining beads. Scatter another spoon of corn, explaining that since solar is a renewable resource there is the same amount of it each time you look. Stop after one minute and have each group count the corn/beads they found this time. Write the second search score underneath the first on the board. Note that there are fewer fossil fuels found in the second round. Students have to look harder to find what is left. The solar count is slowly but surely catching up with the fossil fuels. 6. Repeat the search activity for another one minute after adding yet another spoon of solar seed. At this point, the fossil fuel groups will probably have little to do but the solar group will be busy. Sometimes the solar groups devise a special trick or technology for gathering their seeds 1. Add up the total of each group for all searches. Look at the statistics and discuss
them with the class.
Sample Scores
SEARCH PERIOD
COAL (BROWN) OIL (BLACK) NATURAL
GAS (WHITE)
URANIUM
(RED)
SOLAR
(CORN)
1 140 2 4 30 75
2 70 1 1 10 85
3 20 0 0 3 75
4 3 0 0 1 75
TOTALS 233 3 5 44 310
Questions
1. Are there any patterns? 2. Which resources were the most plentiful? Which were least plentiful? 3. How do the figures from this activity reflect the real world situation? 4. As the fossil fuels began to run out, did the search become more difficult? Why? 5. Does this represent our present situation as we look for more fossil fuels?
Page 4 of 5
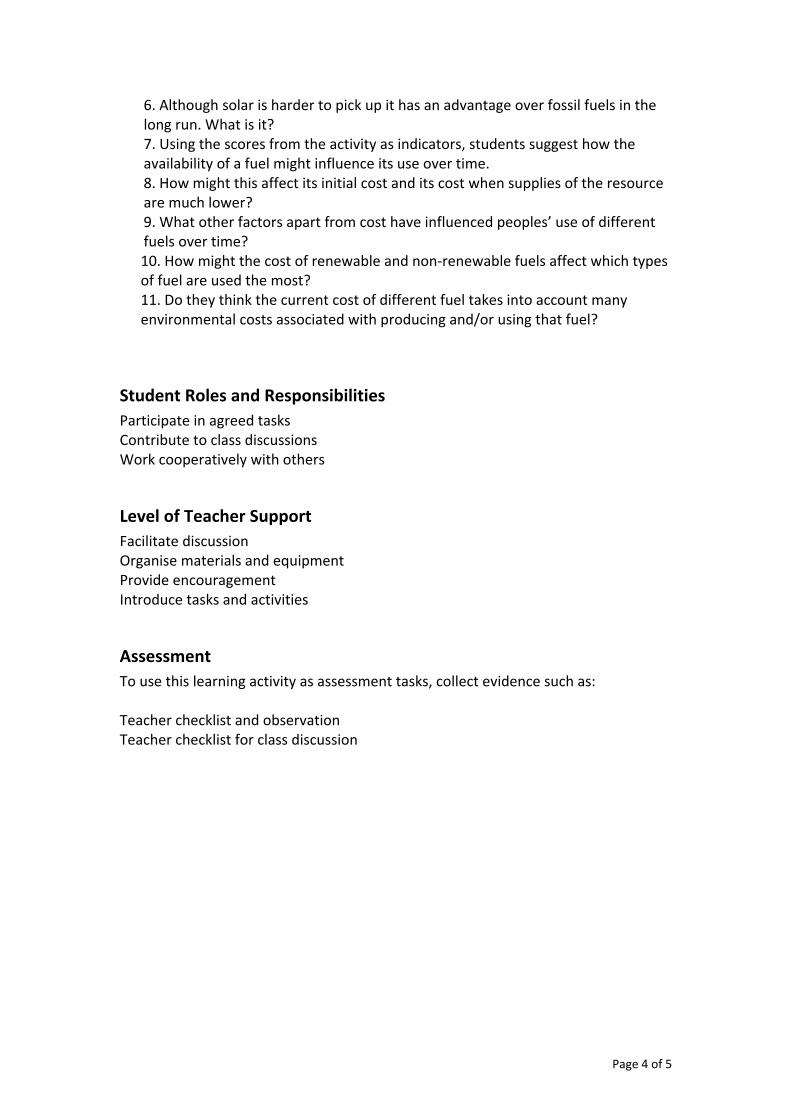
6. Although solar is harder to pick up it has an advantage over fossil fuels in the long run. What is it? 7. Using the scores from the activity as indicators, students suggest how the availability of a fuel might influence its use over time. 8. How might this affect its initial cost and its cost when supplies of the resource are much lower? 9. What other factors apart from cost have influenced peoples’ use of different fuels over time? 10. How might the cost of renewable and non‐renewable fuels affect which types of fuel are used the most? 11. Do they think the current cost of different fuel takes into account many environmental costs associated with producing and/or using that fuel?
Student Roles and Responsibilities Participate in agreed tasks Contribute to class discussions Work cooperatively with others
Level of Teacher Support Facilitate discussion Organise materials and equipment Provide encouragement Introduce tasks and activities
Assessment To use this learning activity as assessment tasks, collect evidence such as: Teacher checklist and observation Teacher checklist for class discussion
Page 5 of 5
Unit 3: Energy Production and Use
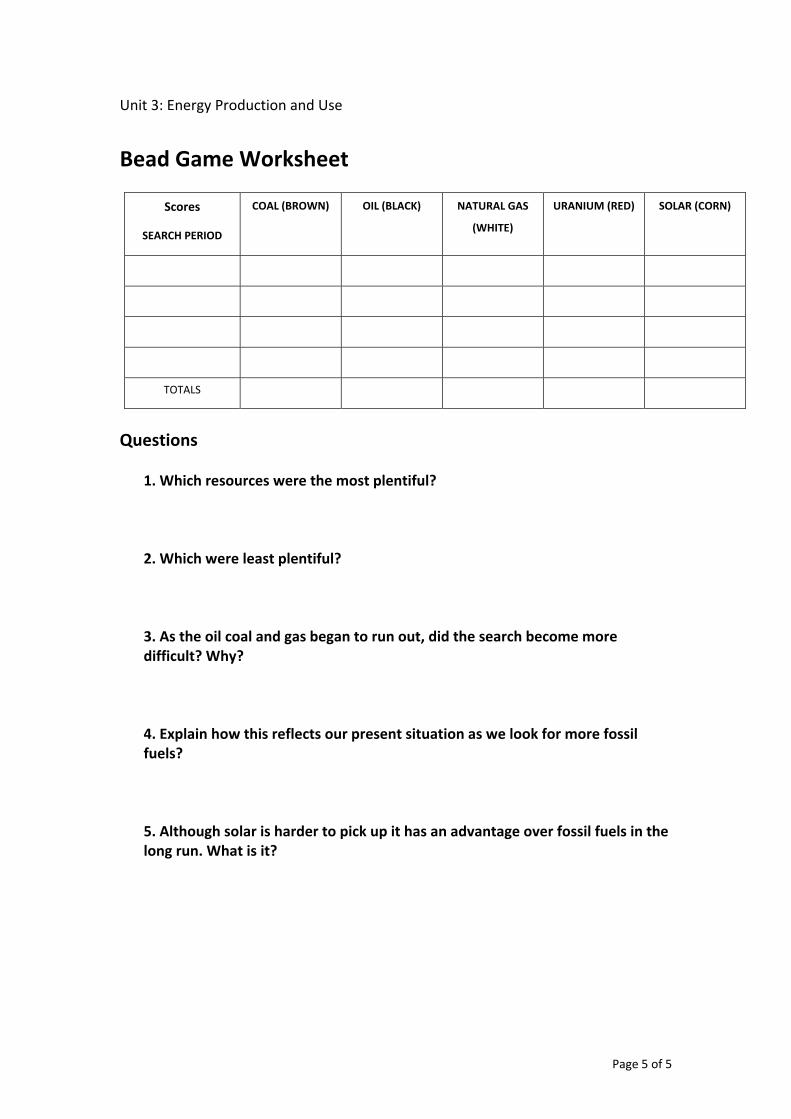
Bead Game Worksheet
Scores
SEARCH PERIOD
COAL (BROWN) OIL (BLACK) NATURAL GAS
(WHITE)
URANIUM (RED) SOLAR (CORN)
TOTALS
Questions
1. Which resources were the most plentiful? 2. Which were least plentiful? 3. As the oil coal and gas began to run out, did the search become more difficult? Why? 4. Explain how this reflects our present situation as we look for more fossil fuels? 5. Although solar is harder to pick up it has an advantage over fossil fuels in the long run. What is it?