Embed Size (px)
Citation preview

Value‐Based Payment Financial Modeling August 9, 2017
1
C - S u i t e T r a n s f o r m a t i o n M a n a g e m e n t T r a i n i n g :
V B P F i n a n c i a l M o d e l i n g
P r e s e n t e d b y : P e t e r R . E p p , C P A
A u g u s t 9 , 2 0 1 7
O v e r v i e w
Overview of TennCare’s PCMH Initiative
Rehash Key Drivers of Success in VBP Agreements
Walkthrough of VBP Financial Model
2

Value‐Based Payment Financial Modeling August 9, 2017
2
A l l P a y o r s A r e M o v i n g To w a r d s a n E v o l v i n g D e f i n i t i o n o f “ V a l u e ”
3
Value =
Health Outcomes+
Total Healthcare Spend+
Access
V B P A r r a n g e m e n t s – “ T h e 3 -L e g g e d S t o o l ”
VBP arrangements contain a hybrid of several different payment methodologies to incentivize and tie together desired behaviors
The key components of VBP arrangements include:
Base Compensation Models• Fee-for-service
• Partial capitation
Care Coordination Fee PMPM
Quality Incentive Payments
Global Payments/Budgets• Surplus-sharing/Risk-sharing
• Global capitation
4
Care Coordination
Qua
lity
Ince
ntiv
e Pa
ymen
ts
Quality Modifiers!

Value‐Based Payment Financial Modeling August 9, 2017
3
Te n n C a r e ’ s P a t i e n t C e n t e r e d M e d i c a l H o m e I n i t i a t i v e
Requirements for participation in TennCare’s PCMH initiative include:‒ At least 500 members with one MCO‒ Maintain Level 2 or 3 NCQA PCMH accreditation or meet
TennCare’s specific activity requirements as work towards NCQA’s 2017 accreditation
‒ Commit to the goals of VBP• Increased care coordination• Proactive management the patient panel• Focus on quality and outcomes• Integrated care across multidisciplinary provider teams
‒ Use the State’s Care Coordination Tool‒ Participate for 2 years in TennCare’s practice transformation
support program‒ Participate in learning collaboratives and share best practices
5
Te n n C a r e ’ s P C M H R e c o m m e n d e d A c t i v i t y R e q u i r e m e n t s
6
Activity Description Patient-
centered appointment access
The practice has a written process and defined standards forproviding access to appointments, and regularly assesses its performance on the required factors Provide same-day appointments for routine and urgent care Provide routine and urgent care appointments outside regular
business hours 24/7 Access to
Clinical Advice The practice has a written process and defined standards for
providing access to clinical advice and continuity of medical record information at all times, and regularly assesses its performance on: Providing timely advice by telephone
The practiceteam
The practice uses a team to provide a range of patient careservices by holding scheduled patient care team meetings or astructured communication process focused on individual patient care.
Use data for population management
At least annually the practice proactively identifies populations ofpatients and reminds them, or their families / caregivers, of neededcare based on patient information,clinical data, health assessments and evidence-basedguidelines including: At least three different chronic or acute care services Members not recently seen by the practice
Value‐Based Payment Financial Modeling August 9, 2017
4
Te n n C a r e ’ s P C M H R e c o m m e n d e d A c t i v i t y R e q u i r e m e n t s
7
Activity Description Implement
evidence-based decision support
The practice implements clinical decision support (e.g., point- of-care reminders)following evidence-based guidelines for: A mental health or substance use disorder A chronic medical condition An acute condition A condition related to unhealthy behaviors
Identifypatients for care management
Considers the following in establishing a systematic processand criteria for identifying patients who may benefit from care management (practicemust include at least three in its criteria): Behavioral health conditions. High cost/high utilization. Poorly controlled or complex conditions. Social determinants of health. Referrals by outside organizations (e.g., insurers, health system, ACO), practice
staff or patient/family/caregiver. Care planning
and self-care support The care team and member / family / caregiver collaborate
(at relevant visits) to develop and update an individual care plan that includes thefollowing features for 75% of all members prioritized for care management [i.e., top10% of members across various factors]: Incorporates member preferences and functional / lifestyle goals Identifies treatment goals Assesses and addresses potential barriers to meeting goals Includes a self-management plan Is provided in writing to the member / family / caregiver
Referraltracking and follow-up
The practice will do the following: Track referrals until the consultant or specialist’s report is available, flagging and
following up on overdue reports
Te n n C a r e ’ s P C M H P a y m e n t M o d e l
Base Compensation - Current fee-for-service payment for delivery of services remains
Practice Support Payments - monthly payment, per member per month (PMPM), based on PCP assignment by MCO
‒ “Practice Transformation Payment” - $1 PMPM for first year only
‒ “Activity Payment” – risk-adjusted $ PMPM for duration of program ($4 PMPM average)
Outcome Payments -‒ Total Cost of Care (TCOC) for PCMH practices with greater than 5,000
members
‒ Efficiency Metric Improvement for practices with fewer than 5,000 members (ability to pool providers in 2018)
‒ To receive either type of outcome payment, must earn a minimum # of quality stars and show improved efficiency (“Quality Gate”)
8

Value‐Based Payment Financial Modeling August 9, 2017
5
Te n n C a r e ’ s P C M H P a y m e n t M o d e l – P r a c t i c e S u p p o r t
Practice Support Payments – 2 components:– Practice transformation payment
• $1 PMPM for first year of participation
• Not risk-adjusted
– Activity payment• Risk-adjusted paid throughout the duration of the program (average
$4 PMPM)
• Support labor and time required to improve and support care delivery models
• Based on the average risk score of members at the MCO, set at the beginning of each year
The higher the risk score, the higher the PMPM activity payment
• Starting in CY2019, a portion of the activity payment amount is placed at risk based on the PCMH’s performance on the quality and efficiency stars for the prior year
9
Te n n C a r e ’ s P C M H P a y m e n t M o d e l – O u t c o m e s
Outcome Payments – Total Cost of Care (TCOC):– For high volume panel PCMH practices (or pooled shared
savings entities) with 5,000 or more members
– Shared savings on TCOC generated based on the actual risk-adjusted TCOC relative to the benchmark TCOC
– In addition to generating savings, the practice must earn a minimum number of quality stars: • 2 (out of possible 5) for pediatric and adult practices
• 4 (out of possible 10) for family practices
– Calculation of outcome payment:
10

Value‐Based Payment Financial Modeling August 9, 2017
6
Te n n C a r e ’ s P C M H P a y m e n t M o d e l – O u t c o m e s
Outcome Payments – Total Cost of Care (TCOC):– Risk-adjusted TCOC savings amount - difference between the
actual adjusted TCOC and the benchmark adjusted TCOC for each PCMH in a given performance year
– Reported on a PMPM basis for each MCO
– Benchmark TCOC –• Based on 3-years of historical claims experience (e.g. 2013 – 2015
used as baseline for 2017 performance period)
• Risk-adjusted
• Stop-loss thresholds applied to remove outliers
• Trended forwarded for inflation
11
Te n n C a r e ’ s P C M H P a y m e n t M o d e l - O u t c o m e s
Outcome Payments – Total Cost of Care (TCOC):– PCMH practices can earn from 0 – 100% of eligible savings
based on quality and efficiency stars earned
– Efficiency stars – 0 – 5 stars awarded based on TCOC performance against other PCMH practices • More stars awarded to those practices whose actual TCOC
outperforms (lower than) its peers
12

Value‐Based Payment Financial Modeling August 9, 2017
7
Te n n C a r e ’ s P C M H P a y m e n t M o d e l - O u t c o m e s
Outcome Payments – Total Cost of Care (TCOC):– Quality stars – stars awarded for each quality metric that meets
or outperforms the state threshold• 5 quality stars, maximum, for pediatric only and adult only practices
• 10 quality stars, maximum, for family practices
– Outcome savings percentage –• Quality stars and TCOC efficiency stars are combined
5 quality stars and 5 efficiency stars for a total of 10 stars for adult only and pediatric only practices
10 quality stars and 5 efficiency stars for a total of 15 stars for family practices
• Each TCOC efficiency star earned by the PCMH practice contributes 10% to the outcome savings percentage.
• Each quality star earned by the PCMH practice contributes 10% to the outcome savings percentage for adult and pediatric practices and 5% for family practices
13
Te n n C a r e ’ s P C M H Q u a l i t y M e t r i c s
Pediatric Only and Adult Only Practices:
14

Value‐Based Payment Financial Modeling August 9, 2017
8
Te n n C a r e ’ s P C M H Q u a l i t y M e t r i c s
Family Practices:
15
EPSDT screening rate (Composite for youngest kids)
Well-child visits first15 months
Well-child visits at 18,24, & 30 months
EPSDT:Well-child visits ages3-6 years
EPSDT Screening(Compositefor older kids)
Well-child visits ages 7-11 yearsAdolescent well-care visits age 12-21
Weight assessment and nutritional counseling
BMI percentileCounseling fornutrition
Adult BMI screening
Antidepressant medicationmanagement
Comprehensivediabetes care (composite 1)
Diabetes eye examDiabetes BP < 140/90Diabetes nephropathy
Comprehensivediabetes care (composite 2)
Diabetes HbA1c testingDiabetes HbA1c poor control (> 9%)
Asthma medication management
lmmunization composite metric
Childhood immunizations Immunizations for adolescents
Te n n C a r e ’ s P C M H P a y m e n t M o d e l - O u t c o m e s
Outcome Payments – Total Cost of Care (TCOC):– Example - outcome savings percentage, pediatric practice
16

Value‐Based Payment Financial Modeling August 9, 2017
9
Te n n C a r e ’ s P C M H P a y m e n t M o d e l - O u t c o m e s
Outcome Payments – Efficiency Metric Improvement:– For low volume panel PCMH practices with fewer than 5,000
members
– Practices may earn outcome payments for annual improvement on efficiency metrics
– In addition to showing improvement in efficiency metrics, the practice must earn a minimum number of quality stars: • 2 (out of possible 5) for pediatric and adult practices
• 4 (out of possible 10) for family practices
– Calculation of outcome payment
17
Te n n C a r e ’ s P C M H P a y m e n t M o d e l - O u t c o m e s
Outcome Payments – Efficiency Metric Improvement:– A proxy for estimated savings is calculated by multiplying the
following 2 factors:• Average cost of care
• Efficiency improvement percentage
– Average cost of care• The average total cost of care for members in primary care practices
across all of TennCare
• For the 2017 performance period, this value is set at $234
– Efficiency improvement percentage• The average of improvement in each efficiency metric compared to
the previous year’s performance
• If the average efficiency improvement percentage results in a negative number, it will be set to 0 and if the average calculation exceeds 20% it will be capped at that value
18

Value‐Based Payment Financial Modeling August 9, 2017
10
Te n n C a r e ’ s P C M H P a y m e n t M o d e l - O u t c o m e s
Example of Efficiency Improvement Percentage:
19
Te n n C a r e ’ s P C M H P a y m e n t M o d e l - O u t c o m e s
Outcome Payments – Efficiency Metric Improvement:– PCMH practices can earn from 0 – 100% of “imputed” savings
based on quality and efficiency stars earned
– Efficiency stars – 0 – 5 stars awarded for each efficiency metric that meets or outperforms the state threshold
20

Value‐Based Payment Financial Modeling August 9, 2017
11
Te n n C a r e ’ s P C M H P a y m e n t M o d e l - O u t c o m e s
Outcome Payments – Efficiency Metric Improvement:– Quality stars – stars awarded similar to TCOC model
– Outcome savings percentage – calculated similar to TCOC model although the earning of efficiency starts differ
– Example – outcome savings percentage, family practice:
– Maximum share of savings set at 25% (versus 50% in TCOC model)
21
V B P A r r a n g e m e n t s
Preparation for VBP requires an understanding of the key metrics that drives each payment methodology− Quality and risk-adjusting embedded through-out
22
Payment Model Key MetricBase Compensation Move from “per visit” to
“per patient” (capitation)Care Coordination New core competencies
and costQuality Incentive Payments
Measuring performance metrics
Global Budgets/Payment Monitoring the total health care spend (and quality)

Value‐Based Payment Financial Modeling August 9, 2017
12
V B P – Q u a l i t y M e t r i c s
“Value-inspired” metrics, of late, revolve around the following areas: measures
– Patient quality measures
– Process measures
– Population health metrics
– Patient satisfaction measures
– Access
– Efficiency
Measurement and payment thresholds include -– Event based
– Population based Maintenance
Improvement
23
V B P – Q u a l i t y M e t r i c s
Understand metrics being measured– Discussion of metrics selected
– Calculation of the metric (including data elements)
– Identify benchmarks
– Evaluate current performance and anticipated future performance
Project revenue based on anticipated performance and benchmarks
– Fixed payment per measure for improvement
– Fixed payment per measure for maintenance
– Incremental bonus based on movement of metric
– Composite scoring across multiple metrics
– Amount of surplus-sharing/risk-sharing payments earned
24

Value‐Based Payment Financial Modeling August 9, 2017
13
V B P – Q u a l i t y M e t r i c s
25
Example of composite scoring formula– Analysis of metric
– Comparison to benchmark (1 point for meeting benchmark)
MeasureCurrent Actual
Year One Year TwoImprove % Metric Improve % Metric
Comprehensive Diabetes Care (#1) 40.00% 25% 50.00% 15% 57.50%
Measure Benchmark (Threshold)Projected Score
Year One Year TwoComprehensiveDiabetes Care (#1) ≥ 50% 1 1
V B P – Q u a l i t y M e t r i c s
26
Example of composite scoring formula (continued)– Composite scoring and amount of payment
– Some payors may set a minimum score before QIP payments will be made
– Quality scores may also impact potential surplus-sharing distributions
Year One Year Two
Total Actual Points – all measures 3 5
Total Available Points (10 metrics) 10 10
% of Total Attained 30% 50%
Maximum QIP Pool Available $ 500,000 $ 500,000
Total Projected QIP Payment $ 125,000 $ 250,000

Value‐Based Payment Financial Modeling August 9, 2017
14
V B P – S u r p l u s / R i s k - S h a r i n g
Revenue projection – complicated and various assumptions– Targeted Spend/Benchmark – Use of historic claims
versus Medical Loss Ratio (MLR)
– Projection of actual spend
– Surplus-sharing and risk-sharing %s
– Impact of quality scores on distribution amount
– Timing of payments
27
V B P – S u r p l u s / R i s k - S h a r i n g
Example revenue projection
28
$ PMPM
# of Member
Months Total Amount
Targeted Spend/Benchmark $500.00 100,000 $50,000,000
Actual Spend (Projected) $475.00 100,000 $47,500,000
Projected Surplus (Deficit) $25.00 $2,500,000
Surplus‐Sharing % 50%
Amount Available for Distribution $1,250,000
Quality Score 75%
Adjusted Distribution for Quality Score $937,500
Value‐Based Payment Financial Modeling August 9, 2017
15
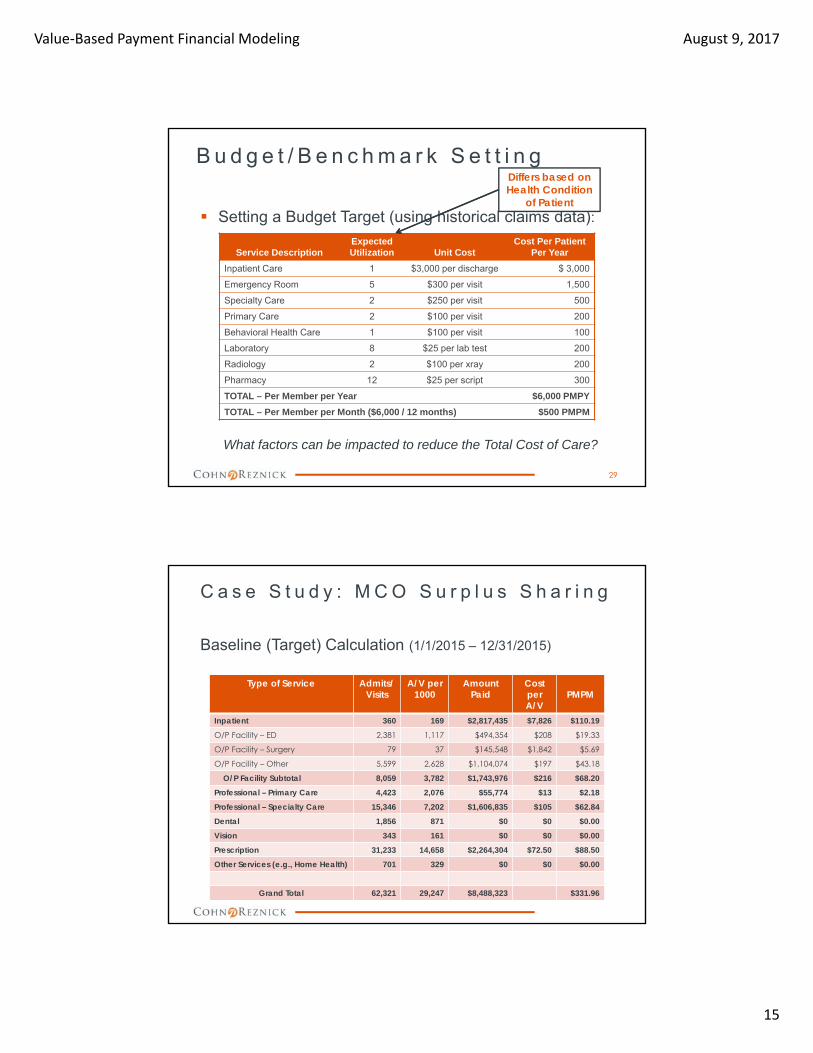
B u d g e t / B e n c h m a r k S e t t i n g
Setting a Budget Target (using historical claims data):
Service DescriptionExpectedUtilization Unit Cost
Cost Per Patient Per Year
Inpatient Care 1 $3,000 per discharge $ 3,000
Emergency Room 5 $300 per visit 1,500
Specialty Care 2 $250 per visit 500
Primary Care 2 $100 per visit 200
Behavioral Health Care 1 $100 per visit 100
Laboratory 8 $25 per lab test 200
Radiology 2 $100 per xray 200
Pharmacy 12 $25 per script 300
TOTAL – Per Member per Year $6,000 PMPY
TOTAL – Per Member per Month ($6,000 / 12 months) $500 PMPM
What factors can be impacted to reduce the Total Cost of Care?
29
Differs based on Health Condition
of Patient
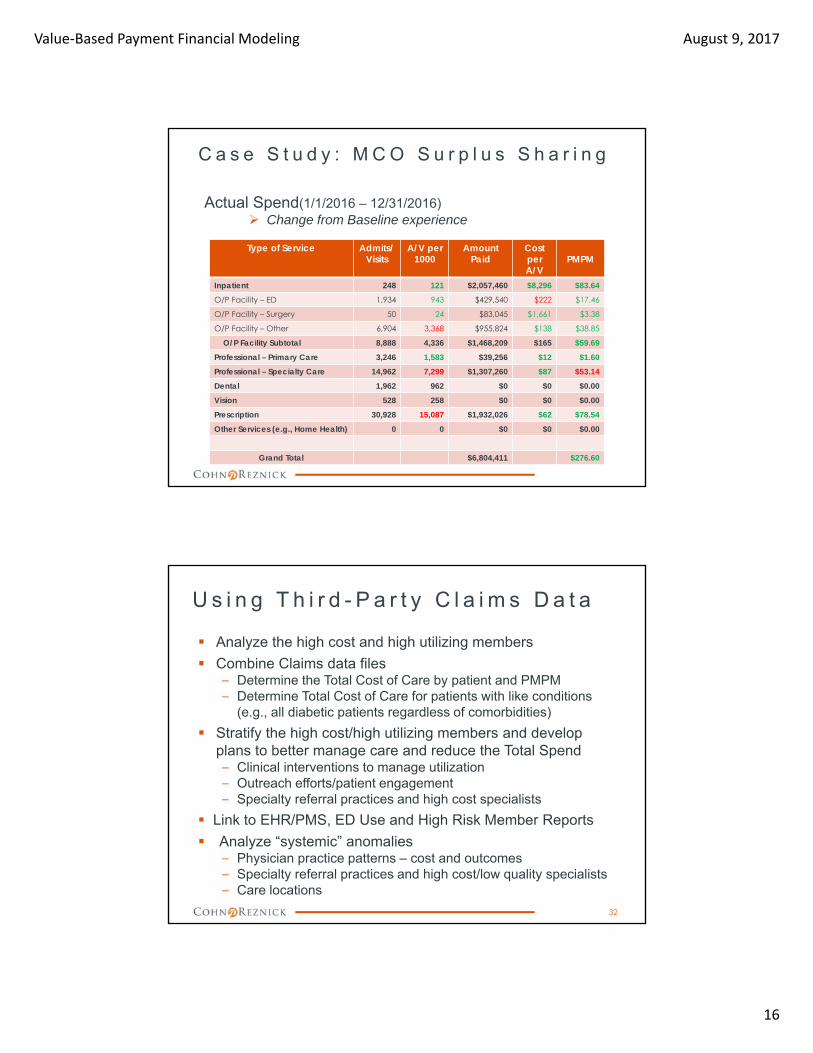
C a s e S t u d y : M C O S u r p l u s S h a r i n g
Baseline (Target) Calculation (1/1/2015 – 12/31/2015)
Type of Service Admits/Visits
A/V per 1000
Amount Paid
Cost perA/V
PMPM
Inpatient 360 169 $2,817,435 $7,826 $110.19
O/P Facility – ED 2,381 1,117 $494,354 $208 $19.33
O/P Facility – Surgery 79 37 $145,548 $1,842 $5.69
O/P Facility – Other 5,599 2,628 $1,104,074 $197 $43.18
O/P Facility Subtotal 8,059 3,782 $1,743,976 $216 $68.20
Professional – Primary Care 4,423 2,076 $55,774 $13 $2.18
Professional – Specialty Care 15,346 7,202 $1,606,835 $105 $62.84
Dental 1,856 871 $0 $0 $0.00
Vision 343 161 $0 $0 $0.00
Prescription 31,233 14,658 $2,264,304 $72.50 $88.50
Other Services (e.g., Home Health) 701 329 $0 $0 $0.00
Grand Total 62,321 29,247 $8,488,323 $331.96
Value‐Based Payment Financial Modeling August 9, 2017
16
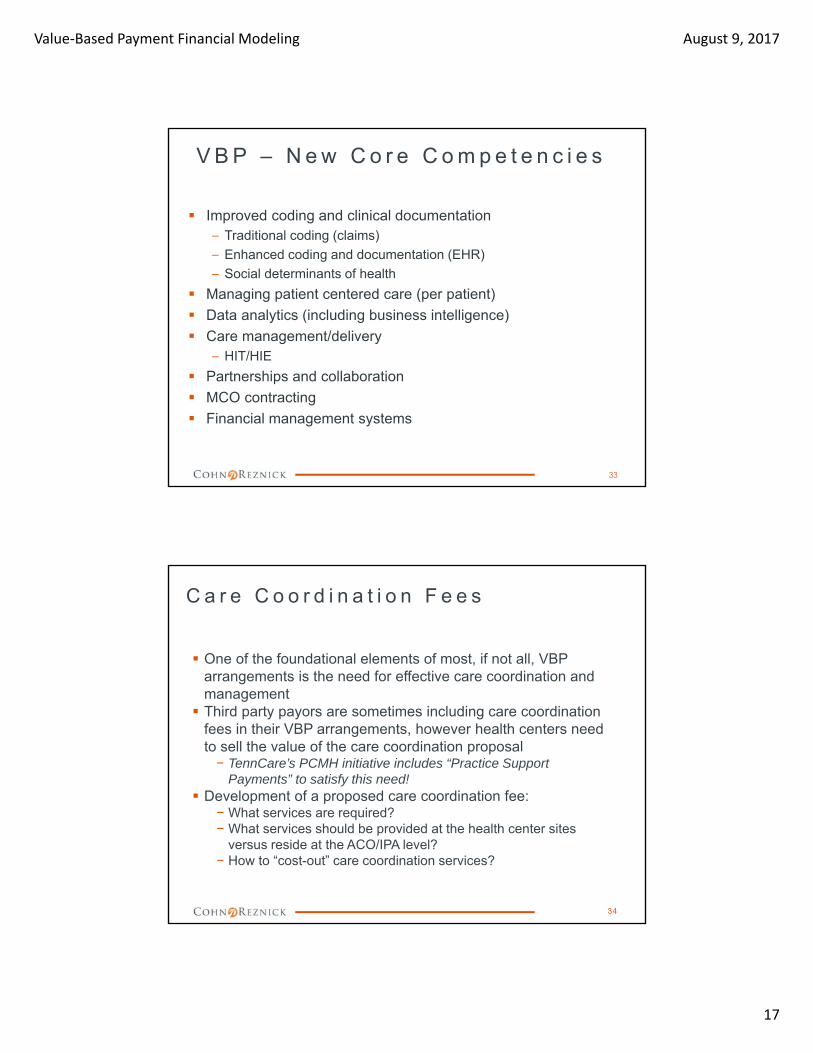
C a s e S t u d y : M C O S u r p l u s S h a r i n g
Actual Spend(1/1/2016 – 12/31/2016) Change from Baseline experience
Type of Service Admits/Visits
A/V per 1000
Amount Paid
Cost perA/V
PMPM
Inpatient 248 121 $2,057,460 $8,296 $83.64
O/P Facility – ED 1,934 943 $429,540 $222 $17.46
O/P Facility – Surgery 50 24 $83,045 $1,661 $3.38
O/P Facility – Other 6,904 3,368 $955,824 $138 $38.85
O/P Facility Subtotal 8,888 4,336 $1,468,209 $165 $59.69
Professional – Primary Care 3,246 1,583 $39,256 $12 $1.60
Professional – Specialty Care 14,962 7,299 $1,307,260 $87 $53.14
Dental 1,962 962 $0 $0 $0.00
Vision 528 258 $0 $0 $0.00
Prescription 30,928 15,087 $1,932,026 $62 $78.54
Other Services (e.g., Home Health) 0 0 $0 $0 $0.00
Grand Total $6,804,411 $276.60
U s i n g T h i r d - P a r t y C l a i m s D a t a
Analyze the high cost and high utilizing members
Combine Claims data files– Determine the Total Cost of Care by patient and PMPM– Determine Total Cost of Care for patients with like conditions
(e.g., all diabetic patients regardless of comorbidities)
Stratify the high cost/high utilizing members and develop plans to better manage care and reduce the Total Spend– Clinical interventions to manage utilization– Outreach efforts/patient engagement– Specialty referral practices and high cost specialists
Link to EHR/PMS, ED Use and High Risk Member Reports
Analyze “systemic” anomalies– Physician practice patterns – cost and outcomes– Specialty referral practices and high cost/low quality specialists– Care locations
32
Value‐Based Payment Financial Modeling August 9, 2017
17
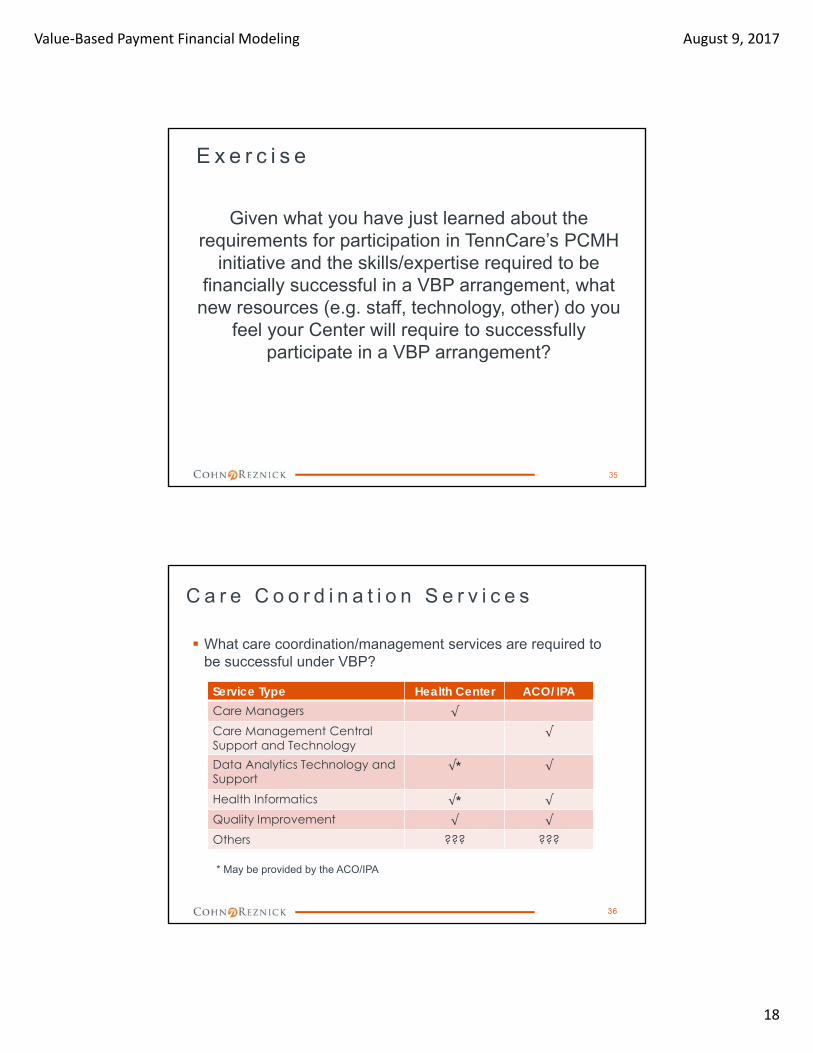
V B P – N e w C o r e C o m p e t e n c i e s
Improved coding and clinical documentation– Traditional coding (claims)
– Enhanced coding and documentation (EHR)
– Social determinants of health
Managing patient centered care (per patient)
Data analytics (including business intelligence)
Care management/delivery– HIT/HIE
Partnerships and collaboration
MCO contracting
Financial management systems
33
C a r e C o o r d i n a t i o n F e e s
One of the foundational elements of most, if not all, VBP arrangements is the need for effective care coordination and management Third party payors are sometimes including care coordination
fees in their VBP arrangements, however health centers need to sell the value of the care coordination proposal− TennCare’s PCMH initiative includes “Practice Support
Payments” to satisfy this need! Development of a proposed care coordination fee:
− What services are required?− What services should be provided at the health center sites
versus reside at the ACO/IPA level?− How to “cost-out” care coordination services?
34
Value‐Based Payment Financial Modeling August 9, 2017
18
E x e r c i s e
Given what you have just learned about the requirements for participation in TennCare’s PCMH
initiative and the skills/expertise required to be financially successful in a VBP arrangement, what
new resources (e.g. staff, technology, other) do you feel your Center will require to successfully
participate in a VBP arrangement?
35
C a r e C o o r d i n a t i o n S e r v i c e s
What care coordination/management services are required to be successful under VBP?
* May be provided by the ACO/IPA
36
Service Type Health Center ACO/IPACare Managers √
Care Management Central Support and Technology
√
Data Analytics Technology and Support
√* √
Health Informatics √* √
Quality Improvement √ √
Others ??? ???
Value‐Based Payment Financial Modeling August 9, 2017
19
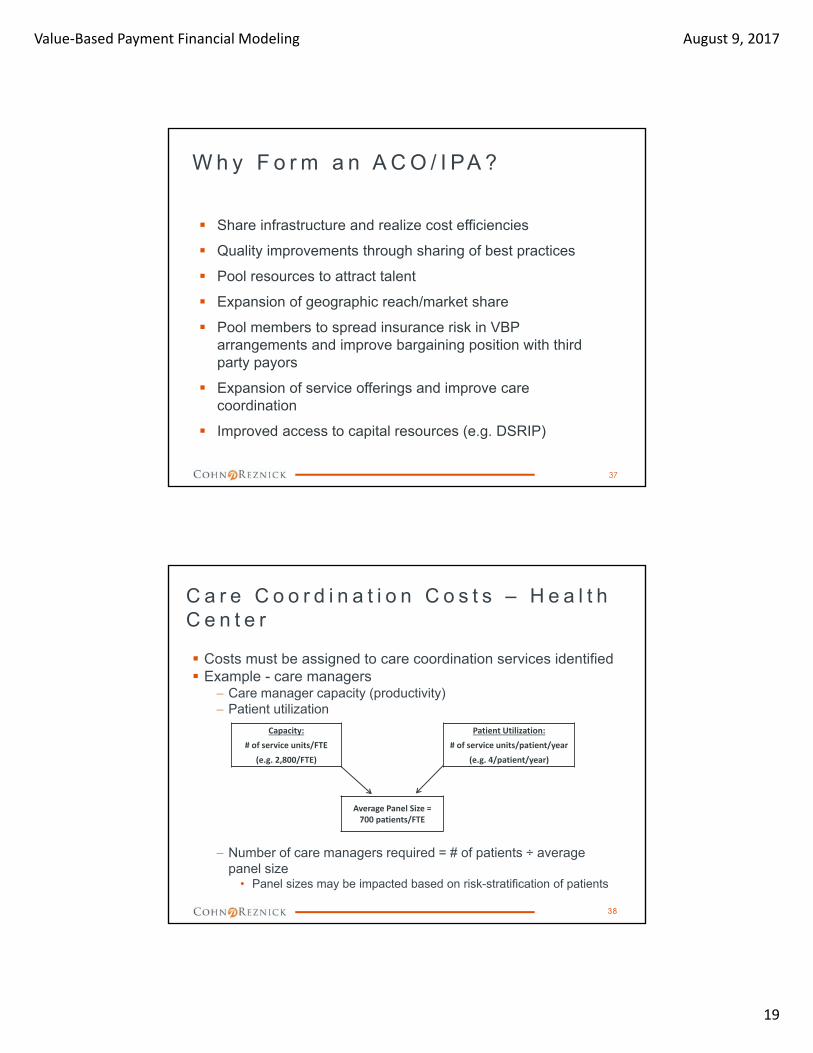
W h y F o r m a n A C O / I PA ?
Share infrastructure and realize cost efficiencies
Quality improvements through sharing of best practices
Pool resources to attract talent
Expansion of geographic reach/market share
Pool members to spread insurance risk in VBP arrangements and improve bargaining position with third party payors
Expansion of service offerings and improve care coordination
Improved access to capital resources (e.g. DSRIP)
37
C a r e C o o r d i n a t i o n C o s t s – H e a l t h C e n t e r
Costs must be assigned to care coordination services identified Example - care managers
Care manager capacity (productivity) Patient utilization
Number of care managers required = # of patients ÷ average panel size
• Panel sizes may be impacted based on risk-stratification of patients
Capacity: Patient Utilization:
# of service units/FTE # of service units/patient/year
(e.g. 2,800/FTE) (e.g. 4/patient/year)
Average Panel Size = 700 patients/FTE
38

Value‐Based Payment Financial Modeling August 9, 2017
20
C a r e C o o r d i n a t i o n C o s t s – H e a l t h C e n t e r
Example calculation of cost of care coordination services –− Total cost and PMPM
39
Service Type Costing MethodologyCost
EstimateCare Managers 4.00 FTE X $60,000 $ 240,000
Quality Improvement 1.00 FTE X $75,000 75,000
Health Informatics 1.00 FTE X $75,000 75,000
Support Staff 1.00 FTE X $30,000 30,000
Care Management/Data Analytics Technology Solutions
Covered by ACO/IPA (charged to the center?)
???
Others TBD ???
TOTAL ANNUAL COSTS $ 420,000
Number of Member Months 10,000 members X 12 mos. 120,000
COST PMPM $ 3.50
C a r e C o o r d i n a t i o n / M a n a g e m e n t F e e s – C a s e S t u d y
ABC MCO is looking to construct a VBP arrangement with A-CHC− ABC MCO has not historically paid providers for care
management/coordination services A-CHC is looking to negotiate a care coordination fee PMPM with
ABC MCO A-CHC has compiled the following data to assist with developing a
cost estimate for the provision of these services Task – Calculate the following items:
‒ # of care management sessions required for A-CHC members in ABC MCO
‒ Total annual cost and cost PMPM of care management services
40
Value‐Based Payment Financial Modeling August 9, 2017
21
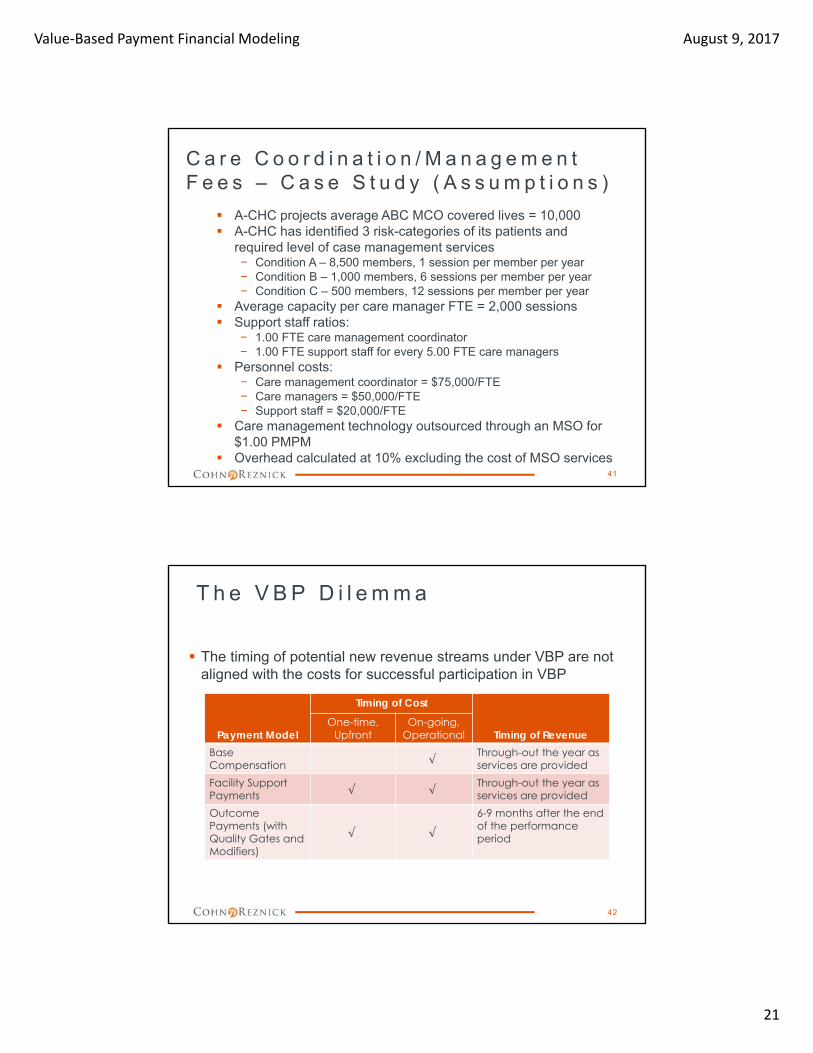
C a r e C o o r d i n a t i o n / M a n a g e m e n t F e e s – C a s e S t u d y ( A s s u m p t i o n s )
A-CHC projects average ABC MCO covered lives = 10,000 A-CHC has identified 3 risk-categories of its patients and
required level of case management services− Condition A – 8,500 members, 1 session per member per year− Condition B – 1,000 members, 6 sessions per member per year− Condition C – 500 members, 12 sessions per member per year
Average capacity per care manager FTE = 2,000 sessions Support staff ratios:
− 1.00 FTE care management coordinator− 1.00 FTE support staff for every 5.00 FTE care managers
Personnel costs:− Care management coordinator = $75,000/FTE− Care managers = $50,000/FTE− Support staff = $20,000/FTE
Care management technology outsourced through an MSO for $1.00 PMPM
Overhead calculated at 10% excluding the cost of MSO services41
T h e V B P D i l e m m a
The timing of potential new revenue streams under VBP are not aligned with the costs for successful participation in VBP
42
Payment Model
Timing of Cost
Timing of RevenueOne-time,
UpfrontOn-going,
OperationalBase Compensation √
Through-out the year as services are provided
Facility Support Payments √ √
Through-out the year as services are provided
Outcome Payments (with Quality Gates and Modifiers)
√ √
6-9 months after the end of the performance period

Value‐Based Payment Financial Modeling August 9, 2017
22
V B P – F i n a n c i a l a n d O p e r a t i o n a l C o n s i d e r a t i o n s
What is this going to cost?– Identify new resources/services to be provided
– Evaluate whether to “go this alone” versus “join forces”
– Develop a 3-year financial model, including cash flow
– Quantify a range of capital requirements
– Identify outside funding sources to offset capital needs and reserves
What is the return on investment– Understand financial requirements of participation in VBP
arrangements
– Develop sound assumptions based on available data
– Utilize financial model to inform MCO negotiations
43
V B P F i n a n c i a l M o d e l
Develop a financial model– Prepare 3-year financial model, including cash flow
– Decide on the services required to be provided for success under VBP
In-house (personnel) versus outsourced (ACO/IPA vs. MSO)
On-going versus one-time
– Develop a cost projection based on services required
– Project potential revenues under VBP arrangements
Understand and develop “best estimates” for key assumptions
Utilize financial model to inform VBP negotiations
– Project opportunities under DSRIP, if applicable
– Estimate potential capital requirements
– Evaluate other funding sources (e.g. Foundations; HRSA QI awards, reserves/existing operating surpluses)
44

Value‐Based Payment Financial Modeling August 9, 2017
23
WA R N I N G ! WA R N I N G !
THE CONTENTS OF THE FOLLOWING FINANCIAL MODEL ARE BASED ON GROSS ASSUMPTIONS
AND INTENDED TO PROVIDE PARTICIPANTS WITH AN UNDERSTANDING OF THE KEY DRIVERS OF FINANCIAL PERFORMANCE
UNDER VBP AND COULD BE HARMFUL TO YOUR HEALTH!
THE FINANCIAL MODEL AND ITS RESULTS WILL CHANGE AS FQHCs DECIDE ON THEIR
INFRASTRUCTURE NEEDS AND ACO/MCO ARRANGEMENTS NEGOTIATED.
ACTUAL RESULTS WILL VARY SIGNIFICANTLY!45
S e r v i c e s t o b e P r o v i d e d u n d e r V B P
Services– Decide on the services required to be provided for success under
VBP
Care coordination (transitions in care)
Care management (complex/chronic conditions)
Clinical protocols
Quality improvement
Clinical/Data analytics
HIT/HIE
Utilization management (inpatient/procedures)
Disease management
VBP contract compliance/reporting
– In-house (personnel) versus outsourced (ACO/IPA vs. MSO)
– On-going versus one-time
46

Value‐Based Payment Financial Modeling August 9, 2017
24
B a s i c A s s u m p t i o n s i n t h e E x a m p l e F i n a n c i a l M o d e l
Amounts are hypothetical and included to demonstrate the flow of the financial model and highlight the key drivers of performance
Patients– The number of patients served is projected flat over the 3-year
period (25,000 patients) and by month, pro-rated
Used for staffing
– 50% (12,500 patients) are considered participating in the VBP program
Used for payment
Payments from TennCare under the PCMH initiative‒ $4-5 PMPM for care coordination/management services
‒ Surplus-sharing distributions available based on Year One performance
47
S t a f f i n g A s s u m p t i o n s
Assess the need for oversight and technical support
Assess the need for care management/ coordination staff‒ Staffing ratios differ
by:• Populations
served
• Risk stratification of patients
• Staff type
48
Please note that the above staffing ratios do not reflect actual data but are purely included as an example. These ratios need to be developed!
VBP Oversight and Technical Support:Position FTE Salary
QI Coordinator 1.00 65,000
Data Analyst 1.00 45,000
Care Coordination/Care Management Function:
CM Ratios:Population Total Pop Low Risk Medium Risk High Risk
General Population 25,000 100% TBD TBD
Special Population ‐
Health Homes ‐
TOTAL 25,000 25,000 TBD TBD
FTE Calculation: Salary
Ratios 12,500 TBD TBD
RN CMs 2.00 2.00 0.00 0.00 85,000
Ratios 10,000 TBD TBD
CHWs 2.50 2.50 0.00 0.00 35,000
Ratios 25,000 TBD TBD
LCSWs 1.00 1.00 0.00 0.00 55,000
Projected Annual Salary Increases:
Year Two 3.00%
Year Three 3.00%

Value‐Based Payment Financial Modeling August 9, 2017
25
S a l a r y P r o j e c t i o n s
Salaries for participation in VBP should include:‒ Direct care services
‒ Oversight and technical support
Salaries should be projected to link to changes in patients utilizing appropriate staffing ratios
Additional staff may be required for DSRIP projects, if applicable
49
Year One:
Description Jan Feb Mar Apr May Jun Jul Aug Sep Oct Nov Dec Totals
Salaries and wages:
QI Coordinator
FTE 1.00 1.00 1.00 1.00 1.00 1.00 1.00 1.00 1.00 1.00 1.00 1.00 1.00
Salary 5,417 5,417 5,417 5,417 5,417 5,417 5,417 5,417 5,417 5,417 5,417 5,417 65,000
RN Case Managers
FTE 2.00 2.00 2.00 2.00 2.00 2.00 2.00 2.00 2.00 2.00 2.00 2.00 2.00
Salary 14,167 14,167 14,167 14,167 14,167 14,167 14,167 14,167 14,167 14,167 14,167 14,167 170,000
Community Health Workers
FTE 2.50 2.50 2.50 2.50 2.50 2.50 2.50 2.50 2.50 2.50 2.50 2.50 2.50
Salary 7,292 7,292 7,292 7,292 7,292 7,292 7,292 7,292 7,292 7,292 7,292 7,292 87,500
LCSWs
FTE 1.00 1.00 1.00 1.00 1.00 1.00 1.00 1.00 1.00 1.00 1.00 1.00 1.00
Salary 4,583 4,583 4,583 4,583 4,583 4,583 4,583 4,583 4,583 4,583 4,583 4,583 55,000
Data Analyst
FTE 1.00 1.00 1.00 1.00 1.00 1.00 1.00 1.00 1.00 1.00 1.00 1.00 1.00
Salary 3,750 3,750 3,750 3,750 3,750 3,750 3,750 3,750 3,750 3,750 3,750 3,750 45,000
Total salaries and wages 35,208 35,208 35,208 35,208 35,208 35,208 35,208 35,208 35,208 35,208 35,208 35,208 422,500
O t h e r E x p e n s e P r o j e c t i o n s
Fringe benefits should be projected at the health centers historical fringe rate (e.g. 25%)
Contracted Services‒ MSO services – services to be provided relative to populations
health management platform and data analytics • One-time implementation cost - $50,000
• On-going services - $1.50 PMPM
‒ EHR/HIE connectivity including registries• One-time connectivity fees - $5,000
• On-going services - $25 per MD per month (25 MDs)
Program Administration/Overhead – budgeted at 10% of direct costs, excluding contracted services
Other ???
50
Value‐Based Payment Financial Modeling August 9, 2017
26
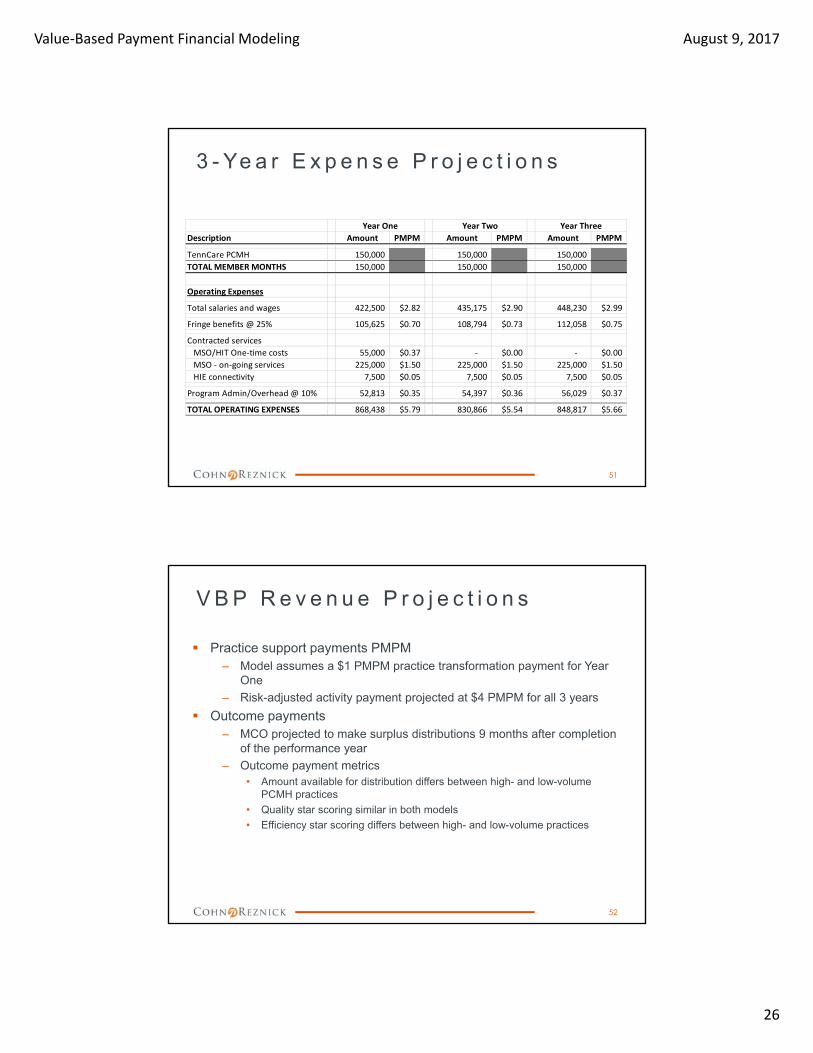
3 - Ye a r E x p e n s e P r o j e c t i o n s
51
Description Amount PMPM Amount PMPM Amount PMPM
TennCare PCMH 150,000 150,000 150,000
TOTAL MEMBER MONTHS 150,000 150,000 150,000
Operating Expenses
Total salaries and wages 422,500 $2.82 435,175 $2.90 448,230 $2.99
Fringe benefits @ 25% 105,625 $0.70 108,794 $0.73 112,058 $0.75
Contracted services
MSO/HIT One‐time costs 55,000 $0.37 ‐ $0.00 ‐ $0.00
MSO ‐ on‐going services 225,000 $1.50 225,000 $1.50 225,000 $1.50
HIE connectivity 7,500 $0.05 7,500 $0.05 7,500 $0.05
Program Admin/Overhead @ 10% 52,813 $0.35 54,397 $0.36 56,029 $0.37
TOTAL OPERATING EXPENSES 868,438 $5.79 830,866 $5.54 848,817 $5.66
Year One Year Two Year Three
V B P R e v e n u e P r o j e c t i o n s
Practice support payments PMPM‒ Model assumes a $1 PMPM practice transformation payment for Year
One
‒ Risk-adjusted activity payment projected at $4 PMPM for all 3 years
Outcome payments‒ MCO projected to make surplus distributions 9 months after completion
of the performance year
‒ Outcome payment metrics• Amount available for distribution differs between high- and low-volume
PCMH practices
• Quality star scoring similar in both models
• Efficiency star scoring differs between high- and low-volume practices
52
Value‐Based Payment Financial Modeling August 9, 2017
27
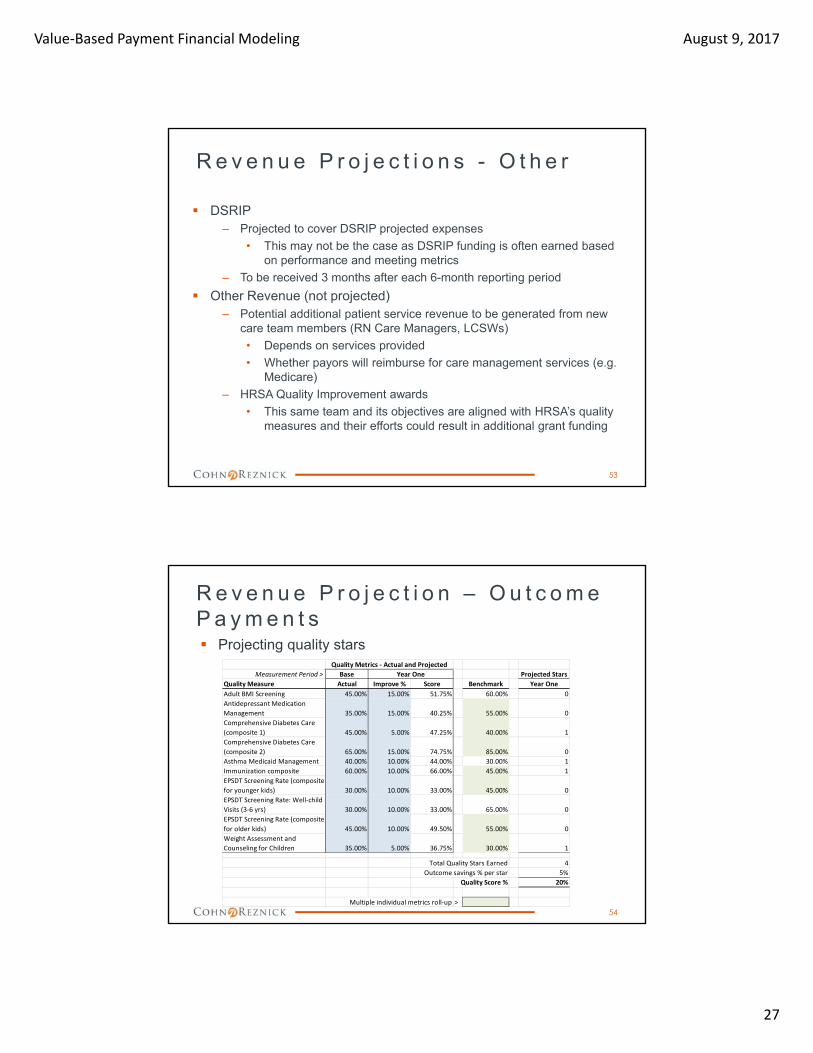
R e v e n u e P r o j e c t i o n s - O t h e r
DSRIP‒ Projected to cover DSRIP projected expenses
• This may not be the case as DSRIP funding is often earned based on performance and meeting metrics
‒ To be received 3 months after each 6-month reporting period
Other Revenue (not projected)‒ Potential additional patient service revenue to be generated from new
care team members (RN Care Managers, LCSWs)
• Depends on services provided
• Whether payors will reimburse for care management services (e.g. Medicare)
‒ HRSA Quality Improvement awards
• This same team and its objectives are aligned with HRSA’s quality measures and their efforts could result in additional grant funding
53
R e v e n u e P r o j e c t i o n – O u t c o m e P a y m e n t s Projecting quality stars
54
Measurement Period > Base
Quality Measure Actual Improve % Score Benchmark Year One
Adult BMI Screening 45.00% 15.00% 51.75% 60.00% 0
Antidepressant Medication
Management 35.00% 15.00% 40.25% 55.00% 0
Comprehensive Diabetes Care
(composite 1) 45.00% 5.00% 47.25% 40.00% 1
Comprehensive Diabetes Care
(composite 2) 65.00% 15.00% 74.75% 85.00% 0
Asthma Medicaid Management 40.00% 10.00% 44.00% 30.00% 1
Immunization composite 60.00% 10.00% 66.00% 45.00% 1
EPSDT Screening Rate (composite
for younger kids) 30.00% 10.00% 33.00% 45.00% 0
EPSDT Screening Rate: Well‐child
Visits (3‐6 yrs) 30.00% 10.00% 33.00% 65.00% 0
EPSDT Screening Rate (composite
for older kids) 45.00% 10.00% 49.50% 55.00% 0
Weight Assessment and
Counseling for Children 35.00% 5.00% 36.75% 30.00% 1
Total Quality Stars Earned 4
Outcome savings % per star 5%
Quality Score % 20%
Multiple individual metrics roll‐up >
Quality Metrics ‐ Actual and Projected
Year One Projected Stars
Value‐Based Payment Financial Modeling August 9, 2017
28
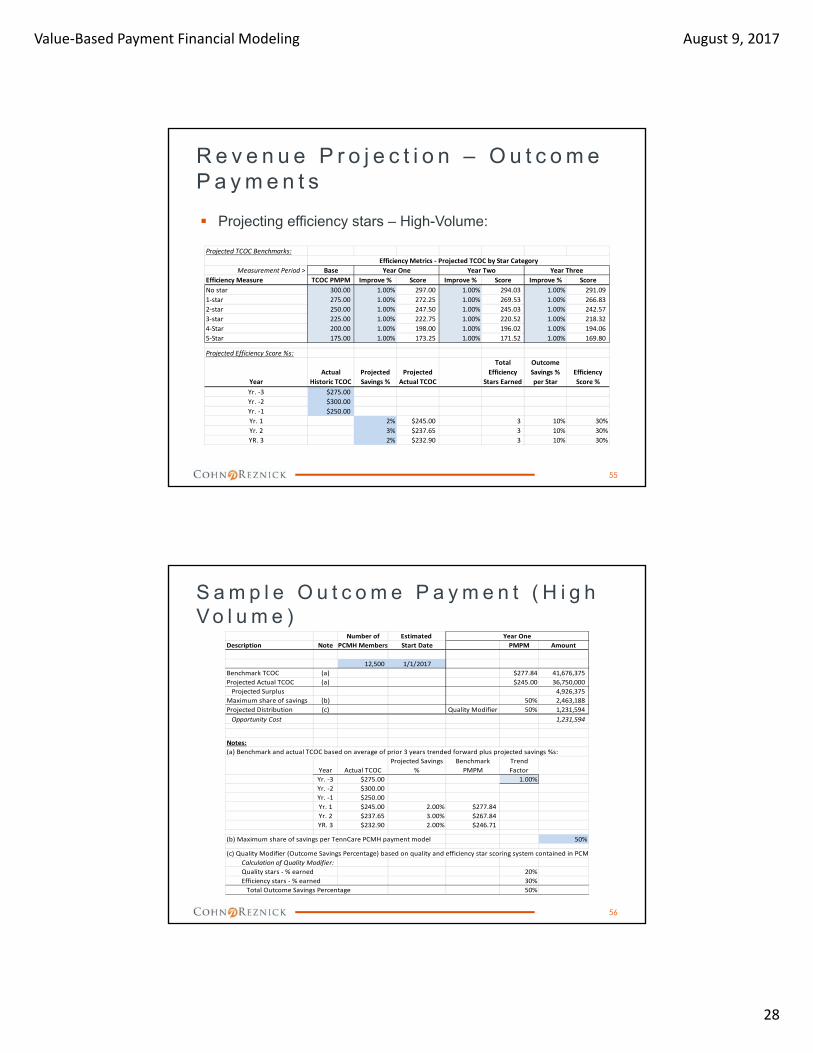
R e v e n u e P r o j e c t i o n – O u t c o m e P a y m e n t s
Projecting efficiency stars – High-Volume:
55
Projected TCOC Benchmarks:
Measurement Period > Base
Efficiency Measure TCOC PMPM Improve % Score Improve % Score Improve % Score
No star 300.00 1.00% 297.00 1.00% 294.03 1.00% 291.09
1‐star 275.00 1.00% 272.25 1.00% 269.53 1.00% 266.83
2‐star 250.00 1.00% 247.50 1.00% 245.03 1.00% 242.57
3‐star 225.00 1.00% 222.75 1.00% 220.52 1.00% 218.32
4‐Star 200.00 1.00% 198.00 1.00% 196.02 1.00% 194.06
5‐Star 175.00 1.00% 173.25 1.00% 171.52 1.00% 169.80
Projected Efficiency Score %s:
Year
Actual
Historic TCOC
Projected
Savings %
Projected
Actual TCOC
Total
Efficiency
Stars Earned
Outcome
Savings %
per Star
Efficiency
Score %
Yr. ‐3 $275.00
Yr. ‐2 $300.00
Yr. ‐1 $250.00
Yr. 1 2% $245.00 3 10% 30%
Yr. 2 3% $237.65 3 10% 30%
YR. 3 2% $232.90 3 10% 30%
Efficiency Metrics ‐ Projected TCOC by Star Category
Year One Year Two Year Three
S a m p l e O u t c o m e P a y m e n t ( H i g h V o l u m e )
56
Number of Estimated
Description Note PCMH Members Start Date PMPM Amount
12,500 1/1/2017 50%
Benchmark TCOC (a) $277.84 41,676,375
Projected Actual TCOC (a) $245.00 36,750,000
Projected Surplus 4,926,375
Maximum share of savings (b) 50% 2,463,188
Projected Distribution (c) Quality Modifier 50% 1,231,594
Opportunity Cost 1,231,594
Notes:
(a) Benchmark and actual TCOC based on average of prior 3 years trended forward plus projected savings %s:
Year Actual TCOC
Projected Savings
%
Benchmark
PMPM
Trend
Factor
Yr. ‐3 $275.00 1.00%
Yr. ‐2 $300.00
Yr. ‐1 $250.00
Yr. 1 $245.00 2.00% $277.84
Yr. 2 $237.65 3.00% $267.84
YR. 3 $232.90 2.00% $246.71
(b) Maximum share of savings per TennCare PCMH payment model 50%
(c) Quality Modifier (Outcome Savings Percentage) based on quality and efficiency star scoring system contained in PCM
Calculation of Quality Modifier:
Quality stars ‐ % earned 20%
Efficiency stars ‐ % earned 30%
Total Outcome Savings Percentage 50%
Year One

Value‐Based Payment Financial Modeling August 9, 2017
29
M o n t h l y F i n a n c i a l P r o j e c t i o n –Ye a r O n e ( H i g h Vo l u m e )
57
The VBP/QI “department” should be viewed as its own profit center!
Year One:
Description Jan Feb Mar Apr May Jun Jul Aug Sep Oct Nov Dec Totals
TennCare PCMH 12,500 12,500 12,500 12,500 12,500 12,500 12,500 12,500 12,500 12,500 12,500 12,500 150,000
TOTAL MEMBERS 12,500 12,500 12,500 12,500 12,500 12,500 12,500 12,500 12,500 12,500 12,500 12,500 150,000
Operating Revenue:
Practice Support Payments (PMPM) 62,500 62,500 62,500 62,500 62,500 62,500 62,500 62,500 62,500 62,500 62,500 62,500 750,000
Surplus/Risk‐sharing ‐
Other ‐
TOTAL OPERATING REVENUE 62,500 62,500 62,500 62,500 62,500 62,500 62,500 62,500 62,500 62,500 62,500 62,500 750,000
Operating Expenses
Salaries and wages 35,208 35,208 35,208 35,208 35,208 35,208 35,208 35,208 35,208 35,208 35,208 35,208 422,500
Fringe benefits @ 25% 8,802 8,802 8,802 8,802 8,802 8,802 8,802 8,802 8,802 8,802 8,802 8,802 105,625
Total Personnel Costs 44,010 44,010 44,010 44,010 44,010 44,010 44,010 44,010 44,010 44,010 44,010 44,010 528,125
Contracted services
MSO/HIT One‐time costs 55,000 55,000
MSO ‐ on‐going services 18,750 18,750 18,750 18,750 18,750 18,750 18,750 18,750 18,750 18,750 18,750 18,750 225,000
HIE connectivity 625 625 625 625 625 625 625 625 625 625 625 625 7,500
Total Contracted Services 74,375 19,375 19,375 19,375 19,375 19,375 19,375 19,375 19,375 19,375 19,375 19,375 287,500
Prog Admin/Overhead @ 10% 4,401 4,401 4,401 4,401 4,401 4,401 4,401 4,401 4,401 4,401 4,401 4,401 52,813
TOTAL OPERATING EXPENSES 122,786 67,786 67,786 67,786 67,786 67,786 67,786 67,786 67,786 67,786 67,786 67,786 868,438
SURPLUS (LOSS) (60,286) (5,286) (5,286) (5,286) (5,286) (5,286) (5,286) (5,286) (5,286) (5,286) (5,286) (5,286) (118,438)
Cumulative Surplus (Loss) (60,286) (65,573) (70,859) (76,146) (81,432) (86,719) (92,005) (97,292) (102,578) (107,865) (113,151) (118,438)
A n n u a l C a s h F l o w s – Ye a r s O n e t h r o u g h T h r e e ( H i g h V o l u m e )
58
Description Amount PMPM Amount PMPM Amount PMPM
TennCare PCMH 150,000 150,000 150,000
TOTAL MEMBER MONTHS 150,000 150,000 150,000
Operating Revenue:
Practice Support Payments (PMPM) 750,000 $5.00 600,000 $4.00 600,000 $4.00
Surplus/Risk‐sharing ‐ $0.00 1,231,594 $8.21 1,132,250 $7.55
Other ‐ $0.00 ‐ $0.00 ‐ $0.00
TOTAL OPERATING REVENUE 750,000 $5.00 1,831,594 $12.21 1,732,250 $11.55
Operating Expenses
Total salaries and wages 422,500 $2.82 435,175 $2.90 448,230 $2.99
Fringe benefits @ 25% 105,625 $0.70 108,794 $0.73 112,058 $0.75
Contracted services
MSO/HIT One‐time costs 55,000 $0.37 ‐ $0.00 ‐ $0.00
MSO ‐ on‐going services 225,000 $1.50 225,000 $1.50 225,000 $1.50
HIE connectivity 7,500 $0.05 7,500 $0.05 7,500 $0.05
Program Admin/Overhead @ 10% 52,813 $0.35 54,397 $0.36 56,029 $0.37
TOTAL OPERATING EXPENSES 868,438 $5.79 830,866 $5.54 848,817 $5.66
SURPLUS (LOSS) (118,438) ($0.79) 1,000,728 $6.67 883,433 $5.89
Year One Year Two Year Three

Value‐Based Payment Financial Modeling August 9, 2017
30
M o n t h l y C u m u l a t i v e C a s h P o s i t i o n – Ye a r s O n e t h r o u g h T h r e e ( H i g h V o l u m e )
59
The VBP Dilemma – Need for upfront capital and maintain a reserve!
Year One Year Two Year Three
Jan (60,286) (137,676) 861,556
Feb (65,573) (156,915) 840,821
Mar (70,859) (176,154) 820,086
Apr (76,146) (195,393) 799,352
May (81,432) (214,632) 778,617
Jun (86,719) (233,870) 757,882
Jul (92,005) (253,109) 737,148
Aug (97,292) (272,348) 716,413
Sep (102,578) (291,587) 695,678
Oct (107,865) 920,768 1,807,193
Nov (113,151) 901,529 1,786,459
Dec (118,438) 882,291 1,765,724
R e v e n u e P r o j e c t i o n – O u t c o m e P a y m e n t s
Projecting efficiency stars – Low Volume:
60
Measurement Period > Base Benchmark
Efficiency Measure Actual Improve % Score Per 1,000 MMs Year One
All Cause Hospital Readmissions 0.32 15.00% 0.27 0.23 0
ED Visits 75.00 15.00% 63.75 76.61 1
Inpatient Admissions 7.00 5.00% 6.65 6.63 0
Mental Health Inpatient
Utilization 1.15 15.00% 0.98 0.72 0
Avoidable ED Visits (Ambulatory 21.00 10.00% 18.90 20.00 1
Total Efficiency Stars Earned 2
Outcome savings % per star 10%
Efficiency Score % 20%
Efficiency Measure Baseline
Performance
Year
Efficiency
Improve
All Cause Hospital Readmissions 0.32 0.27 15.00%
ED Visits 75.00 63.75 15.00%
Inpatient Admissions 7.00 6.65 5.00%
Mental Health Inpatient
Utilization 1.15 0.98 15.00%
Avoidable ED Visits (Ambulatory
Sensitive) 21.00 18.90 10.00%
Average Efficiency Improve % 12.00%
Year One
Efficiency Metrics ‐ Actual?Projected (per 1,000)
Year One Projected Stars

Value‐Based Payment Financial Modeling August 9, 2017
31
S a m p l e O u t c o m e P a y m e n t ( L o w V o l u m e )
61
Number of
Description Note PCMH Members PMPM Amount
12,500 25%
Benchmark TCOC (a) $234.00 35,100,000
Projected Actual TCOC (a) $205.92 30,888,000
Imputed Savings 4,212,000
Maximum share of savings (b) 25% 1,053,000
Projected Distribution (c) Quality Modifier 40% 421,200
Opportunity Cost 631,800
Notes:
(a) VBP arrangements assume the following for TCOC:
TCOC benchmark initially set at $234 per PCMH Provider Operating Manual and reduced in futu
Baseline Average TCOC per TennCare Baseline 234.00$
Adjustment ‐ Efficiency Improvement % Year One 12.00% 205.92$
Year Two 9.00% 187.39$
Year Three 9.00% 170.52$
(b) Maximum share of savings per TennCare PCMH payment model 25%
(c) Quality Modifier (Outcome Savings Percentage) based on quality and efficiency star scoring syste
Calculation of Quality Modifier:
Quality stars ‐ % earned 20%
Efficiency stars ‐ % earned 20%
Total Outcome Savings Percentage 40%
Year One
A n n u a l C a s h F l o w s – Ye a r s O n e t h r o u g h T h r e e ( L o w V o l u m e )
62
Description Amount PMPM Amount PMPM Amount PMPM
TennCare PCMH 150,000 150,000 150,000
TOTAL MEMBER MONTHS 150,000 150,000 150,000
Operating Revenue:
Practice Support Payments (PMPM) 750,000 $5.00 600,000 $4.00 600,000 $4.00
Surplus/Risk‐sharing ‐ $0.00 421,200 $2.81 347,490 $2.32
Other ‐ $0.00 ‐ $0.00 ‐ $0.00
TOTAL OPERATING REVENUE 750,000 $5.00 1,021,200 $6.81 947,490 $6.32
Operating Expenses
Total salaries and wages 422,500 $2.82 435,175 $2.90 448,230 $2.99
Fringe benefits @ 25% 105,625 $0.70 108,794 $0.73 112,058 $0.75
Contracted services
MSO/HIT One‐time costs 55,000 $0.37 ‐ $0.00 ‐ $0.00
MSO ‐ on‐going services 225,000 $1.50 225,000 $1.50 225,000 $1.50
HIE connectivity 7,500 $0.05 7,500 $0.05 7,500 $0.05
Program Admin/Overhead @ 10% 52,813 $0.35 54,397 $0.36 56,029 $0.37
TOTAL OPERATING EXPENSES 868,438 $5.79 830,866 $5.54 848,817 $5.66
SURPLUS (LOSS) (118,438) ($0.79) 190,334 $1.27 98,673 $0.66
Year One Year Two Year Three

Value‐Based Payment Financial Modeling August 9, 2017
32
M o n t h l y C u m u l a t i v e C a s h P o s i t i o n – Ye a r s O n e t h r o u g h T h r e e ( L o w V o l u m e )
63
The VBP Dilemma – Need for upfront capital and maintain a reserve!
Year One Year Two Year Three
Jan (60,286) (137,676) 51,162
Feb (65,573) (156,915) 30,427
Mar (70,859) (176,154) 9,693
Apr (76,146) (195,393) (11,042)
May (81,432) (214,632) (31,777)
Jun (86,719) (233,870) (52,511)
Jul (92,005) (253,109) (73,246)
Aug (97,292) (272,348) (93,981)
Sep (102,578) (291,587) (114,716)
Oct (107,865) 110,374 212,040
Nov (113,151) 91,136 191,305
Dec (118,438) 71,897 170,570
F i n a n c i a l & O p e r a t i o n a l K e y C o n s i d e r a t i o n s
Key assumptions in financial model to “refine”– Services provided – by FQHC versus ACO/IPA
– Populations served (risk stratification)
– Staff required and staffing ratios
– DSRIP projects – cost versus revenue
– Care coordination/management revenue PMPM
– Outcome payments
Benchmarks
Projected improvement in quality and efficiency stars
Projected reduction in TCOC
– Other revenue opportunities
– Opportunities for working capital
64

Value‐Based Payment Financial Modeling August 9, 2017
33
F i n a n c i a l M a n a g e m e n t S y s t e m s
Current financial health and positive operating performance– Reserves
Strong financial systems and internal controls
Financial modeling– What are the new services and infrastructure required?
– What will it cost – upfront versus ongoing?
– What resources are available to fund these costs?
– What potential revenue streams are available?
– What are the key assumptions that drive success?
– What are the working capital needs?
– What is the ROI?
Utilize the financial model to inform VBP negotiations!
65
Q u e s t i o n s
66
Value‐Based Payment Financial Modeling August 9, 2017
34
C o n t a c t I n f o r m a t i o n
Peter R. Epp, CPA, Partner
Practice Leader – Community Health Centers
CohnReznick LLP
646.254.7411
67