Embed Size (px)
Citation preview
VBG Group Interim report January-June
2015 Q2

VBG GROUP INTERIM REPORT JANUARY–JUNE 2015
1
Second quarter of 2015:
• The Group’s net turnover increased by 19.6 per cent to SEK 331.5 M (277.1)
• Operating profit was SEK 30.7 M (27.0), with a margin of 9.3 per cent (9.7)
• Profit after financial items amounted to SEK 29.8 M (23.6) with a profit margin of 9.0 per cent (8.5)
• The Group’s profit after tax totalled SEK 20.7 M (17.0)
• Earnings per share amounted to SEK 1.65 (1.36)
KEY FIGURES
Q2 2015
Q2 2014
6 months2015
6 months2014
Full-year 2014
Net turnover, SEK M 331.5 277.1 686.6 593.5 1,186.8
Operating profit, SEK M 30.7 27.01 86.4 77.6 120.91
Operating margin, % 9.3 9.7 12.6 13.1 10.2
Profit after financial items, SEK M 29.8 23.6 85.3 72.3 112.7
Profit margin, % 9.0 8.5 12.4 12.2 9.5
Profit after tax, SEK M 20.7 17.0 61.2 52.5 78.9
Earnings per share, SEK 1.65 1.36 4.89 4.20 6.31
Equity per share 66.65 62.28 66.65 62.28 65.40
Cash flow from operating activities per share 2.77 1.47 6.73 4.80 9.81
Return on capital employed (ROCE), cumulative, % 16.8 16.7 16.8 16.7 12.5
Return on equity (ROE), cumulative, % 14.8 13.9 14.8 13.9 10.1
Equity/assets ratio, % 66.8 69.0 66.8 69.0 67.6
Interim report January – June 2015
First half of 2015:
• The Group’s net turnover increased by 15.7 per cent to SEK 686.6 M (593.5)
• Operating profit was SEK 86.4 M (77.6), with a margin of 12.6 per cent (13.1)
• Profit after financial items amounted to SEK 85.3 M (72.3) with a profit margin of 12.4 per cent (12.2)
• The Group’s profit after tax totalled SEK 61.2 M (52.5)
• Earnings per share amounted to SEK 4.89 (4.20)
1 Includes the following items affecting comparability: Capital gains of SEK 6.0 M in connection with the divestment of the Armaton product area (Q2). Negative goodwill of SEK 46.8 M in connection with the acquisition of Tschan (Q3). Cost for impairment of consolidated goodwill in Edscha Trailer Systems in the negative amount of SEK 60 M (Q4).Combined negative net effect of SEK 7.2 M for full-year 2014.

VBG GROUP INTERIM REPORT JANUARY–JUNE 2015
2
VBG Group AB (publ) in Vänersborg is the Parent Company of an international engineering Group with wholly owned companies in Europe, the USA, India and China. The Group’s operations are divided into three divisions – VBG Truck Equipment, Edscha Trailer Systems and Ringfeder Power Transmission – with products that are marketed under strong well-known brands. VBG Group AB’s Series B share was floated on the stock exchange in 1987 and is listed today on the Nasdaq OMX Stockholm Mid Cap list.
This is the VBG Group
Vision
We are number one or two globally in the industrial niches in
which we are active. We make a difference by creating the
products and services of the future.
Business concept
The VBG Group will, within selected product and market seg-
ments, acquire, own and develop industrial companies in busi-
ness-to-business commerce with strong brands and good
growth potential. Based on a long-term commitment and with
a focus on growth and profitability, the VBG Group’s share-
holders will be offered attractive value growth.
Goals
Minimum average annual turnover growth of 10 per cent.
Minimum average operating margin of 10 per cent.
Average return on capital employed of 18 per cent.
Strategies
The Parent Company, VBG Group AB, is responsible for the
strategic governance of the Group as a whole. This entails the
approval and follow-up of divisional targets and strategies.
The responsibility also includes identifying and implementing
strategic acquisitions and providing support in the form of
industrial expertise, the allocation of capital, strategic HR
work to ensure that the operations’ long-term competency
requirements are secured, as well as strategic IT work and the
operation of all shared IT systems.
Strategies for the divisions:
• Strong brands and leading market positions
in selected niches.
• High customer value in the products.
• Diversified customer base.
• International expansion.
Stable ownership situation
The VBG Group’s principal owners comprise three foundations
that were established by the Group’s founder, Herman Krefting.
In accordance with their regulations, the foundations may not
divest their shares in the VBG Group. This structure has histor-
ically provided us with a high degree of financial stability and
continuity in the implementation of the Group’s strategy
which, in turn, has resulted in solid total returns for shareholders.

VBG GROUP INTERIM REPORT JANUARY–JUNE 2015
3
VBG GROUP IN THE WORLD
The Parent Company of the VBG Group and pro-duction and sales companies for the VBG Truck Equipment division are located in Scandinavia.
Sales companies for the Ringfeder Power Transmission division, and the production and sales company Onspot of North America for the VBG Truck Equipment division, are located in the USA.
Production and sales companies for the Ringfeder Power Transmission division are located in India and China.
Production and sales companies for the VBG Truck Equipment, Ringfeder Power Transmission and Edscha Trailer Systems divisions are located in Europe.
SALES BY DIVISION SALES BY MARKET
Sweden, 14%
Other Nordic countries, 10%
Germany, 30%
Other European countries, 23%
North America, 14%
Rest of world, 9%
VBG Truck Equipment, 53%
Edscha Trailer Systems, 17%
Ringfeder Power Transmission, 30%
cont. This is the VBG Group
DIVISIONS
Ringfeder Power Transmission
By virtue of its own strong brands, the division is a recognised global market leader in selected niches within mechanical power transmission and energy and shock absorption. The division’s brands are Ringfeder, Tschan, Gerwah and Ecoloc. The custom-ers are found in such widely disparate industrial markets as con-struction, machinery, power and mining.
VBG Truck Equipment
By virtue of its own strong brands, the division is an interna-tionally leading supplier of coupling equipment for trucks with heavy trailers, where the division accounts for more than 50 per cent of the global market via the Ringfeder and VBG brands. The division also has Onspot – automatic tyre chains with a world-leading position in its niche.
Edscha Trailer Systems
By virtue of its own strong brands, the division is an interna-tionally leading supplier of equipment for trailers. The divi-sion accounts for more than 40 per cent of the global mar-ket for sliding roofs via the Edscha Trailer Systems and Sesam brands.
BRANDS
The VBG Group also has employees in Italy, Brazil, Turkey, South Africa, Canada and Thailand.
Importers/Agents Own companies

VBG GROUP INTERIM REPORT JANUARY–JUNE 2015
4
VBG Truck Equipment continues to improve products and develop its customer offering.
As expected, the Group’s turnover and earnings for the second
quarter were lower than the extremely strong first quarter.
However, year-on-year, both turnover and earnings increased
for all three divisions in the Group. This means that in the
second quarter, the Group posted turnover growth (rolling
four-quarter basis) of 4.5 per cent and earnings growth of
slightly more than 7 per cent.
VBG Truck Equipment – continues posting high-level performance
Following a top-class first quarter, the Group’s largest division
posted another strong quarter with an operating margin of close
to 15 per cent. For a long period, VBG Truck Equipment has
been the dependable engine room for the Group. In the first six
months of the year, the division accounted for slightly more than
half of the Group’s turnover and contributed almost 70 per cent
of the divisions’ total operating profit. Accordingly, VBG Truck
Equipment generates stability and financial security, not just
for the division itself, but also for the entire Group. Turn-
over growth and a strong earnings trend do not just
appear, they are generated through hard work. The
division has a constant desire to enhance products,
cultivate existing and new markets, develop the
customer offering and streamline processes.
Edscha Trailer Systems – acceptable earnings
in a weak market
The division continues to operate in a weak
market, but despite this, it has succeeded in
adapting the organization and streamlining pro-
cesses to achieve an operating margin for the
first six months of 7 per cent, which is a respecta-
ble level. I still hope, however, that the market condi-
tions will improve slightly toward the end of the year,
which will also provide the division’s new product range
with improved conditions for a successful market launch.
Ringfeder Power Transmission – vigorous growth and
a changing global organization
Efforts are ongoing to increase efficiency at and consolidate
Tschan, which was acquired 1 July 2014, and will continue for
the remainder of the year. In parallel, the division has invested
resources during the year to strengthen, expand and change the
organization with measures including new recruitments at
management level, primarily in the supply chain and sales/
marketing.
VBG Group’s largest division generates continued healthy profitability for the Group
VBG GROUP INTERIM REPORT JANUARY–JUNE 2015
5
The substantial increase in turnover in the second quarter and
the first half of the year was mainly attributable to the acquisition
of Tschan. However, the acquisition’s impact on earnings remains
extremely modest and, accordingly, this means that the operating
margin for the division is lower than in the year-earlier period. The
division is active globally in many industrial segments. One key
area is the mining industry and the weak market in this particular
segment has a relatively high degree of impact on the division.
Market outlook for the second half of 2015
In terms of the divisions’ market trends, I expect no major
changes in the third quarter but, hopefully, as the end of the
year approaches there will be a slight increase in activity and,
perhaps, primarily in the two vehicle-related divisions.
Anders Birgersson
Managing Director and CEO
VBG GROUP INTERIM REPORT JANUARY–JUNE 2015
6
Group trend
SEK M6 months
2015Q2
2015Q1
2015Full-year
2014Q4
2014Q3
20146 months
2014Q2
2014Q1
2014 Full-year
2013Q4
2013Q3
2013
Net turnover 686.6 331.5 355.1 1,186.8 303.4 289.9 593.5 277.1 316.4 1,171.4 294.4 280.0
Operating profit 86.4 30.7 55.7 120.94 –28.23 71.52 77.61 27.01 50.6 162.8 37.4 39.0
Operating margin, % 12.6 9.3 15.7 10.2 –9.3 24.7 13.1 9.7 16.0 13.9 12.7 13.9
Profit/loss after financial items 85.3 29.8 55.5 112.7 –29.7 70.1 72.3 23.6 48.7 151.7 33.1 37.2
Profit margin, % 12.4 9.0 15.6 9.5 –9.8 24.2 12.2 8.5 15.4 13.0 11.2 13.3
Profit/loss after tax 61.2 20.7 40.5 78.9 –37.8 64.2 52.5 17.0 35.5 112.5 25.8 27.1
Earnings per share, SEK 4.89 1.65 3.24 6.31 –3.02 5.13 4.20 1.36 2.84 9.0 2.07 2.16
Equity per share 66.65 66.65 68.92 65.40 65.40 66.19 62.28 62.28 61.92 58.99 58.99 54.95
Cash flow from operating activities per share 6.73 2.77 3.96 9.81 3.28 1.73 4.8 1.47 3.33 10.3 3.03 2.50
ROCE (cumul.), % 16.8 16.8 21.2 12.5 12.5 20.4 16.7 16.7 21.8 18.5 18.5 18.9
ROE (cumul.), % 14.8 14.8 19.3 10.1 10.1 19.8 13.9 13.9 18.8 16.5 16.5 17.6
Equity/assets ratio, % 66.8 66.8 67.1 67.6 67.6 68.7 69.0 69.0 68.2 68.8 68.8 63.3
1 Includes item affecting comparability, SEK 6.0 M in capital gains from the divestment of Armaton2 Includes item affecting comparability, SEK 46.8 M in negative goodwill from the acquisition of Tschan GmbH3 Includes item affecting comparability, negative SEK 60.0 M in impairment of goodwill in Edscha Trailer Systems4 Includes negative SEK 7.2 M, net effect of the three items affecting comparability 1 + 2 + 3
NET TURNOVER, SEK M PROFIT AFTER FINANCIAL ITEMS*, SEK M
0
60
30
90
120
150
180
2012Q2 Q3 Q4 Q1 Q2 Q3 Q4 Q1Q1 Q2 Q2Q3 Q4
2013 2014
0
30
20
10
50
40
60
2015
Quarterly figures Rolling 4 quarters
01753505257008751,0501,2251,400
2012 2013 2014
Quarterly figures Rolling 4 quarters
050
100150200250300350400
2015
Q2 Q3 Q4 Q1 Q2 Q3 Q4 Q1Q1 Q2 Q2Q3 Q4
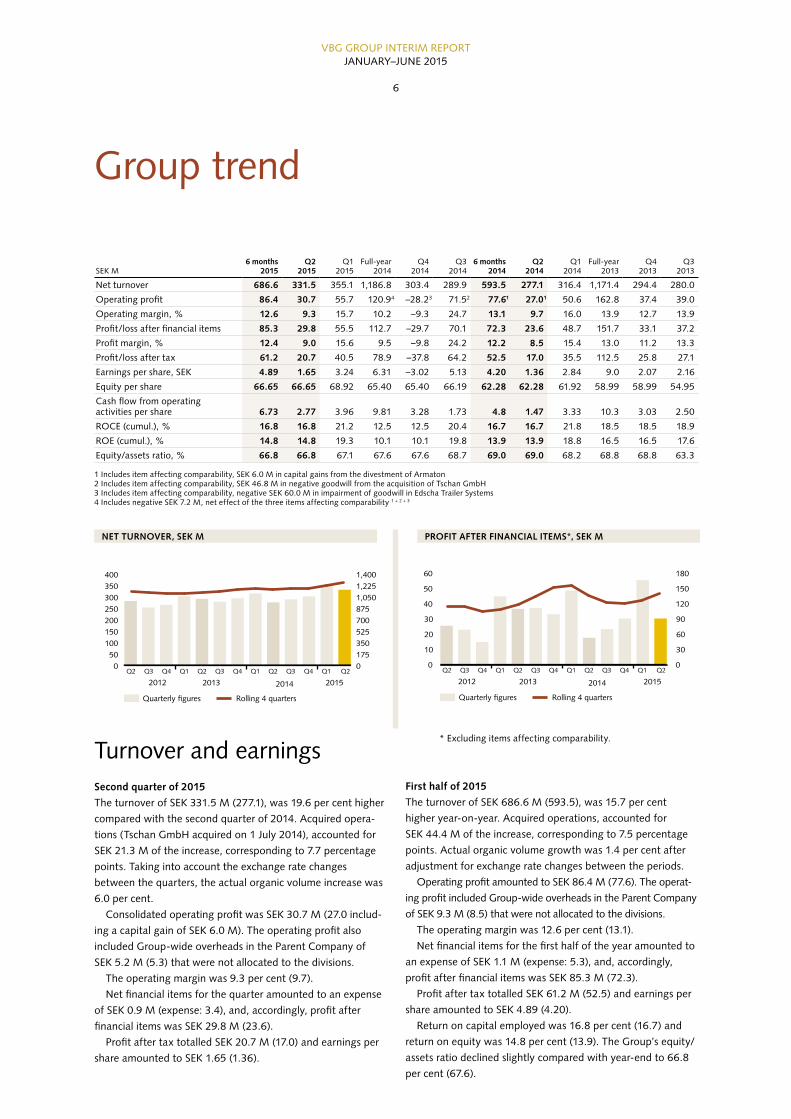
Turnover and earnings Second quarter of 2015
The turnover of SEK 331.5 M (277.1), was 19.6 per cent higher
compared with the second quarter of 2014. Acquired opera-
tions (Tschan GmbH acquired on 1 July 2014), accounted for
SEK 21.3 M of the increase, corresponding to 7.7 percentage
points. Taking into account the exchange rate changes
between the quarters, the actual organic volume increase was
6.0 per cent.
Consolidated operating profit was SEK 30.7 M (27.0 includ-
ing a capital gain of SEK 6.0 M). The operating profit also
included Group-wide overheads in the Parent Company of
SEK 5.2 M (5.3) that were not allocated to the divisions.
The operating margin was 9.3 per cent (9.7).
Net financial items for the quarter amounted to an expense
of SEK 0.9 M (expense: 3.4), and, accordingly, profit after
financial items was SEK 29.8 M (23.6).
Profit after tax totalled SEK 20.7 M (17.0) and earnings per
share amounted to SEK 1.65 (1.36).
First half of 2015
The turnover of SEK 686.6 M (593.5), was 15.7 per cent
higher year-on-year. Acquired operations, accounted for
SEK 44.4 M of the increase, corresponding to 7.5 percentage
points. Actual organic volume growth was 1.4 per cent after
adjustment for exchange rate changes between the periods.
Operating profit amounted to SEK 86.4 M (77.6). The operat-
ing profit included Group-wide overheads in the Parent Company
of SEK 9.3 M (8.5) that were not allocated to the divisions.
The operating margin was 12.6 per cent (13.1).
Net financial items for the first half of the year amounted to
an expense of SEK 1.1 M (expense: 5.3), and, accordingly,
profit after financial items was SEK 85.3 M (72.3).
Profit after tax totalled SEK 61.2 M (52.5) and earnings per
share amounted to SEK 4.89 (4.20).
Return on capital employed was 16.8 per cent (16.7) and
return on equity was 14.8 per cent (13.9). The Group’s equity/
assets ratio declined slightly compared with year-end to 66.8
per cent (67.6).
* Excluding items affecting comparability.
VBG GROUP INTERIM REPORT JANUARY–JUNE 2015
7
Capital expenditures
The Group’s new capital expenditures during the second
quarter amounted to SEK 10.0 M (11.8), while total capital
expenditures for the first half of the year amounted to
SEK 13.7 M (15.8).
Financial position
Profit after tax for the first six months of the year amounted to
SEK 61.2 SEK M (52.5). Other comprehensive income during
the first half of the year was a negative amount of SEK 8.1 M
(23.0), corresponding to a total operating profit of SEK 53.1 M
(75.5). After the payment of dividends totalling SEK 37.5 M
(34.4) to the shareholders, equity amounted to SEK 833.2 M
at 30 June (817.6 at year-end).
The equity/assets ratio declined slightly compared with
year-end to 66.8 per cent (67.6).
Cash and cash equivalents at the end of June amounted to
SEK 186.3 M (195.6 at year-end), and there were unutilised
credit facilities of SEK 142.9 M (144.1), resulting in an available
liquidity of SEK 329.2 M (339.7 at year-end).
While the Group’s interest-bearing net debt (including pen-
sion liability) increased SEK 24.5 M in the second quarter, the
increase for the first half of the year was only SEK 0.3 M,
amounting to SEK 16.9 M at 30 June (16.3 at year-end).
The ratio of interest-bearing net debt to equity was 0.02 at
30 June (0.02 at 31 December 2014).
The Group’s aggregate goodwill amounted to SEK 264.3 M
(266.8 at year-end), which in relation to equity was a ratio of
0.32 (0.33).
Cash flow
Cash flow from operating activities during the first half of the
year amounted to SEK 48.0 M (26.8). Paid capital expendi-
tures during the period amounted to SEK 16.3 M (17.6). Divi-
dends totalling SEK 37.5 M (34.4) were paid to the sharehold-
ers. The Group’s total non-current and current financial
liabilities decreased during the first half of the year by a net of
SEK 3.2 M (4.9). Consequently, net cash flow for the period
was a negative amount of SEK 9.0 M (negative: 30.1).
Personnel
At 30 June 2015, there were 622 employees in the VBG Group
(612 at year-end), including 184 (175) in Sweden.
During the first half of the year, the Group employed an
average of 594 persons (525 during the year-earlier period).
Of these, 181 (185) were active in Sweden. The cost of salaries
and social security contributions was SEK 185.1 M (148.2).
Per share data
Earnings per share for the first six months of the year rose to
SEK 4.89 (4.20). Equity per share was SEK 66.65 at 30 June
2015, compared with SEK 62.28 at the same time last year
and SEK 65.40 at year-end.
The number of shareholders declined by 100 in the second
quarter and amounted to 4,209 at 30 June (4,001 at year-
end).

VBG GROUP INTERIM REPORT JANUARY–JUNE 2015
8
Second quarter of 2015:• Turnover increased by 13.1 per cent to
SEK 172.6 M (152.6)• Operating profit was SEK 25.0 M (23.3), with a
margin of 14.5 per cent (15.3)
Second quarter of 2015
Turnover in VBG Truck Equipment increased by 13.1 per cent
to SEK 172.6 M (152.6).
The translation of the turnover of foreign subsidiaries to SEK
had a positive impact and the actual volume increase was 8.7
per cent.
The operating profit of SEK 25.0 M was up slightly year-on-
year (23.3) despite the positive impact on last year’s earnings of a
capital gain of SEK 6 M from the divestment of the Armaton
product area. The operating margin was 14.5 per cent (15.3).
VBG Truck Equipment
First half of 2015:• Turnover increased by 10.0 per cent to SEK 361.2 M (328.3)
• Operating profit was SEK 64.4 M (57.0), with a margin of 17.8 per cent (17.4)
First half of 2015
Turnover increased 10.0 per cent to SEK 361.2 M (328.3). Tak-
ing into account the translation of the turnover of foreign sub-
sidiaries to SEK, the actual volume increase was 4.8 per cent.
Operating profit increased to SEK 64.4 M (57.0), with an
operating margin of 17.8 per cent (17.4).
0
200
400
600
800
2012 2013 2014
0
50
100
150
200
2015Q2 Q3 Q4 Q1 Q2 Q3 Q4 Q1Q1 Q2 Q2Q3 Q4
Quarterly figures Rolling 4 quarters
0
40
80
120
160
2012 2013 2014
0
10
30
20
40
2015
Q2 Q3 Q4 Q1 Q2 Q3 Q4 Q1Q1 Q2 Q2Q3 Q4
Quarterly figures Rolling 4 quarters
NET TURNOVER, SEK M ADJUSTED OPERATING PROFIT, SEK M
KEY FIGURES
SEK M6 months
2015 Q2 2015 Q1 2015Full-year
2014 Q4 2014 Q3 20146 months
2014 Q2 2014 Q1 2014Full-year
2013 Q4 2013 Q3 2013
Net turnover 361.2 172.6 188.6 636.6 166.9 141.4 328.3 152.6 175.7 650.2 167.3 155.3
Operating profit 64.4 25.0 39.4 103.71 29.5 17.2 57.01 23.31 33.7 116.2 29.9 28.8
Operating margin, % 17.8 14.5 20.9 16.3 17.7 12.2 17.4 15.3 19.2 17.9 17.9 18.5
1 Includes items affecting comparability, SEK 6.0 M in capital gains in connection with the divestment of the Armaton product area.
TURNOVER BY MARKET
SEK M6 months
2015 Q2 2015 Q1 2015Full-year
2014 Q4 2014 Q3 20146 months
2014 Q2 2014 Q1 2014Full-year
2013 Q4 2013 Q3 2013
Sweden 97.8 48.0 49.8 174.4 42.1 35.5 96.8 44.6 52.2 168.4 41.6 38.2
Other Nordic countries 64.3 30.9 33.4 106.8 24.9 22.7 59.2 26.7 32.5 116.2 32.0 27.6
Germany 51.1 24.7 26.4 90.8 20.7 23.7 46.4 22.2 24.2 100.6 24.5 22.8
Other European countries 85.8 39.3 46.5 143.8 37.3 32.9 73.6 34.9 38.7 150.0 39.3 37.0
North America 33.7 15.6 18.1 59.1 21.2 13.6 24.3 10.8 13.5 56.9 19.1 14.0
Rest of world 28.5 14.1 14.4 61.7 20.7 13.0 28.0 13.4 14.6 58.1 10.8 15.7
VBG Truck Equipment 361.2 172.6 188.6 636.6 166.9 141.4 328.3 152.6 175.7 650.2 167.3 155.3

VBG GROUP INTERIM REPORT JANUARY–JUNE 2015
9
0
80
160
240
320
400
2012 2013 2014
0
20
40
60
100
80
2015
Q2 Q3 Q4 Q1 Q2 Q3 Q4 Q1Q1 Q2 Q2Q3 Q4
Quarterly figures Rolling 4 quarters
4
0
12
8
16
24
20
0
2
4
10
8
6
12
2012
Q2 Q3 Q4 Q1 Q2 Q3 Q4 Q1Q1 Q2 Q2Q3 Q4
2013 2014 2015
Quarterly figures Rolling 4 quarters
NET TURNOVER, SEK M ADJUSTED OPERATING PROFIT, SEK M
Edscha Trailer Systems
First half of 2015:• Turnover decreased by 6.9 per cent to SEK 116.8 M (125.5)
• Operating profit was SEK 8.1 M (10.1), with a margin of 6.9 per cent (8.0)
First half of 2015
Turnover decreased by 6.9 per cent compared with the first six
months of last year to SEK 116.8 M (125.5). Adjusted for
exchange rate changes, the actual volume decrease was 10.8
per cent. The operating profit was slightly lower at SEK 8.1 M
(10.1), with an operating margin of SEK 6.9 per cent (8.0).
KEY FIGURES
SEK M6 months
2015 Q2 2015 Q1 2015Full-year
2014 Q4 2014 Q3 20146 months
2014 Q2 2014 Q1 2014Full-year
2013 Q4 2013 Q3 2013
Net turnover 116.8 58.4 58.4 219.8 49.2 45.1 125.5 56.8 68.7 254.6 62.0 59.3
Operating profit/loss 8.1 3.2 4.9 –52.71 –61.61 –1.2 10.1 2.9 7.2 22.9 4.7 3.5
Operating margin, % 6.9 5.5 8.4 –24.0 –125.2 –2.7 8.0 5.1 10.5 9.0 7.6 5.9
1 Includes item affecting comparability, negative SEK 60.0 M in impairment of consolidated goodwill in Edscha Trailer Systems
TURNOVER BY MARKET
SEK M6 months
2015 Q2 2015 Q1 2015Full-year
2014 Q4 2014 Q3 20146 months
2014 Q2 2014 Q1 2014Full-year
2013 Q4 2013 Q3 2013
Sweden 0.2 0.1 0.1 0.3 0.1 0.0 0.2 0.1 0.1 0.5 0.1 0.1
Other Nordic countries 0.6 0.3 0.3 0.6 0.2 0.1 0.3 0.2 0.1 1.0 0.2 0.0
Germany 71.9 38.6 33.3 136.3 33.3 28.7 74.3 32.4 41.9 140.0 34.1 32.3
Other European countries 43.2 19.0 24.2 82.3 15.6 16.1 50.6 24.0 26.6 112.5 27.3 26.8
Rest of world 0.9 0.4 0.5 0.3 0.0 0.2 0.1 0.1 0.0 0.6 0.3 0.1
Edscha TS 116.8 58.4 58.4 219.8 49.2 45.1 125.5 56.8 68.7 254.6 62.0 59.3
Second quarter of 2015:• Turnover increased by 2.8 per cent to SEK 58.4 M (56.8)
• Operating profit was SEK 3.2 M (2.9), with a margin of 5.5 per cent (5.1)
Second quarter of 2015
Edscha Trailer Systems’ turnover increased by 2.8 per cent
compared with the year-earlier period to SEK 58.4 M (56.8).
The translation of the turnover of the Group’s foreign subsidi-
aries to SEK had a positive impact, and thus the actual sales
volume was at the same level as last year. The European mar-
ket for trailers continued to be soft, which impacted all players
in the industry. Despite low turnover, the division reported an
operating margin of 5.5 per cent (5.1) and operating profit of
SEK 3.2 M (2.9).
VBG GROUP INTERIM REPORT JANUARY–JUNE 2015
10
2012Q2 Q3 Q4 Q1 Q2 Q3 Q4 Q1Q1 Q2 Q2Q3 Q4
2013 2014 2015
0
25
50
75
100
125
0
100
200
300
400
Quarterly figures Rolling 4 quarters
0
15
30
45
60
0
5
15
10
20
2012Q2 Q3 Q4 Q1 Q2 Q3 Q4 Q1Q1 Q2 Q2Q3 Q4
2013 2014 2015
Quarterly figures Rolling 4 quarters
NET TURNOVER, SEK M ADJUSTED OPERATING PROFIT, SEK M
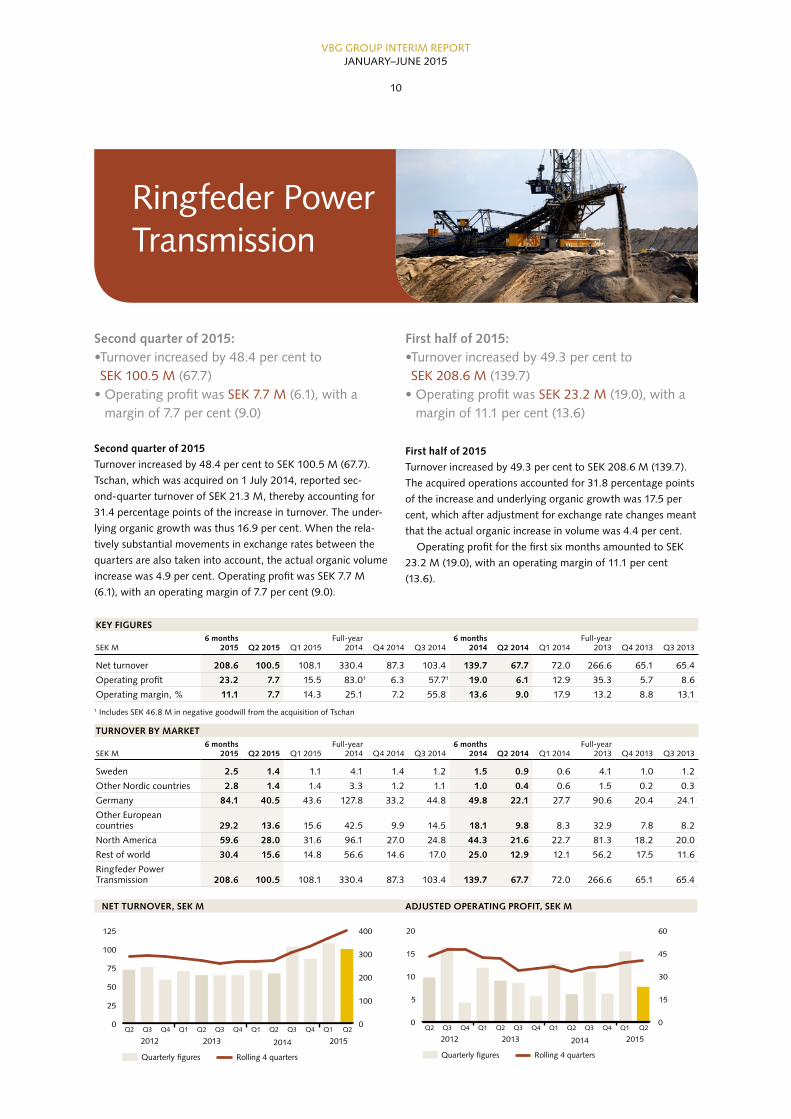
Ringfeder Power Transmission
Second quarter of 2015:• Turnover increased by 48.4 per cent to SEK 100.5 M (67.7)
• Operating profit was SEK 7.7 M (6.1), with a margin of 7.7 per cent (9.0)
Second quarter of 2015
Turnover increased by 48.4 per cent to SEK 100.5 M (67.7).
Tschan, which was acquired on 1 July 2014, reported sec-
ond-quarter turnover of SEK 21.3 M, thereby accounting for
31.4 percentage points of the increase in turnover. The under-
lying organic growth was thus 16.9 per cent. When the rela-
tively substantial movements in exchange rates between the
quarters are also taken into account, the actual organic volume
increase was 4.9 per cent. Operating profit was SEK 7.7 M
(6.1), with an operating margin of 7.7 per cent (9.0).
First half of 2015:• Turnover increased by 49.3 per cent to SEK 208.6 M (139.7)
• Operating profit was SEK 23.2 M (19.0), with a margin of 11.1 per cent (13.6)
First half of 2015
Turnover increased by 49.3 per cent to SEK 208.6 M (139.7).
The acquired operations accounted for 31.8 percentage points
of the increase and underlying organic growth was 17.5 per
cent, which after adjustment for exchange rate changes meant
that the actual organic increase in volume was 4.4 per cent.
Operating profit for the first six months amounted to SEK
23.2 M (19.0), with an operating margin of 11.1 per cent
(13.6).
KEY FIGURES
SEK M6 months
2015 Q2 2015 Q1 2015Full-year
2014 Q4 2014 Q3 20146 months
2014 Q2 2014 Q1 2014Full-year
2013 Q4 2013 Q3 2013
Net turnover 208.6 100.5 108.1 330.4 87.3 103.4 139.7 67.7 72.0 266.6 65.1 65.4
Operating profit 23.2 7.7 15.5 83.01 6.3 57.71 19.0 6.1 12.9 35.3 5.7 8.6
Operating margin, % 11.1 7.7 14.3 25.1 7.2 55.8 13.6 9.0 17.9 13.2 8.8 13.1
1 Includes SEK 46.8 M in negative goodwill from the acquisition of Tschan
TURNOVER BY MARKET
SEK M6 months
2015 Q2 2015 Q1 2015Full-year
2014 Q4 2014 Q3 20146 months
2014 Q2 2014 Q1 2014Full-year
2013 Q4 2013 Q3 2013
Sweden 2.5 1.4 1.1 4.1 1.4 1.2 1.5 0.9 0.6 4.1 1.0 1.2
Other Nordic countries 2.8 1.4 1.4 3.3 1.2 1.1 1.0 0.4 0.6 1.5 0.2 0.3
Germany 84.1 40.5 43.6 127.8 33.2 44.8 49.8 22.1 27.7 90.6 20.4 24.1
Other European countries 29.2 13.6 15.6 42.5 9.9 14.5 18.1 9.8 8.3 32.9 7.8 8.2
North America 59.6 28.0 31.6 96.1 27.0 24.8 44.3 21.6 22.7 81.3 18.2 20.0
Rest of world 30.4 15.6 14.8 56.6 14.6 17.0 25.0 12.9 12.1 56.2 17.5 11.6
Ringfeder Power Transmission 208.6 100.5 108.1 330.4 87.3 103.4 139.7 67.7 72.0 266.6 65.1 65.4

VBG GROUP INTERIM REPORT JANUARY–JUNE 2015
11
Parent Company
VBG Group AB’s operations are focused on managing, devel-
oping and coordinating the Group. The assets in the Parent
Company consist primarily of shares in subsidiaries and trade-
marks. The company also owns the industrial property in
Vänersborg that is rented by the subsidiary VBG Group Truck
Equipment AB.
The objective is that the Group’s intellectual property in the
form of trademarks and other rights should be gathered in the
Parent Company. VBG Group AB focuses on maintaining and
developing all the Group’s trademarks and rights.
The Parent Company’s net turnover pertains primarily to
intra-Group services, license revenues and rentals and
amounted to SEK 10.3 M (9.9) during the first half of the year
. The operating loss for the year was SEK 11.8 M (loss: 9.1).
Profit after dividends from Group companies and net financial
items totaled SEK 58.5 M (58.4).
Accounting policies
The VBG Group applies International Financial Reporting
Standards (IFRSs) as adopted by the EU in its consolidated
accounts. This report has been prepared in accordance with
IAS 34, Interim Financial Reporting, and the Swedish Annual
Accounts Act.
The Parent Company’s financial statements have been pre-
pared in accordance with the Swedish Annual Accounts Act
and RFR 2.
The accounting policies that have been applied in the prepa-
ration of this report, as well as definitions of key figures, etc.,
are described in Note 1 of VBG Group AB’s annual report for
2014.
Risks and uncertainty factors
The Group’s and the Parent Company’s significant risks and
uncertainty factors include business-related operational risks
in the form of commodity risks, product risks, development
risks, intellectual property risks, environmental risks, political
risks, business interruption and property risks, cyclical risks, IT
security risks and legal risks. To these can be added financial
risks such as financing risks, liquidity risks, interest rate risks,
currency risks and credit and counterparty risks.
For a more detailed description of the Group’s risks and risk
management, see VBG Group AB’s annual report for 2014,
Note 2.
Outlook for 2015
The company makes no forecast.
Financial information 2015/2016
Interim report, nine months 21 October 2015
Year-end report 2015 17 February 2016
Interim report, three months 2016 28 April 2016
Annual General Meeting 2016 28 April 2016
Related party transactions
There have been no related party transactions in 2015 that
have significantly affected the company’s financial position
and results. Related party transactions during 2014 are dis-
closed in Note 6 in the annual report for 2014.
Affirmation
The Board of Directors and Managing Director affirm that the
interim report provides a true and fair view of the Parent Com-
pany’s and the Group’s operations, financial position and
results, and describes significant risks and uncertainty factors
facing the Parent Company and the companies included in the
Group.
Other information

VBG GROUP INTERIM REPORT JANUARY–JUNE 2015
12
Anders Birgersson Peter Hansson Johnny Alvarsson Managing Director and CEO Chairman Deputy Chairman
Peter Augustsson Helene Richmond Louise NicolinBoard member Board member Board member
NOTE
This information is of the type that VBG Group AB is obli-
gated to disclose in accordance with the Swedish Securities
Exchange and Clearing Operations Act and/or the Financial
Instruments Trading Act. The information was submitted for
publication on 20 August 2015 at 1:00 p.m.
Vänersborg, 20 August 2015
VBG Group AB (publ)
Press releases in the second quarter of 2015
Report from the AGM 2015 23 April 2015
Interim Report Jan-Mar 2015 23 April 2015
For further information, please contact:
Anders Birgersson, Managing Director and CEO
Telephone: +46 (0)521–27 77 67, +46 (0)702–27 77 78
E-mail: [email protected]
No significant events occurred after the close of the period.
This report is unaudited.
Michael Jacobsson Cecilia Pettersson Employee representative Employee representative

VBG GROUP INTERIM REPORT JANUARY–JUNE 2015
13
Consolidated Income Statement and Statement of Comprehensive Income – Highlights
SEK MQ2
Apr-Jun 2015Q2
Apr-Jun 20146 months
Jan-Jun 20156 months
Jan-Jun 2014Full-year
2014
Net turnover 331.5 277.1 686.6 593.5 1,186.8
Cost of goods sold –193.8 –170.0 –395.4 –348.3 –718.0
Gross profit 137.7 107.1 291.2 245.2 468.8
Selling expenses –53.6 –47.5 –107.7 –91.9 –190.1
Administrative expenses –40.5 –31.8 –76.7 –65.2 –120.3
Research and development costs –11.5 –8.7 –21.7 –17.5 –36.2
Other operating income and expenses –1.4 7.91 1.3 7.01 –1.31
Operating profit 30.7 27.0 86.4 77.6 120.9
Net financial items –0.9 –3.4 –1.1 –5.3 –8.2
Profit after financial items 29.8 23.6 85.3 72.3 112.7
Tax –9.1 –6.6 –24,1 –19.8 –33.8
Profit for the period 20.7 17.0 61.2 52.5 78.9
Net profit for the period attributable to Parent Company shareholders 20.7 17.0 61.2 52.5 78.9
Depreciation and amortisation charged to profit –10.6 –8.5 –20.9 –17.0 –37.5
Other comprehensive income
Profit for the period 20.7 17.0 61.2 52.5 78.9
Items that will not be reversed in the Income Statement
Effect of translation of defined-benefit pension plans, net after tax — — — — –28.7
Items that may later be reversed in the Income Statement
Translation differences pertaining to foreign operations –15.4 22.7 –9.5 23.8 68.6
Translation differences pertaining to hedge accounting for net investments in foreign operations 3.8 –0.8 1.4 –0.8 –4.3
Other comprehensive income, net after tax –11.6 21.9 –8.1 23.0 35.6
Comprehensive income for the period 9.1 38.9 53.1 75.5 114.5
Comprehensive income for the period attributable to Parent Company shareholders 9.1 38.9 53.1 75.5 114.5
Earnings per share, basic and diluted, SEK 1.65 1.36 4.89 4.20 6.31
Number of shares at end of period (‘000) 12,502 12,502 12,502 12,502 12,502
Average number of shares during the period 12,502 12,502 12,502 12,502 12,502
Number of own shares at end of period 1,192 1,192 1,192 1,192 1,192
Average number of own shares 1,192 1,192 1,192 1,192 1,192
1 Includes the following items affecting comparability: Capital gains of SEK 6.0 M in connection with the divestment of the Armaton product area (Q2). Negative goodwill of SEK 46.8 M in connection with the acquisition of Tschan (Q3). Cost for impairment of consolidated goodwill in Edscha Trailer Systems in the negative amount of SEK 60 M (Q4).Combined negative net effect of SEK 7.2 M for full-year 2014.

VBG GROUP INTERIM REPORT JANUARY–JUNE 2015
14
Turnover and earnings by segment
SEK M
VBG Truck Equipment
Edscha Trailer
Systems
Ringfeder Power
TransmissionGroup-
wide Group
2015
Q2 Apr–Jun: Net turnover 172.6 58.4 100.5 331.5
Operating profit/loss 25.0 3.2 7.7 –5.2 30.7
Operating margin, % 14.5 5.5 7.7 9.3
Net financial items –0.9 –0.9
Profit after financial items 29.8
6 months Jan–Jun: Net turnover 361.2 116.8 208.6 686.6
Operating profit/loss 64.4 8.1 23.2 –9.3 86.4
Operating margin, % 17.8 6.9 11.1 12.6
Net financial items –1.1 –1.1
Profit after financial items 85.3
2014
Q2 Apr–Jun: Net turnover 152.6 56.8 67.7 277.1
Operating profit/loss 23.31 2.9 6.1 –5.3 27.01
Operating margin, % 15.3 5.1 9.0 9.7
Net financial items –3.4 –3.4
Profit after financial items 23.6
6 months Jan–Jun: Net turnover 328.3 125.5 139.7 593.5
Operating profit/loss 57.01 10.1 19.0 –8.5 77.61
Operating margin, % 17.4 8.0 13.6 13.1
Net financial items –5.3 –5.3
Profit after financial items 72.3
1 Includes items affecting comparability, SEK 6.0 M in capital gains in connection with the divestment of the Armaton product area.
Consolidated Balance Sheet – Highlights
SEK M 30 Jun. 2015 30 Jun. 2014 31 Dec. 2014
Goodwill 264.3 308.7 266.8
Other intangible assets 52.4 46.8 57.7
Property, plant and equipment 192.1 161.1 200.8
Long-term investments 20.3 13.9 20.6
Total non-current assets 529.1 530.5 545.9
Inventories 276.6 243.2 251.1
Receivables 254.6 250.2 216.1
Cash on hand, demand deposits and short-term investments 186.3 103.9 195.6
Total current assets 717.5 597.3 662.8
TOTAL ASSETS 1,246.6 1,127.8 1,208.7
Equity 833.2 778.6 817.6
Non-current liabilities 243.6 194.2 253.8
Current liabilities 169.8 155.0 137.3
TOTAL EQUITY AND LIABILITIES 1,246.6 1,127.8 1,208.7
VBG GROUP INTERIM REPORT JANUARY–JUNE 2015
15
Changes in Group equity
SEK M 6 months 2015 6 months 2014 Full-year 2014
Opening equity according to balance sheet at 31 December 817.6 737.5 737.5
Total comprehensive income for the period 53.1 75.5 114.5
Dividend –37.5 –34.4 –34.4
Equity at end of period 833.2 778.6 817.6
Cash Flow Statement – Highlights
SEK M 6 months 2015 6 months 2014 Full-year 2014
Cash flow from operating activities before changes in working capital 84.2 60.0 122.7
Change in working capital –36.2 –33.2 14.5
Cash flow from operating activities 48.0 26.8 137.2
Cash flow from investing activities –16.3 –17.6 –39.9
Cash flow from financing activities –40.7 –39.3 –39.4
Cash flow for the period –9.0 –30.1 57.9
Cash and cash equivalents at start of year 195.6 131.5 131.5
Translation difference, cash and cash equivalents –0.3 2.5 6.2
Cash and cash equivalents at end of period 186.3 103.9 195.6
Unutilised overdraft facilities 142.9 142.8 144.1
Available cash and cash equivalents 329.2 246.7 339.7
Key figures for Group
SEK M 6 months 2015 6 months 2014 Full-year 2014
Profit margin (ROS), % 12.4 12.2 9.5
Return on equity (ROE), % 14.8 13.9 10.1
Return on capital employed (ROCE), % 16.8 16.7 12.5
Equity/assets ratio, % 66.8 69.0 67.6
Equity per share, SEK 66.65 62.28 65.40
Cash flow per share (before change in working capital), SEK 6.73 4.80 9.81
Share price at end of period, SEK 125.50 140.50 103.75
Number of employees, average 594 524 559

VBG GROUP INTERIM REPORT JANUARY–JUNE 2015
16
Parent Company Balance Sheet
SEK M 30 Jun. 2015 30 Jun. 2014 31 Dec. 2014
Intangible assets 7.4 9.2 8.4
Property, plant and equipment 8.4 7.0 6.8
Long-term investments 558.1 558.1 558.1
Total non-current assets 573.9 574.3 573.3
Receivables 90.4 98.4 90.1
Cash on hand, demand deposits and short-term investments 101.9 36.7 89.9
Total current assets 192.3 135.1 180.0
TOTAL ASSETS 766.2 709.4 753.3
Equity 499.4 421.1 478.4
Untaxed reserves 15.2 20.2 15.2
Provisions 12.2 11.2 12.0
Non-current liabilities 12.4 16.9 15.6
Current liabilities 227.0 240.0 232.1
TOTAL EQUITY AND LIABILITIES 766.2 709.4 753.3
Parent Company Income Statement
SEK M 6 months 2015 6 months 2014 Full-year 2014
Net turnover 10.3 9.9 22.0
Operating expenses –22.1 –19.0 –34.3
Operating loss –11.8 –9.1 –12.3
Net financial items 70.3 67.5 110.1
Profit after financial items 58.5 58.4 97.8
Appropriations — — 18.0
Tax 0.0 0.0 –0.1
Profit after tax and comprehensive income 58.5 58.4 115.7

www.vbggroup.com
VBG GROUP
SwedenVBG GROUP AB (publ) Box 1216SE-462 28 VänersborgTel +46 521 27 77 00Street address: Herman Kreftings gata 4
RINGFEDER POWER TRANSMISSION
GermanyRINGFEDER POWER TRANSMISSION GMBHWerner-Heisenberg-Straße 18 DE-64823 Groß-UmstadtTel +49 6078-9385-0Fax +49 6078-9385-100
RINGFEDER POWER TRANSMISSION TSCHAN GMBHPostfach 2166DE-66521 NeunkirchenTel +49 6821 866 0Fax +49 6821 866 4111
Czech RepublicRINGFEDER POWER TRANSMISSION S.R.O. Oty Kovala 1172CZ-33441 DobranyTel +420 377 201 511Fax +420 377 900 860
USARINGFEDER POWER TRANSMISSION USA CORPORATION165 Carver AvenueWestwood, N.J. 07675Tel +1 201 666 3320Fax +1 201 664 6053
IndiaRINGFEDER POWER TRANSMISSION INDIA PRIVATE LTDPlot No. 4, Door No. 220Mount Poonamallee High RoadKattuppakkamChennai-600056Tel +91 44 2679 1411Fax +91 44 2679 1422
ChinaKUNSHAN RINGFEDER POWER TRANSMISSION CO., LTD.No. 10, Dexin RoadZhangpu 215321Kunshan, Jiangsu ProvinceTel +86 512 5745 3960Fax +86 512 5745 3961
EDSCHA TRAILER SYSTEMS
Germany EUROPEAN TRAILER SYSTEMS GMBHIm Moerser Feld 1fDE-47441 MoersTel +49 2841 6070 700Fax +49 2841 6070 777
Czech RepublicEUROPEAN TRAILER SYSTEMS S.R.O.Ke Gabrielce 786CZ-39470 Kamenice nad LipouTel +420 565 422 402Fax +420 565 422 405
VBG TRUCK EQUIPMENT
Sweden VBG GROUP TRUCK EQUIPMENT AB Box 1216SE-462 28 VänersborgTel +46 521 27 77 00, Fax +46 521 27 77 90
GermanyVBG GROUP TRUCK EQUIPMENT GMBHPostfach 13 06 55DE-47758 KrefeldTel +49 2151 835-0Fax +49 2151 835-200/207
DenmarkVBG GROUP SALES A/SIndustribuen 20–22DK-5592 EjbyTel +45 64 46 19 19Fax +45 64 46 10 88
NorwayVBG GROUP SALES ASPostboks 94 LeirdalNO-1009 OsloTel +47 23 14 16 60Fax +47 23 14 16 61
UKVBG GROUP SALES LIMITEDUnit 9, Willow CourtWest Quay Road, Winwick QuayWarrington, Cheshire WA2 8UFTel +44 1925 23 41 11Fax +44 1925 23 42 22
BelgiumVBG GROUP TRUCK EQUIPMENT NVIndustrie Zuid Zone 2.2Lochtemanweg 50BE-3580 BeringenTel +32 11 458 379Fax +32 11 458 378
USAONSPOT OF NORTH AMERICA, INC.P.O. Box 1077North Vernon, IN 47265-5077Tel +1 800 224 2467Fax +1 812 346 1819
Branch:555 Lordship BlvdStratford, CT 06615-7124Tel +1 800 766 7768Fax +1 203 380 0777
FranceONSPOT E.U.R.L14 Route de SarrebruckFR-57645 Montoy-FlanvilleTel +33 387 763 080Fax +33 387 761 944