Embed Size (px)
Citation preview

~Hcrohjologieal Analysis ofVater Quality of Eyewash Stations in Faculty of R(~source Science and
Technology and External Laboratory
Fairuz Awatif Binti Ismail (34824)
Bachelor of Science with Honours (Resource Biotechnology)
2015
Acknowledgement
First of all I would like to express my deepest appreciation to all those who gave
me the possibility to complete this project A special gratitude I give to my supervisor Dr
Lee Kui Soon for giving me the opportunity to work under his guidance contribution in
stimulating suggestions and encouragement and helped me to coordinate my project
especially in writing this report Besides I would also like to appreciate the guidance given
by my co-supervisor Dr Samuel Lihan and acknowledge with much appreciation the
postgraduates in Animal Biotech Lab Proteomics Lab and Virology Lab for giving their
cooperation to use the equipment and necessary materials in order to complete this project
A special thanks goes to my parents for the unceasing encouragement support and
attention I am also grateful to have my family team mates and friends who helping me
survive all the stress and not letting me give up while doing this project
I
Declaration
Fairuz Awatif binti Ismail hereby declare that the work entitled Microbiological
Analysis of Water Quality of Eyewash Stations in Faculty of Resource Science and
Technology and External Laboratory is my original work I have not copied from any other
students work or from any other sources except where due reference or acknowledgement
is made explicitly in the text nor has any part been written for me by another person
Date submitted Fairuz Awatif binti Ismail (34824)
ii
Table of Contents
Acknowledgement
Declaration 11
List of Abbreviations III
List of Tables and Figures v
Abstract
10 Introduction 2
20 Literature Review 4
21 Eyewash Stations
22 Microbial Growth
23 Biofilm
24 (GTG)s PCR Fingerprinting
25 Amplification of 16s rRNA
30 Methodology 8
31 Collection ofWater and Swab Samples
32 Samples Processing
33 Bacteria Isolation
34 DNA Extraction
35 (GTG)s PCR Fingerprinting
36 Agarose Gel Electrophoresis (AGE)
37 Amplification of 16s rRNA by using PCR
38 Purification ofPCR Products
40 Results 16
iii
I ___ ______________
--
-- - - -
41 Enumeration of Bacteria
42 (GTG)s PCR Fingerprinting
43 Amplification of 16S rRNA by using PCR
50 Discussion 27
51 Enumeration of Bacteria
52 (GTG)s PCR Fingerprinting
53 Amplification of 16S rRNA by using PCR
60 Conclusion and Recommendation 33
70 References 34
Appendix A 37
Appendix B 39
Appendix C 40
iv
-----
List of Abbreviations
III Microliter
Ilm Micrometer
ANSI American National Standard Institute
DNA Deoxyribonucleic acid
dNTP Deoxyribonucleotide triphosphate
EtBr ethidium bromide
gpm gallons per minute
MgCh magnesium chloride
NJTREE neighbour joining tree
PCR Polymerase Chain Reaction
pSI pounds per square inch
rpm revolutions per minute
TAE Tris-Acetate-EDT A
UV Ultraviolet
V Volt
v
I
- ------ -----
I
List of Tables
Table
31 The location and source code for the emergency eyewash 8
I stations
I 32 The format used to label the isolates 9
33 peR reaction set-up for (GTG)5 II
34 (GTG)5 peR amplification conditions 12
35 peR reaction set-up for amplification of 16S rRNA 13
36 The primer sequence and expected size of the peR product 13
37 (GTG)5 peR amplification conditions 14
41 The number of cells (colony-forming units) formed per 16
millilitre of original sample
42 The Isolation code identity and similarity of the isolates after 26
using BLAST search at NeBI
vi
----
List of Figures
Figures
41 The colonies formed on the nutrient agar following spread 17
plate method
42 (GTG)s peR agarose gel result 18
43 (GTG)s peR agarose gel result 19
44 (GTG)s peR agarose gel result 20
45 (GTG)s peR agarose gel result 21
46 (GTG)s peR agarose gel result 22
47 (GTG)s peR agarose gel result 23
48 Dendrogram based on (GTG)s peR 24
49 Amplification of 16s rRNA result 25
vii
Microbiological AnalysisofWater Quality of Eye-wash Stations in Faculty of Resource Science and Technology and External Laboratory
Fairuz Awatif binti Ismail (34824)
Resource Biotechnology Faculty of Resource Science and Technology
Universiti Malaysia Sarawak
ABSTRACT
Emergency eyewash station is a very important component that provides the laboratories with emergency aid during experimental accidents In this project microbiological water quality of the emergency eyewash stations in Faculty of Resource Science and Technology and External Laboratory were determined Samples of water and swabs were collected from 6 eyewash stations in Faculty of Resource Science and Technology and 3 eyewash stations in External Laboratory These samples were analysed for the presence of bacteria The samples were transferred onto a Nutrient Agar spread on it and incubated for overnight at 37dege to grow the bacteria The bacteria colonies were isolated and streaked onto new nutrient agar to obtain pure bacterial culture The bacterial DNA were extracted from the bacteria isolates by boiling-centrifugation method The genetic variations among the bacteria were analysed using (GTG)s peR The phylogenetic tree was constructed based on the DNA fingerprinting to illustrate the relationship among the bacteria isolates From the dendrogram constructed 11 representative isolates were chose to undergo amplification of the 16s rRNA for sequencing The 11 isolates were recognized to be from 9 species which are Lysinibacillus sphaericus Cupriavidus metallidurans Staphylococcus epdermidis Sphingomonas wittichii Brevibacillus brevis Delftia acidovorans Bacillus pumilus Kocwia rhizophila and Bacillus thuringiensis in which the bacteria can cause human infections that may harm the users
Keywords microbiological analysis (GTG)s peR 16s RNA phylogenetic tree
ABSTRAK
Slesen cuci mata keselamatan merupakan komponen yang amat penting dalam menyediakan bantuan kecemasan semasa berlakunya kemalangan di makmal Dalam projek ini kualiti air di Slesen-stesen cuci mata keselamatan di Fakulti Sains dan Teknologi Sumber dan Makmal Luar dilentukan dari segi mikrobiologikal SlWtpel-sampel air dan swab diambil dari 6 stesen cuci mata keseamatan di Fakulti Sa ins dan Teknologi Sumber dan 3 stesen cuci mata keselamatan di Malanal Luar Sampel-sampel ini dianalisis untuk kehadiran bakteria Sampel-sampel tersebut dipindahkan ke agar nutrien dan diinkubasi semalaman pada suhu 3 lOC bertujuan untuk menghidupkan bakteria Koloni-koloni bakteria diasingkan dan dicoreng pada agar nutrien yang bani untuk mendapatkan kutur bakteria tulen DNA bakteria diekstrak menggunakan kaedah didih-pintal Variasi genetik antara bakteria dianalisis melalui (GTG)s PCR Pokok filogenetik dibina berdasarkan cap jari DNA untuk menggambarkan hubungan antara bakteria Berdasarkan dendrogram 11 bakteria dipilih untuk menjalani amplifikasi 16s rRNA 11 bakteria tersebut dikena pasti terdiri daripada 9 spesiesi iaitu Lysinibacillus sphaericus Cuprialidus melallidurans Staphylococcus epidermidis Sphingomonas wittichii Brevibacillus brevis De(fiia acidolorans Bacillus pumilus Kocuria rhizophila and Bacillus thuringiensis di mana bakteriashyhakteria tersebut boleh menyebabkanjangkilan kepada manllsia
Kala kmci analisis mikrobiologikal (GTG)s PCR 16s RNA pokokfilogenetik
1
- --------
10 Introduction
Emergency eyewash station provides the laboratories with emergency aid during
experimental accidents The main purpose of the eyewash station is to bathe the eyes that
are attacked by hazardous chemicals with a substantial amount of water while allowing
hands to hold the eyelids open For more than 100 years tap water has been used as the
source of water for the eyewash stations (Safety com nd)
There are microorganisms and bacteria that are commonly found in the tap water
makjng it contaminated such as Acanthamoeba Pseudomonas aeurginosa anteric bacilli
and Entamoeba in which some of these are proven to cause eye infection Besides there is
a high possibility that the water in the tap is contaminated by animals such as mouse that
might urinate in the water source The eyes defense system is reduced when it is under
attacked by hazardous chemicals and the contaminated tap water will increase the risk of
eye infection (Hurley 2000)
The total number of people that are died from waterborne disease is approximately
34 million each year as stated by World Health Organization (rapidmicrobiologycom
nd) The waterborne disease is caused through the contact with or consumption of water
that contain the pathogenic microorganisms This shows that the pathogenic
microorganisms that exist in water calYOOuse a severe effect on people
The purpose of this study is to analyse the microbes in the water of the eyewash
stations in the Faculty of Resource Science and Technology and External Laboratory The
objectives of this experiment are to
I) Isolate the microbes that exist in the water of the eyewash stations
2) Identify the microbes by sequencing results of the amplification of 16s rRNA gene
2
Problem statement
There are a few water dispenser stations In FRST that have been assessed to contain
bacteria Leptospira sp that may cause leptospirosis which will harm the users Due to the
water dispenser stations and some emergency eyewash stations that shared the same
sources of water the microbiological water quality of water from emergency eye-wash
stations in FRST and External Laboratory will be analysed to determine whether microbes
that presence in the water can cause infection to the eyes and give harm to the users
3
---- shy
20 Literature Review
21 Eyewash Station
There are two major categories of eyewash station which are plumbed units and
portable units For plumbed units the water supply must be at 30 psi and flow
simultaneously at a low velocity into both eyes to reduce eye injury Both categories of the
eyewash stations are installed between 33 inches and 45 inches above the ground and 6
inches away from the wall This position ofthe eyewash station will allow enough space to
hold the eyelids open with the hands while the water is flowing For an eyewash only
station the flow of water must be supplied at 04 gpm for 15 minutes whereas for an
eyewash that is combined with face wash unit the flow of water must be supplied at 3 gpm
for 15 minutes These two units are differ in the size of the nozzle and spray pattern The
nozzles have to face upward in order for the eyewash station to functionally operate and
must be protected to prevent any contaminants that may clog the openings or provide a
suitable condition that will allow microorganisms to breed (Cameron 2001)
22 Microbial Growth
Microbial growth is one oifRe major concerns of emergency eyewash safety that
regular flushing of the eyewash is a mandated part of the ANSI standard (ANSI Z3581shy
2004) As described by Bowman et al (1996) through the experiments on flushing
eyewash and shower systems flushing of a plumbed system will help to lower the
microbial growth The microbial growth will develop if the systems are not well
maintained and if the water in the system remains stagnant for a long period of time
Hurley 2000)
4
-----
In 1999 a ~urvey was conducted by Fendall Company on 200 manufacturing facilities and
58 of the eyewash stations were found to contain the pseudomonas bacteria (Hurley
2000) Besides the Pseudomonas spp Legionella spp and Amoeba also have been isolated
from the eyewash stations based on the experiment conducted by Paszko-Kolva et al
(1990) Eye infections caused by Acanthamoeba spp and Pseudomonas spp is generally
resistant to antibiotic therapy The growth of Legionella spp is helped by the temperature
of eyewash stations tepid water range (16degC-38degC) that overlaps with the ideal growth
temperature ofLegionella spp (35degC) The primary route of infection of Legionella spp is
via inhalation
The body defense system will be greatly reduced when under attack by hazardous
chemical and thus exposure to these microbes at the time of body being attacked will
increase the risk of infection (Hurley 2000)
23 Biofilm
Biofilm will be formed if the eyewash station is left with little maintenance It may
attach to the inside surface of the water line or self-contained device and continue to grow
where it will provide a source of bacterial contamination that cannot be removed by
periodic flushing (Hurley 2000) ~films are recognized as microbial communities that
consist of a variety of microbial cells including the pathogens such as
Salmonella Typhimurium Campylobacter Pseudomonas aeruginosa and Aeromonas
hydrophila It develops over time to become more complex and extensive thus protect
individual bacterial cells from any antimicrobial compounds in water including chlorine
Most of the bacteria found in drinking water distribution system is recognised to be within
biofilms rather than Jive freely in the water itself The presence of biofilms growth will
5
-
influence the microbiological analysis conducted as it will make the representative water
samples difficult to be obtained
24 (GTG)5 pe R Fingerprinting
In order to control public health nowadays the epidemiological typing of bacteria
or pathogens has become weightier One type of commonly used peR is the repetitiveshy
peR that imply the use of primers complementary to highly conserved repetitive
sequences present in multiple copies on the genome Since the distance between repetitive
elements among strains are varies the DNA sequences that are peR amplified between
them will result in production of a distinct fingerprint Although the classical and
microbiological methods can perfectly adequate to identify microorganisms on species
level based on the identification of phenotypic marker those methods are not reliable
enough to differentiate the microorganisms further into single strains (GTG)s peR is one
of the available molecular typing procedures that is applied to show clonal and close
relationships between microorganism isolates of one species (GTG)s peR gives an insight
into the evolutionary dynamics of the bacterial genome and has shown to be rapid
sensitive di criminative and cost effective in genotyping the aquaculture-associated
bacteria isolates from Malaysia (Shariff 2006)
6
25 Amplification of 16s rRNA
The ribosomal operons mainly 16S rRNA has proven to be a stable and specific
molecular marker for the identification of bacteria 16s rRNA gene sequences are the most
common housekeeping genetic marker that has been used to study bacterial phylogeny and
taxonomy for a number of reasons One of the reasons is because it is presence in almost
all bacteria often existing as operons or a mUltigene family Besides 16s rRNA gene
function has not changed over time thus suggesting that random sequence changes are a
more accurate measure of time Furthermore the size of 16S rRNA gene (1500 bp) is
large enough to be used for informatics purposes As stated in the Approved Lists in 1980
1791 valid names were recognized at the rank of species but today this number has
expanded rapidly to 8168 species a 456 increase This explosion in the number of
recognized taxa directly attribute to the ease in performance of 16S rRNA gene sequencing
studies as opposed to the more cumbrous manipulations involving DNA-DNA
hybridization investigations
7
--
30 Methodology
31 Collection o( Water and Swab Samples
The water and swab samples were collected from 9 emergency eyewash stations 6
eyewash stations at Faculty of Resource Science and Technology and 3 eyewash stations at
External Laboratory The water samples were collected in sterile 50 mL Falcon tubes
containing 01 mL 10 sodium thiosulphate while the swab samples were collected by
using pre-sterilized cotton buds into 15 mL sterile Falcon tubes containing 2 mL 001
peptone water The samples were stored in an ice box before being analyzed in the
laboratory
Table 31 The location and source code for the emergency eyewash stations
FRST Source code External Laboratory Source code
1-2 ZA A G-l Z3A G
2-1 ZA B G-2 Z3B H
2-5 ZB C 1-2 Z3B I
LG-7 ZC D
1-6 ZC E
3-6 ZD F 910
8
-------- shy
32 Samples Proce ing
01 mL of the water sample was aseptically transferred onto a Nutrient agar (Oxoid
England) using a sterile pipette The water sample was spread over surface ofthe agar with
a cool sterilized glass spreader by touching the spreader to the agar and rotating the agar
plate The glass spreader was sterilized by dipping it in alcohol and flaming it with Bunsen
burner flame For swab samples the samples were streaked onto agar surface by using a
sterilized inoculating loop The inoculating loop was sterilized by passing it through the
Bunsen burner flame and allowed to cool before it was used to spread the bacteria over the
agar surface Then the plates were incubated at 37degC for overnight while inverted
Following the incubation the colonies formed on the nutrient agar were counted
33 Bacteria Isolation
By using a sterile inoculating loop a colony was picked up from the nutrient agar
and re-streaked onto a new nutrient agar Then the inverted plates were incubated at 37degC
for overnight After the incubation two single colonies from the new agar plates were
picked up by using a sterile inoculating loop and each colony was re-streaked again onto
different new agar plates to obtain pure bacterial culture Later the plates were incubated
overnight at 37degC The isolates were labelled following the formula that has been
described by Hutter et al (2003)
Table 32 The formula used to label the isolates
Xyn
x= sources of water and swab samples (ABCDEFGH and I)
y = replicates of agar plates (123 and 4)
n = the pure culture obtain from the streaking (a and b)
9
-~ ---- _ shy
34 DNA Extraction
DNA extraction was conducted according to boiling-centrifugation method as
described by Soumet et at (1994) with few modifications About 1500 III of bacterial
culture was transferred into a sterile 15 ml microcentrifuge tube and centrifuged at 10000
rpm for 5 minutes After that the supernatant formed was discarded and the cell was
harvested Later 250 III of sterile distilled water was added to the remaining pellet and the
microcentrifuge tube was vortexed to resuspend the pellet After that the suspension was
boiled at 100degC for 10 minutes and cooled immediately at -20degC for 5 minutes Lastly
the microcentrifuge tube will be centrifuged again at 10000 rpm for 10 minutes The
supernatant will be transferred to new microcentrifuge tubes and will be stored for peR
analysis
10
35 (GTG)s peR Fingerprinting
(GTG)s PCR was performed according to Matsheka et at (2006) with few
modifications The primer that was used is (GTG)5 with the sequence of
(GTG)s 5-GTG GTG GTG GTG GTG-3
The PCR reaction mixture is shown in table 33
Table 33 peR reaction set-up for (GTG)s
peR Mixture Quantity (111)
5U~1 DNA Taq Polymerase 030
25 ~M (GTG)s primer 100
25 mMMgCh 300
10 mM dNTPs 080
Ultrapure water 990
lOX peR Buffer 500
Template DNA 500
Total 2500
After being mixed in the wendorf tube about 25 ~I of the peR mixture with
DNA template was ali quoted into each peR tube Next the peR tubes were put into
SenseQuest thermal cycler to undergo peR amplification reaction The amplification of the
(GTG)5 region was carried out according to the conditions shown in Table 33
11
Table 34 (GTG)s peR amplitication conditions
Condition Temperature Time Number of cycles
Pre-denaturation 95dege 7 minutes 1
Denturation 95dege 2 minutes 4
Annealing 36dege 2 minutes 4
Extension 72dege 2 minutes 4
Denaturation 95dege 1 minute 30
Annealing 50 0 e 1 minute 30
Extension 72 dege 1 minute 30
Final extension 72 dege 5 minutes
36 Agarose Gel Electrophoresis (AGE)
5 Jl1 of the amplified peR product was electrophoresed on 15 agarose gel
containing 01 Jl1 of 10 mgml Ethidium Bromide (EtBr) in IX Tris-Acetate-EDTA (TAE)
buffer at 100 V for 40 minutes DNA marker of 1 kb ladder from Promega was used and
the gel was visualized by using UV transilluminator (GeIDoc) According to the banding
patterns that were obtained scoring was done by using binary data format The presence of
band was scored as 1 while thabsence of band was scored as 0 Next the data was
input in the DendoUPGMA online software to generate a dendrogram of neighbour joining
tree (NJTREE) based on the calculated genetic distances that were determined according to
the Dice formulation (Nei and Li 1979)
37 Amplification of 16s rRNA using peR
PCR was performed according to Hutter et al (2003) with some modifications The
PCR reaction is shown in Table 35
Table 35 PCR reaction set-up for amplification of 16s rRNA
PCR Mixture Quantity btl)
SUI ~l Taq Polymerase 400
25 pmol forward primer (27F) 400
25 pmol reverse primer (519 R) 400
25 mMMgCh 600
10 mM dNTPs 200
Ultrapure water 5600
lOX PCR Buffer 2000
Template DNA 400
Total 10000
Table 36 The primer sequence and expected size of the PCR product
Primer Type Primer Sequence Expected Size of PCR
Product
Forward Universal 5-AGAGTTTGATCMTGGCTCAG-3
(27F)
Reverse Universal 5-GWAITACCGCGGCKGCTG-3 500 bp
(519R)
After being mixed in the Eppendorf tube about 1 00 ~I of the PCR mixture with
DNA template was aliquoted into each PCR tube Next the PCR tubes were put into
eQuest thermal cycler to undergo PCR amplification reaction The PCR amplification
of 16s rRNA was performed according to the conditions shown in Table 37
13
- - ~---
Table 37 16S rRNA amplification conditions
Condition Temperature Time Number of cycles
Pre-denaturation 95degC 10 minutes 1
Denaturation 94 degC 30 seconds 30
Annealing 55degC 1 minutes 30
Extension 72 degC 15 minutes 30
Final extension 72 degC 10 minutes
After the peR process the PCR products were undergone agarose gel
electrophoresis where 80 III of the PCR product was loaded into 1 (wv) agarose gel The
1 (wv) agarose gel was done by adding 05 g of agarose powder in 50 mL of IX TAE
buffer Then the mixture was heating in microwave for 50 seconds to completely dissolve
the agarose powder in the T AE buffer followed by the addition of 2 III of ethidium
bromide into the solution The loaded gel was run at 90 V for 45 minutes before it was
visualized using the UV transilluminator to observe for DNA bands
14
38 Purification of peR Products
The PCR products were purified by using the Wizardreg SV Gel and PCR Clean-Up
System (Promega USA) Firstly following gel electrophoresis the DNA band was excised
from the gel by using a sterile and sharp scalpel The gel slice was placed in a 15 mL
microcentrifuge tube and 10 III Membrane Binding Solution was added per 10 mg of gel
slice The tube was incubated at 50 degC until the gel slice has completely dissolved To help
dissolve the gel the tube was vortexed every 2-3 minutes Meanwhile the SV Minicolumn
was inserted into the Collection Tube After the gel has completely dissolved the dissolved
gel mixture was transferred to the Minicolumn assembly and was incubated at room
temperature for 1 minute before it was centrifuged at 13 500 rpm for 1 minute The
flowthrough was discarded and the Minicolumn was re-inserted into Collection Tube
Next 700 III Membrane Wash Solution was added into the Minicolumn assembly and it
was centrifuged at 13 500 rpm for 1 minute The flowthrough was discarded and the
Minicolumn was re-inserted into Collection Tube Then step was repeated by adding 500
III Membrane Wash Solution and centrifuged at 13 500 rpm for 5 minutes The Collection
Tube was emptied and the column assembly was re-centrifuged for 1 minute with the
microcentrifuge lid off to allow evaporation of any residual ethanol Later the Minicolumn
was transferred carefully to a cle~5 microcentrifuge tube and 50 III of Nuclease-Free
Water was added to the Minicolumn The Minicolumn was incubated at room temperature
for 1 minute before it was centrifuged at 13 500 rpm for 1 minute The Minicolumn was
discarded and the DNA was stored at -20 0c The purified DNA then was analysed on 1
(wv) agarose gel by adding 1 volume of dye to 1 volume of the purified DNA
15
-----~----~-~
40 RESULTS
4 t Dumeration of Bacteria
1be water samples were spread on the Nutrient agar without diluted while the swab
samples were streaked on the surface of the agar The results for the number of colonies
that were formed on the nutrient agar following an overnight incubation were shown in
Table 41
Table 41 The number of cells (colony-forming units) formed per millilitre of original sample
Sample Number of cells (colony -forming units)
per millilitre of original sample
A(l) 178
A(2) 134
B(1) TNTC
B(2) I 125
C(l) 2
C(2) 8
0(1) 33
D(2) 2
E(l) ~ 0
E(2) 0
F(1) TNTC
F(2) 34
G(I) 0
G(2) 2
H(I) I
43
16

Acknowledgement
First of all I would like to express my deepest appreciation to all those who gave
me the possibility to complete this project A special gratitude I give to my supervisor Dr
Lee Kui Soon for giving me the opportunity to work under his guidance contribution in
stimulating suggestions and encouragement and helped me to coordinate my project
especially in writing this report Besides I would also like to appreciate the guidance given
by my co-supervisor Dr Samuel Lihan and acknowledge with much appreciation the
postgraduates in Animal Biotech Lab Proteomics Lab and Virology Lab for giving their
cooperation to use the equipment and necessary materials in order to complete this project
A special thanks goes to my parents for the unceasing encouragement support and
attention I am also grateful to have my family team mates and friends who helping me
survive all the stress and not letting me give up while doing this project
I
Declaration
Fairuz Awatif binti Ismail hereby declare that the work entitled Microbiological
Analysis of Water Quality of Eyewash Stations in Faculty of Resource Science and
Technology and External Laboratory is my original work I have not copied from any other
students work or from any other sources except where due reference or acknowledgement
is made explicitly in the text nor has any part been written for me by another person
Date submitted Fairuz Awatif binti Ismail (34824)
ii
Table of Contents
Acknowledgement
Declaration 11
List of Abbreviations III
List of Tables and Figures v
Abstract
10 Introduction 2
20 Literature Review 4
21 Eyewash Stations
22 Microbial Growth
23 Biofilm
24 (GTG)s PCR Fingerprinting
25 Amplification of 16s rRNA
30 Methodology 8
31 Collection ofWater and Swab Samples
32 Samples Processing
33 Bacteria Isolation
34 DNA Extraction
35 (GTG)s PCR Fingerprinting
36 Agarose Gel Electrophoresis (AGE)
37 Amplification of 16s rRNA by using PCR
38 Purification ofPCR Products
40 Results 16
iii
I ___ ______________
--
-- - - -
41 Enumeration of Bacteria
42 (GTG)s PCR Fingerprinting
43 Amplification of 16S rRNA by using PCR
50 Discussion 27
51 Enumeration of Bacteria
52 (GTG)s PCR Fingerprinting
53 Amplification of 16S rRNA by using PCR
60 Conclusion and Recommendation 33
70 References 34
Appendix A 37
Appendix B 39
Appendix C 40
iv
-----
List of Abbreviations
III Microliter
Ilm Micrometer
ANSI American National Standard Institute
DNA Deoxyribonucleic acid
dNTP Deoxyribonucleotide triphosphate
EtBr ethidium bromide
gpm gallons per minute
MgCh magnesium chloride
NJTREE neighbour joining tree
PCR Polymerase Chain Reaction
pSI pounds per square inch
rpm revolutions per minute
TAE Tris-Acetate-EDT A
UV Ultraviolet
V Volt
v
I
- ------ -----
I
List of Tables
Table
31 The location and source code for the emergency eyewash 8
I stations
I 32 The format used to label the isolates 9
33 peR reaction set-up for (GTG)5 II
34 (GTG)5 peR amplification conditions 12
35 peR reaction set-up for amplification of 16S rRNA 13
36 The primer sequence and expected size of the peR product 13
37 (GTG)5 peR amplification conditions 14
41 The number of cells (colony-forming units) formed per 16
millilitre of original sample
42 The Isolation code identity and similarity of the isolates after 26
using BLAST search at NeBI
vi
----
List of Figures
Figures
41 The colonies formed on the nutrient agar following spread 17
plate method
42 (GTG)s peR agarose gel result 18
43 (GTG)s peR agarose gel result 19
44 (GTG)s peR agarose gel result 20
45 (GTG)s peR agarose gel result 21
46 (GTG)s peR agarose gel result 22
47 (GTG)s peR agarose gel result 23
48 Dendrogram based on (GTG)s peR 24
49 Amplification of 16s rRNA result 25
vii
Microbiological AnalysisofWater Quality of Eye-wash Stations in Faculty of Resource Science and Technology and External Laboratory
Fairuz Awatif binti Ismail (34824)
Resource Biotechnology Faculty of Resource Science and Technology
Universiti Malaysia Sarawak
ABSTRACT
Emergency eyewash station is a very important component that provides the laboratories with emergency aid during experimental accidents In this project microbiological water quality of the emergency eyewash stations in Faculty of Resource Science and Technology and External Laboratory were determined Samples of water and swabs were collected from 6 eyewash stations in Faculty of Resource Science and Technology and 3 eyewash stations in External Laboratory These samples were analysed for the presence of bacteria The samples were transferred onto a Nutrient Agar spread on it and incubated for overnight at 37dege to grow the bacteria The bacteria colonies were isolated and streaked onto new nutrient agar to obtain pure bacterial culture The bacterial DNA were extracted from the bacteria isolates by boiling-centrifugation method The genetic variations among the bacteria were analysed using (GTG)s peR The phylogenetic tree was constructed based on the DNA fingerprinting to illustrate the relationship among the bacteria isolates From the dendrogram constructed 11 representative isolates were chose to undergo amplification of the 16s rRNA for sequencing The 11 isolates were recognized to be from 9 species which are Lysinibacillus sphaericus Cupriavidus metallidurans Staphylococcus epdermidis Sphingomonas wittichii Brevibacillus brevis Delftia acidovorans Bacillus pumilus Kocwia rhizophila and Bacillus thuringiensis in which the bacteria can cause human infections that may harm the users
Keywords microbiological analysis (GTG)s peR 16s RNA phylogenetic tree
ABSTRAK
Slesen cuci mata keselamatan merupakan komponen yang amat penting dalam menyediakan bantuan kecemasan semasa berlakunya kemalangan di makmal Dalam projek ini kualiti air di Slesen-stesen cuci mata keselamatan di Fakulti Sains dan Teknologi Sumber dan Makmal Luar dilentukan dari segi mikrobiologikal SlWtpel-sampel air dan swab diambil dari 6 stesen cuci mata keseamatan di Fakulti Sa ins dan Teknologi Sumber dan 3 stesen cuci mata keselamatan di Malanal Luar Sampel-sampel ini dianalisis untuk kehadiran bakteria Sampel-sampel tersebut dipindahkan ke agar nutrien dan diinkubasi semalaman pada suhu 3 lOC bertujuan untuk menghidupkan bakteria Koloni-koloni bakteria diasingkan dan dicoreng pada agar nutrien yang bani untuk mendapatkan kutur bakteria tulen DNA bakteria diekstrak menggunakan kaedah didih-pintal Variasi genetik antara bakteria dianalisis melalui (GTG)s PCR Pokok filogenetik dibina berdasarkan cap jari DNA untuk menggambarkan hubungan antara bakteria Berdasarkan dendrogram 11 bakteria dipilih untuk menjalani amplifikasi 16s rRNA 11 bakteria tersebut dikena pasti terdiri daripada 9 spesiesi iaitu Lysinibacillus sphaericus Cuprialidus melallidurans Staphylococcus epidermidis Sphingomonas wittichii Brevibacillus brevis De(fiia acidolorans Bacillus pumilus Kocuria rhizophila and Bacillus thuringiensis di mana bakteriashyhakteria tersebut boleh menyebabkanjangkilan kepada manllsia
Kala kmci analisis mikrobiologikal (GTG)s PCR 16s RNA pokokfilogenetik
1
- --------
10 Introduction
Emergency eyewash station provides the laboratories with emergency aid during
experimental accidents The main purpose of the eyewash station is to bathe the eyes that
are attacked by hazardous chemicals with a substantial amount of water while allowing
hands to hold the eyelids open For more than 100 years tap water has been used as the
source of water for the eyewash stations (Safety com nd)
There are microorganisms and bacteria that are commonly found in the tap water
makjng it contaminated such as Acanthamoeba Pseudomonas aeurginosa anteric bacilli
and Entamoeba in which some of these are proven to cause eye infection Besides there is
a high possibility that the water in the tap is contaminated by animals such as mouse that
might urinate in the water source The eyes defense system is reduced when it is under
attacked by hazardous chemicals and the contaminated tap water will increase the risk of
eye infection (Hurley 2000)
The total number of people that are died from waterborne disease is approximately
34 million each year as stated by World Health Organization (rapidmicrobiologycom
nd) The waterborne disease is caused through the contact with or consumption of water
that contain the pathogenic microorganisms This shows that the pathogenic
microorganisms that exist in water calYOOuse a severe effect on people
The purpose of this study is to analyse the microbes in the water of the eyewash
stations in the Faculty of Resource Science and Technology and External Laboratory The
objectives of this experiment are to
I) Isolate the microbes that exist in the water of the eyewash stations
2) Identify the microbes by sequencing results of the amplification of 16s rRNA gene
2
Problem statement
There are a few water dispenser stations In FRST that have been assessed to contain
bacteria Leptospira sp that may cause leptospirosis which will harm the users Due to the
water dispenser stations and some emergency eyewash stations that shared the same
sources of water the microbiological water quality of water from emergency eye-wash
stations in FRST and External Laboratory will be analysed to determine whether microbes
that presence in the water can cause infection to the eyes and give harm to the users
3
---- shy
20 Literature Review
21 Eyewash Station
There are two major categories of eyewash station which are plumbed units and
portable units For plumbed units the water supply must be at 30 psi and flow
simultaneously at a low velocity into both eyes to reduce eye injury Both categories of the
eyewash stations are installed between 33 inches and 45 inches above the ground and 6
inches away from the wall This position ofthe eyewash station will allow enough space to
hold the eyelids open with the hands while the water is flowing For an eyewash only
station the flow of water must be supplied at 04 gpm for 15 minutes whereas for an
eyewash that is combined with face wash unit the flow of water must be supplied at 3 gpm
for 15 minutes These two units are differ in the size of the nozzle and spray pattern The
nozzles have to face upward in order for the eyewash station to functionally operate and
must be protected to prevent any contaminants that may clog the openings or provide a
suitable condition that will allow microorganisms to breed (Cameron 2001)
22 Microbial Growth
Microbial growth is one oifRe major concerns of emergency eyewash safety that
regular flushing of the eyewash is a mandated part of the ANSI standard (ANSI Z3581shy
2004) As described by Bowman et al (1996) through the experiments on flushing
eyewash and shower systems flushing of a plumbed system will help to lower the
microbial growth The microbial growth will develop if the systems are not well
maintained and if the water in the system remains stagnant for a long period of time
Hurley 2000)
4
-----
In 1999 a ~urvey was conducted by Fendall Company on 200 manufacturing facilities and
58 of the eyewash stations were found to contain the pseudomonas bacteria (Hurley
2000) Besides the Pseudomonas spp Legionella spp and Amoeba also have been isolated
from the eyewash stations based on the experiment conducted by Paszko-Kolva et al
(1990) Eye infections caused by Acanthamoeba spp and Pseudomonas spp is generally
resistant to antibiotic therapy The growth of Legionella spp is helped by the temperature
of eyewash stations tepid water range (16degC-38degC) that overlaps with the ideal growth
temperature ofLegionella spp (35degC) The primary route of infection of Legionella spp is
via inhalation
The body defense system will be greatly reduced when under attack by hazardous
chemical and thus exposure to these microbes at the time of body being attacked will
increase the risk of infection (Hurley 2000)
23 Biofilm
Biofilm will be formed if the eyewash station is left with little maintenance It may
attach to the inside surface of the water line or self-contained device and continue to grow
where it will provide a source of bacterial contamination that cannot be removed by
periodic flushing (Hurley 2000) ~films are recognized as microbial communities that
consist of a variety of microbial cells including the pathogens such as
Salmonella Typhimurium Campylobacter Pseudomonas aeruginosa and Aeromonas
hydrophila It develops over time to become more complex and extensive thus protect
individual bacterial cells from any antimicrobial compounds in water including chlorine
Most of the bacteria found in drinking water distribution system is recognised to be within
biofilms rather than Jive freely in the water itself The presence of biofilms growth will
5
-
influence the microbiological analysis conducted as it will make the representative water
samples difficult to be obtained
24 (GTG)5 pe R Fingerprinting
In order to control public health nowadays the epidemiological typing of bacteria
or pathogens has become weightier One type of commonly used peR is the repetitiveshy
peR that imply the use of primers complementary to highly conserved repetitive
sequences present in multiple copies on the genome Since the distance between repetitive
elements among strains are varies the DNA sequences that are peR amplified between
them will result in production of a distinct fingerprint Although the classical and
microbiological methods can perfectly adequate to identify microorganisms on species
level based on the identification of phenotypic marker those methods are not reliable
enough to differentiate the microorganisms further into single strains (GTG)s peR is one
of the available molecular typing procedures that is applied to show clonal and close
relationships between microorganism isolates of one species (GTG)s peR gives an insight
into the evolutionary dynamics of the bacterial genome and has shown to be rapid
sensitive di criminative and cost effective in genotyping the aquaculture-associated
bacteria isolates from Malaysia (Shariff 2006)
6
25 Amplification of 16s rRNA
The ribosomal operons mainly 16S rRNA has proven to be a stable and specific
molecular marker for the identification of bacteria 16s rRNA gene sequences are the most
common housekeeping genetic marker that has been used to study bacterial phylogeny and
taxonomy for a number of reasons One of the reasons is because it is presence in almost
all bacteria often existing as operons or a mUltigene family Besides 16s rRNA gene
function has not changed over time thus suggesting that random sequence changes are a
more accurate measure of time Furthermore the size of 16S rRNA gene (1500 bp) is
large enough to be used for informatics purposes As stated in the Approved Lists in 1980
1791 valid names were recognized at the rank of species but today this number has
expanded rapidly to 8168 species a 456 increase This explosion in the number of
recognized taxa directly attribute to the ease in performance of 16S rRNA gene sequencing
studies as opposed to the more cumbrous manipulations involving DNA-DNA
hybridization investigations
7
--
30 Methodology
31 Collection o( Water and Swab Samples
The water and swab samples were collected from 9 emergency eyewash stations 6
eyewash stations at Faculty of Resource Science and Technology and 3 eyewash stations at
External Laboratory The water samples were collected in sterile 50 mL Falcon tubes
containing 01 mL 10 sodium thiosulphate while the swab samples were collected by
using pre-sterilized cotton buds into 15 mL sterile Falcon tubes containing 2 mL 001
peptone water The samples were stored in an ice box before being analyzed in the
laboratory
Table 31 The location and source code for the emergency eyewash stations
FRST Source code External Laboratory Source code
1-2 ZA A G-l Z3A G
2-1 ZA B G-2 Z3B H
2-5 ZB C 1-2 Z3B I
LG-7 ZC D
1-6 ZC E
3-6 ZD F 910
8
-------- shy
32 Samples Proce ing
01 mL of the water sample was aseptically transferred onto a Nutrient agar (Oxoid
England) using a sterile pipette The water sample was spread over surface ofthe agar with
a cool sterilized glass spreader by touching the spreader to the agar and rotating the agar
plate The glass spreader was sterilized by dipping it in alcohol and flaming it with Bunsen
burner flame For swab samples the samples were streaked onto agar surface by using a
sterilized inoculating loop The inoculating loop was sterilized by passing it through the
Bunsen burner flame and allowed to cool before it was used to spread the bacteria over the
agar surface Then the plates were incubated at 37degC for overnight while inverted
Following the incubation the colonies formed on the nutrient agar were counted
33 Bacteria Isolation
By using a sterile inoculating loop a colony was picked up from the nutrient agar
and re-streaked onto a new nutrient agar Then the inverted plates were incubated at 37degC
for overnight After the incubation two single colonies from the new agar plates were
picked up by using a sterile inoculating loop and each colony was re-streaked again onto
different new agar plates to obtain pure bacterial culture Later the plates were incubated
overnight at 37degC The isolates were labelled following the formula that has been
described by Hutter et al (2003)
Table 32 The formula used to label the isolates
Xyn
x= sources of water and swab samples (ABCDEFGH and I)
y = replicates of agar plates (123 and 4)
n = the pure culture obtain from the streaking (a and b)
9
-~ ---- _ shy
34 DNA Extraction
DNA extraction was conducted according to boiling-centrifugation method as
described by Soumet et at (1994) with few modifications About 1500 III of bacterial
culture was transferred into a sterile 15 ml microcentrifuge tube and centrifuged at 10000
rpm for 5 minutes After that the supernatant formed was discarded and the cell was
harvested Later 250 III of sterile distilled water was added to the remaining pellet and the
microcentrifuge tube was vortexed to resuspend the pellet After that the suspension was
boiled at 100degC for 10 minutes and cooled immediately at -20degC for 5 minutes Lastly
the microcentrifuge tube will be centrifuged again at 10000 rpm for 10 minutes The
supernatant will be transferred to new microcentrifuge tubes and will be stored for peR
analysis
10
35 (GTG)s peR Fingerprinting
(GTG)s PCR was performed according to Matsheka et at (2006) with few
modifications The primer that was used is (GTG)5 with the sequence of
(GTG)s 5-GTG GTG GTG GTG GTG-3
The PCR reaction mixture is shown in table 33
Table 33 peR reaction set-up for (GTG)s
peR Mixture Quantity (111)
5U~1 DNA Taq Polymerase 030
25 ~M (GTG)s primer 100
25 mMMgCh 300
10 mM dNTPs 080
Ultrapure water 990
lOX peR Buffer 500
Template DNA 500
Total 2500
After being mixed in the wendorf tube about 25 ~I of the peR mixture with
DNA template was ali quoted into each peR tube Next the peR tubes were put into
SenseQuest thermal cycler to undergo peR amplification reaction The amplification of the
(GTG)5 region was carried out according to the conditions shown in Table 33
11
Table 34 (GTG)s peR amplitication conditions
Condition Temperature Time Number of cycles
Pre-denaturation 95dege 7 minutes 1
Denturation 95dege 2 minutes 4
Annealing 36dege 2 minutes 4
Extension 72dege 2 minutes 4
Denaturation 95dege 1 minute 30
Annealing 50 0 e 1 minute 30
Extension 72 dege 1 minute 30
Final extension 72 dege 5 minutes
36 Agarose Gel Electrophoresis (AGE)
5 Jl1 of the amplified peR product was electrophoresed on 15 agarose gel
containing 01 Jl1 of 10 mgml Ethidium Bromide (EtBr) in IX Tris-Acetate-EDTA (TAE)
buffer at 100 V for 40 minutes DNA marker of 1 kb ladder from Promega was used and
the gel was visualized by using UV transilluminator (GeIDoc) According to the banding
patterns that were obtained scoring was done by using binary data format The presence of
band was scored as 1 while thabsence of band was scored as 0 Next the data was
input in the DendoUPGMA online software to generate a dendrogram of neighbour joining
tree (NJTREE) based on the calculated genetic distances that were determined according to
the Dice formulation (Nei and Li 1979)
37 Amplification of 16s rRNA using peR
PCR was performed according to Hutter et al (2003) with some modifications The
PCR reaction is shown in Table 35
Table 35 PCR reaction set-up for amplification of 16s rRNA
PCR Mixture Quantity btl)
SUI ~l Taq Polymerase 400
25 pmol forward primer (27F) 400
25 pmol reverse primer (519 R) 400
25 mMMgCh 600
10 mM dNTPs 200
Ultrapure water 5600
lOX PCR Buffer 2000
Template DNA 400
Total 10000
Table 36 The primer sequence and expected size of the PCR product
Primer Type Primer Sequence Expected Size of PCR
Product
Forward Universal 5-AGAGTTTGATCMTGGCTCAG-3
(27F)
Reverse Universal 5-GWAITACCGCGGCKGCTG-3 500 bp
(519R)
After being mixed in the Eppendorf tube about 1 00 ~I of the PCR mixture with
DNA template was aliquoted into each PCR tube Next the PCR tubes were put into
eQuest thermal cycler to undergo PCR amplification reaction The PCR amplification
of 16s rRNA was performed according to the conditions shown in Table 37
13
- - ~---
Table 37 16S rRNA amplification conditions
Condition Temperature Time Number of cycles
Pre-denaturation 95degC 10 minutes 1
Denaturation 94 degC 30 seconds 30
Annealing 55degC 1 minutes 30
Extension 72 degC 15 minutes 30
Final extension 72 degC 10 minutes
After the peR process the PCR products were undergone agarose gel
electrophoresis where 80 III of the PCR product was loaded into 1 (wv) agarose gel The
1 (wv) agarose gel was done by adding 05 g of agarose powder in 50 mL of IX TAE
buffer Then the mixture was heating in microwave for 50 seconds to completely dissolve
the agarose powder in the T AE buffer followed by the addition of 2 III of ethidium
bromide into the solution The loaded gel was run at 90 V for 45 minutes before it was
visualized using the UV transilluminator to observe for DNA bands
14
38 Purification of peR Products
The PCR products were purified by using the Wizardreg SV Gel and PCR Clean-Up
System (Promega USA) Firstly following gel electrophoresis the DNA band was excised
from the gel by using a sterile and sharp scalpel The gel slice was placed in a 15 mL
microcentrifuge tube and 10 III Membrane Binding Solution was added per 10 mg of gel
slice The tube was incubated at 50 degC until the gel slice has completely dissolved To help
dissolve the gel the tube was vortexed every 2-3 minutes Meanwhile the SV Minicolumn
was inserted into the Collection Tube After the gel has completely dissolved the dissolved
gel mixture was transferred to the Minicolumn assembly and was incubated at room
temperature for 1 minute before it was centrifuged at 13 500 rpm for 1 minute The
flowthrough was discarded and the Minicolumn was re-inserted into Collection Tube
Next 700 III Membrane Wash Solution was added into the Minicolumn assembly and it
was centrifuged at 13 500 rpm for 1 minute The flowthrough was discarded and the
Minicolumn was re-inserted into Collection Tube Then step was repeated by adding 500
III Membrane Wash Solution and centrifuged at 13 500 rpm for 5 minutes The Collection
Tube was emptied and the column assembly was re-centrifuged for 1 minute with the
microcentrifuge lid off to allow evaporation of any residual ethanol Later the Minicolumn
was transferred carefully to a cle~5 microcentrifuge tube and 50 III of Nuclease-Free
Water was added to the Minicolumn The Minicolumn was incubated at room temperature
for 1 minute before it was centrifuged at 13 500 rpm for 1 minute The Minicolumn was
discarded and the DNA was stored at -20 0c The purified DNA then was analysed on 1
(wv) agarose gel by adding 1 volume of dye to 1 volume of the purified DNA
15
-----~----~-~
40 RESULTS
4 t Dumeration of Bacteria
1be water samples were spread on the Nutrient agar without diluted while the swab
samples were streaked on the surface of the agar The results for the number of colonies
that were formed on the nutrient agar following an overnight incubation were shown in
Table 41
Table 41 The number of cells (colony-forming units) formed per millilitre of original sample
Sample Number of cells (colony -forming units)
per millilitre of original sample
A(l) 178
A(2) 134
B(1) TNTC
B(2) I 125
C(l) 2
C(2) 8
0(1) 33
D(2) 2
E(l) ~ 0
E(2) 0
F(1) TNTC
F(2) 34
G(I) 0
G(2) 2
H(I) I
43
16
I
Declaration
Fairuz Awatif binti Ismail hereby declare that the work entitled Microbiological
Analysis of Water Quality of Eyewash Stations in Faculty of Resource Science and
Technology and External Laboratory is my original work I have not copied from any other
students work or from any other sources except where due reference or acknowledgement
is made explicitly in the text nor has any part been written for me by another person
Date submitted Fairuz Awatif binti Ismail (34824)
ii
Table of Contents
Acknowledgement
Declaration 11
List of Abbreviations III
List of Tables and Figures v
Abstract
10 Introduction 2
20 Literature Review 4
21 Eyewash Stations
22 Microbial Growth
23 Biofilm
24 (GTG)s PCR Fingerprinting
25 Amplification of 16s rRNA
30 Methodology 8
31 Collection ofWater and Swab Samples
32 Samples Processing
33 Bacteria Isolation
34 DNA Extraction
35 (GTG)s PCR Fingerprinting
36 Agarose Gel Electrophoresis (AGE)
37 Amplification of 16s rRNA by using PCR
38 Purification ofPCR Products
40 Results 16
iii
I ___ ______________
--
-- - - -
41 Enumeration of Bacteria
42 (GTG)s PCR Fingerprinting
43 Amplification of 16S rRNA by using PCR
50 Discussion 27
51 Enumeration of Bacteria
52 (GTG)s PCR Fingerprinting
53 Amplification of 16S rRNA by using PCR
60 Conclusion and Recommendation 33
70 References 34
Appendix A 37
Appendix B 39
Appendix C 40
iv
-----
List of Abbreviations
III Microliter
Ilm Micrometer
ANSI American National Standard Institute
DNA Deoxyribonucleic acid
dNTP Deoxyribonucleotide triphosphate
EtBr ethidium bromide
gpm gallons per minute
MgCh magnesium chloride
NJTREE neighbour joining tree
PCR Polymerase Chain Reaction
pSI pounds per square inch
rpm revolutions per minute
TAE Tris-Acetate-EDT A
UV Ultraviolet
V Volt
v
I
- ------ -----
I
List of Tables
Table
31 The location and source code for the emergency eyewash 8
I stations
I 32 The format used to label the isolates 9
33 peR reaction set-up for (GTG)5 II
34 (GTG)5 peR amplification conditions 12
35 peR reaction set-up for amplification of 16S rRNA 13
36 The primer sequence and expected size of the peR product 13
37 (GTG)5 peR amplification conditions 14
41 The number of cells (colony-forming units) formed per 16
millilitre of original sample
42 The Isolation code identity and similarity of the isolates after 26
using BLAST search at NeBI
vi
----
List of Figures
Figures
41 The colonies formed on the nutrient agar following spread 17
plate method
42 (GTG)s peR agarose gel result 18
43 (GTG)s peR agarose gel result 19
44 (GTG)s peR agarose gel result 20
45 (GTG)s peR agarose gel result 21
46 (GTG)s peR agarose gel result 22
47 (GTG)s peR agarose gel result 23
48 Dendrogram based on (GTG)s peR 24
49 Amplification of 16s rRNA result 25
vii
Microbiological AnalysisofWater Quality of Eye-wash Stations in Faculty of Resource Science and Technology and External Laboratory
Fairuz Awatif binti Ismail (34824)
Resource Biotechnology Faculty of Resource Science and Technology
Universiti Malaysia Sarawak
ABSTRACT
Emergency eyewash station is a very important component that provides the laboratories with emergency aid during experimental accidents In this project microbiological water quality of the emergency eyewash stations in Faculty of Resource Science and Technology and External Laboratory were determined Samples of water and swabs were collected from 6 eyewash stations in Faculty of Resource Science and Technology and 3 eyewash stations in External Laboratory These samples were analysed for the presence of bacteria The samples were transferred onto a Nutrient Agar spread on it and incubated for overnight at 37dege to grow the bacteria The bacteria colonies were isolated and streaked onto new nutrient agar to obtain pure bacterial culture The bacterial DNA were extracted from the bacteria isolates by boiling-centrifugation method The genetic variations among the bacteria were analysed using (GTG)s peR The phylogenetic tree was constructed based on the DNA fingerprinting to illustrate the relationship among the bacteria isolates From the dendrogram constructed 11 representative isolates were chose to undergo amplification of the 16s rRNA for sequencing The 11 isolates were recognized to be from 9 species which are Lysinibacillus sphaericus Cupriavidus metallidurans Staphylococcus epdermidis Sphingomonas wittichii Brevibacillus brevis Delftia acidovorans Bacillus pumilus Kocwia rhizophila and Bacillus thuringiensis in which the bacteria can cause human infections that may harm the users
Keywords microbiological analysis (GTG)s peR 16s RNA phylogenetic tree
ABSTRAK
Slesen cuci mata keselamatan merupakan komponen yang amat penting dalam menyediakan bantuan kecemasan semasa berlakunya kemalangan di makmal Dalam projek ini kualiti air di Slesen-stesen cuci mata keselamatan di Fakulti Sains dan Teknologi Sumber dan Makmal Luar dilentukan dari segi mikrobiologikal SlWtpel-sampel air dan swab diambil dari 6 stesen cuci mata keseamatan di Fakulti Sa ins dan Teknologi Sumber dan 3 stesen cuci mata keselamatan di Malanal Luar Sampel-sampel ini dianalisis untuk kehadiran bakteria Sampel-sampel tersebut dipindahkan ke agar nutrien dan diinkubasi semalaman pada suhu 3 lOC bertujuan untuk menghidupkan bakteria Koloni-koloni bakteria diasingkan dan dicoreng pada agar nutrien yang bani untuk mendapatkan kutur bakteria tulen DNA bakteria diekstrak menggunakan kaedah didih-pintal Variasi genetik antara bakteria dianalisis melalui (GTG)s PCR Pokok filogenetik dibina berdasarkan cap jari DNA untuk menggambarkan hubungan antara bakteria Berdasarkan dendrogram 11 bakteria dipilih untuk menjalani amplifikasi 16s rRNA 11 bakteria tersebut dikena pasti terdiri daripada 9 spesiesi iaitu Lysinibacillus sphaericus Cuprialidus melallidurans Staphylococcus epidermidis Sphingomonas wittichii Brevibacillus brevis De(fiia acidolorans Bacillus pumilus Kocuria rhizophila and Bacillus thuringiensis di mana bakteriashyhakteria tersebut boleh menyebabkanjangkilan kepada manllsia
Kala kmci analisis mikrobiologikal (GTG)s PCR 16s RNA pokokfilogenetik
1
- --------
10 Introduction
Emergency eyewash station provides the laboratories with emergency aid during
experimental accidents The main purpose of the eyewash station is to bathe the eyes that
are attacked by hazardous chemicals with a substantial amount of water while allowing
hands to hold the eyelids open For more than 100 years tap water has been used as the
source of water for the eyewash stations (Safety com nd)
There are microorganisms and bacteria that are commonly found in the tap water
makjng it contaminated such as Acanthamoeba Pseudomonas aeurginosa anteric bacilli
and Entamoeba in which some of these are proven to cause eye infection Besides there is
a high possibility that the water in the tap is contaminated by animals such as mouse that
might urinate in the water source The eyes defense system is reduced when it is under
attacked by hazardous chemicals and the contaminated tap water will increase the risk of
eye infection (Hurley 2000)
The total number of people that are died from waterborne disease is approximately
34 million each year as stated by World Health Organization (rapidmicrobiologycom
nd) The waterborne disease is caused through the contact with or consumption of water
that contain the pathogenic microorganisms This shows that the pathogenic
microorganisms that exist in water calYOOuse a severe effect on people
The purpose of this study is to analyse the microbes in the water of the eyewash
stations in the Faculty of Resource Science and Technology and External Laboratory The
objectives of this experiment are to
I) Isolate the microbes that exist in the water of the eyewash stations
2) Identify the microbes by sequencing results of the amplification of 16s rRNA gene
2
Problem statement
There are a few water dispenser stations In FRST that have been assessed to contain
bacteria Leptospira sp that may cause leptospirosis which will harm the users Due to the
water dispenser stations and some emergency eyewash stations that shared the same
sources of water the microbiological water quality of water from emergency eye-wash
stations in FRST and External Laboratory will be analysed to determine whether microbes
that presence in the water can cause infection to the eyes and give harm to the users
3
---- shy
20 Literature Review
21 Eyewash Station
There are two major categories of eyewash station which are plumbed units and
portable units For plumbed units the water supply must be at 30 psi and flow
simultaneously at a low velocity into both eyes to reduce eye injury Both categories of the
eyewash stations are installed between 33 inches and 45 inches above the ground and 6
inches away from the wall This position ofthe eyewash station will allow enough space to
hold the eyelids open with the hands while the water is flowing For an eyewash only
station the flow of water must be supplied at 04 gpm for 15 minutes whereas for an
eyewash that is combined with face wash unit the flow of water must be supplied at 3 gpm
for 15 minutes These two units are differ in the size of the nozzle and spray pattern The
nozzles have to face upward in order for the eyewash station to functionally operate and
must be protected to prevent any contaminants that may clog the openings or provide a
suitable condition that will allow microorganisms to breed (Cameron 2001)
22 Microbial Growth
Microbial growth is one oifRe major concerns of emergency eyewash safety that
regular flushing of the eyewash is a mandated part of the ANSI standard (ANSI Z3581shy
2004) As described by Bowman et al (1996) through the experiments on flushing
eyewash and shower systems flushing of a plumbed system will help to lower the
microbial growth The microbial growth will develop if the systems are not well
maintained and if the water in the system remains stagnant for a long period of time
Hurley 2000)
4
-----
In 1999 a ~urvey was conducted by Fendall Company on 200 manufacturing facilities and
58 of the eyewash stations were found to contain the pseudomonas bacteria (Hurley
2000) Besides the Pseudomonas spp Legionella spp and Amoeba also have been isolated
from the eyewash stations based on the experiment conducted by Paszko-Kolva et al
(1990) Eye infections caused by Acanthamoeba spp and Pseudomonas spp is generally
resistant to antibiotic therapy The growth of Legionella spp is helped by the temperature
of eyewash stations tepid water range (16degC-38degC) that overlaps with the ideal growth
temperature ofLegionella spp (35degC) The primary route of infection of Legionella spp is
via inhalation
The body defense system will be greatly reduced when under attack by hazardous
chemical and thus exposure to these microbes at the time of body being attacked will
increase the risk of infection (Hurley 2000)
23 Biofilm
Biofilm will be formed if the eyewash station is left with little maintenance It may
attach to the inside surface of the water line or self-contained device and continue to grow
where it will provide a source of bacterial contamination that cannot be removed by
periodic flushing (Hurley 2000) ~films are recognized as microbial communities that
consist of a variety of microbial cells including the pathogens such as
Salmonella Typhimurium Campylobacter Pseudomonas aeruginosa and Aeromonas
hydrophila It develops over time to become more complex and extensive thus protect
individual bacterial cells from any antimicrobial compounds in water including chlorine
Most of the bacteria found in drinking water distribution system is recognised to be within
biofilms rather than Jive freely in the water itself The presence of biofilms growth will
5
-
influence the microbiological analysis conducted as it will make the representative water
samples difficult to be obtained
24 (GTG)5 pe R Fingerprinting
In order to control public health nowadays the epidemiological typing of bacteria
or pathogens has become weightier One type of commonly used peR is the repetitiveshy
peR that imply the use of primers complementary to highly conserved repetitive
sequences present in multiple copies on the genome Since the distance between repetitive
elements among strains are varies the DNA sequences that are peR amplified between
them will result in production of a distinct fingerprint Although the classical and
microbiological methods can perfectly adequate to identify microorganisms on species
level based on the identification of phenotypic marker those methods are not reliable
enough to differentiate the microorganisms further into single strains (GTG)s peR is one
of the available molecular typing procedures that is applied to show clonal and close
relationships between microorganism isolates of one species (GTG)s peR gives an insight
into the evolutionary dynamics of the bacterial genome and has shown to be rapid
sensitive di criminative and cost effective in genotyping the aquaculture-associated
bacteria isolates from Malaysia (Shariff 2006)
6
25 Amplification of 16s rRNA
The ribosomal operons mainly 16S rRNA has proven to be a stable and specific
molecular marker for the identification of bacteria 16s rRNA gene sequences are the most
common housekeeping genetic marker that has been used to study bacterial phylogeny and
taxonomy for a number of reasons One of the reasons is because it is presence in almost
all bacteria often existing as operons or a mUltigene family Besides 16s rRNA gene
function has not changed over time thus suggesting that random sequence changes are a
more accurate measure of time Furthermore the size of 16S rRNA gene (1500 bp) is
large enough to be used for informatics purposes As stated in the Approved Lists in 1980
1791 valid names were recognized at the rank of species but today this number has
expanded rapidly to 8168 species a 456 increase This explosion in the number of
recognized taxa directly attribute to the ease in performance of 16S rRNA gene sequencing
studies as opposed to the more cumbrous manipulations involving DNA-DNA
hybridization investigations
7
--
30 Methodology
31 Collection o( Water and Swab Samples
The water and swab samples were collected from 9 emergency eyewash stations 6
eyewash stations at Faculty of Resource Science and Technology and 3 eyewash stations at
External Laboratory The water samples were collected in sterile 50 mL Falcon tubes
containing 01 mL 10 sodium thiosulphate while the swab samples were collected by
using pre-sterilized cotton buds into 15 mL sterile Falcon tubes containing 2 mL 001
peptone water The samples were stored in an ice box before being analyzed in the
laboratory
Table 31 The location and source code for the emergency eyewash stations
FRST Source code External Laboratory Source code
1-2 ZA A G-l Z3A G
2-1 ZA B G-2 Z3B H
2-5 ZB C 1-2 Z3B I
LG-7 ZC D
1-6 ZC E
3-6 ZD F 910
8
-------- shy
32 Samples Proce ing
01 mL of the water sample was aseptically transferred onto a Nutrient agar (Oxoid
England) using a sterile pipette The water sample was spread over surface ofthe agar with
a cool sterilized glass spreader by touching the spreader to the agar and rotating the agar
plate The glass spreader was sterilized by dipping it in alcohol and flaming it with Bunsen
burner flame For swab samples the samples were streaked onto agar surface by using a
sterilized inoculating loop The inoculating loop was sterilized by passing it through the
Bunsen burner flame and allowed to cool before it was used to spread the bacteria over the
agar surface Then the plates were incubated at 37degC for overnight while inverted
Following the incubation the colonies formed on the nutrient agar were counted
33 Bacteria Isolation
By using a sterile inoculating loop a colony was picked up from the nutrient agar
and re-streaked onto a new nutrient agar Then the inverted plates were incubated at 37degC
for overnight After the incubation two single colonies from the new agar plates were
picked up by using a sterile inoculating loop and each colony was re-streaked again onto
different new agar plates to obtain pure bacterial culture Later the plates were incubated
overnight at 37degC The isolates were labelled following the formula that has been
described by Hutter et al (2003)
Table 32 The formula used to label the isolates
Xyn
x= sources of water and swab samples (ABCDEFGH and I)
y = replicates of agar plates (123 and 4)
n = the pure culture obtain from the streaking (a and b)
9
-~ ---- _ shy
34 DNA Extraction
DNA extraction was conducted according to boiling-centrifugation method as
described by Soumet et at (1994) with few modifications About 1500 III of bacterial
culture was transferred into a sterile 15 ml microcentrifuge tube and centrifuged at 10000
rpm for 5 minutes After that the supernatant formed was discarded and the cell was
harvested Later 250 III of sterile distilled water was added to the remaining pellet and the
microcentrifuge tube was vortexed to resuspend the pellet After that the suspension was
boiled at 100degC for 10 minutes and cooled immediately at -20degC for 5 minutes Lastly
the microcentrifuge tube will be centrifuged again at 10000 rpm for 10 minutes The
supernatant will be transferred to new microcentrifuge tubes and will be stored for peR
analysis
10
35 (GTG)s peR Fingerprinting
(GTG)s PCR was performed according to Matsheka et at (2006) with few
modifications The primer that was used is (GTG)5 with the sequence of
(GTG)s 5-GTG GTG GTG GTG GTG-3
The PCR reaction mixture is shown in table 33
Table 33 peR reaction set-up for (GTG)s
peR Mixture Quantity (111)
5U~1 DNA Taq Polymerase 030
25 ~M (GTG)s primer 100
25 mMMgCh 300
10 mM dNTPs 080
Ultrapure water 990
lOX peR Buffer 500
Template DNA 500
Total 2500
After being mixed in the wendorf tube about 25 ~I of the peR mixture with
DNA template was ali quoted into each peR tube Next the peR tubes were put into
SenseQuest thermal cycler to undergo peR amplification reaction The amplification of the
(GTG)5 region was carried out according to the conditions shown in Table 33
11
Table 34 (GTG)s peR amplitication conditions
Condition Temperature Time Number of cycles
Pre-denaturation 95dege 7 minutes 1
Denturation 95dege 2 minutes 4
Annealing 36dege 2 minutes 4
Extension 72dege 2 minutes 4
Denaturation 95dege 1 minute 30
Annealing 50 0 e 1 minute 30
Extension 72 dege 1 minute 30
Final extension 72 dege 5 minutes
36 Agarose Gel Electrophoresis (AGE)
5 Jl1 of the amplified peR product was electrophoresed on 15 agarose gel
containing 01 Jl1 of 10 mgml Ethidium Bromide (EtBr) in IX Tris-Acetate-EDTA (TAE)
buffer at 100 V for 40 minutes DNA marker of 1 kb ladder from Promega was used and
the gel was visualized by using UV transilluminator (GeIDoc) According to the banding
patterns that were obtained scoring was done by using binary data format The presence of
band was scored as 1 while thabsence of band was scored as 0 Next the data was
input in the DendoUPGMA online software to generate a dendrogram of neighbour joining
tree (NJTREE) based on the calculated genetic distances that were determined according to
the Dice formulation (Nei and Li 1979)
37 Amplification of 16s rRNA using peR
PCR was performed according to Hutter et al (2003) with some modifications The
PCR reaction is shown in Table 35
Table 35 PCR reaction set-up for amplification of 16s rRNA
PCR Mixture Quantity btl)
SUI ~l Taq Polymerase 400
25 pmol forward primer (27F) 400
25 pmol reverse primer (519 R) 400
25 mMMgCh 600
10 mM dNTPs 200
Ultrapure water 5600
lOX PCR Buffer 2000
Template DNA 400
Total 10000
Table 36 The primer sequence and expected size of the PCR product
Primer Type Primer Sequence Expected Size of PCR
Product
Forward Universal 5-AGAGTTTGATCMTGGCTCAG-3
(27F)
Reverse Universal 5-GWAITACCGCGGCKGCTG-3 500 bp
(519R)
After being mixed in the Eppendorf tube about 1 00 ~I of the PCR mixture with
DNA template was aliquoted into each PCR tube Next the PCR tubes were put into
eQuest thermal cycler to undergo PCR amplification reaction The PCR amplification
of 16s rRNA was performed according to the conditions shown in Table 37
13
- - ~---
Table 37 16S rRNA amplification conditions
Condition Temperature Time Number of cycles
Pre-denaturation 95degC 10 minutes 1
Denaturation 94 degC 30 seconds 30
Annealing 55degC 1 minutes 30
Extension 72 degC 15 minutes 30
Final extension 72 degC 10 minutes
After the peR process the PCR products were undergone agarose gel
electrophoresis where 80 III of the PCR product was loaded into 1 (wv) agarose gel The
1 (wv) agarose gel was done by adding 05 g of agarose powder in 50 mL of IX TAE
buffer Then the mixture was heating in microwave for 50 seconds to completely dissolve
the agarose powder in the T AE buffer followed by the addition of 2 III of ethidium
bromide into the solution The loaded gel was run at 90 V for 45 minutes before it was
visualized using the UV transilluminator to observe for DNA bands
14
38 Purification of peR Products
The PCR products were purified by using the Wizardreg SV Gel and PCR Clean-Up
System (Promega USA) Firstly following gel electrophoresis the DNA band was excised
from the gel by using a sterile and sharp scalpel The gel slice was placed in a 15 mL
microcentrifuge tube and 10 III Membrane Binding Solution was added per 10 mg of gel
slice The tube was incubated at 50 degC until the gel slice has completely dissolved To help
dissolve the gel the tube was vortexed every 2-3 minutes Meanwhile the SV Minicolumn
was inserted into the Collection Tube After the gel has completely dissolved the dissolved
gel mixture was transferred to the Minicolumn assembly and was incubated at room
temperature for 1 minute before it was centrifuged at 13 500 rpm for 1 minute The
flowthrough was discarded and the Minicolumn was re-inserted into Collection Tube
Next 700 III Membrane Wash Solution was added into the Minicolumn assembly and it
was centrifuged at 13 500 rpm for 1 minute The flowthrough was discarded and the
Minicolumn was re-inserted into Collection Tube Then step was repeated by adding 500
III Membrane Wash Solution and centrifuged at 13 500 rpm for 5 minutes The Collection
Tube was emptied and the column assembly was re-centrifuged for 1 minute with the
microcentrifuge lid off to allow evaporation of any residual ethanol Later the Minicolumn
was transferred carefully to a cle~5 microcentrifuge tube and 50 III of Nuclease-Free
Water was added to the Minicolumn The Minicolumn was incubated at room temperature
for 1 minute before it was centrifuged at 13 500 rpm for 1 minute The Minicolumn was
discarded and the DNA was stored at -20 0c The purified DNA then was analysed on 1
(wv) agarose gel by adding 1 volume of dye to 1 volume of the purified DNA
15
-----~----~-~
40 RESULTS
4 t Dumeration of Bacteria
1be water samples were spread on the Nutrient agar without diluted while the swab
samples were streaked on the surface of the agar The results for the number of colonies
that were formed on the nutrient agar following an overnight incubation were shown in
Table 41
Table 41 The number of cells (colony-forming units) formed per millilitre of original sample
Sample Number of cells (colony -forming units)
per millilitre of original sample
A(l) 178
A(2) 134
B(1) TNTC
B(2) I 125
C(l) 2
C(2) 8
0(1) 33
D(2) 2
E(l) ~ 0
E(2) 0
F(1) TNTC
F(2) 34
G(I) 0
G(2) 2
H(I) I
43
16
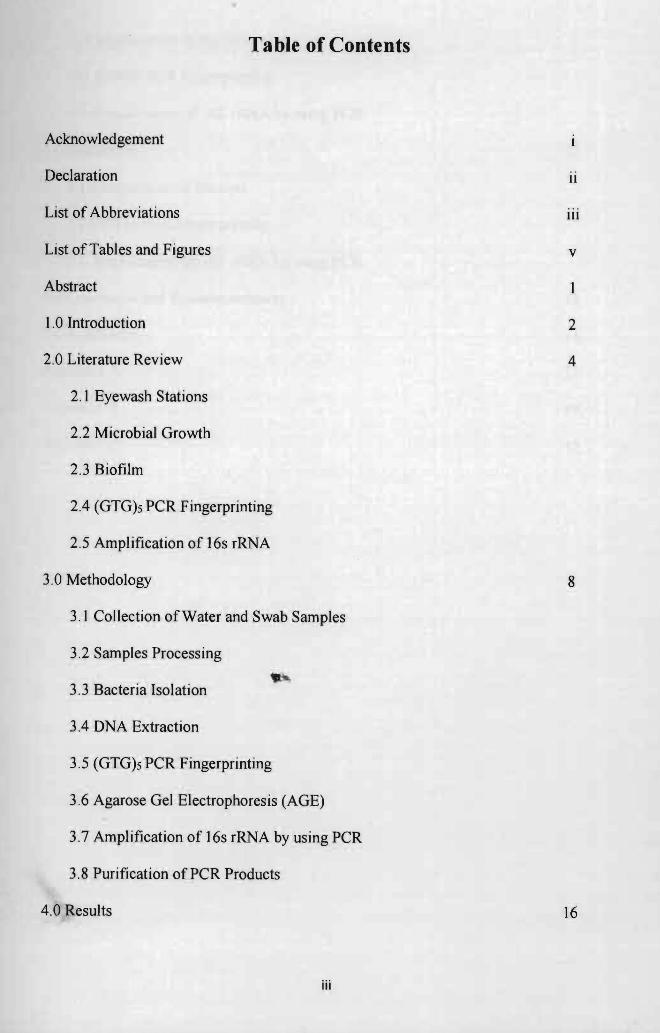
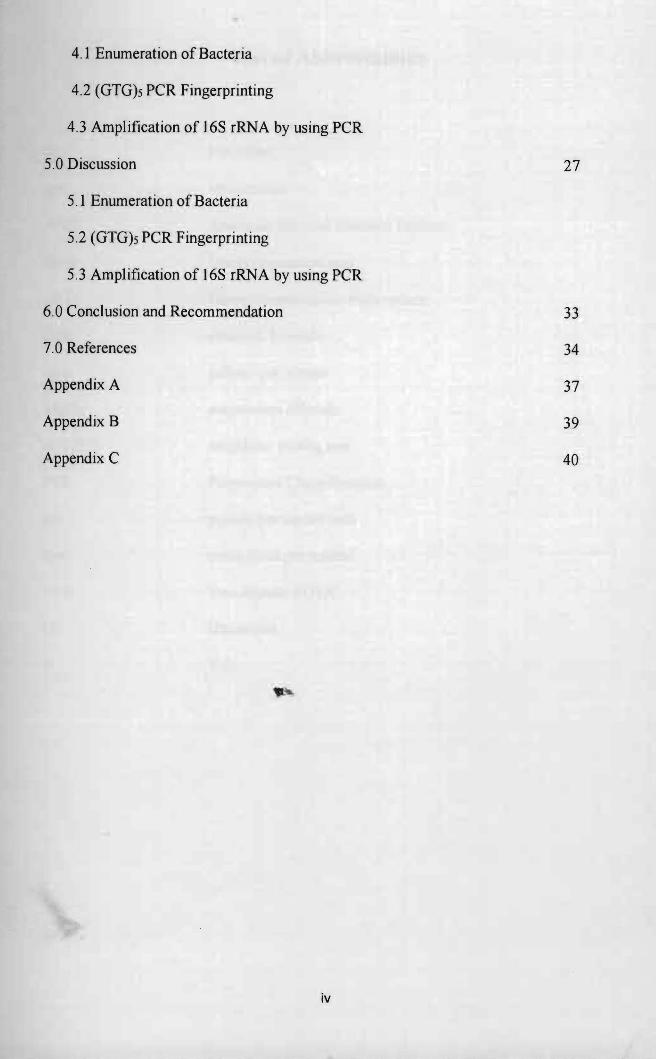
--
-- - - -
41 Enumeration of Bacteria
42 (GTG)s PCR Fingerprinting
43 Amplification of 16S rRNA by using PCR
50 Discussion 27
51 Enumeration of Bacteria
52 (GTG)s PCR Fingerprinting
53 Amplification of 16S rRNA by using PCR
60 Conclusion and Recommendation 33
70 References 34
Appendix A 37
Appendix B 39
Appendix C 40
iv
-----
List of Abbreviations
III Microliter
Ilm Micrometer
ANSI American National Standard Institute
DNA Deoxyribonucleic acid
dNTP Deoxyribonucleotide triphosphate
EtBr ethidium bromide
gpm gallons per minute
MgCh magnesium chloride
NJTREE neighbour joining tree
PCR Polymerase Chain Reaction
pSI pounds per square inch
rpm revolutions per minute
TAE Tris-Acetate-EDT A
UV Ultraviolet
V Volt
v
I
- ------ -----
I
List of Tables
Table
31 The location and source code for the emergency eyewash 8
I stations
I 32 The format used to label the isolates 9
33 peR reaction set-up for (GTG)5 II
34 (GTG)5 peR amplification conditions 12
35 peR reaction set-up for amplification of 16S rRNA 13
36 The primer sequence and expected size of the peR product 13
37 (GTG)5 peR amplification conditions 14
41 The number of cells (colony-forming units) formed per 16
millilitre of original sample
42 The Isolation code identity and similarity of the isolates after 26
using BLAST search at NeBI
vi
----
List of Figures
Figures
41 The colonies formed on the nutrient agar following spread 17
plate method
42 (GTG)s peR agarose gel result 18
43 (GTG)s peR agarose gel result 19
44 (GTG)s peR agarose gel result 20
45 (GTG)s peR agarose gel result 21
46 (GTG)s peR agarose gel result 22
47 (GTG)s peR agarose gel result 23
48 Dendrogram based on (GTG)s peR 24
49 Amplification of 16s rRNA result 25
vii
Microbiological AnalysisofWater Quality of Eye-wash Stations in Faculty of Resource Science and Technology and External Laboratory
Fairuz Awatif binti Ismail (34824)
Resource Biotechnology Faculty of Resource Science and Technology
Universiti Malaysia Sarawak
ABSTRACT
Emergency eyewash station is a very important component that provides the laboratories with emergency aid during experimental accidents In this project microbiological water quality of the emergency eyewash stations in Faculty of Resource Science and Technology and External Laboratory were determined Samples of water and swabs were collected from 6 eyewash stations in Faculty of Resource Science and Technology and 3 eyewash stations in External Laboratory These samples were analysed for the presence of bacteria The samples were transferred onto a Nutrient Agar spread on it and incubated for overnight at 37dege to grow the bacteria The bacteria colonies were isolated and streaked onto new nutrient agar to obtain pure bacterial culture The bacterial DNA were extracted from the bacteria isolates by boiling-centrifugation method The genetic variations among the bacteria were analysed using (GTG)s peR The phylogenetic tree was constructed based on the DNA fingerprinting to illustrate the relationship among the bacteria isolates From the dendrogram constructed 11 representative isolates were chose to undergo amplification of the 16s rRNA for sequencing The 11 isolates were recognized to be from 9 species which are Lysinibacillus sphaericus Cupriavidus metallidurans Staphylococcus epdermidis Sphingomonas wittichii Brevibacillus brevis Delftia acidovorans Bacillus pumilus Kocwia rhizophila and Bacillus thuringiensis in which the bacteria can cause human infections that may harm the users
Keywords microbiological analysis (GTG)s peR 16s RNA phylogenetic tree
ABSTRAK
Slesen cuci mata keselamatan merupakan komponen yang amat penting dalam menyediakan bantuan kecemasan semasa berlakunya kemalangan di makmal Dalam projek ini kualiti air di Slesen-stesen cuci mata keselamatan di Fakulti Sains dan Teknologi Sumber dan Makmal Luar dilentukan dari segi mikrobiologikal SlWtpel-sampel air dan swab diambil dari 6 stesen cuci mata keseamatan di Fakulti Sa ins dan Teknologi Sumber dan 3 stesen cuci mata keselamatan di Malanal Luar Sampel-sampel ini dianalisis untuk kehadiran bakteria Sampel-sampel tersebut dipindahkan ke agar nutrien dan diinkubasi semalaman pada suhu 3 lOC bertujuan untuk menghidupkan bakteria Koloni-koloni bakteria diasingkan dan dicoreng pada agar nutrien yang bani untuk mendapatkan kutur bakteria tulen DNA bakteria diekstrak menggunakan kaedah didih-pintal Variasi genetik antara bakteria dianalisis melalui (GTG)s PCR Pokok filogenetik dibina berdasarkan cap jari DNA untuk menggambarkan hubungan antara bakteria Berdasarkan dendrogram 11 bakteria dipilih untuk menjalani amplifikasi 16s rRNA 11 bakteria tersebut dikena pasti terdiri daripada 9 spesiesi iaitu Lysinibacillus sphaericus Cuprialidus melallidurans Staphylococcus epidermidis Sphingomonas wittichii Brevibacillus brevis De(fiia acidolorans Bacillus pumilus Kocuria rhizophila and Bacillus thuringiensis di mana bakteriashyhakteria tersebut boleh menyebabkanjangkilan kepada manllsia
Kala kmci analisis mikrobiologikal (GTG)s PCR 16s RNA pokokfilogenetik
1
- --------
10 Introduction
Emergency eyewash station provides the laboratories with emergency aid during
experimental accidents The main purpose of the eyewash station is to bathe the eyes that
are attacked by hazardous chemicals with a substantial amount of water while allowing
hands to hold the eyelids open For more than 100 years tap water has been used as the
source of water for the eyewash stations (Safety com nd)
There are microorganisms and bacteria that are commonly found in the tap water
makjng it contaminated such as Acanthamoeba Pseudomonas aeurginosa anteric bacilli
and Entamoeba in which some of these are proven to cause eye infection Besides there is
a high possibility that the water in the tap is contaminated by animals such as mouse that
might urinate in the water source The eyes defense system is reduced when it is under
attacked by hazardous chemicals and the contaminated tap water will increase the risk of
eye infection (Hurley 2000)
The total number of people that are died from waterborne disease is approximately
34 million each year as stated by World Health Organization (rapidmicrobiologycom
nd) The waterborne disease is caused through the contact with or consumption of water
that contain the pathogenic microorganisms This shows that the pathogenic
microorganisms that exist in water calYOOuse a severe effect on people
The purpose of this study is to analyse the microbes in the water of the eyewash
stations in the Faculty of Resource Science and Technology and External Laboratory The
objectives of this experiment are to
I) Isolate the microbes that exist in the water of the eyewash stations
2) Identify the microbes by sequencing results of the amplification of 16s rRNA gene
2
Problem statement
There are a few water dispenser stations In FRST that have been assessed to contain
bacteria Leptospira sp that may cause leptospirosis which will harm the users Due to the
water dispenser stations and some emergency eyewash stations that shared the same
sources of water the microbiological water quality of water from emergency eye-wash
stations in FRST and External Laboratory will be analysed to determine whether microbes
that presence in the water can cause infection to the eyes and give harm to the users
3
---- shy
20 Literature Review
21 Eyewash Station
There are two major categories of eyewash station which are plumbed units and
portable units For plumbed units the water supply must be at 30 psi and flow
simultaneously at a low velocity into both eyes to reduce eye injury Both categories of the
eyewash stations are installed between 33 inches and 45 inches above the ground and 6
inches away from the wall This position ofthe eyewash station will allow enough space to
hold the eyelids open with the hands while the water is flowing For an eyewash only
station the flow of water must be supplied at 04 gpm for 15 minutes whereas for an
eyewash that is combined with face wash unit the flow of water must be supplied at 3 gpm
for 15 minutes These two units are differ in the size of the nozzle and spray pattern The
nozzles have to face upward in order for the eyewash station to functionally operate and
must be protected to prevent any contaminants that may clog the openings or provide a
suitable condition that will allow microorganisms to breed (Cameron 2001)
22 Microbial Growth
Microbial growth is one oifRe major concerns of emergency eyewash safety that
regular flushing of the eyewash is a mandated part of the ANSI standard (ANSI Z3581shy
2004) As described by Bowman et al (1996) through the experiments on flushing
eyewash and shower systems flushing of a plumbed system will help to lower the
microbial growth The microbial growth will develop if the systems are not well
maintained and if the water in the system remains stagnant for a long period of time
Hurley 2000)
4
-----
In 1999 a ~urvey was conducted by Fendall Company on 200 manufacturing facilities and
58 of the eyewash stations were found to contain the pseudomonas bacteria (Hurley
2000) Besides the Pseudomonas spp Legionella spp and Amoeba also have been isolated
from the eyewash stations based on the experiment conducted by Paszko-Kolva et al
(1990) Eye infections caused by Acanthamoeba spp and Pseudomonas spp is generally
resistant to antibiotic therapy The growth of Legionella spp is helped by the temperature
of eyewash stations tepid water range (16degC-38degC) that overlaps with the ideal growth
temperature ofLegionella spp (35degC) The primary route of infection of Legionella spp is
via inhalation
The body defense system will be greatly reduced when under attack by hazardous
chemical and thus exposure to these microbes at the time of body being attacked will
increase the risk of infection (Hurley 2000)
23 Biofilm
Biofilm will be formed if the eyewash station is left with little maintenance It may
attach to the inside surface of the water line or self-contained device and continue to grow
where it will provide a source of bacterial contamination that cannot be removed by
periodic flushing (Hurley 2000) ~films are recognized as microbial communities that
consist of a variety of microbial cells including the pathogens such as
Salmonella Typhimurium Campylobacter Pseudomonas aeruginosa and Aeromonas
hydrophila It develops over time to become more complex and extensive thus protect
individual bacterial cells from any antimicrobial compounds in water including chlorine
Most of the bacteria found in drinking water distribution system is recognised to be within
biofilms rather than Jive freely in the water itself The presence of biofilms growth will
5
-
influence the microbiological analysis conducted as it will make the representative water
samples difficult to be obtained
24 (GTG)5 pe R Fingerprinting
In order to control public health nowadays the epidemiological typing of bacteria
or pathogens has become weightier One type of commonly used peR is the repetitiveshy
peR that imply the use of primers complementary to highly conserved repetitive
sequences present in multiple copies on the genome Since the distance between repetitive
elements among strains are varies the DNA sequences that are peR amplified between
them will result in production of a distinct fingerprint Although the classical and
microbiological methods can perfectly adequate to identify microorganisms on species
level based on the identification of phenotypic marker those methods are not reliable
enough to differentiate the microorganisms further into single strains (GTG)s peR is one
of the available molecular typing procedures that is applied to show clonal and close
relationships between microorganism isolates of one species (GTG)s peR gives an insight
into the evolutionary dynamics of the bacterial genome and has shown to be rapid
sensitive di criminative and cost effective in genotyping the aquaculture-associated
bacteria isolates from Malaysia (Shariff 2006)
6
25 Amplification of 16s rRNA
The ribosomal operons mainly 16S rRNA has proven to be a stable and specific
molecular marker for the identification of bacteria 16s rRNA gene sequences are the most
common housekeeping genetic marker that has been used to study bacterial phylogeny and
taxonomy for a number of reasons One of the reasons is because it is presence in almost
all bacteria often existing as operons or a mUltigene family Besides 16s rRNA gene
function has not changed over time thus suggesting that random sequence changes are a
more accurate measure of time Furthermore the size of 16S rRNA gene (1500 bp) is
large enough to be used for informatics purposes As stated in the Approved Lists in 1980
1791 valid names were recognized at the rank of species but today this number has
expanded rapidly to 8168 species a 456 increase This explosion in the number of
recognized taxa directly attribute to the ease in performance of 16S rRNA gene sequencing
studies as opposed to the more cumbrous manipulations involving DNA-DNA
hybridization investigations
7
--
30 Methodology
31 Collection o( Water and Swab Samples
The water and swab samples were collected from 9 emergency eyewash stations 6
eyewash stations at Faculty of Resource Science and Technology and 3 eyewash stations at
External Laboratory The water samples were collected in sterile 50 mL Falcon tubes
containing 01 mL 10 sodium thiosulphate while the swab samples were collected by
using pre-sterilized cotton buds into 15 mL sterile Falcon tubes containing 2 mL 001
peptone water The samples were stored in an ice box before being analyzed in the
laboratory
Table 31 The location and source code for the emergency eyewash stations
FRST Source code External Laboratory Source code
1-2 ZA A G-l Z3A G
2-1 ZA B G-2 Z3B H
2-5 ZB C 1-2 Z3B I
LG-7 ZC D
1-6 ZC E
3-6 ZD F 910
8
-------- shy
32 Samples Proce ing
01 mL of the water sample was aseptically transferred onto a Nutrient agar (Oxoid
England) using a sterile pipette The water sample was spread over surface ofthe agar with
a cool sterilized glass spreader by touching the spreader to the agar and rotating the agar
plate The glass spreader was sterilized by dipping it in alcohol and flaming it with Bunsen
burner flame For swab samples the samples were streaked onto agar surface by using a
sterilized inoculating loop The inoculating loop was sterilized by passing it through the
Bunsen burner flame and allowed to cool before it was used to spread the bacteria over the
agar surface Then the plates were incubated at 37degC for overnight while inverted
Following the incubation the colonies formed on the nutrient agar were counted
33 Bacteria Isolation
By using a sterile inoculating loop a colony was picked up from the nutrient agar
and re-streaked onto a new nutrient agar Then the inverted plates were incubated at 37degC
for overnight After the incubation two single colonies from the new agar plates were
picked up by using a sterile inoculating loop and each colony was re-streaked again onto
different new agar plates to obtain pure bacterial culture Later the plates were incubated
overnight at 37degC The isolates were labelled following the formula that has been
described by Hutter et al (2003)
Table 32 The formula used to label the isolates
Xyn
x= sources of water and swab samples (ABCDEFGH and I)
y = replicates of agar plates (123 and 4)
n = the pure culture obtain from the streaking (a and b)
9
-~ ---- _ shy
34 DNA Extraction
DNA extraction was conducted according to boiling-centrifugation method as
described by Soumet et at (1994) with few modifications About 1500 III of bacterial
culture was transferred into a sterile 15 ml microcentrifuge tube and centrifuged at 10000
rpm for 5 minutes After that the supernatant formed was discarded and the cell was
harvested Later 250 III of sterile distilled water was added to the remaining pellet and the
microcentrifuge tube was vortexed to resuspend the pellet After that the suspension was
boiled at 100degC for 10 minutes and cooled immediately at -20degC for 5 minutes Lastly
the microcentrifuge tube will be centrifuged again at 10000 rpm for 10 minutes The
supernatant will be transferred to new microcentrifuge tubes and will be stored for peR
analysis
10
35 (GTG)s peR Fingerprinting
(GTG)s PCR was performed according to Matsheka et at (2006) with few
modifications The primer that was used is (GTG)5 with the sequence of
(GTG)s 5-GTG GTG GTG GTG GTG-3
The PCR reaction mixture is shown in table 33
Table 33 peR reaction set-up for (GTG)s
peR Mixture Quantity (111)
5U~1 DNA Taq Polymerase 030
25 ~M (GTG)s primer 100
25 mMMgCh 300
10 mM dNTPs 080
Ultrapure water 990
lOX peR Buffer 500
Template DNA 500
Total 2500
After being mixed in the wendorf tube about 25 ~I of the peR mixture with
DNA template was ali quoted into each peR tube Next the peR tubes were put into
SenseQuest thermal cycler to undergo peR amplification reaction The amplification of the
(GTG)5 region was carried out according to the conditions shown in Table 33
11
Table 34 (GTG)s peR amplitication conditions
Condition Temperature Time Number of cycles
Pre-denaturation 95dege 7 minutes 1
Denturation 95dege 2 minutes 4
Annealing 36dege 2 minutes 4
Extension 72dege 2 minutes 4
Denaturation 95dege 1 minute 30
Annealing 50 0 e 1 minute 30
Extension 72 dege 1 minute 30
Final extension 72 dege 5 minutes
36 Agarose Gel Electrophoresis (AGE)
5 Jl1 of the amplified peR product was electrophoresed on 15 agarose gel
containing 01 Jl1 of 10 mgml Ethidium Bromide (EtBr) in IX Tris-Acetate-EDTA (TAE)
buffer at 100 V for 40 minutes DNA marker of 1 kb ladder from Promega was used and
the gel was visualized by using UV transilluminator (GeIDoc) According to the banding
patterns that were obtained scoring was done by using binary data format The presence of
band was scored as 1 while thabsence of band was scored as 0 Next the data was
input in the DendoUPGMA online software to generate a dendrogram of neighbour joining
tree (NJTREE) based on the calculated genetic distances that were determined according to
the Dice formulation (Nei and Li 1979)
37 Amplification of 16s rRNA using peR
PCR was performed according to Hutter et al (2003) with some modifications The
PCR reaction is shown in Table 35
Table 35 PCR reaction set-up for amplification of 16s rRNA
PCR Mixture Quantity btl)
SUI ~l Taq Polymerase 400
25 pmol forward primer (27F) 400
25 pmol reverse primer (519 R) 400
25 mMMgCh 600
10 mM dNTPs 200
Ultrapure water 5600
lOX PCR Buffer 2000
Template DNA 400
Total 10000
Table 36 The primer sequence and expected size of the PCR product
Primer Type Primer Sequence Expected Size of PCR
Product
Forward Universal 5-AGAGTTTGATCMTGGCTCAG-3
(27F)
Reverse Universal 5-GWAITACCGCGGCKGCTG-3 500 bp
(519R)
After being mixed in the Eppendorf tube about 1 00 ~I of the PCR mixture with
DNA template was aliquoted into each PCR tube Next the PCR tubes were put into
eQuest thermal cycler to undergo PCR amplification reaction The PCR amplification
of 16s rRNA was performed according to the conditions shown in Table 37
13
- - ~---
Table 37 16S rRNA amplification conditions
Condition Temperature Time Number of cycles
Pre-denaturation 95degC 10 minutes 1
Denaturation 94 degC 30 seconds 30
Annealing 55degC 1 minutes 30
Extension 72 degC 15 minutes 30
Final extension 72 degC 10 minutes
After the peR process the PCR products were undergone agarose gel
electrophoresis where 80 III of the PCR product was loaded into 1 (wv) agarose gel The
1 (wv) agarose gel was done by adding 05 g of agarose powder in 50 mL of IX TAE
buffer Then the mixture was heating in microwave for 50 seconds to completely dissolve
the agarose powder in the T AE buffer followed by the addition of 2 III of ethidium
bromide into the solution The loaded gel was run at 90 V for 45 minutes before it was
visualized using the UV transilluminator to observe for DNA bands
14
38 Purification of peR Products
The PCR products were purified by using the Wizardreg SV Gel and PCR Clean-Up
System (Promega USA) Firstly following gel electrophoresis the DNA band was excised
from the gel by using a sterile and sharp scalpel The gel slice was placed in a 15 mL
microcentrifuge tube and 10 III Membrane Binding Solution was added per 10 mg of gel
slice The tube was incubated at 50 degC until the gel slice has completely dissolved To help
dissolve the gel the tube was vortexed every 2-3 minutes Meanwhile the SV Minicolumn
was inserted into the Collection Tube After the gel has completely dissolved the dissolved
gel mixture was transferred to the Minicolumn assembly and was incubated at room
temperature for 1 minute before it was centrifuged at 13 500 rpm for 1 minute The
flowthrough was discarded and the Minicolumn was re-inserted into Collection Tube
Next 700 III Membrane Wash Solution was added into the Minicolumn assembly and it
was centrifuged at 13 500 rpm for 1 minute The flowthrough was discarded and the
Minicolumn was re-inserted into Collection Tube Then step was repeated by adding 500
III Membrane Wash Solution and centrifuged at 13 500 rpm for 5 minutes The Collection
Tube was emptied and the column assembly was re-centrifuged for 1 minute with the
microcentrifuge lid off to allow evaporation of any residual ethanol Later the Minicolumn
was transferred carefully to a cle~5 microcentrifuge tube and 50 III of Nuclease-Free
Water was added to the Minicolumn The Minicolumn was incubated at room temperature
for 1 minute before it was centrifuged at 13 500 rpm for 1 minute The Minicolumn was
discarded and the DNA was stored at -20 0c The purified DNA then was analysed on 1
(wv) agarose gel by adding 1 volume of dye to 1 volume of the purified DNA
15
-----~----~-~
40 RESULTS
4 t Dumeration of Bacteria
1be water samples were spread on the Nutrient agar without diluted while the swab
samples were streaked on the surface of the agar The results for the number of colonies
that were formed on the nutrient agar following an overnight incubation were shown in
Table 41
Table 41 The number of cells (colony-forming units) formed per millilitre of original sample
Sample Number of cells (colony -forming units)
per millilitre of original sample
A(l) 178
A(2) 134
B(1) TNTC
B(2) I 125
C(l) 2
C(2) 8
0(1) 33
D(2) 2
E(l) ~ 0
E(2) 0
F(1) TNTC
F(2) 34
G(I) 0
G(2) 2
H(I) I
43
16
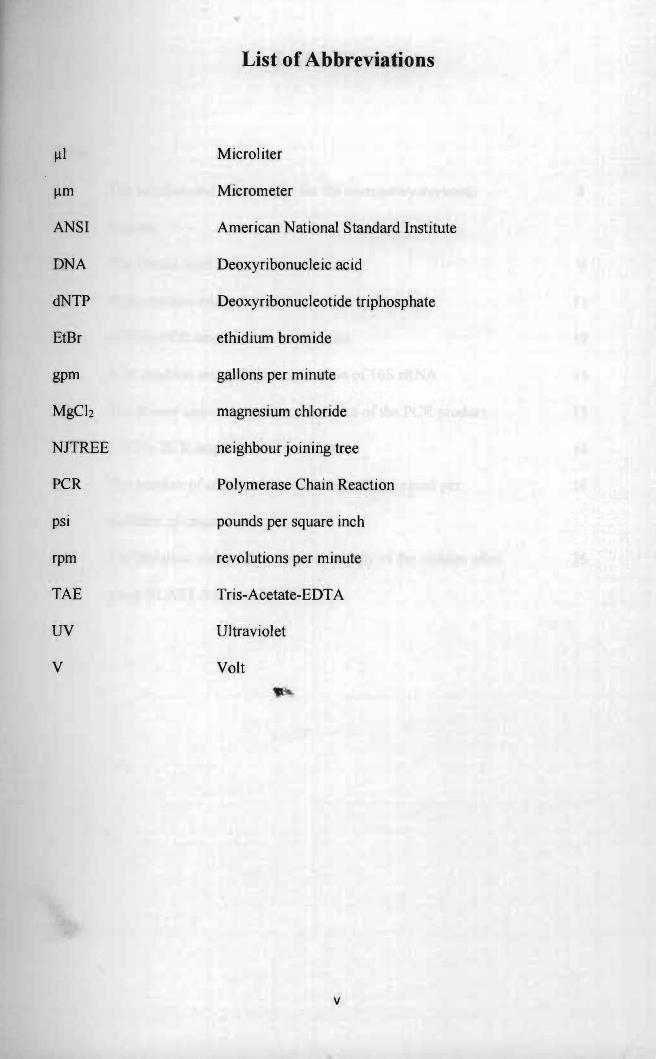
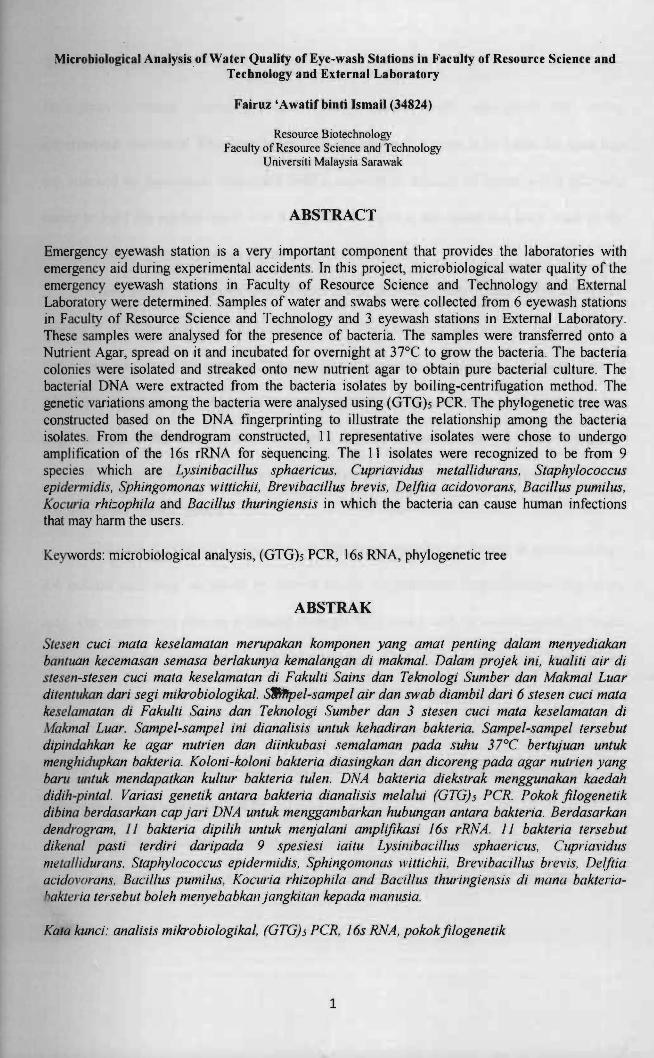
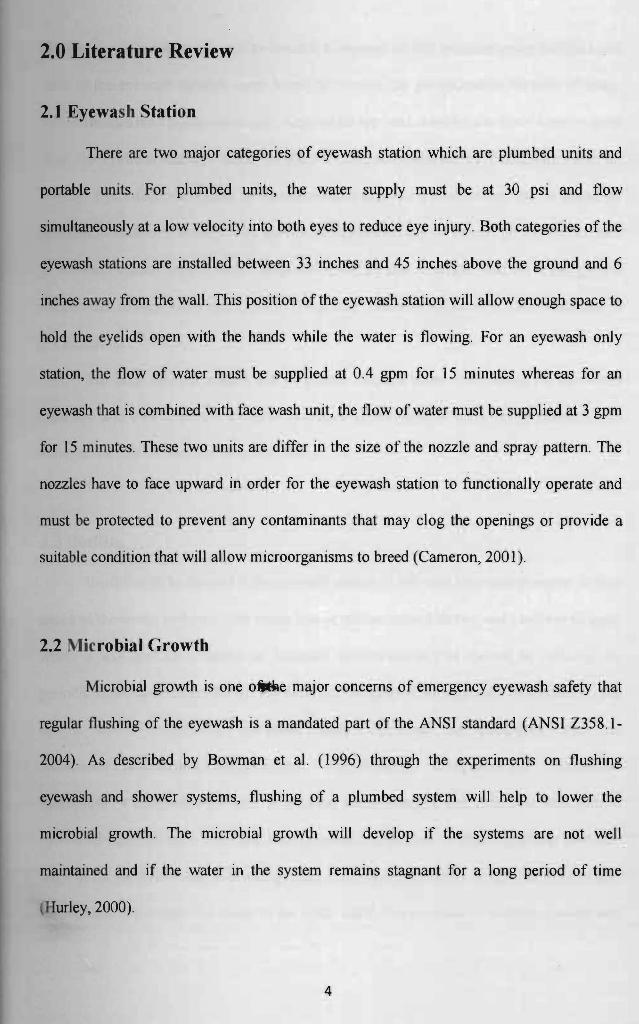
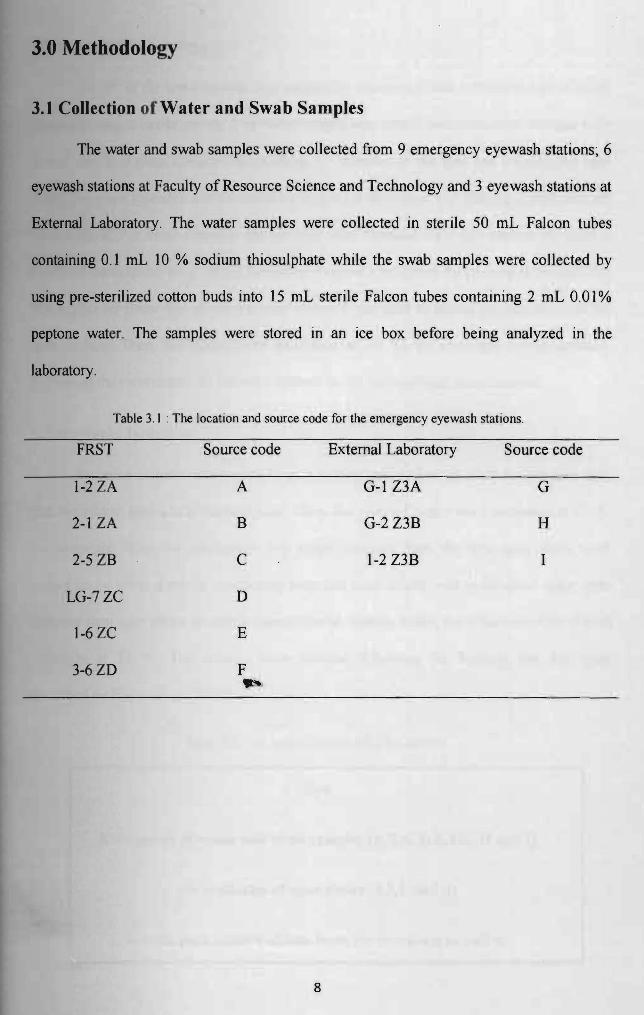
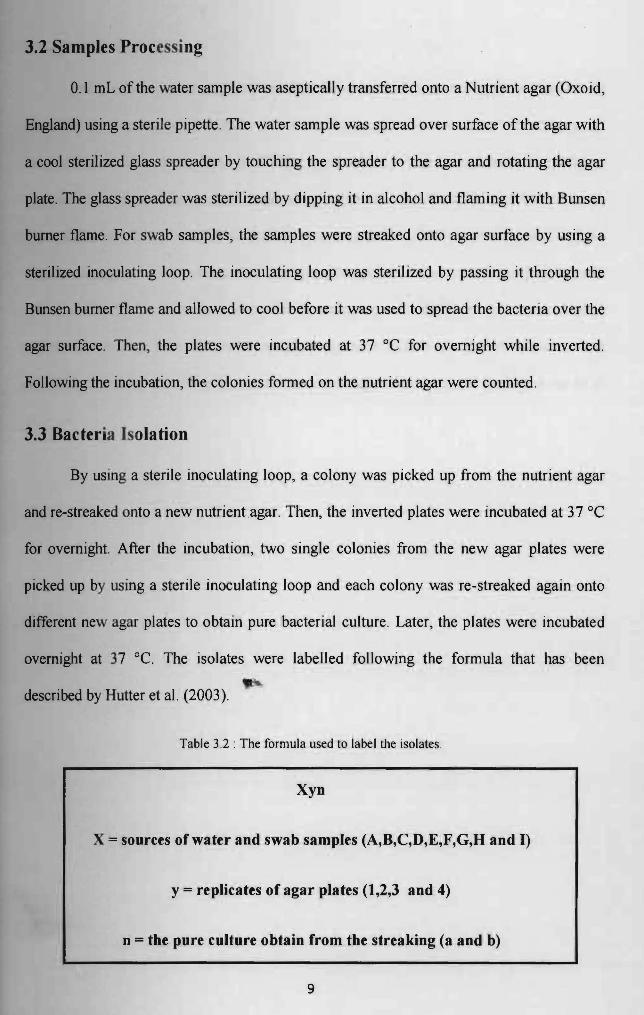
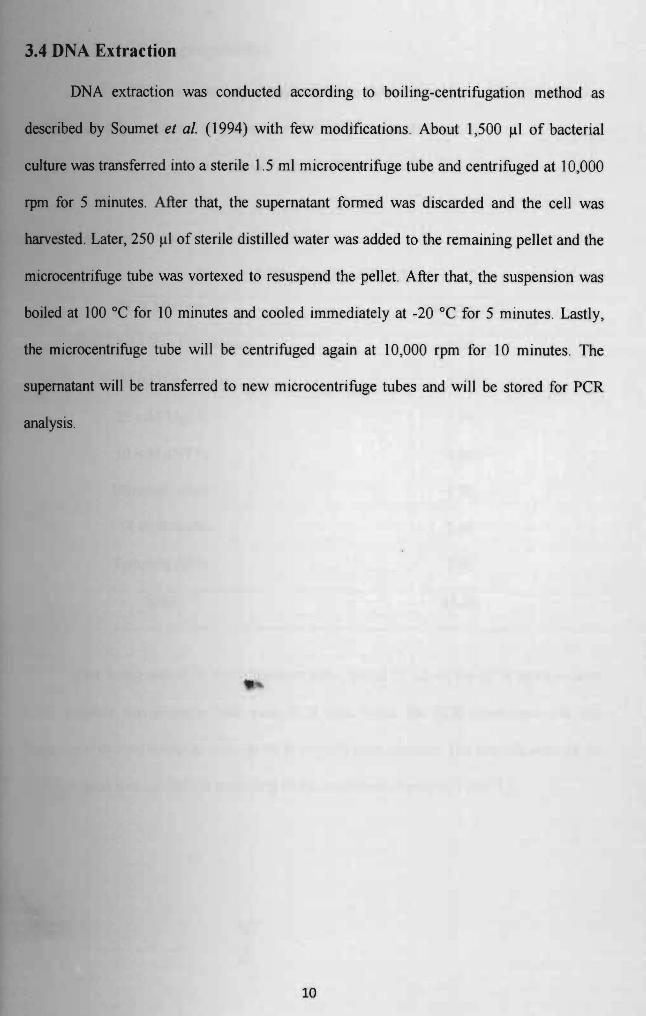
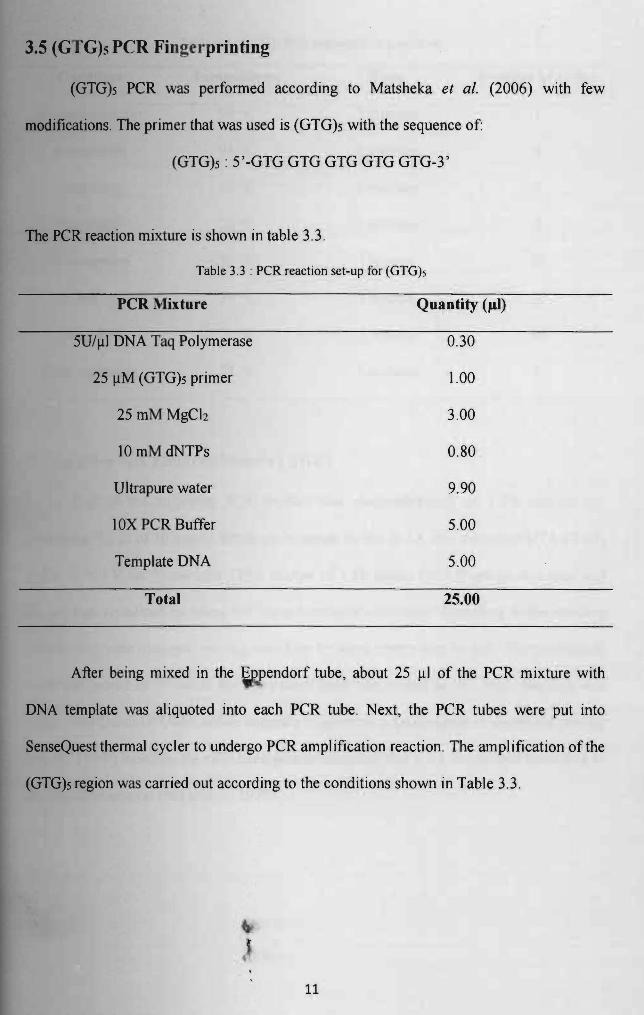
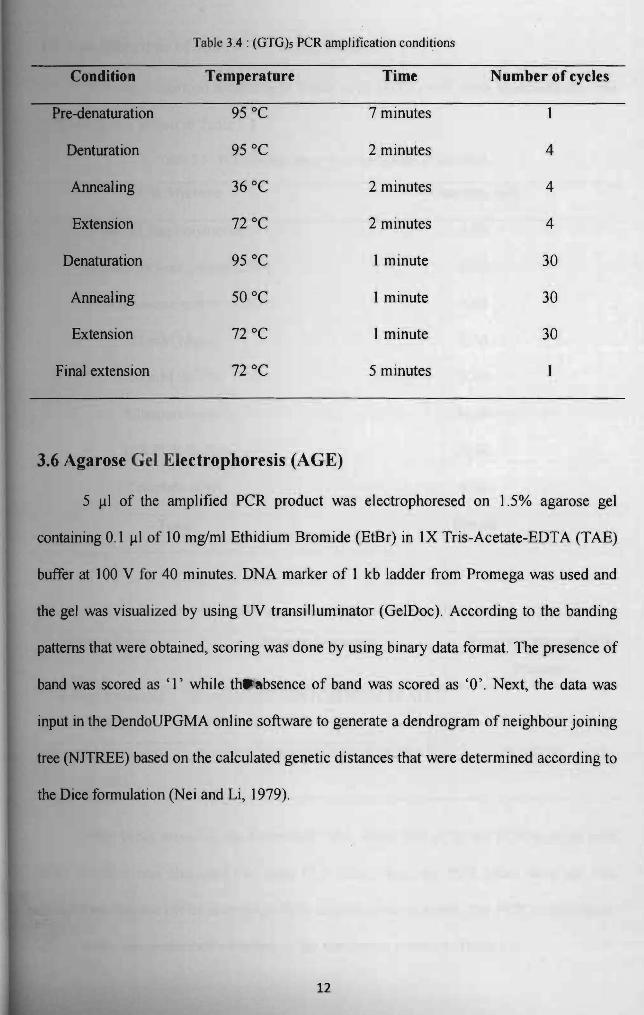
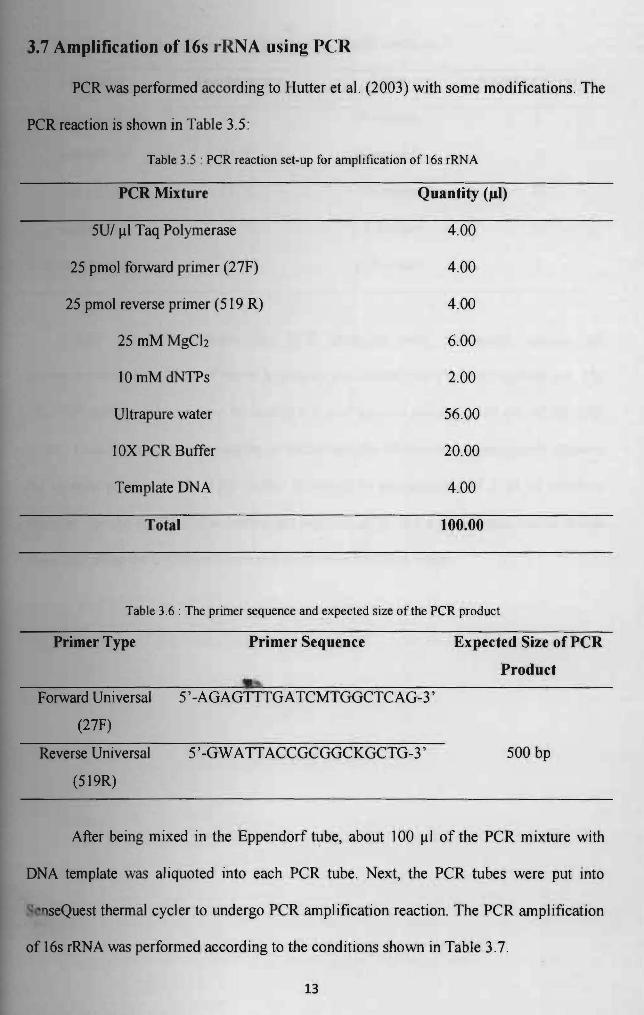
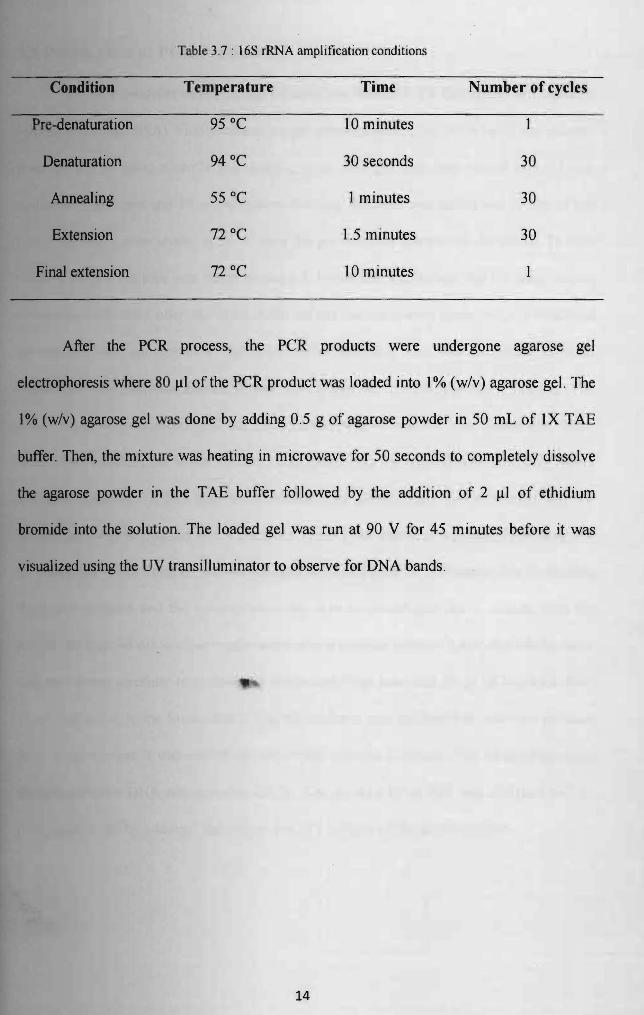
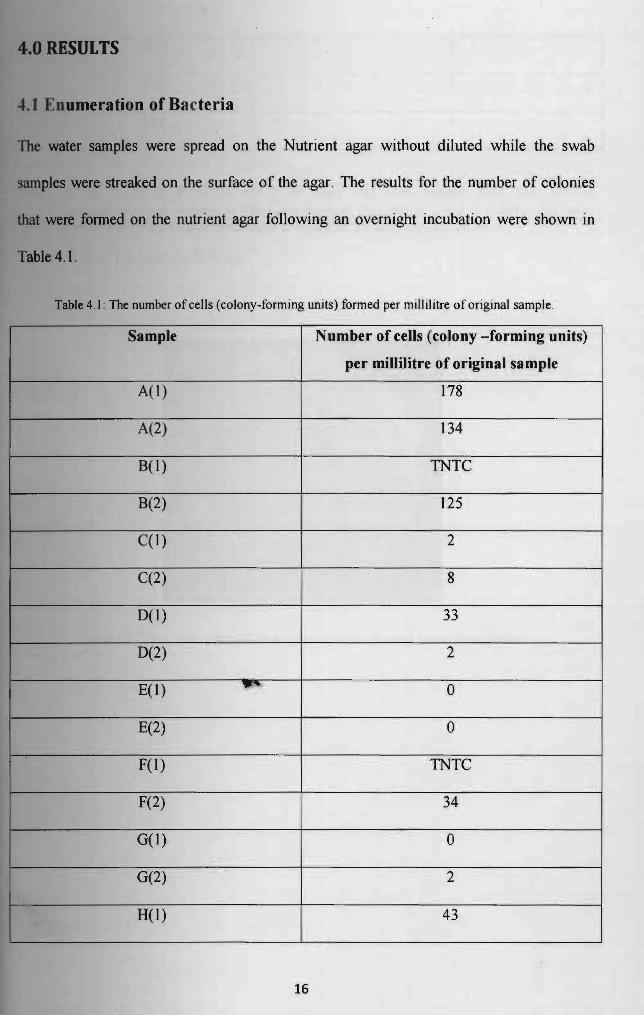


![Vater v. County of Glenn [DISSENT]](https://img.pdfslide.us/doc/110x75/61bd190f61276e740b0f53d4/vater-v-county-of-glenn-dissent.jpg)