Embed Size (px)
Citation preview

Variations in sky luminance measurements
Wim Schmidt Platform Lichthinder
Sotto le Stelle
OsnabruckOktober 2011
11

Introducing myself
• Ten years chairman of the Dutch Light Pollution Group
• Occupation: light pollution adviser: delivering data to governments: pictures, numbers and maps.
22

Content
• What are we measuring?
• Variations in space
• Variations in time
33

What are we measuring?
• Sun and moon and clouds
• Stars
• Milky way
• Natural darkness
• Artificial light
44
Our interest: artificial light

What are we measuring: sun and moon, clouds
Astronight:– Altitude sun: < -18 degrees
– Altitude moon < 0 degrees
55
Clear sky: clouds give till 5 magnitudes more light

What are we measuring: stars
• A magnitude 22 sky gives light of 847 magnitude 0 stars.
• All 6000 visible stars give light of 80 magnitude 0 stars.
• Stars contribute less than 10% of the sky luminance– In direction of Milky way higher
– In direction of horizon much lower
• Natural sky: varies a little; difficult to determine
66

What are we measuring: artificial light
• At 5 locations 30 measurements in different nights: till 30 % variation; most around 10%.
• Extinction correction
• Geography and weather
• Time of the night?
77

What are we measuring: artificial light
88
• Sky luminance dependent of extinction: higher extinction, higher sky luminance
• A standard atmosphere (12 km horizontal sight and 0,3 magn extinction)
• But still 6 till 20% differences.

99
Groundmist: less light High layer, small
distance: more light
High layer, great distance: less light
Geography and weather

What are we measuring: Standard conditions
• We need a standard about influence of moon and sun
• We need a standard atmosphere
• Always be some variance in measurements: weather conditions and local geography: do more measurements to get the variance at a location
1010
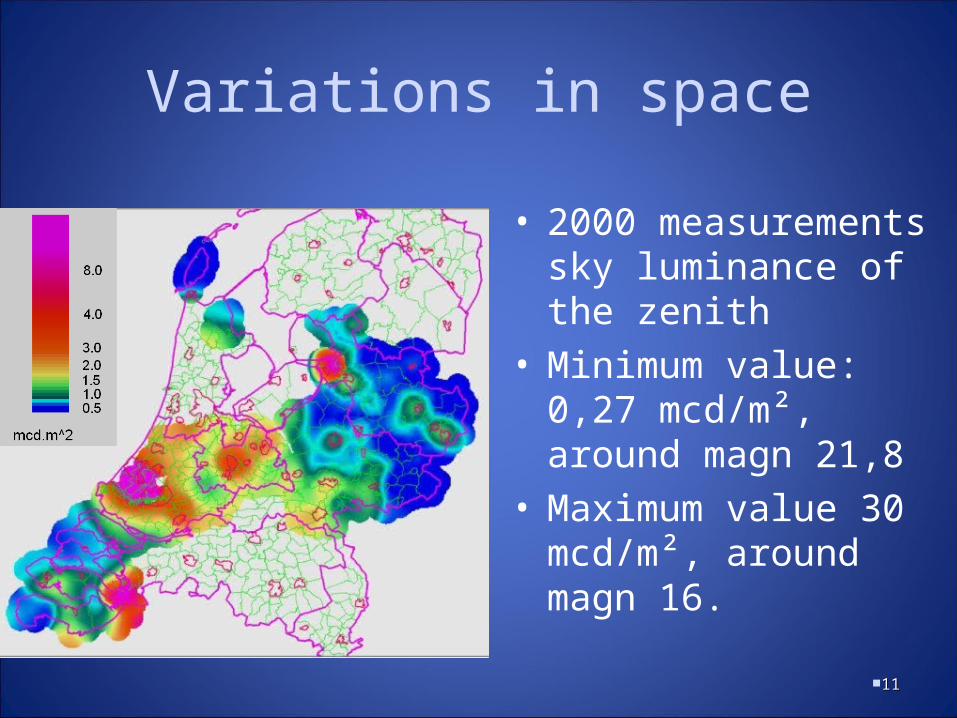
Variations in space
• 2000 measurements sky luminance of the zenith
• Minimum value: 0,27 mcd/m², around magn 21,8
• Maximum value 30 mcd/m², around magn 16.
1111

Variations in space
• The Netherlands are not totally light polluted
• Big differences between west and north
• In the north: pristine conditions, comparable to the best places in Europe
• Large difference between towns and countryside.
1212

North east part of Amsterdam
Variations in spaceGradient on the edge of town: From 8,5 till 2,5 mcd/m² in 7
kilometre
Steep gradient on the edge of a greenhouse area: from 29 till 2 mcd/m² in 2 kilometre
Greenhouse area
1313

Variations in space
Sky luminance - population relation of towns
1414Is this real?

Variations in time• Two years of measurements with
SQM-LE and Austrian Lichtmeter Mark 2.3
1515

Variations in time
• 5,5 magnitude variation
• Increase darkness till 1 or 2 o’clock: less light?
• Decrease darkness after 2 o’clock : inversion layer gets thicker? 1616

Variations in time
• Maximum red dots: Increase of 0,22 magnitude in two years
• Mean green dots: increase of 0,08 magnitude in two years
• Explanation? Getting darker? Higher trees? Sensor ?1717