Embed Size (px)
Citation preview
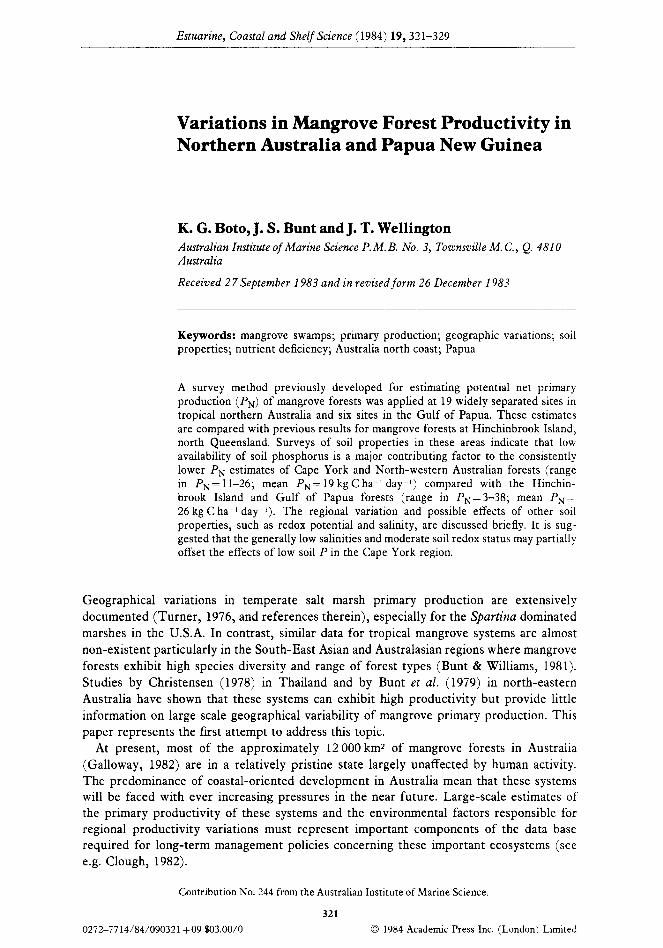
Estuarine, Coastal and Shelf Science (1984) 19,321-329
Variations in Mangrove Forest Productivity in Northern Australia and Papua New Guinea
K. G. Boto, J. S. Bunt and J. T. Wellington Australian Institute of Marine Science l? M. B. No. 3, Townsville M. C., Q. 4810 Australia
Received 27 September I983 and in revised form 26 December 1983
Keywords: mangrove swamps; primary production; geographic variations; soil properties; nutrient deficiency; Australia north coast; Papua
A survey method previously developed for estimating potential net primary production (PN) of mangrove forests was applied at 19 widely separated sites in tropical northern Australia and six sites in the Gulf of Papua. These estimates are compared with previous results for mangrove forests at Hinchinbrook Island, north Queensland. Surveys of soil properties in these areas indicate that low availability of soil phosphorus is a major contributing factor to the consistently lower P, estimates of Cape York and North-western Australian forests (range in PN= 11-26; mean P,= 19 kg C ha-l day-l) compared with the Hinchin- brook Island and Gulf of Papua forests (range in PN= 3-38; mean PN= 26 kg C ha-1 day-l). The regional variation and possible effects of other soil properties, such as redox potential and salinity, are discussed briefly. It is sug- gested that the generally low salinities and moderate soil redox status may partially offset the effects of low soil P in the Cape York region.
Geographical variations in temperate salt marsh primary production are extensively documented (Turner, 1976, and references therein), especially for the Spartina dominated marshes in the U.S.A. In contrast, similar data for tropical mangrove systems are almost non-existent particularly in the South-East Asian and Australasian regions where mangrove forests exhibit high species diversity and range of forest types (Bunt & Williams, 1981). Studies by Christensen (1978) in Thailand and by Bunt et ~2. (1979) in north-eastern Australia have shown that these systems can exhibit high productivity but provide little information on large scale geographical variability of mangrove primary production. This paper represents the first attempt to address this topic.
At present, most of the approximately 12 000 km2 of mangrove forests in Australia (Galloway, 1982) are in a relatively pristine state largely unaffected by human activity. The predominance of coastal-oriented development in Australia mean that these systems will be faced with ever increasing pressures in the near future. Large-scale estimates of the primary productivity of these systems and the environmental factors responsible for regional productivity variations must represent important components of the data base required for long-term management policies concerning these important ecosystems (see e.g. Clough, 1982).
Contribution No. 244 from the Australian Institute of Marine Science.
321
0272-7714/84/090321+09$03.00/0 0 1984 Academic Press Inc. (London) Limited
322 K. G. Boto, J. S. Bunt &J. T. Wellington
Here we present a further evaluation and application of a technique for obtaining pro- ductivity estimates over large spatial scales in a variety of mangrove vegetation. The origi- nal calibration is shown to hold over a wider range of species associations and locations than originally presented by Bunt et al. (1979). Estimates of PN for a total of 17 forest sites in 9 widely separated river systems along the Cape York Peninsula are compared with the previous estimates for the Hinchinbrook system. The regional variations in production estimates are then discussed in terms of our emerging concepts of soil factors influencing mangrove production in northern Australia. More limited data from the Gulf of Papua area (6 sites) and from north-western Australia (2 sites) are also shown for comparison.
Study areas
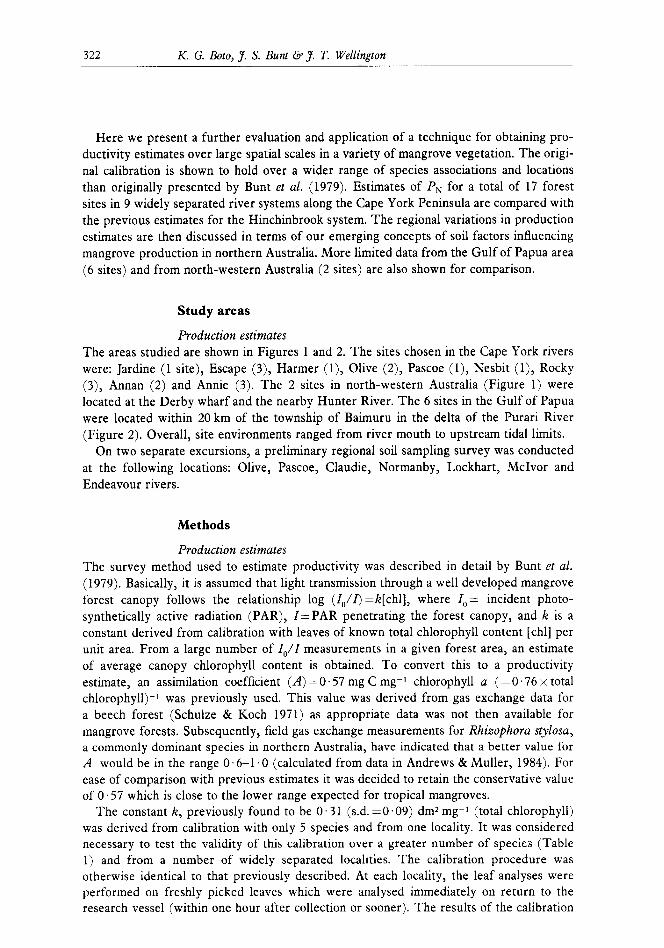
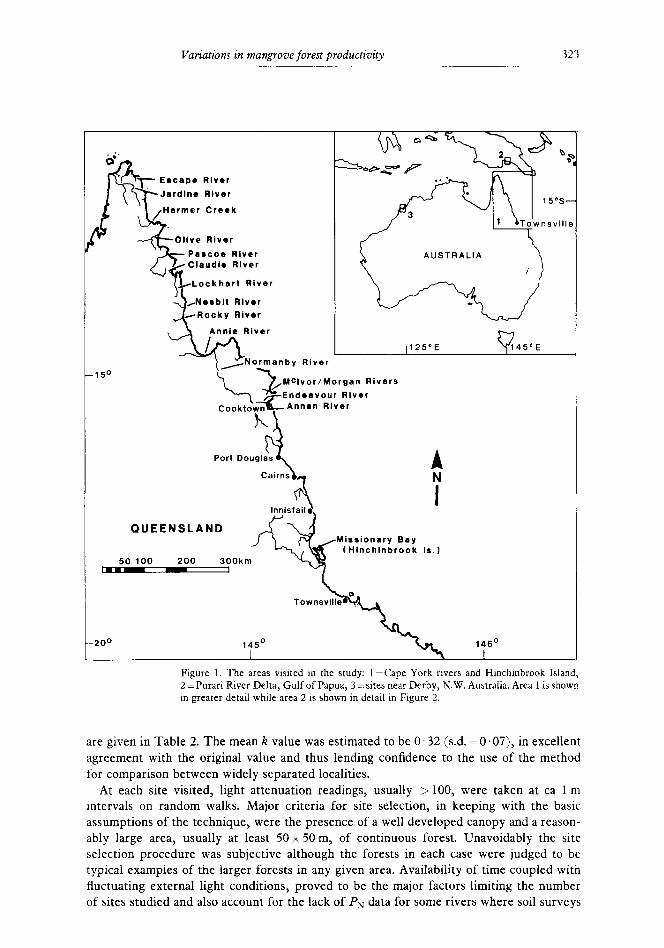
Production estimates The areas studied are shown in Figures 1 and 2. The sites chosen in the Cape York rivers were: Jardine (1 site), Escape (3), Harmer (l), Olive (2), Pascoe (l), Nesbit (l), Rocky (3), Annan (2) and Annie (3). The 2 sites in north-western Australia (Figure 1) were located at the Derby wharf and the nearby Hunter River. The 6 sites in the Gulf of Papua were located within 20 km of the township of Baimuru in the delta of the Purari River (Figure 2). Overall, site environments ranged from river mouth to upstream tidal limits.
On two separate excursions, a preliminary regional soil sampling survey was conducted at the following locations: Olive, Pascoe, Claudie, Normanby, Lockhart, McIvor and Endeavour rivers.
Methods
Production estimates The survey method used to estimate productivity was described in detail by Bunt et al. (1979). Basically, it is assumed that light transmission through a well developed mangrove forest canopy follows the relationship log (Z,/Z) =k[chl], where I,,= incident photo- synthetically active radiation (PAR), Z=PAR penetrating the forest canopy, and k is a constant derived from calibration with leaves of known total chlorophyll content [chl] per unit area. From a large number of Z,/Z measurements in a given forest area, an estimate of average canopy chlorophyll content is obtained. To convert this to a productivity estimate, an assimilation coefficient (A) = 0.57 mg C mg-1 chlorophyll a ( = 0.76 x total chlorophyll)-’ was previously used. This value was derived from gas exchange data for a beech forest (Schulze & Koch 1971) as appropriate data was not then available for mangrove forests. Subsequently, field gas exchange measurements for Rhizophora stylosa, a commonly dominant species in northern Australia, have indicated that a better value for A would be in the range 0.6-l ‘0 (calculated from data in Andrews & Muller, 1984). For ease of comparison with previous estimates it was decided to retain the conservative value of 0.57 which is close to the lower range expected for tropical mangroves.
The constant k, previously found to be 0.31 (s.d. =0.09) dm2 mg-1 (total chlorophyll) was derived from calibration with only 5 species and from one locality. It was considered necessary to test the validity of this calibration over a greater number of species (Table 1) and from a number of widely separated localities. The calibration procedure was otherwise identical to that previously described. At each locality, the leaf analyses were performed on freshly picked leaves which were analysed immediately on return to the research vessel (within one hour after collection or sooner). The results of the calibration
Variations in mangrove forest productivity 323
Escape Rlvar
Jardlnc Rlvar
Olive River
Parcoa River Claudle Rlvor
Lockhart Riv
,Naabit Rlvar
AUSTRALIA
A N
I
QUEENSLAND
50 100
Missionary Bay (Hinchinbrook Is. 1
-200 1450 146’ I I
Figure 1. The areas visited in the study: 1 =Cape York rmers and Hinchinbrook Island, 2 = Purari River Delta, Gulf of Papua, 3 = sites near Derby, N.W. Australia. Area I is shown in greater detail while area 2 is shown in detail in Figure 2.
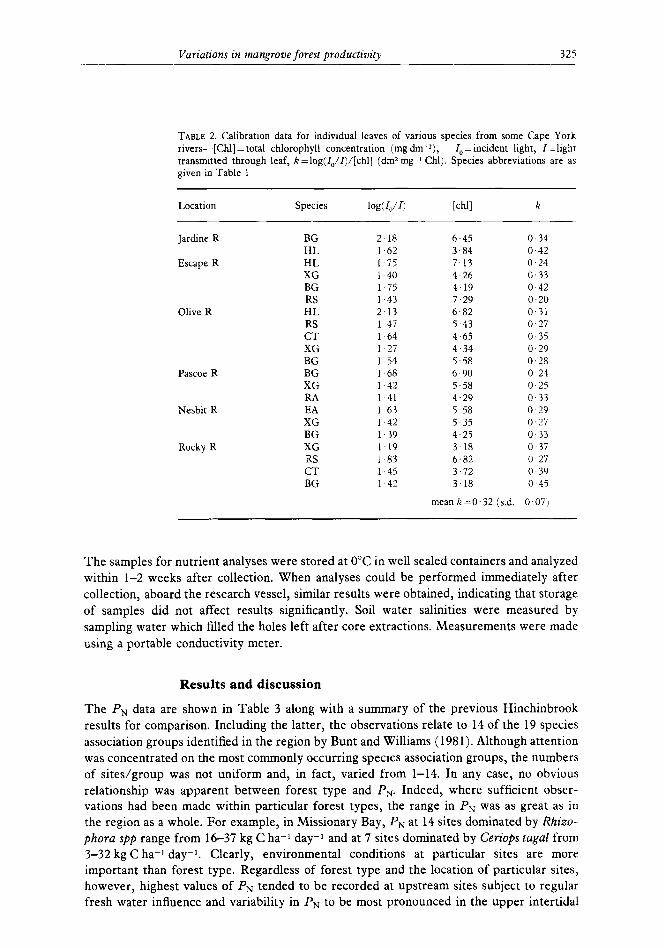
are given in Table 2. The mean k value was estimated to be 0.32 (s.d. =0.07), in excellent agreement with the original value and thus lending confidence to the use of the method for comparison between widely separated localities.
At each site visited, light attenuation readings, usually > 100, were taken at ca 1 m intervals on random walks. Major criteria for site selection, in keeping with the basic assumptions of the technique, were the presence of a well developed canopy and a reason- ably large area, usually at least 50 x 50 m, of continuous forest. Unavoidably the site selection procedure was subjective although the forests in each case were judged to be typical examples of the larger forests in any given area. Availability of time coupled with fluctuating external light conditions, proved to be the major factors limiting the number of sites studied and also account for the lack of PN data for some rivers where soil surveys
324 K. G. Boto, J. S. Bunt &J. T. Wellington
Figure 2. Study sites within the Purari River Delta (Pie and Wame Rivers), Gulf of Papua.
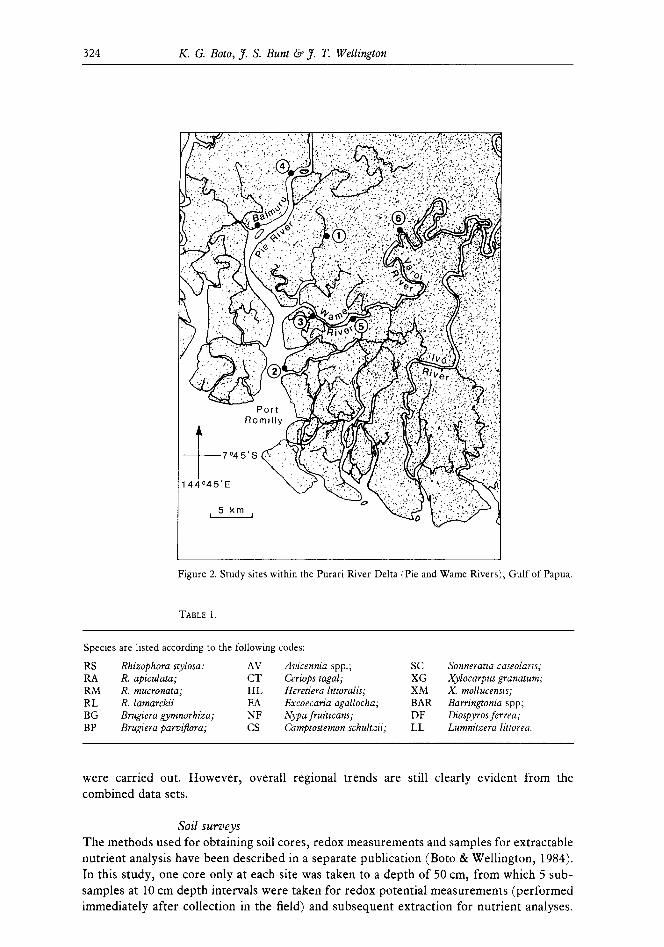
TABLE 1.
Species are listed according to the following codes:
RS RA RM RL BG BP
Rhizophora stylosa: R. apiculata; R. mucronata; R. lamarckii Brugiera gynmorhiza; Brugiera parviflora;
AV CT HL EA NF cs
Avzcennia spp.; SC Sonneraaa caseolarts; Ceriops tagal; XG Xylocarpus granarum; Heretiera littoralis; XM X. mollucensis; Excoecaria agallocha; BAR Barnngtonia spp; Nypa fruittcans; DF Diospyos ferrea; Camptostemon schultzit; LL Lumnitzera littorea.
were carried out. However, overall regional trends are still clearly evident from the combined data sets.
Soil surveys The methods used for obtaining soil cores, redox measurements and samples for extractable nutrient analysis have been described in a separate publication (Boto & Wellington, 1984). In this study, one core only at each site was taken to a depth of 50 cm, from which 5 sub- samples at 10 cm depth intervals were taken for redox potential measurements (performed immediately after collection in the field) and subsequent extraction for nutrient analyses.
Variations in mangrove forest productivity 325
TABLE 2. Calibration data for individual leaves of various species from some Cape York rivers-[Chl] = total chlorophyll concentration (mg dm-2), -I,=incident light, I=light transmitted through leaf, k =log(l,,/I)/[chl] (dmz rngml Chl). Species abbreviations are as given in Table 1
Location Species [chll k
Jardine R
Escape R
Olive R
Pascoe R
Nesbit R
Rocky R
BG 2.18 HL 1.62 HL 1-75 XG 1 40 BG 1 75 RS 1.43 HL 2.13 RS 1 47 CT 1 64 XG 1 27 BG 1 54 BG 1.68 XG 1 42 RA l-41 EA 1 63 XG I ,42 BG 1.39 XG 1.19 RS 1-83 CT 1.45 BG 1.42
6.45 o-34 3.84 0.42 7.13 0.24 4.26 0.33 4.19 0.42 7.29 0.20 6.82 0.31 5.43 0.27 4.65 o-35 4.34 0.29 5.58 0.28 6.90 O-24 5.58 0.25 4.29 0.33 5 58 0.29 5.35 0.27 4.25 0 33 3.18 0 37 6.82 0.27 3.72 0.39 3.18 0.45
meank-0.32 (s.d.=O.O7r
The samples for nutrient analyses were stored at 0°C in well sealed containers and analyzed within l-2 weeks after collection. When analyses could be performed immediately after collection, aboard the research vessel, similar results were obtained, indicating that storage of samples did not affect results significantly. Soil water salinities were measured by sampling water which filled the holes left after core extractions. Measurements were made using a portable conductivity meter.
Results and discussion
The PN data are shown in Table 3 along with a summary of the previous Hinchinbrook results for comparison. Including the latter, the observations relate to 14 of the 19 species association groups identified in the region by Bunt and Williams (1981). Although attention was concentrated on the most commonly occurring species association groups, the numbers of sites/group was not uniform and, in fact, varied from 1-14. In any case, no obvious relationship was apparent between forest type and PN. Indeed, where sufficient obser- vations had been made within particular forest types, the range in Phi was as great as in the region as a whole. For example, in Missionary Bay, PN at 14 sites dominated by Rhizo- phora spp range from 16-37 kg C ha-1 day-r and at 7 sites dominated by Ceriops tagal from 3-32 kg C ha-* day-i. Clearly, environmental conditions at particular sites are more important than forest type. Regardless of forest type and the location of particular sites, however, highest values of PN tended to be recorded at upstream sites subject to regular fresh water influence and variability in P, to be most pronounced in the upper intertidal
326 K. G. Boto, J. S. Bunt &J. T. Wetlington
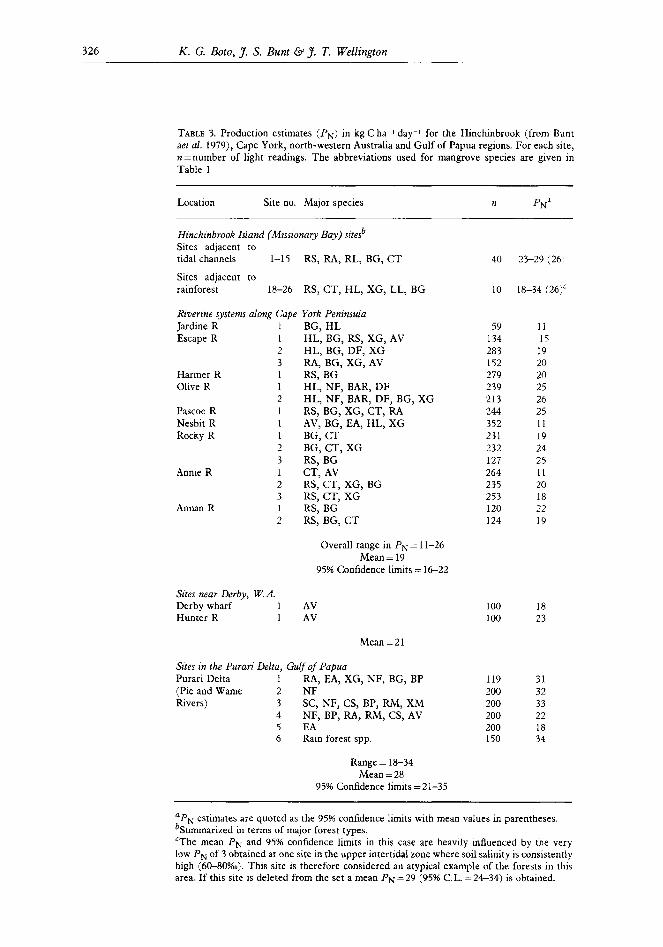
TABLE 3. Production estimates (PN) in kg C ha-1 day-r for the Hinchinbrook (from Bunt aet al. 1979), Cape York, north-western Australia and Gulf of Papua regions. For each site, n=number of light readings. The abbreviations used for mangrove species are given in Table 1
Location Site no. Major species n pNa
Hinchinbrook Island (Missionary Bay) siresb Sites adjacent to tidal channels 1-15 RS, RA, RL, BG, CT
Sites adjacent to rainforest 18-26 RS, CT, HL, XG, LL, BG
Riverine systems along Cape York Peninsula Jardine R 1 BG, HL Escape R 1 HL, BG, RS, XG, AV
2 HL, BG, DF, XG 3 RA, BG, XG, AV
Harmer R 1 RS, BG Olive R 1 HL, NF, BAR, DF
2 HL, NF, BAR, DF, BG, XG Pascoe R 1 RS, BG, XG, CT, RA Nesbit R 1 AV, BG, EA, HL, XG Rocky R 1 BG, CT
2 BG, CT, XG 3 RS, BG
Annie R 1 CT, AV 2 RS, CT, XG, BG 3 RS, CT, XG
Annan R 1 RS, BG 2 RS, BG, CT
40 23-29 (26’1
10 L&I-34 (26)’
59 11 134 15 283 19 152 20 279 20 239 25 213 26 244 25 352 11 231 19 232 24 127 25 264 11 235 20 253 18 120 22 124 19
Overall range in PN = 1 l-26 Mean=19
95% Confidence limits = 16-22
Sites near Derby, W.A. Derby wharf 1 AV Hunter R 1 AV
Sites in the Puuran Delta, Gulf of Papua Purari Delta I RA, EA, XG, NF, BG, BP (Pie and Wame 2 NF Rivers) 3 SC, NF, CS, BP, RM, XM
4 NF, BP, RA, RM, CS, AV 5 EA 6 Rain forest spp.
100 100
119 200 200 200 200 150
18 23
Mean=21
31 32 33 22 18 34
Range = 18-34 Mean = 28
95% Confidence limits =21-35
‘PN estimates are quoted as the 95% confidence limits with mean values in parentheses. bSummarized in terms of major forest types. ‘The mean PN and 95% confidence limits in this case are heavily influenced by the very low PN of 3 obtained at one site in the upper intertidal zone where soil salinity is consistently high (60-80%0). This site is therefore considered an atypical example of the forests in this area. If this site is deleted from the set a mean PN = 29 (95% CL. = 24-34) is obtained.
Variations in mangrove forest productivity 327
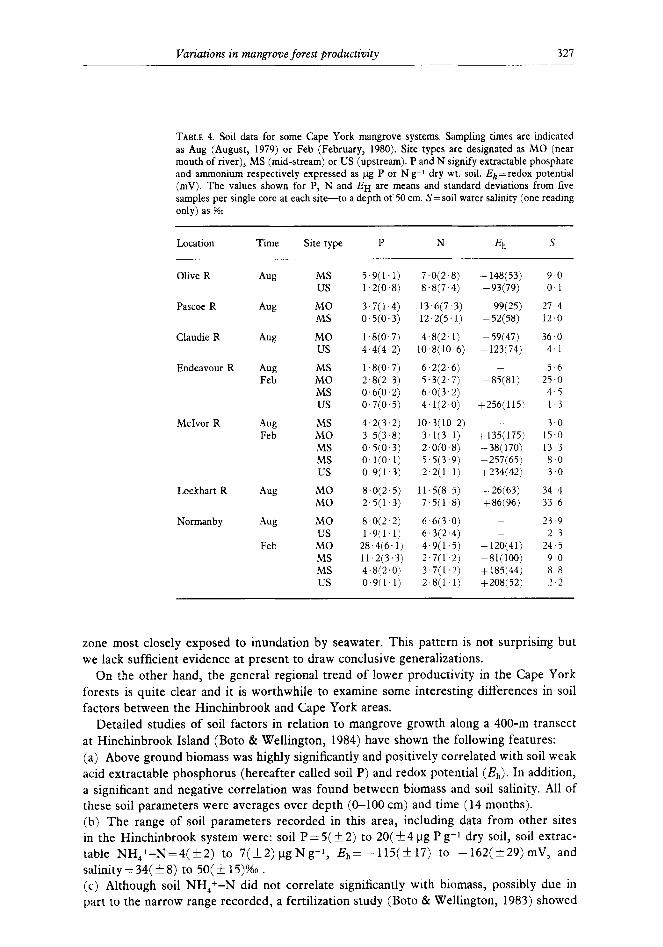
TABLE 4. Soil data for some Cape York mangrove systems. Sampling times are indicated as Aug (August, 1979) or Feb (February, 1980). Site types are designated as MO (near mouth of river), MS (mid-stream) or US (upstream). P and N signify extractable phosphate and ammonium respectively expressed as pg P or N g-l dry wt. soil. Eh =redox potential (mV). The values shown for P, N and EH are means and standard deviations from five samples per single core at each site-to a depth of 50 cm. S = soil water salinity (one reading only) as %O
Location Time Site type P N Eh s
Olive R
Pascoe R
Claudie R
Endeavour R
M&or R
Lockhart R
Normanby
AW MS US
5.9(1.1) 1,2(0.8)
7.0(2.8) 8.8(7.4)
9-o 0 1
Aug MO MS
3.7(1.4) O.ki(O.3)
13.6(7.3) 12.2(5.11
27.4 12.0
Aw MO us
l.a(O.7) 4.4(4.2)
4.8(2.1) 10.8(10-6)
-148(53) -93(79)
-99(25) -52(58)
-59(47) -123(74)
36.0 4.1
Aug Feb
MS 1.8(0.7) 6,2(2.6) MO 2.8(2.3) 5.3(2.7) MS 0.6(0.2) 6.0(3.2) us 0,7(0,5) 4.1(2.0)
-85(81)
+256(115)
5.6 25.0 4.5 1.3
Aw Feb
MS 4.2(3.2) 10.3(10 2) - 3.0 MO 3.5(3.8) 3,1(3.1) +135(175j 15.0 MS 0.5(0.3) 2.0(0.8) -38(170) 13.3 MS O.l(O.1) 5.5(3.9) +257(65) 8-O us 0,9(1.3) 2.2(1.1) +234(42) 3.0
Aug MO 8,0(2.5) 11.5(8.5) -26(63) 34.4 MO 2,5(1.3) 7.5(1,8) +86(96) 33.6
Aw
Feb
MO 8.0(2.2) 6.6(3.0) us 1.9(1’1) 6.3(2.4)
MO 28.4(6.1) 4,9(1.5) MS 11.2(3,3) 2.7(1.2) MS 4.8(2,0) 3.7(1.2) us 0.9(1,1) 2,8(1.1)
- -120(41) -81(100) + 185(44) +208(52)
23-9 2.3
24.5 90 88 2.2
zone most closely exposed to inundation by seawater. This pattern is not surprising but we lack sufficient evidence at present to draw conclusive generalizations.
On the other hand, the general regional trend of lower productivity in the Cape York forests is quite clear and it is worthwhile to examine some interesting differences in soil factors between the Hinchinbrook and Cape York areas.
Detailed studies of soil factors in relation to mangrove growth along a 400-m transect at Hinchinbrook Island (Boto & Wellington, 1984) have shown the following features: (a) Above ground biomass was highly significantly and positively correlated with soil weak acid extractable phosphorus (hereafter called soil I’) and redox potential (&). In addition, a significant and negative correlation was found between biomass and soil salinity. All of these soil parameters were averages over depth (O-100 cm) and time (14 months). (b) The range of soil parameters recorded in this area, including data from other sites in the Hinchinbrook system were: soil P = 5( f 2) to 20( & 4 pg P g-1 dry soil, soil extrac- table NH,+-N=4(+2) to 7(*2)pgNg-l, &=-115(t17) to -162(i29)mV, and salinity = 34( + 8) to 50( + 15)%0 . (c) Although soil NH,+-N did not correlate significantly with biomass, possibly due in part to the narrow range recorded, a fertilization study (Boto & Wellington, 1983) showed
328 K. G. Boto, J. S. Bunt ~5% J. T. Wellington
a significant growth response to soil ammonium enrichment at the highest soil N site, implying a general nitrogen limitation in this area. Further, a similar response to soil P enrichment was found for a low soil P site (5 yg P g-1) but not at a site where soil P was 10 pg P g-1.
Results of the Cape York soil surveys are shown in Table 4. Comparison with the Hinchinbrook data is somewhat presumptive at this stage in that the degree of seasonal variations for the Cape York soil parameters cannot be properly assessed on the basis of only 2 limited sample sets. However, the data strongly suggest that the Cape York soils are generally very phosphorus deficient with most samples giving soil P values in the order of only 0.1 to 8 pg P g-i. Low P levels are especially evident at midstream or upstream sites. On the other hand, especially at upstream sites, the soil salinities are generally much lower than recorded for the predominantly tidally influenced Hinchinbrook soils. The Eh values, although highly variable, generally indicate far less intensely reducing conditions than found in the Hinchinbrook soils. These results were consistent with the higher sand content of the Cape York soils thus allowing greater permeability and freer exchange of soil water with the oxygenated water overlying the soils. Soil ammonium levels appear to be similar in both regions and much further data would be required to properly compare this parameter or to draw any conclusions concerning nitrogen limitation in the Cape York area.
Hence the overall trend of lower productivity in the Cape York region appears to be linked primarily with the very low phosphorus availability of the soils. The effect of low soil P may be partially offset by the beneficial effect of low salinities and milder reducing conditions in these soils. The PN estimates for the western Australian and Papua forests, although limited, also appear to be consistent with the above concepts. Although no comparable soil data are available for these areas, a set of 5 soil samples from the Derby forests (mean PN=21 kg C haai day-i) gave low total soil P levels in the range of W-150 1.18 g-1 compared with Hinchinbrook soil total P levels in the range of 250- 460 ppm. In contrast, the PN values recorded in the Gulf of Papua forests indicate that the productivity is at least comparable to that of the Hinchinbrook forests. Interestingly Viner (1979) has reported soil P levels in this area in the order of 400 ppm, very similar to the level found in the Hinchinbrook soils.
Conclusions
The data presented here, while far from comprehensive, demonstrate the feasibility of obtaining productivity estimates for mangrove forests over very large spatial scales. Further, the regional variation in PN can be related, at least on a semi-quantitative basis, to some obvious regional variations in soil properties, notably phosphorus availability. The results are highly encouraging and provide an excellent basis for more detailed and quanti- tative studies of soil factors in relation to mangrove productivity in the Australian region.
Acknowledgements
The authors gratefully acknowledge the assistance, in the various field surveys, given by E. Bunt, N. Duke, L. Boto and J. Baldwin. In addition, we also gratefully acknowledge the assistance of B. Chalker and A. Dartnall for critical reviews of the paper prior to submission and to M. Thyssen for the preparation of the diagrams.
Variations in mangrove forest productivity 329
References
Andrews, T. J. & Muller, G. J. 1984 Photosynthetic gas exchange of the mangrove, Rhzzophora srylosa Griff., m its natural environment. Oecologia (in press).
Boto, K. G. & Wellington, J. 1984 Soil characteristics and nutrient status in northern Australian mangrove forests. Estuaries 7,61-69.
Boto, K. G. & Wellington, J. 1983 Phosphorus and nitrogen nutritional status of a northern Australian mangrove forest. Marine Ecology Progress Series 11, 63-69.
Bunt, J. S., Boto, K. G. & Boto, G. 1979. A survey method for estimating potential levels of mangrove forest primary production. Marine Biology 52, 123-128.
Bunt, J. S. & Williams, W. T. 1981 Vegetational relationships in the mangroves of tropical Australia. k&ztine Ecology Progress Series 4, 349-359.
Christensen, B. 1978 Biomass and primary production of Rhizophora apiculara Bl. in a mangrove in southern Thailand. Aquatic Botany 4, 42-52.
Clough, B. F. (ed.) 1982 Mangrove Ecosyszems in Australia. Australian Institute of Marine Science-A.N.U. Press, Canberra, Australia 302 pp.
Galloway, R. W. 1982 Distribution and physiographic patterns of Australian mangroves. In Mangrove Ecosystems in Australia Clough, B. F. ed. Australian Institute of Marine Science-A.N.U. Press, Canberra, Australia pp 31-54.
Schulze, E. D. & Koch, W. 1971 Measurements of primary production with cuvettes. In Produczivrrv of Foresr ecosysrems (Duvigneaud, P. ed.) UNESCO, Paris, France. pp. 141-157.
Turner, R. E. 1976 Geographical variations in salt marsh macrophyte production: A review. Contriburzons in Marine Scrence 20, 47-68.
Viner, A. B. 1979 The Status and Transport of Nutrients through the Purari River (Papua New Gutnea). Purart River (Wabo) Hydroelectric Scheme Environmental Studies 9. Office of Environment and Conservation and Department of Minerals and Energy, Papua New Guinea. 52 pp.