Embed Size (px)
Citation preview
Variations in Bounding and ScanningRelative Permeability Curves With Different
Carbonate Rock TypesM.R. Dernaika, SPE, Ingrain Incorporated�Abu Dhabi; M.A. Basioni, A. Dawoud, and M.Z. Kalam,
Abu Dhabi Company for Onshore Oil Operations (ADCO); and S.M. Skjæveland, SPE, University of Stavanger
Summary
Relative permeability curves generally exhibit hysteresis betweendifferent saturation cycles. This hysteresis is mainly caused bywettability changes and fluid trapping. Different rock types mayexperience different hysteresis trends because of variations inpore geometry. Relative permeability curves may also be a func-tion of the saturation height in the reservoir.
A detailed laboratory study was performed to investigate rela-tive permeability behavior for a major carbonate hydrocarbon res-ervoir in the Middle East. Representative core samples coveringfive reservoir rock types (RRTs) were identified on the basis ofwhole core and plug X-ray computed tomography (CT), nuclearmagnetic resonance (NMR) T2, mercury injection capillary pres-sure (MICP), porosity, permeability, and thin-section analyses. Pri-mary-drainage (PD) and imbibition water/oil relative permeability(bounding) curves were measured on all the five rock types by thesteady-state (SS) technique by use of live fluids at full reservoirconditions with in-situ saturation monitoring (ISSM). Imbibitionrelative permeability experiments were also conducted on the mainRRT samples to assess the relative permeability (scanning) curvesin the transition zone (TZ) by varying connate-water saturations.
Hysteresis effects were observed between PD and imbibitioncycles, and appeared to be influenced by the sample rock typeinvolved (i.e., wettability and pore geometry). Variations in rela-tive permeability within similar and different rock types weredescribed and understood from local heterogeneities present ineach individual sample. This was possible from dual-energy (DE)CT scanning and high-resolution imaging. Different imbibitiontrends from both oil and water phases were detected from thescanning curves that were explained by different pore-level fluid-flow scenarios. Relative permeability scanning curves to both oiland water phases increased with higher connate-water saturation.Relative permeability to oil was explained on the basis of the oc-cupancy of the oil phase at varying connate-water saturations.The change in the water relative permeability trend was addressedon the basis of the connectivity of water at the varying connate-water saturations. These results and interpretations introduced animproved understanding of the hysteresis phenomena and fluid-flow behavior in the TZ of a Cretaceous carbonate reservoir thatcan assist in the overall reservoir modeling and well planning.
Introduction
Relative permeability (Kr) can be used for estimating productiv-ity, injectivity, hydrocarbons in place, breakthrough time, andultimate recovery (Honarpour et al. 1986, 1995; Heaviside 1991).Relative permeability curves depend on the direction of saturationchanges as well as on the maximal and minimal achieved satura-tions (Jerauld and Salter 1990; Masalmeh 2001). Hysteresis in rel-ative permeability curves can exist between different saturationcycles. Most experimental studies in literature have found thathysteresis is large for the nonwetting phase and either small or
nonexistent for the wetting phase. Much of the hysteresis data inthe literature has been obtained with bounding curves; saturationsstarting at endpoint values (i.e., irreducible water and residual oilsaturations for water/oil systems). Hysteresis is also studied withscanning curves in which the direction of saturation change isreversed at a number of intermediate saturations. Data such asthese are applicable for modeling reservoir processes in which thewater saturation increases or decreases to an intermediate value,then changes in the opposite direction. Hysteresis is mainlycaused by contact-angle hysteresis, fluid trapping, and wettabilitychanges. Contact-angle hysteresis is usually attributed to nonequi-librium effects, contamination, or heterogeneity of the surfacebecause of either roughness or composition. Fluid trapping is aresult of pore-space geometry and is caused by instabilities in thefluid/fluid interface configurations. Wettability is the overall tend-ency of a reservoir rock to prefer one fluid over another, anddepends on rock pore-size distribution and rock/fluid interactions.
Relative permeability is also a function of pore geometry (Fatt1966; Morgan and Gordon 1969). There are certain rock proper-ties that affect pore geometry and can have a great influence onreservoir properties such as porosity, permeability, capillary pres-sure, relative permeability, and resistivity. Table 1 lists some ofthe main rock properties that are considered important in carbon-ate reservoirs. These rock properties are interrelated and thus mayexert different effects in different rock types. Therefore, it is notsufficient to characterize a reservoir rock by a single datum suchas porosity or permeability. Proper rock characterization will benecessary to understand variations in rock types that, in turn, helprelate variations in macroscopic measurements (e.g., relative per-meability curves) to rock properties and pore geometry.
In this paper, we present experimental hysteresis in relativepermeability (bounding) curves between primary drainage andimbibition on five different carbonate rock types. Imbibition rela-tive permeability experiments were also conducted on the mainRRT samples to assess the relative permeability (scanning) curvesin the TZ by varying connate-water saturations. The rock typeswere initially characterized by static rock typing that is based onpetrophysical data and geological description. The relative-perme-ability measurements were performed by the SS technique at fullreservoir conditions by use of live fluids with ISSM. These experi-ments were used to study the effect of different carbonate rocktypes on relative permeability and hysteresis trends. Such data arerather scarce in the literature because most of the available dataare either measured on water-wet rocks or on limited rock types.The hysteresis data provided in this work are needed to enrich theavailable hysteresis models that may lack a complete and consist-ent description of the hysteresis phenomena in porous media.
Throughout this paper, drainage is used to describe oil displac-ing water. Imbibition describes water displacing oil regardless ofwettability condition. PD is used to represent oil displacing waterfrom 100% water saturation. Spontaneous imbibition refers towater displacing oil in water-wet pores, and forced imbibition isused to refer to imbibition in mixed-wet pores.
Rock Characterization
The rock (micro) properties that control pore geometry determinemany macroscopic properties of the porous medium. Establishing
Copyright VC 2013 Society of Petroleum Engineers
This paper (SPE 162265) was accepted for presentation at the Abu Dhabi InternationalPetroleum Exhibition and Conference, Abu Dhabi, 11–14 November 2012, and revised forpublication. Original manuscript received for review 13 October 2012. Revised manuscriptreceived for review 13 February 2013. Paper peer approved 10 May 2013.
August 2013 SPE Reservoir Evaluation & Engineering 265

the relation between the microproperties and macroscopic physi-cal properties of a rock sample is an essential requirement in theunderstanding of fluid-flow behavior and saturation distribution inporous media and in the production of oil and gas from petro-leum-bearing reservoirs. If variations in rock types are ignored,laboratory measurements for predicting fluid flow may be mis-leading (Morgan and Gordon 1969).
In this study, RRTs were initially established on the basis ofcombined petrophysical properties and geological description.The petrophysical properties included measurements from poros-ity, permeability, NMR T2 distributions, and mercury-deriveddrainage capillary pressure (Pc) and pore-throat-size distribution(PSD). Geological descriptions were obtained from thin-sectionphotomicrographs analysis that aims at defining pore systems, fa-cies, and depositional environment. Mercury injection and thin-section preparation were performed on corresponding trims fromthe plug samples. To enhance our rock-characterization scheme,high-definition X-ray DE CT scanning was acquired on the plugsnot only to investigate the internal structure of the rocks throughCT images but also to quantify mineralogy and porosity alongsample lengths through X-ray CT-derived effective atomic num-ber (Zeff) and bulk density (BD) (Wellington and Vinegar 1987).Such knowledge of rock fabric and mineralogical distribution isan essential input for reservoir modeling and well planning (Pran-ter et al. 2005).
The used core plugs in this study were 1.5 in. in diameter andapproximately 3 in. in length. All samples were CT scanned at twoenergy levels with calibration material. The images were acquiredin helical high-resolution scanning mode and have an in-plane(X–Y) pixel resolution of 0.468 mm and a slice thickness (Z) of0.500 mm. This DE imaging provides two distinct 3D images ofthe plugs. The high-energy images are more sensitive to BD, andthe low-energy images are more sensitive to mineralogy. Themethod summarized by Wellington and Vinegar (1987) was usedto compute independently the BD and the Zeff for each CT sliceposition for every plug. The Zeff parameter is related to the photo-electric effect (PEF) commonly used in wellbore logging. Thus,profiles of BD/Zeff as well as plug averages are generated and usedfor quality assurance, rock typing, and heterogeneity assessment.
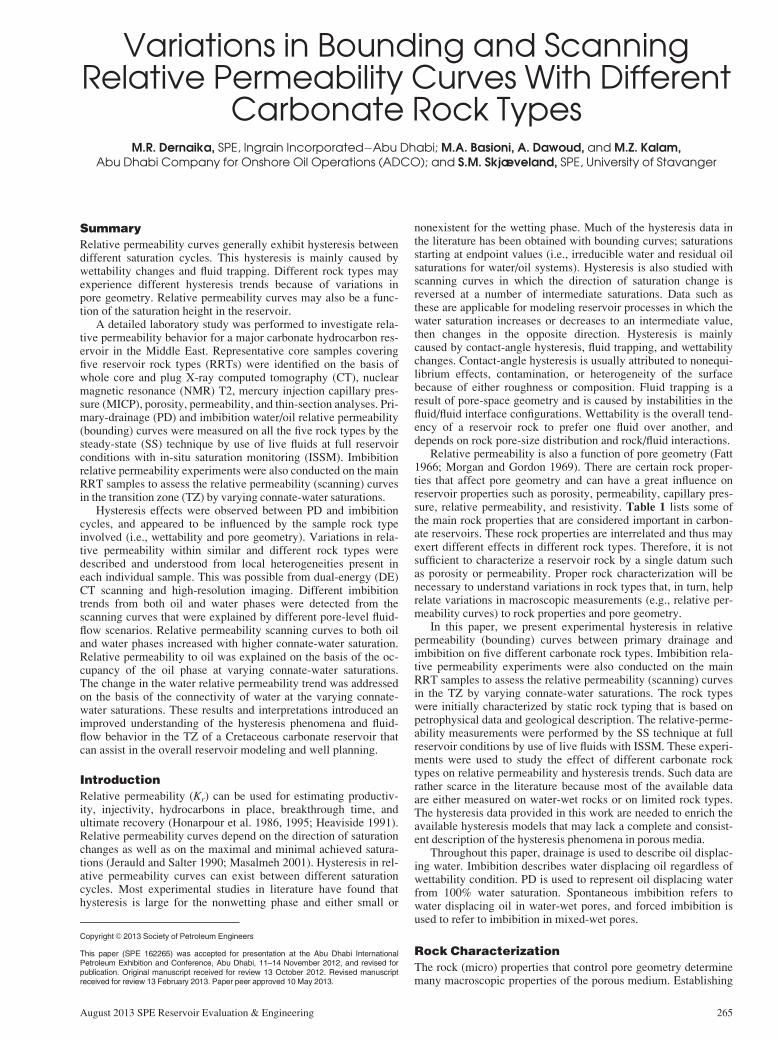
Figs. 1 and 2 provide a rock-characterization scheme fromfive different RRTs found in the reservoir. Fig. 3 gives the poros-ity/permeability variation for all the samples, and Fig. 4 showsthe crossplot of Zeff vs. BD and grain density. Both Zeff and BDwere derived from the DE CT scanning, whereas the grain-densityvalues were measured in a conventional laboratory in combinationwith helium porosity. Fig. 3 shows an interesting behavior of thebest rock type (RRT1) samples. Those samples have the highestpermeability values and yet are at the lower end of the porosityrange within all the rock types. This is a heterogeneity feature incarbonates and, in this case, it is attributed to dolomitization thatcaused the recrystallization of the limestone mineral, resulting inlarger pores and pore throats, better connectivity, and increasedpore heterogeneity. The lower porosity from RRT1 samples mustbe because of the bigger grain size for dolomite.
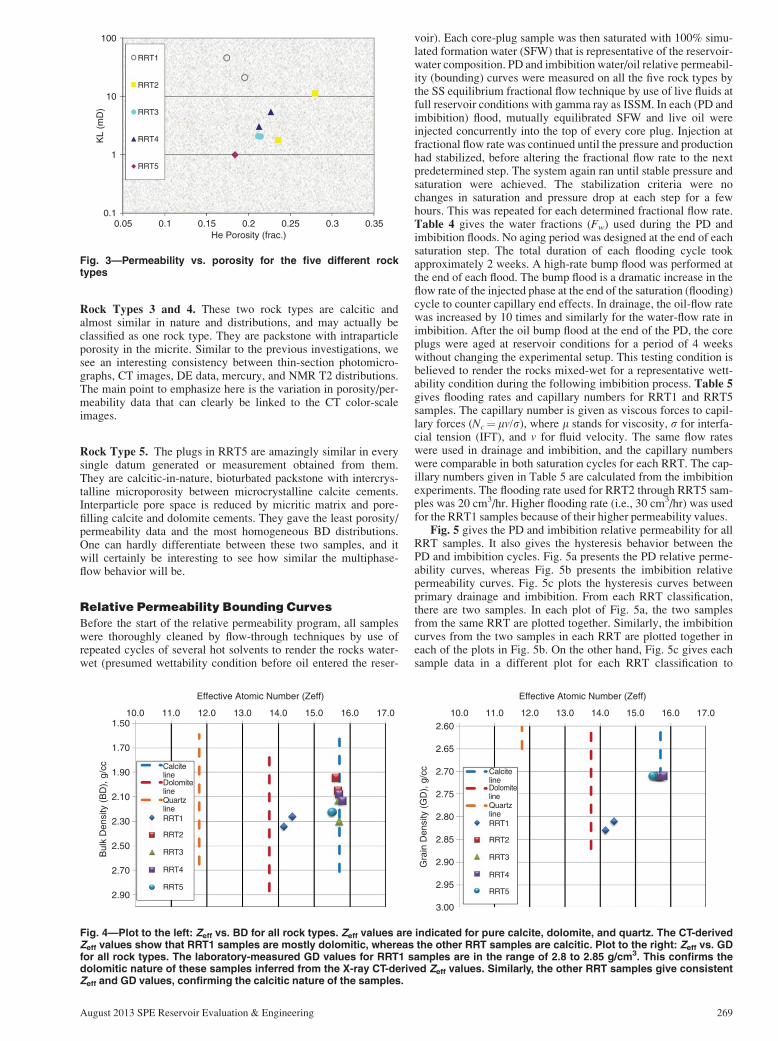
Fig. 4 (to the left) plots the average Zeff/BD values from allplugs. All samples lie on the calcite line except RRT1 samples thatcome close to the dolomite Zeff line. The BD data give sample po-rosity with grain-density information that could be inferred fromthe Zeff or simply from laboratory measurement. Table 2 gives BDand Zeff for three major minerals (i.e., calcite, dolomite, and quartz).
The Zeff/grain density (GD) plot in Fig. 4 shows that the calcite sam-ples gave laboratory grain-density values at 2.71 g/cm3 as comparedwith the dolomite samples that gave higher grain densities.
In Fig. 1, individual porosity/permeability data are givenabove each thin-section photomicrograph for direct comparison.The CT images are presented in color scale with reference to thecolor-scale bar on top of the CT images in Fig. 1b. Normally,X-ray CT images come in shades of gray, which are directly influ-enced by the Zeff of the material and its density. Dense materialsuch as calcite appears white, and pores appear black. Unresolvedpores such as micrite would appear as dark gray. Such gray-scaleimages may not always show all the detailed internal features;thus, we prefer to present the images in a color-scale format inwhich dense materials appear red and pores appear black. Anymaterial density varying in between would appear as yellow orgreen on the basis of the color-scale bar shown in the figure. It isworth noting that the same color scale was applied to all imagesso that it becomes possible to have a one-to-one comparisonbetween the different rock-type images and between images in thesame rock type to evaluate local heterogeneity and to better assessoverall quality. This is actually another important feature of theuse of color-scale images.
In Fig. 2, two reference lines are shown on the NMR T2 plotsto allow direct comparisons with the other rock-type curves. A ref-erence line is also shown on the mercury-derived PSD curves forthe same reason. NMR T2 data give information about pore-body-size distribution and can be converted to a length unit by use of thesurface-relaxation parameter. On the other hand, mercury-intru-sion data do not provide direct information about pore diameters;they rather assign the pore-body volumes to their entry throats.Therefore, mercury data contain valuable information about reser-voir rocks and rock types because the resistance offered by thepore structure to fluid flow is controlled by the pore throats.
In Fig. 2, we see a general trend in the entry pressure that isincreasing as we move from RRT1 through RRT5. This is nor-mally because of the macro pore sizes decreasing as we move to-ward the poorer-quality rock types. However, we see that all rocktypes are showing a similar range of irreducible saturation (at1,000-psi mercury pressure, equivalent to 75 psi oil/water Pc).This is because all samples do not have many pore-throat radiiless than 0.1 lm as can clearly be seen in the Hg-derived PSDcurves. Nevertheless, the samples would have differences in theintermediate pore-throat sizes, and this is demonstrated on the Pc
curves for each RRT in which the intersections of the curves at a200-psi pressure have been shaded to see how this shaded area isoccurring at lower mercury (corresponding to oil in reservoir-fluidsystem) saturations as we move toward RRT5. This observationproves that the different RRTs have varying intermediate pore-throat sizes that can yield differences in capillary pressures andphase flow.
The importance of this rock-characterization phase and theway we present the rock types in Figs. 1 and 2 lie on the local var-iations identified in each sample and how this variation could playa role in producing different macroscopic measurements such asrelative permeability functions and hysteresis patterns. A sum-mary of the rock-characterization scheme is presented in Table 3.
Rock Type 1. A thin-section description of RRT1 samplesreveals the dolomitic nature of those samples. Sample 113 (with a46-md permeability) is fine-to-medium crystalline dolomite withvugs and intercrystalline meso- to macropores. It has a looselypacked texture, and this explains its higher permeability valuethan Sample 114 (with 21 md). Sample 114 is a strongly dolomi-tized packstone with intercrystalline micro- to macropores. Itsmatrix microporosity has been reduced in places by intensivedolomitization. In both thin-section photomicrographs, the dolo-mite grains have a gray color, pores are in blue, and (minor)blocky calcite cement can be seen in red. The corresponding CTimages in Fig. 1b confirm the heterogeneity seen in the porosity/permeability data and clearly show the large connected pore chan-nels along plug lengths.
TABLE 1—MAIN ROCK PROPERTIES THAT AFFECT PORE
GEOMETRY IN CARBONATES
Pore System (intergranular, intercrystalline, vuggy, fractured)
Pore (Throat) Size (relative presence and distribution)
Aspect Ratio (Pore body to pore throat)
Pore Configuration (surface area, tortuosity)
Particulate System (sorting, shape, packing)
266 August 2013 SPE Reservoir Evaluation & Engineering

The X-ray CT-derived DE data along sample lengths (i.e., BDand Zeff) are given in Fig. 1c. The Zeff (mineralogy) distributionsreveal uniform profiles, whereas BD curves show high pore heter-ogeneity along sample lengths.
Rock Type 2. In Fig. 1a, the thin-section description of RRT2samples reveals the calcitic nature of those samples. Sample 9(with 11-md permeability) is grainstone with intraparticle porosityin the micrite and interparticle intercrystalline porosity. Sample15 (1.75 md) is a grainstone to rudstone showing shell debris andheterogeneous texture with intraparticle porosity in the micrite.
The corresponding CT images on the whole plugs in Fig. 1b pres-ent consistent observations to the thin-sections and show thatSample 9 has large pore channels, as revealed in the large area oflow pixels (i.e., blue color) in the relevant image. On the otherhand, Sample 15 has a larger proportion of the higher pixels(green/yellow colors) distributed along the sample length that hin-ders the flow in the large pore channels.
The DE data plot confirms these observations and yields alower BD (i.e., higher porosity) distribution for Sample 9. Bothsamples give a uniform Zeff distribution of approximately 15.7,confirming the calcitic nature of those samples. The fracture seen
(a) Thin-section microphotographs
RRT1113 0.174 46 mD 114 0.195 21 mD 114113
RRT29 0.279 11 mD 15 0.236 1.75 mD 159
RRT322 0.212 2.08 mD 72 0.214 2.06 mD 7222
RRT44 0.227 5.34 mD 6 0.213 3.02 mD 64
RRT5138 0.1841 0.98 mD 139 0.1842 1.01 mD 139138
(b) CT images (c) CT-derived DE data
Fig. 1—(a) Thin-section photomicrographs. (b) Color-scale CT images at 500 lm/pixel (color scale bar in pixels is shown on top ofthe images). The middle longitudinal CT slice is shown here. (c) X-ray CT-derived DE BD and Zeff data along sample lengths. Twoplugs are selected for each rock type. There are five different rock types identified in the reservoir. Sample number and porosity/permeability data are shown above each thin-section photomicrograph. Sample number is also identified above each CT image.
August 2013 SPE Reservoir Evaluation & Engineering 267

at the top of the CT image of Sample 9 was induced by the imple-mentation of improper procedures that were performed after therelative permeability experiments were completed. The reason weare showing the image is to confirm that indeed Sample 9 has dif-ferent pixel distributions at the plug scale and also to confirm it
has a lower BD that could be inferred from the bottom part of theplug that was not damaged in the laboratory. The permeabilityand porosity variations between these samples in RRT2 and theearlier observations from CT data may suggest that Sample 15could be classified better as RRT3.
10
200
400
600
800
1000
RRT1
0.9 0.8 0.7 0.6 0.5Mercury Saturation (Fraction)
Mer
cury
Pre
ssur
e (p
sia)
0.4
SN 114
113
114
SN 113
0.3 0.2 0.1 0 0.0010.0
0.2
0.4
0.6
Dis
trib
utio
n F
unct
ions 0.8
1.0
0.01 0.1 1
Pore Throat Radius (Microns)
10 100 1000 0.10.00
0.05
0.10
0.15
Nor
mal
ized
Am
plitu
de 0.20
0.25
1 10 100T2 (ms)
1000 10000
10
200
400
600
800
1000
RRT2
0.9 0.8 0.7 0.6 0.5Mercury Saturation (Fraction)
Mer
cury
Pre
ssur
e (p
sia)
0.4
PSDPSD
0.3 0.2 0.1 0 0.0010.0
0.2
0.4
0.6
Dis
trib
utio
n F
unct
ions
0.8
1.0
0.01 0.1 1Pore Throat Radius (Microns)
10 100 10000.1
0.00
0.05
0.10
0.15
Nor
mal
ized
Am
plitu
de 0.20
0.25
1 10 100T2 (ms)
1000 10000
10
200
400
600
800
1000
RRT3
0.9 0.8 0.7 0.6 0.5Mercury Saturation (Fraction)
Mer
cury
Pre
ssur
e (p
sia)
0.4
PSDPSD
0.3 0.2 0.1 0 0.0010.0
0.2
0.4
0.6
Dis
trib
utio
n F
unct
ions
0.8
1.0
0.01 0.1 1Pore Throat Radius (Microns)
10 100 10000.1
0.00
0.05
0.10
0.15
Nor
mal
ized
Am
plitu
de
0.20
0.25
0.30
1 10 100T2 (ms) 1000 10000
10
200
400
600
800
1000
RRT4
0.9 0.8 0.7 0.6 0.5Mercury Saturation (Fraction)
Mer
cury
Pre
ssur
e (p
sia)
0.4 0.3 0.2 0.1 0 0.0010.0
0.2
0.4
0.6
Dis
trib
utio
n F
unct
ions
0.8
1.0
0.01 0.1 1Pore Throat Radius (Microns)
10 100 10000.1
0.00
0.02
0.04
0.06
0.08
0.10
0.12
0.14
0.16
0.18
0.20
Nor
mal
ized
Am
plitu
de
1 10 100T2 (ms) 1000 10000
10
200
400
600
800
1000
RRT5
0.9 0.8 0.7 0.6 0.5
Mercury Saturation (Fraction)
Mer
cury
Pre
ssur
e (p
sia)
0.4
138
139
138
139
0.3 0.2 0.1 0 0.0010.0
0.2
0.4
0.6
Dis
trib
utio
n F
unct
ion 0.8
1.0
0.01 0.1 1
Pore Throat Radius (Microns)
10 100 1000 0.10.00
0.05
0.10
0.15
Nor
mal
ized
Am
plitu
de
0.20
0.25
0.30
1 10 100T2 (ms)
1000 10000
PS
Fig. 2—Two plots to the left, respectively: Mercury-derived drainage capillary pressure (Pc) and PSD. The Pc curves are shown withshaded squares at 200 psi to emphasize the variation of rock properties within the different rock types. The plot to the right: NMRT2 distributions on 100% brine-saturated plugs. Reference lines are added on the distribution plots to follow property changeswith rock types. Two plugs are selected for each rock type. There are five different rock types identified in the reservoir.
268 August 2013 SPE Reservoir Evaluation & Engineering
Rock Types 3 and 4. These two rock types are calcitic andalmost similar in nature and distributions, and may actually beclassified as one rock type. They are packstone with intraparticleporosity in the micrite. Similar to the previous investigations, wesee an interesting consistency between thin-section photomicro-graphs, CT images, DE data, mercury, and NMR T2 distributions.The main point to emphasize here is the variation in porosity/per-meability data that can clearly be linked to the CT color-scaleimages.
Rock Type 5. The plugs in RRT5 are amazingly similar in everysingle datum generated or measurement obtained from them.They are calcitic-in-nature, bioturbated packstone with intercrys-talline microporosity between microcrystalline calcite cements.Interparticle pore space is reduced by micritic matrix and pore-filling calcite and dolomite cements. They gave the least porosity/permeability data and the most homogeneous BD distributions.One can hardly differentiate between these two samples, and itwill certainly be interesting to see how similar the multiphase-flow behavior will be.
Relative Permeability Bounding Curves
Before the start of the relative permeability program, all sampleswere thoroughly cleaned by flow-through techniques by use ofrepeated cycles of several hot solvents to render the rocks water-wet (presumed wettability condition before oil entered the reser-
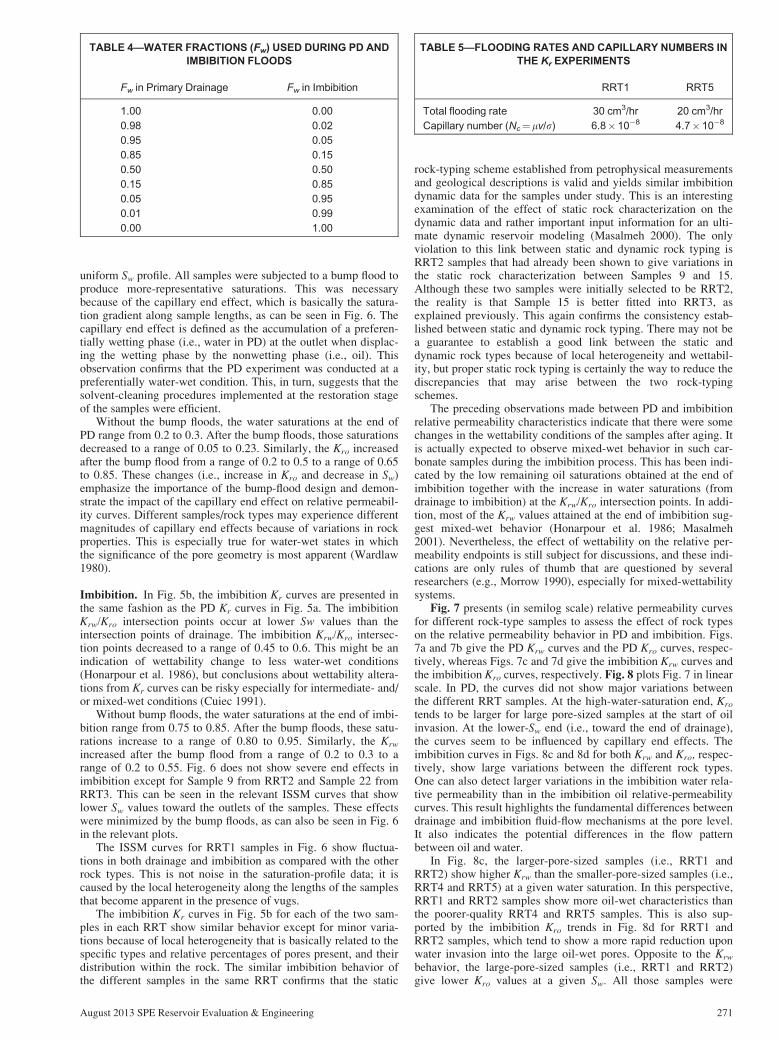
voir). Each core-plug sample was then saturated with 100% simu-lated formation water (SFW) that is representative of the reservoir-water composition. PD and imbibition water/oil relative permeabil-ity (bounding) curves were measured on all the five rock types bythe SS equilibrium fractional flow technique by use of live fluids atfull reservoir conditions with gamma ray as ISSM. In each (PD andimbibition) flood, mutually equilibrated SFW and live oil wereinjected concurrently into the top of every core plug. Injection atfractional flow rate was continued until the pressure and productionhad stabilized, before altering the fractional flow rate to the nextpredetermined step. The system again ran until stable pressure andsaturation were achieved. The stabilization criteria were nochanges in saturation and pressure drop at each step for a fewhours. This was repeated for each determined fractional flow rate.Table 4 gives the water fractions (Fw) used during the PD andimbibition floods. No aging period was designed at the end of eachsaturation step. The total duration of each flooding cycle tookapproximately 2 weeks. A high-rate bump flood was performed atthe end of each flood. The bump flood is a dramatic increase in theflow rate of the injected phase at the end of the saturation (flooding)cycle to counter capillary end effects. In drainage, the oil-flow ratewas increased by 10 times and similarly for the water-flow rate inimbibition. After the oil bump flood at the end of the PD, the coreplugs were aged at reservoir conditions for a period of 4 weekswithout changing the experimental setup. This testing condition isbelieved to render the rocks mixed-wet for a representative wett-ability condition during the following imbibition process. Table 5gives flooding rates and capillary numbers for RRT1 and RRT5samples. The capillary number is given as viscous forces to capil-lary forces (Nc¼ lv/r), where l stands for viscosity, r for interfa-cial tension (IFT), and v for fluid velocity. The same flow rateswere used in drainage and imbibition, and the capillary numberswere comparable in both saturation cycles for each RRT. The cap-illary numbers given in Table 5 are calculated from the imbibitionexperiments. The flooding rate used for RRT2 through RRT5 sam-ples was 20 cm3/hr. Higher flooding rate (i.e., 30 cm3/hr) was usedfor the RRT1 samples because of their higher permeability values.
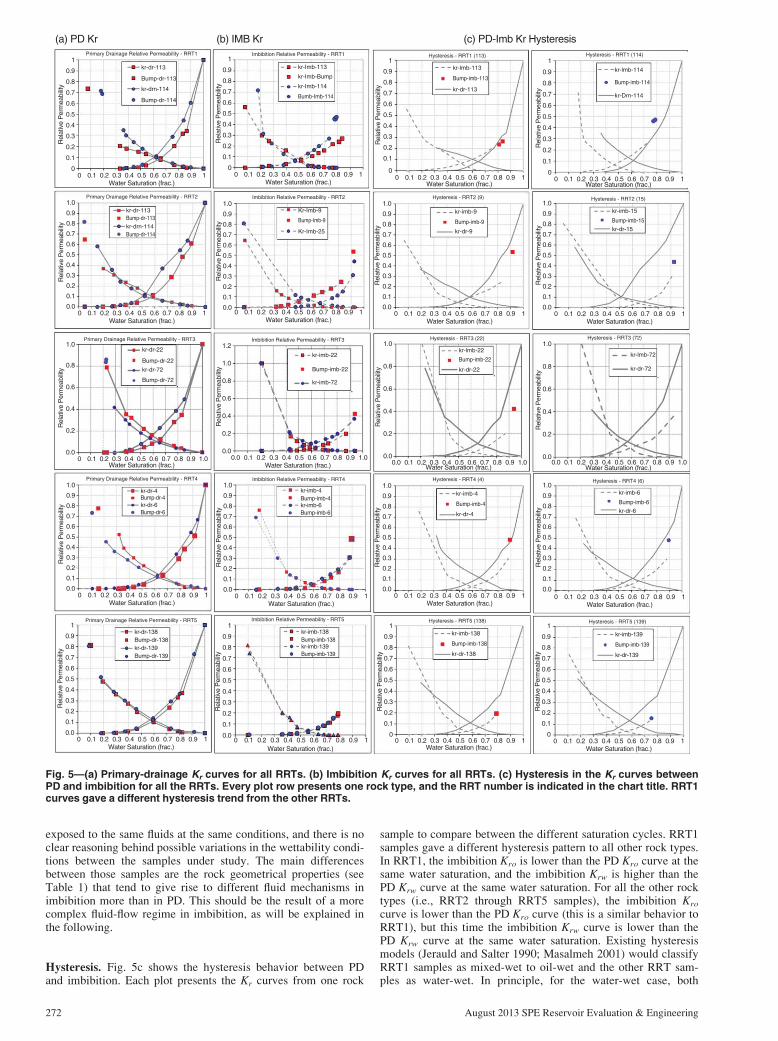
Fig. 5 gives the PD and imbibition relative permeability for allRRT samples. It also gives the hysteresis behavior between thePD and imbibition cycles. Fig. 5a presents the PD relative perme-ability curves, whereas Fig. 5b presents the imbibition relativepermeability curves. Fig. 5c plots the hysteresis curves betweenprimary drainage and imbibition. From each RRT classification,there are two samples. In each plot of Fig. 5a, the two samplesfrom the same RRT are plotted together. Similarly, the imbibitioncurves from the two samples in each RRT are plotted together ineach of the plots in Fig. 5b. On the other hand, Fig. 5c gives eachsample data in a different plot for each RRT classification to
10.0 11.0
RRT1
CalcitelineDolomitelineQuartzline
RRT2
RRT3
RRT4
RRT5
12.0 13.0
Effective Atomic Number (Zeff)
14.0 15.0 16.0 17.0
2.90
2.70
2.50
Bul
k D
ensi
ty (
BD
), g
/cc
2.30
2.10
1.90
1.70
1.5010.0 11.0
RRT1
CalcitelineDolomitelineQuartzline
RRT2
RRT3
RRT4
RRT5
12.0 13.0
Effective Atomic Number (Zeff)
14.0 15.0 16.0 17.0
3.00
2.95
2.90
2.85
2.80
2.75
2.70
2.65
2.60
Gra
in D
ensi
ty (
GD
), g
/cc
Fig. 4—Plot to the left: Zeff vs. BD for all rock types. Zeff values are indicated for pure calcite, dolomite, and quartz. The CT-derivedZeff values show that RRT1 samples are mostly dolomitic, whereas the other RRT samples are calcitic. Plot to the right: Zeff vs. GDfor all rock types. The laboratory-measured GD values for RRT1 samples are in the range of 2.8 to 2.85 g/cm3. This confirms thedolomitic nature of these samples inferred from the X-ray CT-derived Zeff values. Similarly, the other RRT samples give consistentZeff and GD values, confirming the calcitic nature of the samples.
0.05 0.1
RRT1
RRT2
RRT3
RRT4
RRT5
0.15 0.2 0.25 0.3 0.350.1
1
10
100
He Porosity (frac.)
KL
(mD
)
Fig. 3—Permeability vs. porosity for the five different rocktypes
August 2013 SPE Reservoir Evaluation & Engineering 269

emphasize the hysteresis trend for each plug sample. The satura-tion cycle (i.e., PD or imbibition) and the sample number andRRT are indicated in the title chart of each plot. This data setaims at comparing the relative permeability behavior between dif-ferent carbonate rock types found in the reservoir under study.Each row in the figure represents a single rock-type data as classi-fied earlier in Figs. 1 and 2. Actually, Fig. 5 presents the differentRRT Kr data in the same fashion as the RRT classification in Figs.1 and 2 so that direct comparisons can be made between the RRTand the relative permeability behavior.
In the same fashion, Fig. 6 presents the PD and imbibition in-situ (water) saturation monitoring profiles (ISSM) along samplelengths for all RRT samples. Each saturation profile representsequilibrium water saturation at the end of each fractional flow ratethat was used during the SS relative permeability experiment.These ISSM curves are necessary to check the quality of the rela-tive permeability curves. Two main features are normally detectedfrom such curves: heterogeneity and capillary end effect. A bumpflood was designed at the end of each saturation cycle to establishmore-uniform water saturation (Sw) along sample lengths. The Sw
profiles after the bump floods are monitored through the ISSMcurves. The saturation cycle (i.e., PD or imbibition) and samplenumber and RRT are indicated in the title charts. Before the oilbump flood is made in drainage, the Swi profile may appear non-uniform because of a capillary end effect. This situation mayseverely affect the subsequent imbibition data. It is seen in Fig. 6that the bump floods reduced the capillary end effects and madethe Swi profiles look less affected. The uniformity of the saturationprofiles should always be taken into consideration for reliable rel-ative permeability data. Such data could also be better qualifiedby use of coreflood numerical simulation, which is discussed in alater section in the paper.
Primary Drainage. In Fig. 5a, we see little differences betweenthe PD relative permeability (Kr) curves between the samples inthe same RRT. These differences seem to become smaller as wemove toward the poorer-quality RRT samples. The differencesare obviously caused by local heterogeneity that is seen more inhigher-permeability carbonate samples that are characterized byvugs, moldic porosity, and diversified ranges of micro- to macro-pores. There is no clear relation between the Krw/Kro intersection(saturation) point and rock type in Fig. 5a. However, all the inter-section points for all the rock-type samples seem to be in therange of a 0.55 through 0.65 water saturation.
In Fig. 5a, Sample 113 (in the RRT1 plot) suffered from alarge capillary end effect that caused the Kro curve to flatten at alower water saturation (Sw). This can be seen clearly in the corre-sponding ISSM curves in Fig. 6. The bump flood at the end ofdrainage decreased the water saturation further and gave a more
TABLE 2—BD AND ZEFF FOR CERTAIN PURE MINERALS
Mineral BD (g/cm3) Zeff
Calcite 2.71 15.71
Dolomite 2.85 13.74
Quartz 2.65 11.78
TABLE 3—SUMMARY OF THE ROCK-CHARACTERIZATION SCHEME
Sample
Number RRT
Thin-Section
Description Mineral Zeff
GD
(g/cm3) BD Profile
Porosity
(fraction)
Permeability
(md)
Hg Saturation
at 200 psi
(fraction)
Micron at
the Peak
of PSD
T2 at
NMR Peak
(milliseconds)
113 1 Vugs and inter-
crystalline meso
to macropores
(loosely packed
texture)
Dolomite 14.14 2.83 Non-uniform 0.174 46 0.97 2.7 373
114 1 Intercrystalline
micro- to
macropores
Dolomite 14.39 2.81 Non-uniform 0.195 21 0.95 1.53 295
9 2 Interparticle
porosity, intrapar-
ticle porosity in
micrite
(grainstone)
Calcite 15.59 2.70 Non-uniform
(from CT image)
0.279 11 0.82 1.15 295
15 2 Intraparticle
porosity in micrite
(grainstone to
rudstone)
Calcite 15.66 2.70 Uniform 0.236 1.75 0.82 0.87 294
22 3 Packstone Calcite 15.76 2.70 Non-uniform 0.212 2.08 0.65 0.72 184
72 3 Packstone Calcite 15.67 2.70 Non-uniform 0.214 2.06 0.65 0.60 184
4 4 Packstone Calcite 15.69 2.70 Non-uniform 0.227 5.34 0.52 0.72 233
6 4 Packstone
(pores reduced
by cement)
Calcite 15.78 2.71 Non-uniform 0.213 3.02 0.62 0.50 233
138 5 Bioturbated
packstone
(microporosity
between
cement)
Calcite 15.51 2.73 Uniform 0.184 0.98 0.23 0.42 145
139 5 Bioturbated
packstone
(microporosity
between
cement)
Calcite 15.47 2.73 Uniform 0.184 1.01 0.23 0.42 145
270 August 2013 SPE Reservoir Evaluation & Engineering
uniform Sw profile. All samples were subjected to a bump flood toproduce more-representative saturations. This was necessarybecause of the capillary end effect, which is basically the satura-tion gradient along sample lengths, as can be seen in Fig. 6. Thecapillary end effect is defined as the accumulation of a preferen-tially wetting phase (i.e., water in PD) at the outlet when displac-ing the wetting phase by the nonwetting phase (i.e., oil). Thisobservation confirms that the PD experiment was conducted at apreferentially water-wet condition. This, in turn, suggests that thesolvent-cleaning procedures implemented at the restoration stageof the samples were efficient.
Without the bump floods, the water saturations at the end ofPD range from 0.2 to 0.3. After the bump floods, those saturationsdecreased to a range of 0.05 to 0.23. Similarly, the Kro increasedafter the bump flood from a range of 0.2 to 0.5 to a range of 0.65to 0.85. These changes (i.e., increase in Kro and decrease in Sw)emphasize the importance of the bump-flood design and demon-strate the impact of the capillary end effect on relative permeabil-ity curves. Different samples/rock types may experience differentmagnitudes of capillary end effects because of variations in rockproperties. This is especially true for water-wet states in whichthe significance of the pore geometry is most apparent (Wardlaw1980).
Imbibition. In Fig. 5b, the imbibition Kr curves are presented inthe same fashion as the PD Kr curves in Fig. 5a. The imbibitionKrw/Kro intersection points occur at lower Sw values than theintersection points of drainage. The imbibition Krw/Kro intersec-tion points decreased to a range of 0.45 to 0.6. This might be anindication of wettability change to less water-wet conditions(Honarpour et al. 1986), but conclusions about wettability altera-tions from Kr curves can be risky especially for intermediate- and/or mixed-wet conditions (Cuiec 1991).
Without bump floods, the water saturations at the end of imbi-bition range from 0.75 to 0.85. After the bump floods, these satu-rations increase to a range of 0.80 to 0.95. Similarly, the Krw
increased after the bump flood from a range of 0.2 to 0.3 to arange of 0.2 to 0.55. Fig. 6 does not show severe end effects inimbibition except for Sample 9 from RRT2 and Sample 22 fromRRT3. This can be seen in the relevant ISSM curves that showlower Sw values toward the outlets of the samples. These effectswere minimized by the bump floods, as can also be seen in Fig. 6in the relevant plots.
The ISSM curves for RRT1 samples in Fig. 6 show fluctua-tions in both drainage and imbibition as compared with the otherrock types. This is not noise in the saturation-profile data; it iscaused by the local heterogeneity along the lengths of the samplesthat become apparent in the presence of vugs.
The imbibition Kr curves in Fig. 5b for each of the two sam-ples in each RRT show similar behavior except for minor varia-tions because of local heterogeneity that is basically related to thespecific types and relative percentages of pores present, and theirdistribution within the rock. The similar imbibition behavior ofthe different samples in the same RRT confirms that the static
rock-typing scheme established from petrophysical measurementsand geological descriptions is valid and yields similar imbibitiondynamic data for the samples under study. This is an interestingexamination of the effect of static rock characterization on thedynamic data and rather important input information for an ulti-mate dynamic reservoir modeling (Masalmeh 2000). The onlyviolation to this link between static and dynamic rock typing isRRT2 samples that had already been shown to give variations inthe static rock characterization between Samples 9 and 15.Although these two samples were initially selected to be RRT2,the reality is that Sample 15 is better fitted into RRT3, asexplained previously. This again confirms the consistency estab-lished between static and dynamic rock typing. There may not bea guarantee to establish a good link between the static anddynamic rock types because of local heterogeneity and wettabil-ity, but proper static rock typing is certainly the way to reduce thediscrepancies that may arise between the two rock-typingschemes.
The preceding observations made between PD and imbibitionrelative permeability characteristics indicate that there were somechanges in the wettability conditions of the samples after aging. Itis actually expected to observe mixed-wet behavior in such car-bonate samples during the imbibition process. This has been indi-cated by the low remaining oil saturations obtained at the end ofimbibition together with the increase in water saturations (fromdrainage to imbibition) at the Krw/Kro intersection points. In addi-tion, most of the Krw values attained at the end of imbibition sug-gest mixed-wet behavior (Honarpour et al. 1986; Masalmeh2001). Nevertheless, the effect of wettability on the relative per-meability endpoints is still subject for discussions, and these indi-cations are only rules of thumb that are questioned by severalresearchers (e.g., Morrow 1990), especially for mixed-wettabilitysystems.
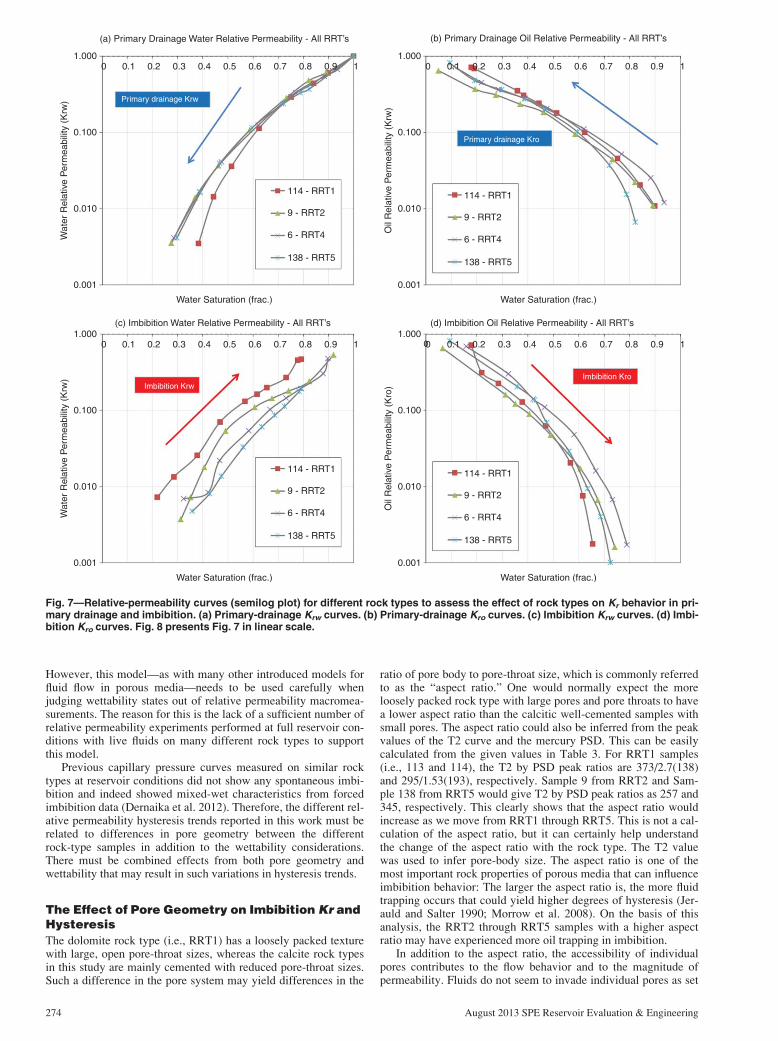
Fig. 7 presents (in semilog scale) relative permeability curvesfor different rock-type samples to assess the effect of rock typeson the relative permeability behavior in PD and imbibition. Figs.7a and 7b give the PD Krw curves and the PD Kro curves, respec-tively, whereas Figs. 7c and 7d give the imbibition Krw curves andthe imbibition Kro curves, respectively. Fig. 8 plots Fig. 7 in linearscale. In PD, the curves did not show major variations betweenthe different RRT samples. At the high-water-saturation end, Kro
tends to be larger for large pore-sized samples at the start of oilinvasion. At the lower-Sw end (i.e., toward the end of drainage),the curves seem to be influenced by capillary end effects. Theimbibition curves in Figs. 8c and 8d for both Krw and Kro, respec-tively, show large variations between the different rock types.One can also detect larger variations in the imbibition water rela-tive permeability than in the imbibition oil relative-permeabilitycurves. This result highlights the fundamental differences betweendrainage and imbibition fluid-flow mechanisms at the pore level.It also indicates the potential differences in the flow patternbetween oil and water.
In Fig. 8c, the larger-pore-sized samples (i.e., RRT1 andRRT2) show higher Krw than the smaller-pore-sized samples (i.e.,RRT4 and RRT5) at a given water saturation. In this perspective,RRT1 and RRT2 samples show more oil-wet characteristics thanthe poorer-quality RRT4 and RRT5 samples. This is also sup-ported by the imbibition Kro trends in Fig. 8d for RRT1 andRRT2 samples, which tend to show a more rapid reduction uponwater invasion into the large oil-wet pores. Opposite to the Krw
behavior, the large-pore-sized samples (i.e., RRT1 and RRT2)give lower Kro values at a given Sw. All those samples were
TABLE 4—WATER FRACTIONS (Fw) USED DURING PD AND
IMBIBITION FLOODS
Fw in Primary Drainage Fw in Imbibition
1.00 0.00
0.98 0.02
0.95 0.05
0.85 0.15
0.50 0.50
0.15 0.85
0.05 0.95
0.01 0.99
0.00 1.00
TABLE 5—FLOODING RATES AND CAPILLARY NUMBERS IN
THE Kr EXPERIMENTS
RRT1 RRT5
Total flooding rate 30 cm3/hr 20 cm3/hr
Capillary number (Nc¼lv/r) 6.8�10�8 4.7�10�8
August 2013 SPE Reservoir Evaluation & Engineering 271
exposed to the same fluids at the same conditions, and there is noclear reasoning behind possible variations in the wettability condi-tions between the samples under study. The main differencesbetween those samples are the rock geometrical properties (seeTable 1) that tend to give rise to different fluid mechanisms inimbibition more than in PD. This should be the result of a morecomplex fluid-flow regime in imbibition, as will be explained inthe following.
Hysteresis. Fig. 5c shows the hysteresis behavior between PDand imbibition. Each plot presents the Kr curves from one rock
sample to compare between the different saturation cycles. RRT1samples gave a different hysteresis pattern to all other rock types.In RRT1, the imbibition Kro is lower than the PD Kro curve at thesame water saturation, and the imbibition Krw is higher than thePD Krw curve at the same water saturation. For all the other rocktypes (i.e., RRT2 through RRT5 samples), the imbibition Kro
curve is lower than the PD Kro curve (this is a similar behavior toRRT1), but this time the imbibition Krw curve is lower than thePD Krw curve at the same water saturation. Existing hysteresismodels (Jerauld and Salter 1990; Masalmeh 2001) would classifyRRT1 samples as mixed-wet to oil-wet and the other RRT sam-ples as water-wet. In principle, for the water-wet case, both
00
0.1
0.2
0.3
0.4
0.5
Rel
ativ
e P
erm
eabi
lity
0.6
0.7
0.8
0.9
1
0.1 0.2 0.3 0.4 0.5Water Saturation (frac.)
0.6 0.7
kr-dr-113
Primary Drainage Relative Permeability - RRT1
Bump-dr-113
kr-drn-114
Bump-dr-114
0.8 0.9 1 00
0.1
0.2
0.3
0.4
0.5
Rel
ativ
e P
erm
eabi
lity
0.6
0.7
0.8
0.9
1
0.1 0.2 0.3 0.4 0.5Water Saturation (frac.)
0.6 0.7
kr-Imb-113
Imbibition Relative Permeability - RRT1
kr-Imb-Bump
kr-Imb-114
Bumb-Imb-114
0.8 0.9 1
00.0
0.1
0.2
0.3
0.4
0.5
Rel
ativ
e P
erm
eabi
lity
0.6
0.7
0.8
0.9
1.0
0.1 0.2 0.3 0.4 0.5Water Saturation (frac.)
0.6 0.7
kr-dr-113
Primary Drainage Relative Permeability - RRT2
Bump-dr-113kr-drn-114Bump-dr-114
0.8 0.9 1 00.0
0.1
0.2
0.3
0.4
0.5
Rel
ativ
e P
erm
eabi
lity
0.6
0.7
0.8
0.9
1.0
0.1 0.2 0.3 0.4 0.5Water Saturation (frac.)
0.6 0.7
Kr-Imb-9
Imbibition Relative Permeability - RRT2
Bump-Imb-9
Kr-Imb-25
0.8 0.9 1
00
0.1
0.2
0.3
0.4
0.5
Rel
ativ
e P
erm
eabi
lity
0.6
0.7
0.8
0.9
1
0.1 0.2 0.3 0.4 0.5Water Saturation (frac.)
0.6 0.7
kr-lmb-113
Hysteresis - RRT1 (113)
Bump-imb-113
kr-dr-113
kr-lmb-114
Bump-imb-114
kr-Drn-114
0.8 0.9 1 00
0.1
0.2
0.3
0.4
0.5
Rel
ativ
e P
erm
eabi
lity
0.6
0.7
0.8
0.9
1
0.1 0.2 0.3 0.4 0.5Water Saturation (frac.)
0.6 0.7
Hysteresis - RRT1 (114)
0.8 0.9 1
00.0
0.1
0.2
0.3
0.4
0.5
Rel
ativ
e P
erm
eabi
lity
0.6
0.7
0.8
0.9
1.0
0.1 0.2 0.3 0.4 0.5Water Saturation (frac.)
0.6 0.7
Hysteresis - RRT2 (9)
0.8 0.9 1 00.0
0.1
0.2
0.3
0.4
0.5
Rel
ativ
e P
erm
eabi
lity
0.6
0.7
0.8
0.9
1.0
0.1 0.2 0.3 0.4 0.5Water Saturation (frac.)
0.6 0.7
kr-imb-15
Hysteresis - RRT2 (15)
Bump-imb-15kr-dr-15
kr-imb-9
Bump-imb-9
kr-dr-9
0.8 0.9 1
00.0
0.2
0.4
Rel
ativ
e P
erm
eabi
lity
0.6
0.8
1.0
0.1 0.2 0.3 0.4 0.5Water Saturation (frac.)
0.6 0.7
kr-dr-22
Primary Drainage Relative Permeability - RRT3
Bump-dr-22
kr-dr-72
Bump-dr-72
0.8 0.9 1.0 0.00.0
0.2
0.4
Rel
ativ
e P
erm
eabi
lity
0.6
0.8
1.0
1.2
0.1 0.2 0.3 0.4 0.5Water Saturation (frac.)
0.6 0.7
kr-imb-22
Imbibition Relative Permeability - RRT3
Bump-imb-22
kr-imb-72
kr-imb-4Bump-imb-4
Bump-imb-6kr-imb-6
0.8 0.9 1.0
00.0
0.1
0.2
0.3
0.4
0.5
Rel
ativ
e P
erm
eabi
lity
0.6
0.7
0.8
0.9
1.0
0.1 0.2 0.3 0.4 0.5Water Saturation (frac.)
0.6 0.7
kr-dr-4
Primary Drainage Relative Permeability - RRT4
Bump-dr-4kr-dr-6Bump-dr-6
0.8 0.9 1 00.0
0.1
0.2
0.3
0.4
0.5
Rel
ativ
e P
erm
eabi
lity
0.6
0.7
0.8
0.9
1.0
0.1 0.2 0.3 0.4 0.5Water Saturation (frac.)
0.6 0.7
Imbibition Relative Permeability - RRT4
0.8 0.9 1
0.00.0
0.2
0.4
Rel
ativ
e P
erm
eabi
lity
0.6
0.8
1.0
0.1 0.2 0.3 0.4 0.5Water Saturation (frac.)
0.6 0.7
kr-lmb-22
Hysteresis - RRT3 (22)
Bump-imb-22
kr-dr-22
kr-lmb-72
kr-dr-72
0.8 0.9 1.0 0.00.0
0.2
0.4
Rel
ativ
e P
erm
eabi
lity
0.6
0.8
1.0
0.1 0.2 0.3 0.4 0.5Water Saturation (frac.)
0.6 0.7
Hysteresis - RRT3 (72)
0.8 0.9 1.0
00.0
0.1
0.2
0.3
0.4
0.5
Rel
ativ
e P
erm
eabi
lity
0.6
0.7
0.8
0.9
1.0
0.1 0.2 0.3 0.4 0.5Water Saturation (frac.)
0.6 0.7
Hysteresis - RRT4 (4)
0.8 0.9 1 00.0
0.1
0.2
0.3
0.4
0.5R
elat
ive
Per
mea
bilit
y
0.6
0.7
0.8
0.9
1.0
0.1 0.2 0.3 0.4 0.5Water Saturation (frac.)
0.6 0.7
kr-imb-6
Hysteresis - RRT4 (6)
Bump-imb-6kr-dr-6
kr-imb-4
Bump-imb-4
kr-dr-4
0.8 0.9 1
kr-imb-138Bump-imb-138
Bump-imb-139kr-imb-139
00.0
0.1
0.2
0.3
0.4
0.5
Rel
ativ
e P
erm
eabi
lity
0.6
0.7
0.8
0.9
1
0.1 0.2 0.3 0.4 0.5Water Saturation (frac.)
0.6 0.7
kr-dr-138
Primary Drainage Relative Permeability - RRT5
Bump-dr-138kr-dr-139Bump-dr-139
0.8 0.9 1 00.0
0.1
0.2
0.3
0.4
0.5
Rel
ativ
e P
erm
eabi
lity
0.6
0.7
0.8
0.9
1
0.1 0.2 0.3 0.4 0.5Water Saturation (frac.)
0.6 0.7
Imbibition Relative Permeability - RRT5
0.8 0.9 1 00
0.1
0.2
0.3
0.4
0.5
Rel
ativ
e P
erm
eabi
lity
0.6
0.7
0.8
0.9
1
0.1 0.2 0.3 0.4 0.5Water Saturation (frac.)
0.6 0.7
Hysteresis - RRT5 (138)
0.8 0.9 1 00
0.1
0.2
0.3
0.4
0.5
Rel
ativ
e P
erm
eabi
lity
0.6
0.7
0.8
0.9
1
0.1 0.2 0.3 0.4 0.5Water Saturation (frac.)
0.6 0.7
kr-imb-139
Hysteresis - RRT5 (139)
Bump-imb-139
kr-dr-139
kr-imb-138
Bump-imb-138
kr-dr-138
0.8 0.9 1
(a) PD Kr (b) IMB Kr (c) PD-Imb Kr Hysteresis
Fig. 5—(a) Primary-drainage Kr curves for all RRTs. (b) Imbibition Kr curves for all RRTs. (c) Hysteresis in the Kr curves betweenPD and imbibition for all the RRTs. Every plot row presents one rock type, and the RRT number is indicated in the chart title. RRT1curves gave a different hysteresis trend from the other RRTs.
272 August 2013 SPE Reservoir Evaluation & Engineering
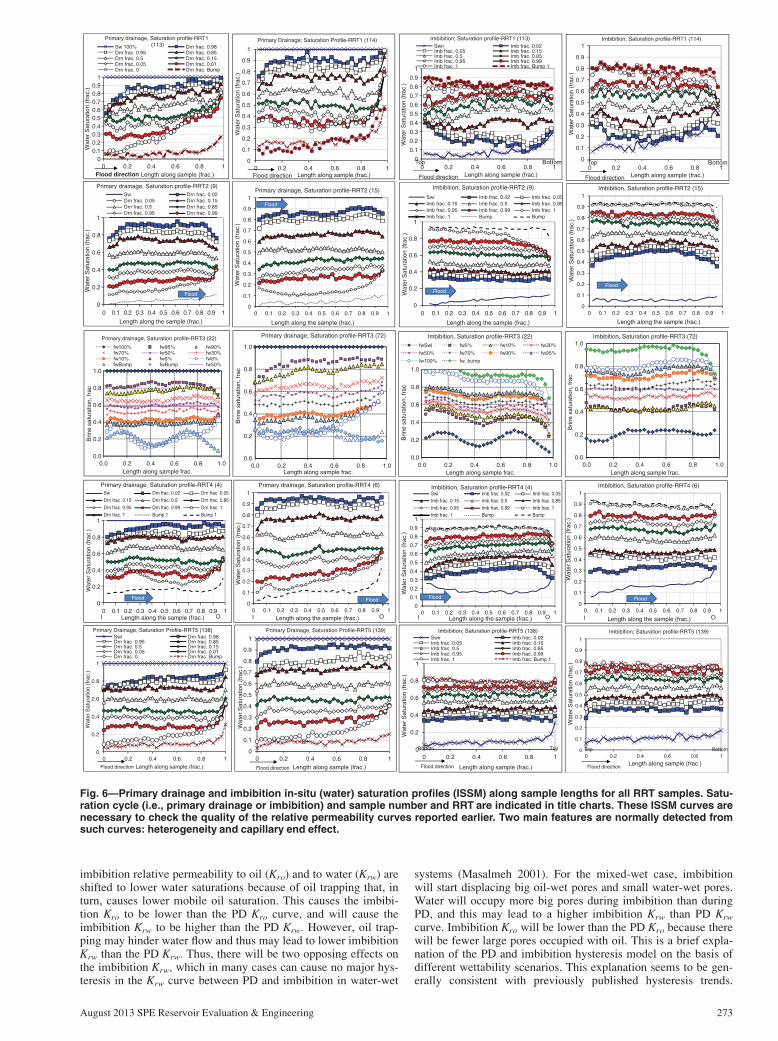
imbibition relative permeability to oil (Kro) and to water (Krw) areshifted to lower water saturations because of oil trapping that, inturn, causes lower mobile oil saturation. This causes the imbibi-tion Kro to be lower than the PD Kro curve, and will cause theimbibition Krw to be higher than the PD Krw. However, oil trap-ping may hinder water flow and thus may lead to lower imbibitionKrw than the PD Krw. Thus, there will be two opposing effects onthe imbibition Krw, which in many cases can cause no major hys-teresis in the Krw curve between PD and imbibition in water-wet
systems (Masalmeh 2001). For the mixed-wet case, imbibitionwill start displacing big oil-wet pores and small water-wet pores.Water will occupy more big pores during imbibition than duringPD, and this may lead to a higher imbibition Krw than PD Krw
curve. Imbibition Kro will be lower than the PD Kro because therewill be fewer large pores occupied with oil. This is a brief expla-nation of the PD and imbibition hysteresis model on the basis ofdifferent wettability scenarios. This explanation seems to be gen-erally consistent with previously published hysteresis trends.
00.10.20.30.40.50.60.70.80.9
1
0 0.2 0.4 0.6 0.8 1
Wat
er S
atur
atio
n (f
rac.
)
Length along sample (frac.)
Primary drainage, Saturation profile-RRT1 (113)Sw 100% Drn frac. 0.98
Drn frac. 0.95 Drn frac. 0.85Drn frac. 0.5 Drn frac. 0.15Drn frac. 0.05 Drn frac. 0.01Drn frac. 0 Drn frac. Bump
Flood direction
0
0.1
0.2
0.3
0.4
0.5
0.6
0.7
0.8
0.9
1
0 0.2 0.4 0.6 0.8 1
Wat
er S
atur
atio
n (f
rac.
)
Length along sample (frac.)
Primary Drainage; Saturation Profile-RRT1 (114)
Flood direction
0
0.1
0.2
0.3
0.4
0.5
0.6
0.7
0.8
0.9
1
0 0.2 0.4 0.6 0.8 1
Wat
er S
atur
atio
n (f
rac.
)
Length along sample (frac.)
Imbibition; Saturation profile-RRT1 (113)Swir Imb frac. 0.02Imb frac. 0.05 Imb frac. 0.15Imb frac. 0.5 Imb frac. 0.85Imb frac. 0.95 Imb frac. 0.99Imb frac. 1 Imb frac. Bump 1
Flood direction
ottoBpoT m 0
0.1
0.2
0.3
0.4
0.5
0.6
0.7
0.8
0.9
1
0 0.2 0.4 0.6 0.8 1
Wat
er S
atur
atio
n (f
rac.
)
Length along sample (frac.)
Imbibition; Saturation profile-RRT1 (114)
Flood direction
mottoBpoT
0
0.2
0.4
0.6
0.8
1
0 0.1 0.2 0.3 0.4 0.5 0.6 0.7 0.8 0.9 1
Wat
er S
atur
atio
n (f
rac.
)
Length along the sample (frac.)
Primary drainage, Saturation profile-RRT2 (9)Sw Drn frac. 0.02Drn frac. 0.05 Drn frac. 0.15Drn frac. 0.5 Drn frac. 0.85Drn frac. 0.95 Drn frac. 0.99
Flood
0
0.1
0.2
0.3
0.4
0.5
0.6
0.7
0.8
0.9
1
0 0.1 0.2 0.3 0.4 0.5 0.6 0.7 0.8 0.9 1
Wat
er S
atur
atio
n (f
rac.
)
Length along the sample (frac.)
Primary drainage, Saturation profile-RRT2 (15)
Flood
0
0.2
0.4
0.6
0.8
1
0 0.1 0.2 0.3 0.4 0.5 0.6 0.7 0.8 0.9 1
Wat
er S
atur
atio
n (f
rac.
)
Length along the sample (frac.)
Imbibition, Saturation profile-RRT2 (9)
Swi Imb frac. 0.02 Imb frac. 0.05Imb frac. 0.15 Imb frac. 0.5 Imb frac. 0.85Imb frac. 0.95 Imb frac. 0.99 Imb frac. 1Imb frac. 1 Bump Bump
Flood
0
0.1
0.2
0.3
0.4
0.5
0.6
0.7
0.8
0.9
1
0 0.1 0.2 0.3 0.4 0.5 0.6 0.7 0.8 0.9 1
Wat
er S
atur
atio
n (f
rac.
)
Length along the sample (frac.)
Imbibition, Saturation profile-RRT2 (15)
Flood
0.0
0.2
0.4
0.6
0.8
1.0
0.0 0.2 0.4 0.6 0.8 1.0
Brin
e sa
tura
tion,
frac
Length along sample frac.
Primary drainage, Saturation profile-RRT3 (22)
fw100% fw95% fw90%fw70% fw50% fw30%fw10% fw5% fw0%fwBump fwBump fw50%
0.0
0.2
0.4
0.6
0.8
1.0
0.0 0.2 0.4 0.6 0.8 1.0
Brin
e sa
tura
tion,
frac
Length along sample frac.
Primary drainage, Saturation profile-RRT3 (72)
0.0
0.2
0.4
0.6
0.8
1.0
0.0 0.2 0.4 0.6 0.8 1.0
Brin
e sa
tura
tion,
frac
Length along sample frac.
Imbibition, Saturation profile-RRT3 (22)fwSwi fw5% fw10% fw30%
fw50% fw70% fw90% fw95%
fw100% fw_bump
0.0
0.2
0.4
0.6
0.8
1.0
0.0 0.2 0.4 0.6 0.8 1.0
Brin
e sa
tura
tion,
frac
Length along sample frac.
Imbibition, Saturation profile-RRT3 (72)
0
0.1
0.2
0.3
0.4
0.5
0.6
0.7
0.8
0.9
1
0 0.1 0.2 0.3 0.4 0.5 0.6 0.7 0.8 0.9 1
Wat
er S
atur
atio
n (f
rac.
)
Length along the sample (frac.)
Imbibition, Saturation profile-RRT4 (4)Swi Imb frac. 0.02 Imb frac. 0.05Imb frac. 0.15 Imb frac. 0.5 Imb frac. 0.85Imb frac. 0.95 Imb frac. 0.99 Imb frac. 1Imb frac. 1 Bump Bump
Flood
I Otl
0
0.2
0.4
0.6
0.8
1
0 0.1 0.2 0.3 0.4 0.5 0.6 0.7 0.8 0.9 1
Wat
er S
atur
atio
n (f
rac.
)
Length along the sample (frac.)
Primary drainage, Saturation profile-RRT4 (4)Sw Drn frac. 0.02 Drn frac. 0.05Drn frac. 0.15 Drn frac. 0.5 Drn frac. 0.85Drn frac. 0.95 Drn frac. 0.99 Drn frac. 1Drn frac. 1 Bump 1 Bump 1
Flood
I Ot
0
0.1
0.2
0.3
0.4
0.5
0.6
0.7
0.8
0.9
1
0 0.1 0.2 0.3 0.4 0.5 0.6 0.7 0.8 0.9 1
Wat
er S
atur
atio
n (f
rac.
)
Length along the sample (frac.)
Primary drainage, Saturation profile-RRT4 (6)
Flood
I Otl
0
0.1
0.2
0.3
0.4
0.5
0.6
0.7
0.8
0.9
1
0 0.1 0.2 0.3 0.4 0.5 0.6 0.7 0.8 0.9 1
Wat
er S
atur
atio
n (f
rac.
)
Length along the sample (frac.)
Imbibition, Saturation profile-RRT4 (6)
Flood
I Otl
0
0.2
0.4
0.6
0.8
1
0 0.2 0.4 0.6 0.8 1
Wat
er S
atur
atio
n (f
rac.
)
Length along sample (frac.)
Primary Drainage, Saturation Profile-RRT5 (138)Swi Drn frac. 0.98Drn frac. 0.95 Drn frac. 0.85Drn frac. 0.5 Drn frac. 0.15Drn frac. 0.05 Drn frac. 0.01Drn frac. 0 Drn frac. Bump
Flood direction
0
0.1
0.2
0.3
0.4
0.5
0.6
0.7
0.8
0.9
1
0 0.2 0.4 0.6 0.8 1
Wat
er S
atur
atio
n (f
rac.
)
Length along sample (frac.)
Primary Drainage, Saturation Profile-RRT5 (139)
Flood direction
0
0.2
0.4
0.6
0.8
1
0 0.2 0.4 0.6 0.8 1
Wat
er S
atur
atio
n (f
rac.
)
Length along sample (frac.)
Imbibition; Saturation profile-RRT5 (138)Swir Imb frac. 0.02Imb frac. 0.05 Imb frac. 0.15Imb frac. 0.5 Imb frac. 0.85Imb frac. 0.95 Imb frac. 0.99Imb frac. 1 Imb frac. Bump 1
Flood direction
TopBottom 0
0.1
0.2
0.3
0.4
0.5
0.6
0.7
0.8
0.9
1
0 0.2 0.4 0.6 0.8 1
Wat
er S
atur
atio
n (f
rac.
)
Length along sample (frac.)
Imbibition, Saturation profile-RRT5 (139)
Flood direction
mottoBpoT
Fig. 6—Primary drainage and imbibition in-situ (water) saturation profiles (ISSM) along sample lengths for all RRT samples. Satu-ration cycle (i.e., primary drainage or imbibition) and sample number and RRT are indicated in title charts. These ISSM curves arenecessary to check the quality of the relative permeability curves reported earlier. Two main features are normally detected fromsuch curves: heterogeneity and capillary end effect.
August 2013 SPE Reservoir Evaluation & Engineering 273
However, this model—as with many other introduced models forfluid flow in porous media—needs to be used carefully whenjudging wettability states out of relative permeability macromea-surements. The reason for this is the lack of a sufficient number ofrelative permeability experiments performed at full reservoir con-ditions with live fluids on many different rock types to supportthis model.
Previous capillary pressure curves measured on similar rocktypes at reservoir conditions did not show any spontaneous imbi-bition and indeed showed mixed-wet characteristics from forcedimbibition data (Dernaika et al. 2012). Therefore, the different rel-ative permeability hysteresis trends reported in this work must berelated to differences in pore geometry between the differentrock-type samples in addition to the wettability considerations.There must be combined effects from both pore geometry andwettability that may result in such variations in hysteresis trends.
The Effect of Pore Geometry on Imbibition Kr andHysteresis
The dolomite rock type (i.e., RRT1) has a loosely packed texturewith large, open pore-throat sizes, whereas the calcite rock typesin this study are mainly cemented with reduced pore-throat sizes.Such a difference in the pore system may yield differences in the
ratio of pore body to pore-throat size, which is commonly referredto as the “aspect ratio.” One would normally expect the moreloosely packed rock type with large pores and pore throats to havea lower aspect ratio than the calcitic well-cemented samples withsmall pores. The aspect ratio could also be inferred from the peakvalues of the T2 curve and the mercury PSD. This can be easilycalculated from the given values in Table 3. For RRT1 samples(i.e., 113 and 114), the T2 by PSD peak ratios are 373/2.7(138)and 295/1.53(193), respectively. Sample 9 from RRT2 and Sam-ple 138 from RRT5 would give T2 by PSD peak ratios as 257 and345, respectively. This clearly shows that the aspect ratio wouldincrease as we move from RRT1 through RRT5. This is not a cal-culation of the aspect ratio, but it can certainly help understandthe change of the aspect ratio with the rock type. The T2 valuewas used to infer pore-body size. The aspect ratio is one of themost important rock properties of porous media that can influenceimbibition behavior: The larger the aspect ratio is, the more fluidtrapping occurs that could yield higher degrees of hysteresis (Jer-auld and Salter 1990; Morrow et al. 2008). On the basis of thisanalysis, the RRT2 through RRT5 samples with a higher aspectratio may have experienced more oil trapping in imbibition.
In addition to the aspect ratio, the accessibility of individualpores contributes to the flow behavior and to the magnitude ofpermeability. Fluids do not seem to invade individual pores as set
1.0000 0.1 0.2 0.3
(a) Primary Drainage Water Relative Permeability - All RRT’s
Water Saturation (frac.)
Primary drainage Krw
0.4 0.5 0.6 0.7 0.8
114 - RRT1
9 - RRT2
6 - RRT4
138 - RRT5
0.9 1
0.010
Wat
er R
elat
ive
Per
mea
bilit
y (K
rw)
0.100
0.001
1.0000 0.1 0.2 0.3
(b) Primary Drainage Oil Relative Permeability - All RRT’s
Water Saturation (frac.)
Primary drainage Kro
0.4 0.5 0.6 0.7 0.8
114 - RRT1
9 - RRT2
6 - RRT4
138 - RRT5
0.9 1
0.010
Oil
Rel
ativ
e P
erm
eabi
lity
(Krw
)
0.100
0.001
1.0000 0.1 0.2 0.3
(c) Imbibition Water Relative Permeability - All RRT’s
Water Saturation (frac.)
Imbibition Krw
0.4 0.5 0.6 0.7 0.8
114 - RRT1
9 - RRT2
6 - RRT4
138 - RRT5
0.9 1
0.010
Wat
er R
elat
ive
Per
mea
bilit
y (K
rw)
0.100
0.001
1.0000 0.1 0.2 0.3
(d) Imbibition Oil Relative Permeability - All RRT’s
Water Saturation (frac.)
Imbibition Kro
0.4 0.5 0.6 0.7 0.8
114 - RRT1
9 - RRT2
6 - RRT4
138 - RRT5
0.9 1
0.010
Oil
Rel
ativ
e P
erm
eabi
lity
(Kro
)
0.100
0.001
Fig. 7—Relative-permeability curves (semilog plot) for different rock types to assess the effect of rock types on Kr behavior in pri-mary drainage and imbibition. (a) Primary-drainage Krw curves. (b) Primary-drainage Kro curves. (c) Imbibition Krw curves. (d) Imbi-bition Kro curves. Fig. 8 presents Fig. 7 in linear scale.
274 August 2013 SPE Reservoir Evaluation & Engineering

by the entry pressures of the corresponding pore throats. Invasionoften occurs in large clusters (Yuan 1991), and therefore the sizeof the pore throats and the number of pore throats emanating froma pore body (often called coordination number) largely affect theaccessible interconnections in the pore system. Smaller-pore-sizedsystems may reduce the accessibility of individual pores and thusmay yield higher invasion pressures that may result in smallermagnitudes of permeability. In imbibition, lower accessibility ofindividual pores may promote the trapping of oil clusters thateventually may hinder water flow. This could be another reasonfor the lower Krw in imbibition with poorer-quality RRT samplesand the resultant hysteresis trend.
Moreover, the pore corners and crevices in which water is stillpresent remain water-wet. The area of the water-wet surfacewould be comparable to all pores invaded by the oil (Helland andSkjæveland 2005). This would mean that the established water-wet surface area is expected to be almost the same for all invadedpores between RRT1 and RRT2 through RRT5 samples. Thus, thesmaller pores in the calcite rocks would have a larger fraction ofwater-wet surface, and should therefore exhibit a more water-wetbehavior than the larger pores in RRT1 during imbibition.
It is actually obvious from Fig. 5 that RRT5 samples with thesmallest pore and pore-throat sizes have shown the most water-wet imbibition Kr behavior on the basis of existing hysteresis
models (Figs. 7 and 8). This does not necessarily mean that thisRRT5 is water-wet. It shows water-wet behavior because of thecombined effects of wettability and pore geometry. To emphasizethis argument, similar RRT samples have been measured in po-rous plate at reservoir conditions and did not show any positivecapillary pressure imbibition. Similar RRT samples were alsotested in wettability-index experiments, and they gave large nega-tive values that ranged from �0.55 to �0.66, indicating mixed-wet states.
Previous researchers had commented on the risk of evaluatingthe wettability of a reservoir solely from relative permeabilitycurves because of the heterogeneous nature of wettability and theuncertain degree of wettability alterations (Torsaeter 1988; Cuiec1991). This analysis of pore geometry and wettability behaviorhas been useful in explaining the variations seen in the hysteresispatterns among the various rock types involved. This same analy-sis helps explain the variations of the imbibition Kro and Krw
curves in Figs. 7 and 8.
Relative Permeability Scanning Curves
At the top of the TZ, big pores and small pores are invaded withoil, whereas at the bottom of the TZ, only the big pores may beinvaded with oil; the smaller pores there would stay filled with
1.000
0.900
0.800
0.700
0.600
0.500
0.400
0.300
0.200
0.100
0.0000 0.1 0.2 0.3
(a) Primary Drainage Water Relative Permeability - All RRT’s
Water Saturation (frac.)
Primary drainage Krw
0.4 0.5 0.6 0.7 0.8
114 - RRT1
9 - RRT2
6 - RRT4
138 - RRT5
0.9 1
Wat
er R
elat
ive
Per
mea
bilit
y (K
rw)
1.000
0.900
0.800
0.700
0.600
0.500
0.400
0.300
0.200
0.100
0.0000 0.1 0.2 0.3
Water Saturation (frac.)
Primary drainage Kro
0.4 0.5 0.6 0.7 0.8
114 - RRT1
9 - RRT2
6 - RRT4
138 - RRT5
0.9 1
Oil
Rel
ativ
e P
erm
eabi
lity
(Krw
)
0.900
0.800
0.700
0.600
0.500
0.400
0.300
0.200
0.100
0.0000 0.1 0.2 0.3
Water Saturation (frac.)
Imbibition Krw
0.4 0.5 0.6 0.7 0.8
114 - RRT1
9 - RRT2
6 - RRT4
138 - RRT5
0.9 1
Wat
er R
elat
ive
Per
mea
bilit
y (K
rw)
1.000
0.900
0.800
0.700
0.600
0.500
0.400
0.300
0.200
0.100
0.0000 0.1 0.2 0.3
Water Saturation (frac.)
Imbibition Kro
0.4 0.5 0.6 0.7 0.8
114 - RRT1
9 - RRT2
6 - RRT4
138 - RRT5
0.9 1
Oil
Rel
ativ
e P
erm
eabi
lity
(Kro
)
(b) Primary Drainage Oil Relative Permeability - All RRT’s
1.000(c) Imbibition Water Relative Permeability - All RRT’s (d) Imbibition Oil Relative Permeability - All RRT’s
Fig. 8—Relative-permeability curves (linear scale of Fig. 7) for different rock types to assess the effect of rock types on Kr behaviorin primary drainage and imbibition. (a) Primary-drainage Krw curves. (b) Primary-drainage Kro curves. (c) Imbibition Krw curves.(d) Imbibition Kro curves.
August 2013 SPE Reservoir Evaluation & Engineering 275
water and would remain water-wet. This would yield variations inthe wettability state (along the length of the TZ), which are gov-erned by the increase in water saturation with depth. One wouldexpect more oil-wet rocks at the top of the TZ (i.e., low Swi) ascompared with the base of the zone in which the rocks should bemore water-wet. Such variations in saturations and wettability canhave a large impact on the production characteristics along thedepth of the TZ (e.g., Masalmeh 2000).
Three plug samples (10, 5, and 14) from the main RRT 3 wereselected to undergo fractional flow SS relative permeabilityexperiments to investigate the imbibition Kr behavior in the TZ ofthe reservoir under study. The experiments were performed at rep-resentative conditions to simulate reservoir behavior. Each samplestarting with 100% Sw was prepared to different target initial oilsaturation (Soi) by a PD SS Kr experiment with a total flow rate of20 cm3/hr. Depending on the target Soi among the three samples,different water fractional flow rates (Fw) were used. Plug 10reached a target initial oil saturation of 0.32 by use of 0.95 Fw;Plug 25 reached a target Soi of 0.52 by use of 0.30 Fw; and Plug14 reached a target Soi of 0.68 by use of 0.05 Fw. When the targetSoi value was reached, the PD was stopped, and the samples wereaged at the established saturations in crude oil at reservoir temper-ature for 4 weeks before the imbibition process was started. The
total flow rate of 20 cm3/hr was also used in imbibition. The waterfractional flow rate for each sample was different and started fromthe Fw at which the drainage cycle was stopped. The imbibitionscanning relative permeability experiment followed the same pro-cedure as the bounding Kr experiments described previously.Approximately eight fractional flow rates were used with increas-ing water fractions up to 1 Fw. The phase-flow rate and measuredSS differential pressure were used to calculate the individualeffective phase permeability, which, in turn, was used to calculaterelative permeability with the absolute permeability value as thereference permeability.
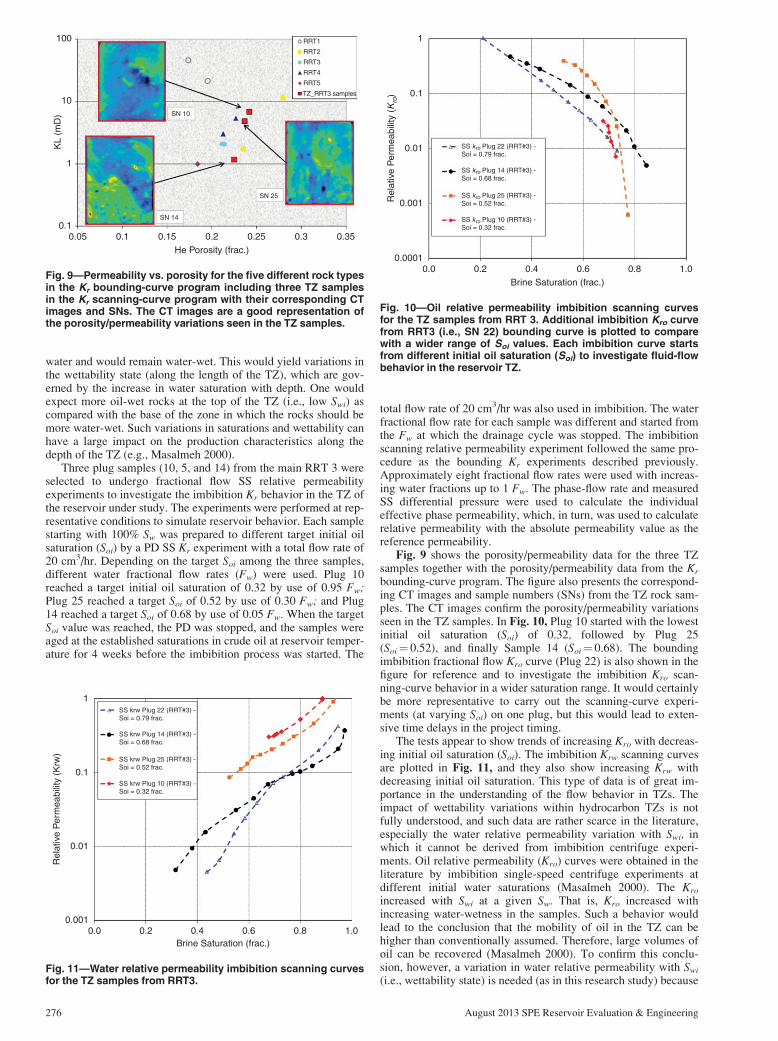
Fig. 9 shows the porosity/permeability data for the three TZsamples together with the porosity/permeability data from the Kr
bounding-curve program. The figure also presents the correspond-ing CT images and sample numbers (SNs) from the TZ rock sam-ples. The CT images confirm the porosity/permeability variationsseen in the TZ samples. In Fig. 10, Plug 10 started with the lowestinitial oil saturation (Soi) of 0.32, followed by Plug 25(Soi¼ 0.52), and finally Sample 14 (Soi¼ 0.68). The boundingimbibition fractional flow Kro curve (Plug 22) is also shown in thefigure for reference and to investigate the imbibition Kro scan-ning-curve behavior in a wider saturation range. It would certainlybe more representative to carry out the scanning-curve experi-ments (at varying Soi) on one plug, but this would lead to exten-sive time delays in the project timing.
The tests appear to show trends of increasing Kro with decreas-ing initial oil saturation (Soi). The imbibition Krw scanning curvesare plotted in Fig. 11, and they also show increasing Krw withdecreasing initial oil saturation. This type of data is of great im-portance in the understanding of the flow behavior in TZs. Theimpact of wettability variations within hydrocarbon TZs is notfully understood, and such data are rather scarce in the literature,especially the water relative permeability variation with Swi, inwhich it cannot be derived from imbibition centrifuge experi-ments. Oil relative permeability (Kro) curves were obtained in theliterature by imbibition single-speed centrifuge experiments atdifferent initial water saturations (Masalmeh 2000). The Kro
increased with Swi at a given Sw. That is, Kro increased withincreasing water-wetness in the samples. Such a behavior wouldlead to the conclusion that the mobility of oil in the TZ can behigher than conventionally assumed. Therefore, large volumes ofoil can be recovered (Masalmeh 2000). To confirm this conclu-sion, however, a variation in water relative permeability with Swi
(i.e., wettability state) is needed (as in this research study) because
0.050.1
1
10
KL
(mD
)
100
0.1 0.15
SN 14
SN 25
SN 10
RRT1
RRT2
RRT3
RRT4
RRT5
TZ_RRT3 samples
0.2
He Porosity (frac.)
0.25 0.3 0.35
Fig. 9—Permeability vs. porosity for the five different rock typesin the Kr bounding-curve program including three TZ samplesin the Kr scanning-curve program with their corresponding CTimages and SNs. The CT images are a good representation ofthe porosity/permeability variations seen in the TZ samples.
0.00.0001
0.001Rel
ativ
e P
erm
eabi
lity
(Kro
)
0.01
0.1
1
0.2 0.4
SS kro Plug 22 (RRT#3) -Soi = 0.79 frac.
SS kro Plug 14 (RRT#3) -Soi = 0.68 frac.
SS kro Plug 25 (RRT#3) -Soi = 0.52 frac.
SS kro Plug 10 (RRT#3) -Soi = 0.32 frac.
0.6
Brine Saturation (frac.)
0.8 1.0
Fig. 10—Oil relative permeability imbibition scanning curvesfor the TZ samples from RRT 3. Additional imbibition Kro curvefrom RRT3 (i.e., SN 22) bounding curve is plotted to comparewith a wider range of Soi values. Each imbibition curve startsfrom different initial oil saturation (Soi) to investigate fluid-flowbehavior in the reservoir TZ.
0.00.001
Rel
ativ
e P
erm
eabi
lity
(Krw
)
0.01
0.1
1
0.2 0.4
SS krw Plug 22 (RRT#3) -Soi = 0.79 frac.
SS krw Plug 14 (RRT#3) -Soi = 0.68 frac.
SS krw Plug 25 (RRT#3) -Soi = 0.52 frac.
SS krw Plug 10 (RRT#3) -Soi = 0.32 frac.
0.6Brine Saturation (frac.)
0.8 1.0
Fig. 11—Water relative permeability imbibition scanning curvesfor the TZ samples from RRT3.
276 August 2013 SPE Reservoir Evaluation & Engineering

of its significance and profound influence on waterflood efficiency(Jackson et al. 2003).
Figs. 10 and 11, respectively, present increasing Kro and Krw
with increasing Swi (i.e., decreasing Soi) at a given Sw. For thelarger Kro curves with higher Swi, this is because at low Swi oilflows in both big and small pores, whereas at high Swi oil flows inlarge pores only. This variation of Kro with Swi agrees with similarresults obtained from imbibition single-speed centrifuge experi-ments (Masalmeh 2000). Fig. 10, however, shows that for Sample25 (Soi¼ 0.52), Kro starts large but decreases quickly to low Kro
values after 0.69 Sw. This behavior occurs for low-Soi samples, inwhich oil phase tends to lose its connectivity after a certainamount of pore space has been waterflooded. Because the oil atlow Soi only exists in the bigger pores, waterflood can easilysweep those pores, leaving little oil in the pore space that causesthe oil to lose its connectivity and the oil permeability to drop dra-matically. For even lower Soi of 0.32 (Plug 10) and upon water-flood, imbibition Kro drops quickly because there are fewer largepores occupied with oil. This behavior was absent with the largerSoi samples because oil would be present in a wider range of poresizes, and thus oil production occurs with a steady reduction inKro from different pore sizes; thus, we do not see a sharp decreasein Kro. The oil phase can maintain good connectivity until loweroil saturations are attained. This is, of course, directly related tothe oil-phase saturation distribution at the pore level. On the otherhand, Krw in Fig. 11 shows even more increases with decreasingSoi. Hysteresis in both Kro and Krw may indicate nonwater-wetconditions. At low Swi, there are fewer connected water-filledpores, and thus water can initially flow only in large oil-wet poresand small water-wet pores. The percentage of water-wet poreshere should be critical because it will govern the fraction of waterflow in the oil-wet and the water-wet pores. This will, in turn,have a direct impact on the value of Krw. Therefore, at low Swi,and depending on pore sizes and the wettability distribution, watercan flow in large oil-wet pores. Krw increases gradually andslowly as water saturation increases rapidly because of the inva-sion of the large pores. The increase of Krw may change slope andincreases rapidly when water connectivity increases until waterspans the whole pore space. The start of water invasion from ahigher Swi can give rise to higher Krw because water would invadethe larger pores only and because of the large water saturationthat helps speed up water connectivity and yields larger Krw. Sam-ple 22 (Soi¼ 0.79), Sample 14 (Soi¼ 0.68), and Sample 25(Soi¼ 0.52) all show a change in the slope of Krw increase withSwi. The change of slope of the Krw curve occurs at approximately0.67 Sw for Samples 22 and 14, whereas it occurs at 0.61 Sw forSample 25. The linear scale in Fig. 12b clearly shows the rapid
increase in Krw at a certain Sw that must be related to the improvedwater connectivity as water invades the pore space.
Fig. 13a shows the scanning curve for Sample 25 (Soi¼ 0.52)in between the bounding drainage and imbibition curves of Sam-ple 22 that is believed to be of the same RRT, but permeabilitycomparisons show that Sample 25 is at a higher permeabilityvalue than Sample 22. This could be the reason for this, or it couldsimply be related to pore geometry and wettability considerations.For Sample 14 (Soi¼ 0.68), the scanning curve is in between thebounding drainage and imbibition curves. It is worth noting thatSample 14 is at a lower permeability value than Sample 22. Fromthe earlier pore-geometry investigations in this paper, permeabil-ity changes may indicate variations in pore geometries, includingpore sizes that may heavily affect the imbibition Kr behavior.Sample 14 gives a higher Krw than Sample 22 at low Sw, althoughSample 22 has a higher permeability. The higher Krw of Sample14 should be the effect of Swi, as previously explained. At ahigher Sw, Sample 22 develops a higher Krw than Sample 14. Thisis believed to be caused by the higher absolute permeability ofSample 22. From this analysis, hysteresis from Krw seems to bemore evidenced and influenced by pore structure and wettabilitythan hysteresis of Kro. It is clear that Kr is largely affected by Swi
that might be related to wettability and pore sizes. Such variationof Kr with Swi could be significant in affecting production andflow behavior at the reservoir scale.
Coreflood Simulation
Numerical simulation of all coreflood experiments was performedby use of Sendra. Sendra is a proprietary simulator that is basedon a two-phase 1D black-oil simulation model together with anautomated-history-matching routine. The software was used toreconcile time and spatially dependent experimental data (i.e.,pressure differential, fluid production, and in-situ Sw profile). Thiswas an important exercise to provide relative permeability outputdata that are corrected for the effects of laboratory-scale capillarypressure. Uncorrected data may give misleading relative perme-ability information. Plug-sample characteristics (e.g., length, di-ameter, porosity, and base permeability), injected fluid properties(e.g., viscosity), coreflooding rates, brine fractions, and floodingdurations were used as input parameters for the coreflood simula-tion. Fig. 14 presents the PD simulated transient data for Plug 113from RRT1: The plot to the left shows a reasonable history matchfor water production and pressure differential, whereas the plot tothe right presents the history match of the Sw profiles. Similarly,Fig. 15 shows the history-match data for Plug 138 from RRT 5.We show these examples to validate our drainage experimental Kr
0.00
Rel
ativ
e P
erm
eabi
lity
(Kro
)
0.2
0.4
0.6
0.8
(a) Kro Scanning Curves (b) Krw Scanning Curves
1
0.2 0.4
SS kro Plug 22 (RRT#3) -Soi = 0.79 frac.
SS kro Plug 14 (RRT#3) -Soi = 0.68 frac.
SS kro Plug 25 (RRT#3) -Soi = 0.52 frac.
SS kro Plug 10 (RRT#3) -Soi = 0.32 frac.
0.6Brine Saturation (frac.)
0.8 1.0 0.00
Rel
ativ
e P
erm
eabi
lity
(Krw
)
0.2
0.4
0.6
0.8
1
0.2 0.4
SS krw Plug 22 (RRT#3) -Soi = 0.79 frac.
SS krw Plug 14 (RRT#3) -Soi = 0.68 frac.
SS krw Plug 25 (RRT#3) -Soi = 0.52 frac.
SS krw Plug 10 (RRT#3) -Soi = 0.32 frac.
0.6Brine Saturation (frac.)
0.8 1.0
Fig. 12—(a) Linear-scale plot for Kro scanning curves from Fig. 10b. (b) Linear-scale plot for Krw scanning curves from Fig. 11.
August 2013 SPE Reservoir Evaluation & Engineering 277

data and thus confirm the obtained hysteresis patterns betweendrainage and imbibition. Fig. 16 shows a good match betweensimulated relative permeability curves and the experimental data,which gives confidence in the hysteresis shapes. The figurepresents both linear and semilog plots to emphasize the differenthysteresis trends between RRT 1 and RRT 5 samples.
Conclusions
The following conclusions and observations can be summarizedfrom this research study:• DE CT scanning derives accurate porosity and mineralogy dis-
tributions along sample lengths that can enhance sample selec-tion and improve static rock typing. Longitudinal color-scale
0.00
Rel
ativ
e P
erm
eabi
lity
0.2
0.4
0.6
0.8
(a) Scanning curves (Soi = 0.52 frac.) with Bounding curves (b) Scanning curves (Soi = 0.68 frac.) with Bounding curves
1
0.2 0.4
SS kro Plug 22 (RRT#3) -Soi = 0.79 frac.
Kr-dr-22-Bounding
SS krw Plug 22 (RRT#3) -Soi = 0.79 frac.
SS kro Plug 25 (RRT#3) -Soi = 0.52 frac.
SS krw Plug 25 (RRT#3) -Soi = 0.52 frac.
0.6Brine Saturation (frac.)
0.8 1.0 0.00
Rel
ativ
e P
erm
eabi
lity
0.2
0.4
0.6
0.8
1
0.2 0.4
SS kro Plug 22 (RRT#3) -Soi = 0.79 frac.
Kr-dr-22-Bounding
SS krw Plug 22 (RRT#3) -Soi = 0.79 frac.
SS kro Plug 25 (RRT#3) -Soi = 0.52 frac.
SS krw Plug 25 (RRT#3) -Soi = 0.52 frac.
0.6Brine Saturation (frac.)
0.8 1.0
Fig. 13—(a) Scanning curve at Soi 5 0.52 plotted with drainage and imbibition bounding curves. (b) Scanning curve at Soi 5 0.68plotted with drainage and imbibition bounding curves.
0
5
10
15
20
25
30
35
40
45
50
0
2
4
6
8
10
12
14
0 100 200 300 400 500 600
Differential P
ressure (psi)
Pro
duct
ion
(mL)
Time (h)
Vw (ISSM) Vw endpnts (ISSM) Vw (sim) Δp Δp endpnts Δp (sim)
0
0.1
0.2
0.3
0.4
0.5
0.6
0.7
0.8
0.9
0 0.1 0.2 0.3 0.4 0.5 0.6 0.7 0.8 0.9 1
Wat
er S
atur
atio
n (f
rac.
)
Length along the sample (frac.)
Sw Drn frac. 0.02 Drn frac. 0.05 Drn frac. 0.15
Drn frac. 0.500 Drn frac. 0.850 Drn frac. 0.950 Drn frac. 0.990
Drn frac. 1.000 Drn Bump1 Bump 2 Sim
Flood Direction
Inlet Outlet
1
Fig. 14—PD simulated transient data for Plug 113 from RRT1. Plot to the left shows history match for water production and pres-sure differential. Plot to the right presents the history match of the Sw profiles.
0
50
100
150
200
250
300
350
400
0
2
4
6
8
10
12
Differential P
ressure (psi)
Pro
duct
ion
(mL)
Time (h)
Vw (ISSM) Vw endpnts (ISSM) Vw (sim) Δp Δp endpnts Δp (sim)
0
0.1
0.2
0.3
0.4
0.5
0.6
0.7
0.8
0.9
1
0 50 100 150 200 250 300 350 0 0.1 0.2 0.3 0.4 0.5 0.6 0.7 0.8 0.9 1
Wat
er S
atur
atio
n (f
rac.
)
Length along the sample (frac.)
Drn frac. 0.02 Drn frac. 0.05 Drn frac. 0.15 Drn frac. 0.500Drn frac. 0.850 Drn frac. 0.950 Drn frac. 0.990 SimSeries18 Series19 Sim Series21Series22 Series23
Flood Direction
Inlet Outlet
Fig. 15—PD simulated transient data for Plug 138 from RRT5. Plot to the left shows history match for water production and pres-sure differential. Plot to the right presents the history match of the Sw profiles.
278 August 2013 SPE Reservoir Evaluation & Engineering
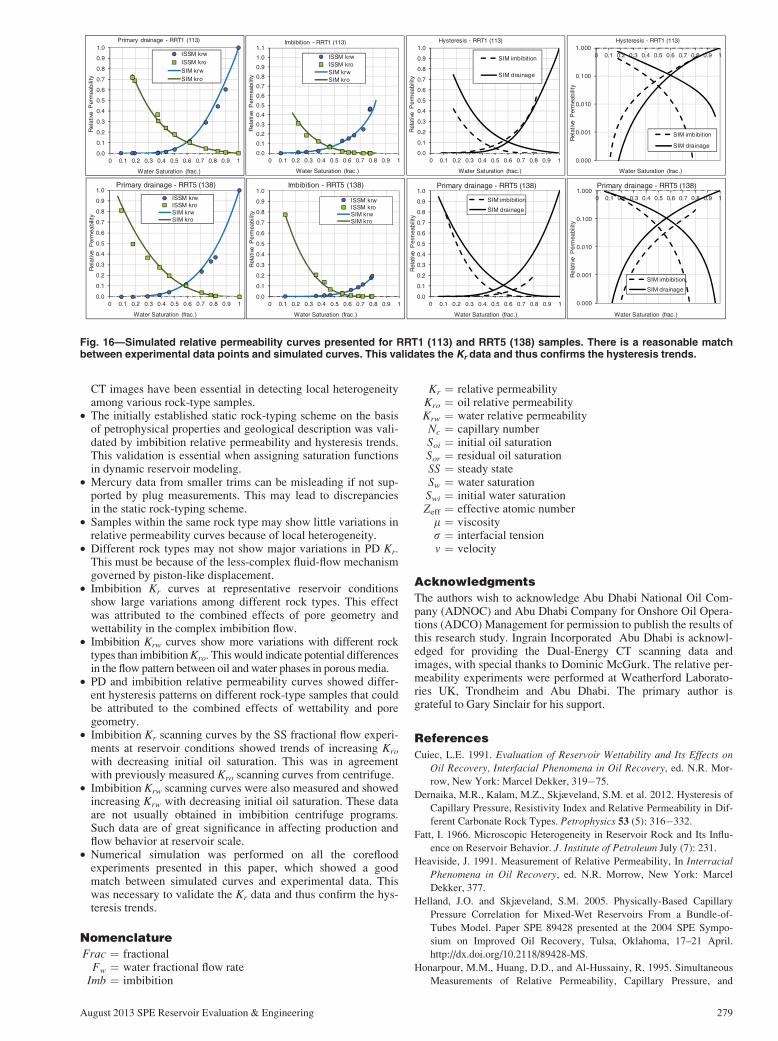
CT images have been essential in detecting local heterogeneityamong various rock-type samples.
• The initially established static rock-typing scheme on the basisof petrophysical properties and geological description was vali-dated by imbibition relative permeability and hysteresis trends.This validation is essential when assigning saturation functionsin dynamic reservoir modeling.
• Mercury data from smaller trims can be misleading if not sup-ported by plug measurements. This may lead to discrepanciesin the static rock-typing scheme.
• Samples within the same rock type may show little variations inrelative permeability curves because of local heterogeneity.
• Different rock types may not show major variations in PD Kr.This must be because of the less-complex fluid-flow mechanismgoverned by piston-like displacement.
• Imbibition Kr curves at representative reservoir conditionsshow large variations among different rock types. This effectwas attributed to the combined effects of pore geometry andwettability in the complex imbibition flow.
• Imbibition Krw curves show more variations with different rocktypes than imbibition Kro. This would indicate potential differencesin the flow pattern between oil and water phases in porous media.
• PD and imbibition relative permeability curves showed differ-ent hysteresis patterns on different rock-type samples that couldbe attributed to the combined effects of wettability and poregeometry.
• Imbibition Kr scanning curves by the SS fractional flow experi-ments at reservoir conditions showed trends of increasing Kro
with decreasing initial oil saturation. This was in agreementwith previously measured Kro scanning curves from centrifuge.
• Imbibition Krw scanning curves were also measured and showedincreasing Krw with decreasing initial oil saturation. These dataare not usually obtained in imbibition centrifuge programs.Such data are of great significance in affecting production andflow behavior at reservoir scale.
• Numerical simulation was performed on all the corefloodexperiments presented in this paper, which showed a goodmatch between simulated curves and experimental data. Thiswas necessary to validate the Kr data and thus confirm the hys-teresis trends.
Nomenclature
Frac ¼ fractionalFw ¼ water fractional flow rate
Imb ¼ imbibition
Kr ¼ relative permeabilityKro ¼ oil relative permeabilityKrw ¼ water relative permeabilityNc ¼ capillary numberSoi ¼ initial oil saturationSor ¼ residual oil saturationSS ¼ steady stateSw ¼ water saturationSwi ¼ initial water saturationZeff ¼ effective atomic number
l ¼ viscosityr ¼ interfacial tensionv ¼ velocity
Acknowledgments
The authors wish to acknowledge Abu Dhabi National Oil Com-pany (ADNOC) and Abu Dhabi Company for Onshore Oil Opera-tions (ADCO) Management for permission to publish the results ofthis research study. Ingrain Incorporated Abu Dhabi is acknowl-edged for providing the Dual-Energy CT scanning data andimages, with special thanks to Dominic McGurk. The relative per-meability experiments were performed at Weatherford Laborato-ries UK, Trondheim and Abu Dhabi. The primary author isgrateful to Gary Sinclair for his support.
References
Cuiec, L.E. 1991. Evaluation of Reservoir Wettability and Its Effects onOil Recovery, Interfacial Phenomena in Oil Recovery, ed. N.R. Mor-
row, New York: Marcel Dekker, 319�75.
Dernaika, M.R., Kalam, M.Z., Skjæveland, S.M. et al. 2012. Hysteresis of
Capillary Pressure, Resistivity Index and Relative Permeability in Dif-
ferent Carbonate Rock Types. Petrophysics 53 (5): 316�332.
Fatt, I. 1966. Microscopic Heterogeneity in Reservoir Rock and Its Influ-
ence on Reservoir Behavior. J. Institute of Petroleum July (7): 231.
Heaviside, J. 1991. Measurement of Relative Permeability, In InterracialPhenomena in Oil Recovery, ed. N.R. Morrow, New York: Marcel
Dekker, 377.
Helland, J.O. and Skjæveland, S.M. 2005. Physically-Based Capillary
Pressure Correlation for Mixed-Wet Reservoirs From a Bundle-of-
Tubes Model. Paper SPE 89428 presented at the 2004 SPE Sympo-
sium on Improved Oil Recovery, Tulsa, Oklahoma, 17–21 April.
http://dx.doi.org/10.2118/89428-MS.
Honarpour, M.M., Huang, D.D., and Al-Hussainy, R. 1995. Simultaneous
Measurements of Relative Permeability, Capillary Pressure, and
0.0
0.1
0.2
0.3
0.4
0.5
0.6
0.7
0.8
0.9
1.0
0 0.1 0.2 0.3 0.4 0.5 0.6 0.7 0.8 0.9 1
Rel
ativ
e P
erm
eabi
lity
Water Saturation (frac.)
Primary drainage - RRT1 (113)
ISSM krwISSM kroSIM krwSIM kro
0.0
0.1
0.2
0.3
0.4
0.5
0.6
0.7
0.8
0.9
1.0
1.1
0 0.1 0.2 0.3 0.4 0.5 0.6 0.7 0.8 0.9 1
Rel
ativ
e P
erm
eabi
lity
Water Saturation (frac.)
Imbibition - RRT1 (113)
ISSM krwISSM kroSIM krwSIM kro
0.0
0.1
0.2
0.3
0.4
0.5
0.6
0.7
0.8
0.9
1.0
0 0.1 0.2 0.3 0.4 0.5 0.6 0.7 0.8 0.9 1
Rel
ativ
e P
erm
eabi
lity
Water Saturation (frac.)
Hysteresis - RRT1 (113)
SIM imbibition
SIM drainage
0.000
0.001
0.010
0.100
1.0000 0.1 0.2 0.3 0.4 0.5 0.6 0.7 0.8 0.9 1
Rel
ativ
e P
erm
eabi
lity
Water Saturation (frac.)
Hysteresis - RRT1 (113)
SIM imbibition
SIM drainage
0.0
0.1
0.2
0.3
0.4
0.5
0.6
0.7
0.8
0.9
1.0
0 0.1 0.2 0.3 0.4 0.5 0.6 0.7 0.8 0.9 1
Rel
ativ
e P
erm
eabi
lity
Water Saturation (frac.)
Primary drainage - RRT5 (138)
ISSM krwISSM kroSIM krwSIM kro
0.0
0.1
0.2
0.3
0.4
0.5
0.6
0.7
0.8
0.9
1.0
0 0.1 0.2 0.3 0.4 0.5 0.6 0.7 0.8 0.9 1
Rel
ativ
e P
erm
eabi
lity
Water Saturation (frac.)
Imbibition - RRT5 (138)
ISSM krwISSM kroSIM krwSIM kro
0.0
0.1
0.2
0.3
0.4
0.5
0.6
0.7
0.8
0.9
1.0
0 0.1 0.2 0.3 0.4 0.5 0.6 0.7 0.8 0.9 1
Rel
ativ
e P
erm
eabi
lity
Water Saturation (frac.)
Primary drainage - RRT5 (138)
SIM imbibition
SIM drainage
0.000
0.001
0.010
0.100
1.0000 0.1 0.2 0.3 0.4 0.5 0.6 0.7 0.8 0.9 1
Rel
ativ
e P
erm
eabi
lity
Water Saturation (frac.)
Primary drainage - RRT5 (138)
SIM imbibition
SIM drainage
Fig. 16—Simulated relative permeability curves presented for RRT1 (113) and RRT5 (138) samples. There is a reasonable matchbetween experimental data points and simulated curves. This validates the Kr data and thus confirms the hysteresis trends.
August 2013 SPE Reservoir Evaluation & Engineering 279

Electrical Resistivity with Microwave System for Saturation Monitor-
ing. Paper SPE 30540 presented at the SPE Annual Technical Confer-
ence and Exhibition, Dallas, Texas, 22�25 October. http://dx.doi.org/
10.2118/30540-MS.
Honarpour, M., Koederitz, L. and Harvey, A.H. 1986. Relative Permeabil-ity of Petroleum Reservoirs, Boca Raton: CRC Press.
Jackson, M.D., Valvatne, P.H., and Blunt, M.J. 2003. Prediction of Wett-
ability Variation and Its Impact on Waterflooding Using Pore-to-Res-
ervoir-Scale Simulation. J. Pet. Sci. and Eng. 39: 231.
Jerauld, G.R. and Salter, S.J. 1990. Effect of Pore-Structure on Hysteresis
in Relative Permeability and Capillary Pressure: Pore-Level Modeling.
Transport in Porous Media 5: 103�151.
Masalmeh, S.K. 2000. High Oil Recoveries From Transition Zones. SPE
paper 87291 presented at the SPE Abu Dhabi International Petroleum
Exhibition and Conference, Abu Dhabi, UAE. 13�15 October. http://
dx.doi.org/10.2118/87291-MS.
Masalmeh, S.K. 2001. Experimental Measurements of Capillary Pressure
and Relative Permeability Hysteresis. Paper SCA 2001-23 presented at
the SCA Conference, Edinburgh, Scotland, September.
Morgan, J.T. and Gordon, D.T. 1969. Influence of Pore Geometry on
Water-Oil Relative Permeability. Paper SPE 2588 presented at the
SPE 44th Annual Meeting, Denver, Colorado, September. http://
dx.doi.org/10.2118/2588-MS.
Morrow, N.R. 1990. Wettability and Its Effect on Oil Recovery. J. Pet
Tech 42 (12): 1476�1484. http://dx.doi.org/10.2118/21621-PA.
Morrow, N.R., Fischer, H., Li, Y. et al. 2008. Fundamentals of Reservoir
Surface Energy As Related to Surface Properties, Wettability, Capil-
lary Action, and Oil Recovery From Fractured Reservoirs by Sponta-
neous Imbibition, Final Technical Report, University of Wyoming,
Laramie, Wyoming, 82071 DOE Award No.: DE-FC26-03NT15408.
Pranter, M.J., Hirstius, C.B., and Budd, D.A. 2005. Scales of Lateral Pet-
rophysical Heterogeneity in Dolomite Lithofacies As Determined
From Outcrop Analogs: Implications for 3D Reservoir Modeling.
AAPG Bull. 89: 645–662.
Torsaeter, O. 1988. A Comparative Study of Wettability Test Methods
Based on Experimental Results From North Sea Reservoir Rocks. Pa-
per SPE 18281 presented at the SPE Annual Technical Conference and
Exhibition, Houston, Texas, 2�5 October. http://dx.doi.org/10.2118/
18281-MS.
Wardlaw, N.C. 1980. The Effects of Pore Structure on Displacement Effi-
ciency in Reservoir Rocks and in Glass Micromodels. Paper SPE 8843 pre-
sented at the First Joint SPE/DOE Symposium on Enhanced Oil Recovery,
Tulsa, Oklahoma, 20�23 April. http://dx.doi.org/10.2118/8843-MS.
Wellington, S.L. and Vinegar, H.J. 1987. X-Ray Computerized Tomogra-
phy. J. Pet Tech 39 (8): 885�898. http://dx.doi.org/10.2118/16983-PA.
Yuan, H.H. 1991. Pore-Scale Heterogeneity From Mercury Porosimetry Data.
SPE Form Eval 6 (2): 233–240. http://dx.doi.org/10.2118/14892-PA.
Moustafa R. Dernaika has been the Manager of Ingrain Incor-porated�Abu Dhabi since 2010. Before he joined Ingrain, heworked for Emirates Link ResLab LLC (Weatherford Laborato-ries) as the Middle East Regional Special Core Analysis (SCAL)Manager in Abu Dhabi. Dernaika holds BS and MS degrees inchemical engineering from the Middle East Technical Univer-sity in Ankara, and is currently continuing his PhD study in pe-troleum reservoir engineering at the University of Stavanger,Norway. His current research areas include digital rockphysics, dual energy CT applications, and the variation of pet-rophysical measurements with rock types and wettability.
Mahmoud A. Basioni has worked as a senior reservoir engineerin ADCO since 2004. He holds an MS degree in petroleum en-gineering from the University Texas at Austin. Basioni is inter-ested in compositional simulation and field-developmentplanning. He participated in several international conferencesand local workshops with projects related to pressure/volume/temperature and compositional gradient, SCAL, andenhanced oil recovery.
Ahmed Dawoud, a mechanical engineer, graduated in 1974from the Faculty of Engineering in Cairo University, Egypt. Hestarted his E&P career with EGPC in Egypt in 1975 as a fieldmaintenance engineer looking after a 180-MMscf/D gasdesulfurization plant (10 tons/D sulfur recovery) as well as thesurface-production network of flowlines and facilities in sixonshore oil fields. Dawoud joined GUPCO�Egypt in 1977 as apetroleum engineer looking after surface and subsurfaceactivities in offshore oil operations. He joined ADCO in 1981 asa petroleum engineer looking after well completion, drilling,and workover operations until 1998 when he moved to workas a reservoir engineer looking after development of newfields and the reservoir management of developed fields. Asone of ADCO’s experienced staff, Dawoud has been focusingon transferring the experience and knowledge he gained toyounger engineers.
Mohammed Zubair Kalam is a discipline expert in special coreanalysis for ADCO, with 27 years of petroleum-industry experi-ence. After completing his BSc and PhD degrees at the Univer-sity of Manchester, UK, and post-doctoral research at theOxford University, he joined BP, where he was involved in novelcore-analysis research involving NMR and magnetic-reso-nance imaging, as well as single-phase- and multiphase-fluidflow. Kalam has been recognized with the SPE 2012 RegionalTechnical Award in Formation Evaluation, and is activelyinvolved in advanced SCAL and CO2 EOR studies and digitalrock physics analyses in carbonates.
Svein M. Skjæveland is a professor of reservoir engineering atthe University of Stavanger. He holds doctorate degrees in en-gineering physics from the Technical University of Norway andin petroleum engineering from Texas A&M University.
280 August 2013 SPE Reservoir Evaluation & Engineering