Embed Size (px)
Citation preview

Variations in Antibiotic Resistance of Aeromonas Observed Across Lubbock Canyon
Lake System
by
Matthew S Smith, B.S.
A Thesis
In
Microbiology
Submitted to the Graduate Faculty
of Texas Tech University in
Partial Fulfillment of
the Requirements for
the Degree of
MASTER OF SCIENCE
Dr. Randall M. Jeter
Chair of Committee
Dr. John C. Zak
Dr. Michael J San Francisco
Mark A. Sheridan
Dean of the Graduate School
December, 2018

Copyright 2018, Matthew S Smith

Texas Tech University, Matthew S Smith, December 2018
ii
ACKNOWLEDGMENTS
I firstly would like to show my deepest gratitude to my advisor Dr. Randall Jeter
for helping me through all of this with his guidance, suggestions, and insightful criticism
of my work and for ultimately taking me in as his student. I would also like to thank
greatly Dr. John Zak for his help in developing my project, helpful insights and
suggestions, and assistance in funding my research, and Dr. Michael San Francisco for
several counts of suggestions and criticism in my work and helping to make it better. I
am also indebted to Jacqueline Miralles-Salazar and the Microbiology stockroom for the
donation and lending of equipment and several chemicals for my research. I would also
like to thank the Texas Tech Department of Biological Sciences for allowing me to work
as a graduate student here and work towards my degree and the city of Lubbock for
allowing me to take samples at parks across town. Lastly, I would like to thank my family
for their patience, support, and encouragement throughout this endeavor.

Texas Tech University, Matthew S Smith, December 2018
iii
Table of Contents
ACKNOWLEDGEMENTS ............................................................................................................. ii
ABSTRACT ..................................................................................................................................... v
LIST OF TABLES .......................................................................................................................... vi
LIST OF FIGURES ....................................................................................................................... vii
LIST OF ABBREVIATIONS ....................................................................................................... viii
CHAPTER I ..................................................................................................................................... 1
INTRODUCTION ........................................................................................................................... 1
Antibiotic Resistance ................................................................................................................... 1
Aeromonas ................................................................................................................................... 3
Lubbock Canyon Lake System and Playa Lakes ......................................................................... 4
Canyon Lakes and Antibiotic Resistance..................................................................................... 6
Justification .................................................................................................................................. 7
Research Objectives ..................................................................................................................... 8
Research Hypotheses ................................................................................................................... 8
CHAPTER II .................................................................................................................................. 12
MATERIALS AND METHODS ................................................................................................... 12
Materials .................................................................................................................................... 12
Media and Chemicals ............................................................................................................. 12
Equipment and supplies ......................................................................................................... 12
Bacterial Strains ..................................................................................................................... 13
Methods ..................................................................................................................................... 13
Collecting Water Samples ...................................................................................................... 13
Preparing Aeromonas Isolation Media ................................................................................... 14
Identification of Aeromonas on agar plates ........................................................................... 14
Inoculating Samples onto Agar Plates ................................................................................... 15
Observing Plates for Growth of Aeromonas .......................................................................... 15
Data Analysis ......................................................................................................................... 16
CHAPTER III ................................................................................................................................ 18
RESULTS ...................................................................................................................................... 18
Identification of Aeromonas on Agar Plates .............................................................................. 18
Observing Plates for Growth of Aeromonas .............................................................................. 19
Spatial Distribution of Antibiotic Resistance............................................................................. 20

Texas Tech University, Matthew S Smith, December 2018
iv
CHAPTER IV ................................................................................................................................ 38
DISCUSSION ................................................................................................................................ 38
Literature Cited .............................................................................................................................. 42

Texas Tech University, Matthew S Smith, December 2018
v
ABSTRACT
Aeromonas is an aquatic organism that can be found ubiquitously all over the
world. While usually a pathogenic bacterium to fish and other aquatic animals, instances
of human infection have been recorded. Although uncommon, Aeromonas’ ability to
acquire new virulence factors, along with the increasing prevalence of antibiotic
resistance, poses it as a possible future concern. This study aims to evaluate the
prevalence of antibiotic resistance among Aeromonas along a connecting lake system.
Total numbers of Aeromonas as well as ampicillin and ciprofloxacin resistance of the
bacterium were evaluated among four connecting canyon lakes in Lubbock, TX. The
percent difference of antibiotic resistance was evaluated for each lake and compared, and
whereas no ciprofloxacin-resistant Aeromonas colonies were observed, the percent
difference in ampicillin resistance traveling down the lake system showed a strong
negative correlation (R= –0.9346) for a Pearson’s Correlation Coefficient. However, this
value fell below the overall critical (α=0.05, cv=0.950, df=2, 2-tailed) and cannot be
considered significant. While the data show an overall increase in rates of ampicillin
antibiotic resistance, decrease in percent difference, additional studies will be needed to
confirm this with a larger sample size and more lakes to observe to see if a significant
correlation really does exist or not.
Texas Tech University, Matthew S Smith, December 2018
vi
LIST OF TABLES
Table 3.1: Aeromonas isolated from canyon lakes, first round of samples ...................... 29
Table 3.2: Aeromonas isolated from canyon lakes, second round of samples ................. 30
Table 3.3: Averages of Aeromonas and ampicillin resistant Aeromonas from lakes ....... 31
Table 3.4: Percent differences between Aeromonas and ampicillin resistant ones. ......... 31
Table 3.5: Ciprofloxacin resistant bacteria from each canyon and playa lake ................. 32
Table 3. 6: One-way ANOVA for total Aeromonas between canyon lakes ..................... 35
Table 3. 7: Tukey’s post-hoc for overall Aeromonas between canyon lakes ................... 36
Table 3. 8: One-way ANOVA between total Aeromonas and ampicillin resistant .......... 37

Texas Tech University, Matthew S Smith, December 2018
vii
LIST OF FIGURES
Figure 1. 1: Location of Canyon lakes and Mountain Fork of the Brazos River. ............. 10
Figure 1. 2: Locations of Lubbock Playa Lakes ............................................................... 11
Figure 2. 1: Display of water sample collection and innoculation onto plates. ................ 17
Figure 3.1: Aeromonas hydrophila after 24 hr of growth on AIM ................................... 22
Figure 3.2: Aeromonas encheleia after 24 hr of growth on AIM ..................................... 23
Figure 3.3: Aeromonas ichthiosmia after 24 hr of growth on AIM .................................. 24
Figure 3.4: Aeromonas media after 24 hr of growth on AIM ........................................... 25
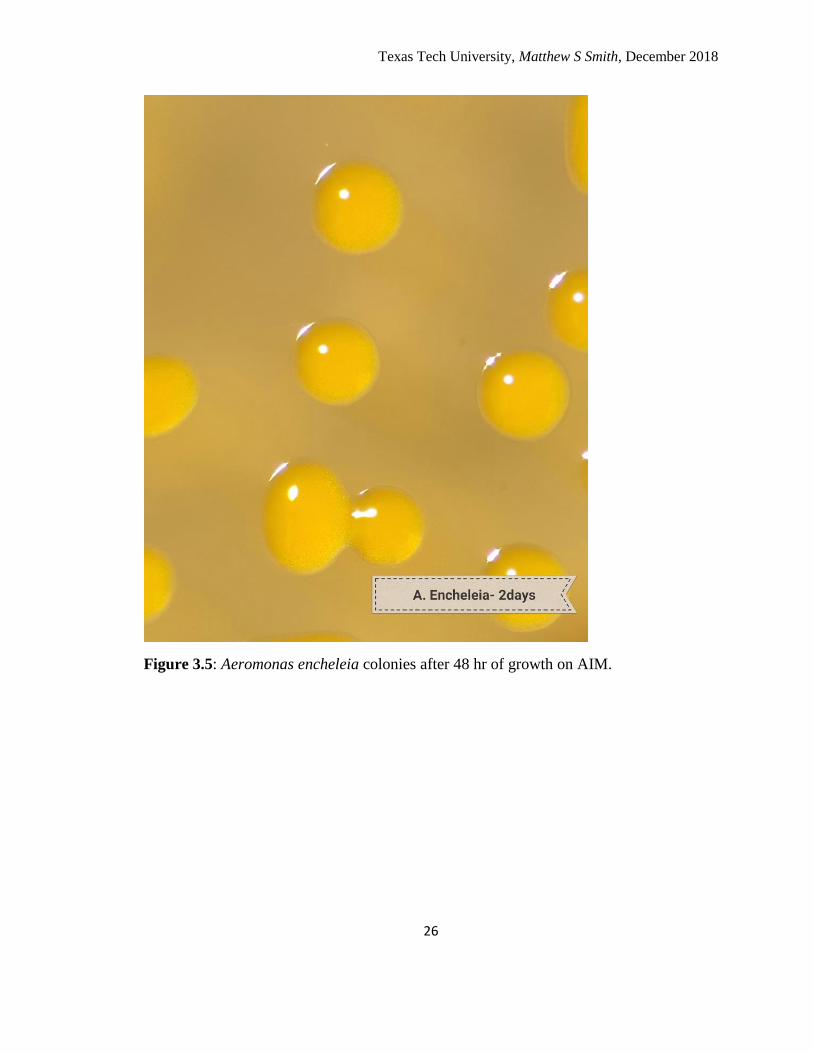
Figure 3.5: Aeromonas encheleia after 48 hr of growth on AIM ..................................... 26
Figure 3.6: Aeromonas hydrophila after 48 hr of growth on AIM ................................... 27
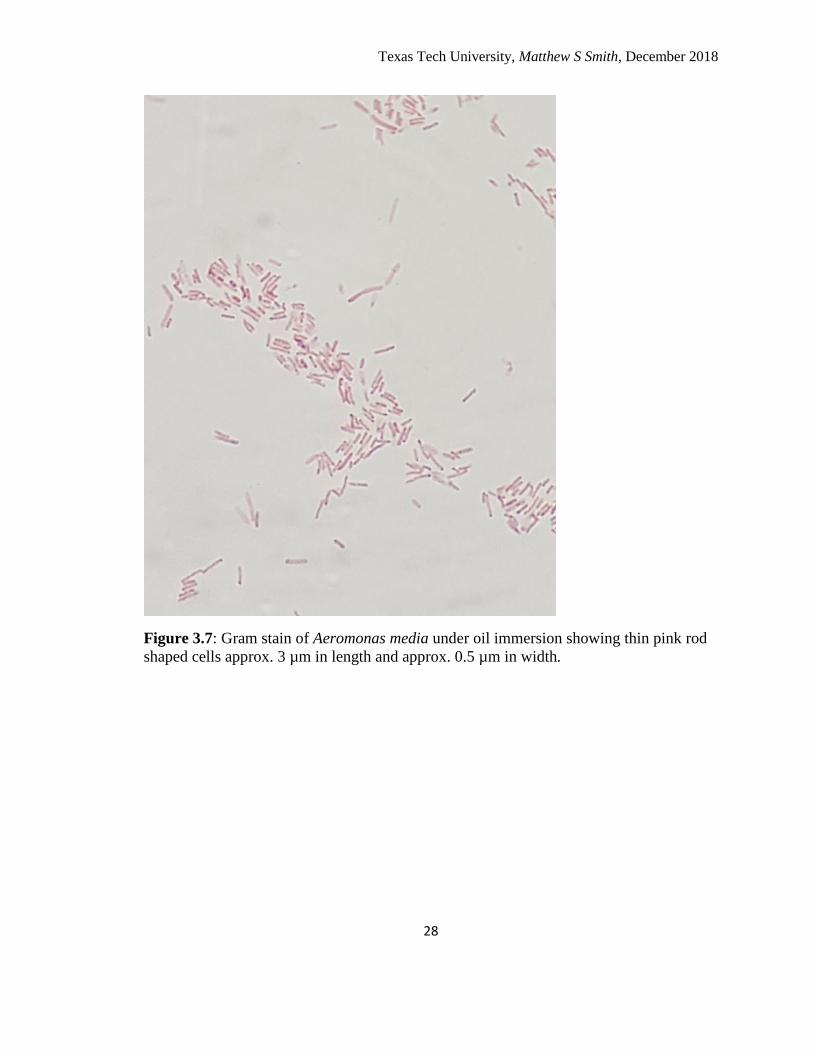
Figure 3.7: Gram stain of Aeromonas media .................................................................... 28
Figure 3.8: Linear regression of percent differences of antibiotic resistance. .................. 32
Figure 3. 9: Third order polynomial graph of antibiotic resistance percent differences ... 33
Figure 3. 10: Scatter plot with percent differences for both samples separate. ................ 34

Texas Tech University, Matthew S Smith, December 2018
viii
LIST OF ABBREVIATIONS
AIM Aeromonas Isolation Media
AMP Ampicillin
ANOVA Analysis of Variance
CFU Colony Forming Units
CIP Ciprofloxacin
CV Critical Value
°C Degrees Celsius
°F Degrees Fahrenheit
df Degrees of Freedom
g Grams
L Liter
µL Microliter
mg Microgram
mL Milliliter
µm Micrometer
NF North Fork
SF South Fork

Texas Tech University, Matthew S Smith, December 2018
ix
TX Texas
TNTC Too Numerous to Count
TSA Tryptic Soy A

Texas Tech University, Matthew S Smith, December 2018
1
CHAPTER I
INTRODUCTION
Antibiotic Resistance
Antibiotics are small organic molecules produced by microorganisms that have
the ability to kill or prevent the growth of bacteria. They were originally discovered by
Sir Alexander Fleming in 1929 (Fleming, 1929) and since then have been the primary
method for combatting bacterial infections in humans. In 2014, over 100 different
antibiotics, and 10 different classes of antibiotics have been discovered and approved for
medical use by the U.S. Food and Drug Administration (Berger, 2014). However, over
time bacteria have become increasingly more resistant to various antibiotics, which has
made it more difficult to treat certain bacterial diseases. Because of this, the Centers for
Disease Control and Prevention has listed antibiotic resistance as one of the world’s most
immediate public health threats (Smolinski et al. 2003). With bacteria becoming resistant
to greater numbers of antibiotics, along with higher resistance to them, the need for
combatting and controlling antibiotic resistance is at an all-time high. Seventy percent of
nosocomial infections are resistant to at least one antimicrobial drug that previously was
effective for the causative pathogen (Carmeli, 2008). Certain bacteria such as
Staphylococcus aureus, Enterococcus spp., Enterobacteriaceae, Pseudomonas
aeruginosa, and Acinetobacter spp., which contain notable virulence factors, have shown
resistance patterns to antibiotics which include the problematic methicillin-resistant S.
aureus, vancomycin-resistant enterococci, and even vancomycin- and methicillin-

Texas Tech University, Matthew S Smith, December 2018
2
resistant S. aureus (Carmeli, 2008). Recently more research and technology have been
focused on discovering new antibiotics as well as new methods to combat bacterial
infections (Clardy et al., 2006). However more research is also being done in order to
better understand and prevent or slow down the process of antibiotic resistance for
current drugs as well as future potential ones.
The occurrence of antibiotic resistance is due to several various factors, but the
main one is the unavoidable process of mutation, natural selection, and evolution
(Woodford and Ellington, 2006). This occurs by bacteria being able to produce molecules
to directly combat an antibiotic, modify the drug’s target site, or even modify their
metabolic pathway to bypass the effects of the drug (Tenover, 2006). Antibiotic
resistance can be found naturally in the environment through contact with wild antibiotic-
producing microorganisms (Ash et al., 2002). However, several human-caused
interactions have been driving forces for increased evolutionary pressures for antibiotic
resistance; the most predominant of these being the inappropriate use of antibiotics and
resulting increase of antibiotics entering the environment (Smolinski et al., 2003).
Antibiotic resistance can also spread in the environment by means of antibiotic-resistant
bacteria passing genes to the environmental flora via plasmids or transposons (Neu,
1992). These environmental florae can then serve as reservoirs for antibiotic-resistance
genes and pass them along to other organisms. Antibiotic-resistant bacteria can also reach
humans through agriculture and animals. Antibiotic agents used in humans are also
frequently used in agriculture and food animals for promoting growth and disease
prevention (Angulo et al., 2004). Antibiotic resistance can develop from these methods

Texas Tech University, Matthew S Smith, December 2018
3
via selective pressures, and these antibiotic-resistance genes can then be transferred to
human microflora (Witte, 1998) or into the environmental flora.
Along with the increased problem of antibiotic resistance, the development of
new antibiotics and antimicrobial drugs has been decreasing. Over a 20-year period
(1998–2002 vs. 1983–1987) approval of new antimicrobial drugs by the U.S. Food and
Drug Administration decreased by 56% (Spellberg et al., 2004). When looking at the
number of newly approved antimicrobial drugs in 5-year intervals from 1983–2007, the
number has steadily decreased, from 16 (1983–1987) to five (2003–2007) (Spellberg et
al., 2008). Luckily, it seems as though more research now is being focused on
development and discovery of new antimicrobial drugs.
Aeromonas
Bacteria the genus Aeromonas, are Gram negative, rod-shaped, non-spore
forming, facultative anaerobes that are ubiquitous and primarily inhabit aquatic
environments. Sharing many similarities to the family Enterobacteriaceae, despite being
oxidase positive, the genus Aeromonas was originally placed in the family Vibrionaceae
before later being placed in the family Aeromonadaceae (Colwell et al., 1986) along with
the genera Tolumonas, Oceanimonas, Oceanisphaera, and Zobellella (Huys, 2014).
There are currently 36 identified species in the genus Aeromonas, which include the
mesophilic, motile (e.g., A. hydrophila, A. veronii, A. caviae) and the psychrophilic, non-
motile (e.g., A. salmonicida) species. Aeromonas is ubiquitous to freshwater aquatic
systems, such as lakes and rivers, and can be found at moderate variations of salinity,
temperature, turbidity, and pH, but not the extremes (Hazen et al., 1978). All Aeromonas,
Texas Tech University, Matthew S Smith, December 2018
4
except for A. trota, were thought to be naturally resistant to ampicillin; however, studies
by Huddleston (2007) showed that around 17% of isolated strains from playa lakes in the
Lubbock, TX region were sensitive.
Aeromonas is known for being an opportunistic pathogen especially in aquatic
animals, including but not limited to fish, amphibians, bivalves, reptiles, etc. (Parker and
Shaw, 2011). Aeromonas is also known to infect humans, causing conditions such as
gastroenteritis, wound infections, and septicemia (Trust and Chipman, 1979; Gracey et
al., 1982). Infections from Aeromonas can occur through contaminated food (Kirov,
1993) as well as water-contaminated wounds from accidents such as fish hook accidents,
animal bites, boating accidents, etc. (Janda and Abbott, 1996). Aeromonas can possess a
variety of virulence factors including aerolysin, hemolysins, proteases, glycero-
phospholipid:cholesterol acyltransferase, lipase, and cytotoxic enterotoxins (Janda and
Abbott, 2010; Chopra et al., 2000). These virulence factors can vary depending on the
individual strain, but all strains involve multiple virulence factors to infect the host (Yu et
al., 2005). Because of its ability to gain and lose virulence factors, while not a big
concern in medicine, the possibilities for it being a larger issue in the future are present as
Aeromonas becomes an increasing threat to human health in the United States (Lederberg
et al., 1992).
Lubbock Canyon Lake System and Playa Lakes
The Brazos River is the 11th longest river in the United States and runs through
central East Texas, North Texas, and Northwest Texas and empties into the Gulf of
Mexico. The Brazos begins in far North West Texas in two parts: The North Fork Double

Texas Tech University, Matthew S Smith, December 2018
5
Mountain Brazos (NF), which runs through Lubbock TX and begins between north
Highway 289 and Highway 84, and the South Fork Double Mountain Brazos (SF), which
runs west of Lake Alan Henry. East of Justiceburg TX, the two forks merge into the
Double Mountain Fork of the Brazos River. The river runs down to northeast of Rule, TX
where it merges with the Salt Fork of the Brazos River and becomes the Brazos River.
From there the river runs southeast and empties into the Gulf of Mexico.
Within the city of Lubbock, a series of lakes has been built along the NF which is
called the “Canyon Lake System” (Stafford, 1981). The Lake System consists of five
lakes which begin at Conquistador Lake, which runs into Llano Estacado Lake (both
located in the Buddy Holly Recreation Area), which then goes into Comancheria Lake,
then Mackenzie Park Lake, and then Dunbar Historical Lake. From there the water of the
NF travels southeast into two large reservoirs: Buffalo Springs Lake and Lake Ransom
Canyon (Figure 1.1). Some of the water that feeds into the Canyon Lake System is from
urban runoff, but the majority is from reclaimed water used in agriculture that, after
percolation into groundwater, is collected by wells and pumped into the head of the
Canyon Lake System (Conquistador Lake) (Smith et al., 1979).
Throughout the city of Lubbock, dozens of small runoff lakes called “playa lakes”
can be found, and over 20,000 of these lakes are present throughout the High Plains of
Texas, New Mexico, Colorado, and Oklahoma (Gustavson, 1994). These playa lakes are
fed purely by rainfall and urban runoff water and the water quality is directly related to
land surrounding the lake (Hall, 1997). These playa lakes are frequently seen in parks and
recreational areas throughout the city of Lubbock (Figure 1.2).

Texas Tech University, Matthew S Smith, December 2018
6
Canyon Lakes and Antibiotic Resistance
Bacteria harboring antibiotic resistance are ubiquitous and able to transfer
antibiotic-resistance genes from cell to cell through plasmids and transposons (Neu,
1992; Alonso et al., 2002). Water systems, such as lakes and rivers, are a major
environment where this phenomenon can occur. Here, bacteria can acquire antibiotic
resistance through human and animal contact and influences (Baquero et al., 2008),
runoff, and effluent (Goni-Urriza et al., 2000). This process can be observed worldwide
(Zhang et al., 2009). This occurs through bacteria already containing antibiotic-resistance
genes being released into the environment and spreading these genes to naturally
occurring microflora that can then serve as reservoirs for these genes (Martinez, 2008)
including those bacteria that are not yet culturable (Riesenfeld et al., 2004). This is a
major issue since water sources such as these can be major sources of consumable water
and recreational activity.
The Lubbock, TX Canyon Lakes System is no exception to this. Horizontal gene
transfer has been observed in Aeromonas isolates from Lubbock, West Texas, and New
Mexico geographical area, with all observed strains acting as donors and 73% as
acceptors by transformation from other aeromonads (Huddleston et al., 2013). Also,
antibiotic-resistant Aeromonas has been isolated from Lubbock playa lakes, which
includes resistance to antibiotics such as co-trimoxazole, tetracycline, and cefuroxime
(Warren et al., 2004; Huddleston et al., 2006). Because all canyon lakes, playa lakes, and
reservoirs in Lubbock, TX and the surrounding area are publicly accessible, it is expected
that introduction of antibiotic-resistance genes to these lakes should be seen, especially in

Texas Tech University, Matthew S Smith, December 2018
7
late spring and late summer when they are used the most and bacterial numbers are
highest (Warren et al., 2004).
Justification
With the increasing issue of antibiotic resistance, research has recently been
focusing more on attempts to find new antibiotics and antimicrobial drugs as well as
better understanding antibiotic resistance and its causes. This study aims to focus on how
antibiotic resistance plays a role in environmental water systems. While there are a good
number of studies focusing on antibiotic resistance in aquatic systems such as lakes and
rivers, little research has been done on entire lake systems such as the Canyon Lakes
System in Lubbock, TX and how antibiotic resistance can differ across the system. The
bacterial genus Aeromonas is a good subject to observe this since it is ubiquitous to
aquatic systems. Because of this, there is the potential that Aeromonas can serve as a
reservoir for antibiotic-resistance genes in aquatic systems. Moreover, Aeromonas can
potentially be used as an indicator species to determine the levels of antibiotic resistance
that are occurring as a consequence of human manipulation.
This study will focus on the spatial trend of antibiotic resistance among the
Lubbock Canyon Lakes system as water moves from its source in Conquistador Lake,
down to Buffalo Springs Lake and Lake Ransom Canyon. All these lakes are publicly
accessible and recreational activities have been observed at all these locations, fishing,
boating, kayaking, etc. As the initial source of the water for the Canyon Lakes is
secondary sewage effluent that has been land-farmed, and as all these lakes are
connected, one of the major questions in this study is whether levels of antibiotic
Texas Tech University, Matthew S Smith, December 2018
8
resistance decrease as the water interacts with the natural microflora. In addition, aquatic
systems such as rivers have been observed to filter out and remove some biochemicals
such as hormones out of the system (Barel-Cohen, 2006). Whether or not antibiotics can
be filtered out of the system is unknown; however it is likely that it would act the same,
and if so there would be less pressure for antibiotic resistance farther down the lake
system. To help place the Canyon Lakes antibiotic resistance dynamics in perspective,
selected playa lakes in Lubbock, TX will also be assessed for antibiotic resistance. Playa
lakes differing in size and amounts of public use will be compared to the results of the
Canyon Lakes System for any similarities or trends.
Research Objectives
1. Observe rates of antibiotic resistance in Aeromonas across the Lubbock, TX
Canyon Lake System from Conquistador Lake, to Mackenzie Park Lake, Dunbar
Historical Lake, and to Ransom Canyon Lake.
2. Observe trends of antibiotic resistance in Aeromonas from the playa lakes in
Maxey Park, Higginbotham Park, and Miller Park in Lubbock, TX.
Research Hypotheses
1. If antibiotic-resistance genes can pass into the environmental microflora because
of human and animal exposure and we observe antibiotic resistance across the
canyon lakes, then we will see the most antibiotic resistance in Aeromonas
bacteria at the end of the lake system, Ransom Canyon, due to the cumulative
effect of human and animal exposure.

Texas Tech University, Matthew S Smith, December 2018
9
2. If antibiotic-resistance genes can pass into the environmental microflora because
of human and animal exposure and we observe antibiotic resistance among the
playa lakes, we should see the highest rate of antibiotic resistance in those lakes
that have the most human contact, Maxey Park Lake and Higginbotham Park
Lake, compared to those that don’t have as much, Miller Park.

Texas Tech University, Matthew S Smith, December 2018
10
Figure 1.1: (A) Locations of the Canyon Lakes along the Double Mountain Fork Brazos
River. (B) Location of Canyon Lakes through Lubbock, TX along the NF of the Double
Mountain Fork Brazos River. Canyon Lakes shown here are: #1- Conquistador Lake, #2-
Llano Estacado Lake, #3- Comancheria Lake, #4- Mackenzie Park Lake, #6- Dunbar
Historical Lake. (Source: VanLandeghem et al., 2012).
Texas Tech University, Matthew S Smith, December 2018
11
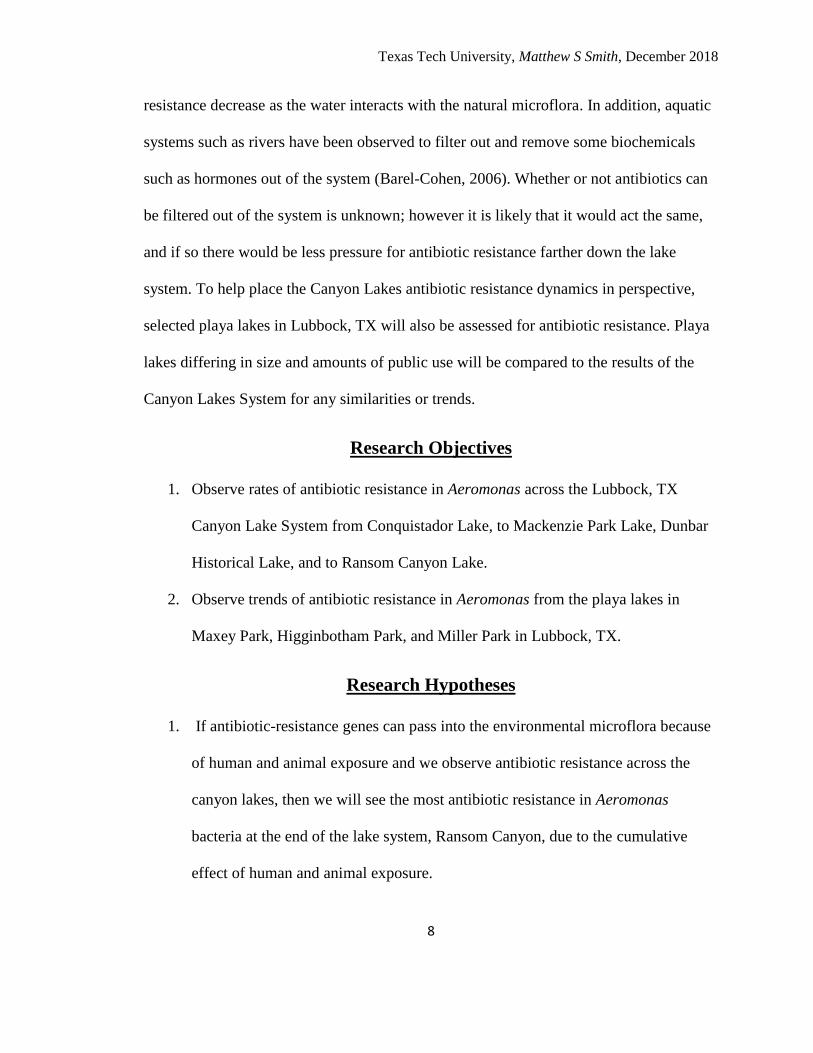
Figure 1.2: Locations of Lubbock Playa Lakes. Lakes used in this study are also noted
and as follows: a- Higginbotham Park Lake, b- Maxey Park Lake, c- Miller Park Lake.

Texas Tech University, Matthew S Smith, December 2018
12
CHAPTER II
MATERIALS AND METHODS
Materials
Media and Chemicals
Specialized Aeromonas isolation media were made based on the recipe from
Huddleson et al. (2007): 1.0 L distilled H2O, 4 g Soluble Starch (Difco, 0178-17), 0.25 g
Ammonium Chloride (Fisher Scientific, A-649, 12125-02-9), 1.0 g Tryptone (BD Bacto,
211705, 2022-03-31), 0.5 g Yeast Extract (Fisher Biotech, BP1422-500, 8013-01-2), 40
mg Bromothymol Blue ( Fisher Scientific, B-388, FL-01,0784), 15 g Agar (Fisher
Scientific, BP1356-500, 987556), 50 mg Sodium Desoxycholate (Difco, 0248-15), 5.0
mL of 0.41% L-Tryptophan (Sigma, T-0254), 5.0 mL of 0.99% L-Phenylalanine (Sigma,
P-2126), 1.0 mL of 10% Ampicillin (Sigma, A-9518), 1.0 mL of 10% Ciprofloxacin
(TCI, C2510, 85721-33-1). Other Chemicals: Ethyl Alcohol 95% (Fisher Science
Education, S73985A, AD-12171-11), NaCl (EM Science, SX0420-3, 7647-14-5). Other
Media: Tryptic Soy Agar (TSA) (Difco, 236950, 3056695).
Equipment and supplies
Sterile 200-mL dilution bottles (Pyrex, Kimax), Sterile 250-ml graduated
cylinders (Pyrex, Kimax), 1-L Pyrex storage bottles, Sterile Petri Dishes 100 mm x 15
mm (Fisherbrand, FB0875713), Bunsen Burner, Metal Spreader, Sterile 1.0-ml
disposable pipettes (Greiner Bio-One, F160534R), Dissecting microscope (Olympus SZ
Stereo), Large orifice pipet tips 1–200 µL (Fisherbrand, 21-197-2B, 20103041),

Texas Tech University, Matthew S Smith, December 2018
13
Micropipette 20–200 µL (Gilson), Autoclave (Steris, SV-120 Scientific Prevacuum
Sterilizer) , Oxidase Test pads (Sigma-Adrich, BCBW3915).
Bacterial Strains
Aeromonas strains for testing and observation were taken from Lubbock isolates
(Huddleston, 2003): A. encheleia 86 M2-1, A. hydrophila 88 C3-1, A. media 98 C2-1, A.
sobria 103 H2-1, A. ichthiosmia 106 YS3-1, A. caviae S3-1, A. veronii 113 MS3-1, A.
enteropelogenes 116 HS3-1.
Test strains from Texas Tech University MBIO 3400 teaching lab: Pseudomonas
stutzeri, Pseudomonas fluorescens, Serratia marcescens, Bacillus subtilis,
Staphylococcus epidermidis.
Methods
Collecting Water Samples
Water samples for analysis of Aeromonas antibiotic resistance were taken from
four of the Lubbock Canyon lakes which included: Conquistador Lake (in the Buddy
Holly Recreation Area), Mackenzie Park Lake, Dunbar Historical Lake, and Lake
Ransom Canyon (Figure 1.1). Samples from three Lubbock playa lakes at public parks
were also taken which differed in size and amounts of recreational activity: Miller Park,
Maxey Park, and Higginbotham Park (Figure 1.2). Three samples of 100 mL of lake
water were taken from each location and at different spots on the lake using sterilized
250-mL glass graduated cylinders. Samples were taken from shore surface water of each
lake and samples were then each placed into individual sterilized 200-mL dilution bottles

Texas Tech University, Matthew S Smith, December 2018
14
and kept on ice. Samples were then stored at 4°C until ready to be used. Another set of
samples were taken 2 weeks later at the same lakes and locations for additional replicates.
Preparing Aeromonas Isolation Media
Culture media used in this study were based on the medium used by Huddleston
et al. (2007) to isolate Aeromonas. One change was made to this medium by decreasing
the amount of sodium desoxycholate from 100 mg to 50 mg in order to prevent stress of
growing Aeromonas. For preparing the Aeromonas media, 1.0 L of distilled water was
mixed with 4 g soluble starch, 0.25 g ammonium chloride, 1.0 g tryptone, 0.5 g yeast
extract, 40 mg bromothymol blue, and 15 g agar. The solution was mixed and autoclaved
using the Liquid 20 cycle (20 min sterilization) at 121°C and 15 psi. After autoclaving
and before pouring, 50 mg of sodium desoxycholate, 5 mL of 0.41% L-tryptophan, and 5
mL of 0.99% L-phenylalanine were added and mixed. Plates contained either ampicillin
(AMP) or ciprofloxacin (CIP) at a concentration of 1 mL of a 100 mg/mL solution of the
antibiotic was also added before pouring. AMP and CIP were chosen because most
Aeromonas strains are known to contain ampicillin resistance and ciprofloxacin is used
for treatment of Aeromonas infections. Medium was poured into sterile 100 mm x 15
mm Petri dishes and allowed to solidify. After the agar had gelled, plates were left at
room temperature for 48 hr to dry and any contaminated plates were discarded.
Identification of Aeromonas on agar plates
Aeromonas isolation media was tested by growing eight different species of
Aeromonas strains isolated from Lubbock (Huddleston, 2003) including: A. encheleia, A.
hydrophila, A. media, A. sobria, A. ichthiosmia, A. caviae, A. veronii, and A.

Texas Tech University, Matthew S Smith, December 2018
15
enteropelogenes. Individual colonies of each species were grown on Aeromonas isolation
media, with and without ampicillin, at 30°C and observed under a dissecting microscope
at one day and two days of growth. Colonies were observed and recorded for their
varying, shape, margin, form, and other characteristics across different species on the
Aeromonas isolation media. Colonies were also stained with bromothymol blue and
observed under oil immersion for cell size, shape, and other morphological characteristics
of Aeromonas.
Inoculating Samples onto Agar Plates
Each water sample was tested for Aeromonas on the three different types of
plates: Aeromonas isolation media (AIM), AIM+AMP, and AIM+CIP. Each water
sample was inoculated onto each type of plate three times, giving nine plates total for
each sample. One-tenth mL of water from the samples was spread onto each AIM and
AIM+AMP plate and 1.0 mL onto each AIM+CIP plate. One mL was used for the
AIM+CIP plates due to preliminary testing of the media which displayed little to no
growth when 0.1 mL was inoculated. Water was spread using a metal spreader rod
sterilized with 95% ethyl alcohol and a flame. Water was left to soak into the medium
and then the plates were incubated upside down at 30°C for 48 hr. Visual representation
of this process is shown in Figure 2.1.
Observing Plates for Growth of Aeromonas
After 48 hr of growth, each plate was observed under a dissecting microscope and
the number of Aeromonas colonies were counted and recorded based on their colony
characteristics. Frequently observed colonies were also chosen at random and tested for

Texas Tech University, Matthew S Smith, December 2018
16
an oxidase-positive phenotype to verify they were not Enterobacteriaceae, tested for a
salt-sensitive phenotype by lack of growth on a TSA plate containing 3% NaCl to verify
they were not Vibrio, and observed in the Gram stain under the oil immersion objective
of a brightfield microscope. Only colonies that were confirmed as Aeromonas were
recorded and those that had an ambiguous identification were excluded.
Data Analysis
Data from all samples and runs were averaged together for each lake, and overall
means were compared. Percent differences between overall averages of total colony
counts and averages for colony counts of each antibiotic resistance were calculated and
compared (Difference of the two values divided by the average of the two values
multiplied by 100). Percent difference was used because neither value, total Aeromonas
or ampicillin resistant Aeromonas, are considered the old or original value. We are only
comparing the difference in the values compared to each other, which is why percent
difference instead of percent change is used. Also, because recorded total Aeromonas and
ampicillin resistant Aeromonas were not from the same colonies (recorded ampicillin
resistant Aeromonas were not evaluated based on those colonies isolated from the total
Aeromonas plates) it would be inappropriate to compare the two by just a percentage of
each other. A Pearson’s Correlation Coefficient was used to access the significance of
any trends seen between the canyon lakes.
A one-way Analysis of Variance (ANOVA) was run to access differences
between total numbers of Aeromonas for each canyon lake as well as the percent
differences between total Aeromonas and antibiotic-resistant Aeromonas between each

Texas Tech University, Matthew S Smith, December 2018
17
lake. Percent differences were converted using square-root transformation. Tukey’s post-
hoc test was also conducted if shown to be statistically significant (p<0.05) in ANOVA.
Figure 2. 1: Display of the process by which samples were taken and inoculated onto the
three different agar plates: AIM, AIM+AMP, AIM+CIP. Three 100-mL samples were
taken from each lake and from each of those samples, water was inoculated onto three
replicates of each type of plate. 0.1 mL were inoculated onto AIM and AIM+AMP plates
and 1.0 mL was inoculated onto AIM+CIP plates.

Texas Tech University, Matthew S Smith, December 2018
18
CHAPTER III
RESULTS
Identification of Aeromonas on Agar Plates
Individual Aeromonas colonies for each species were observed growing after 24
hr on AIM. All colonies were yellow in color, ranging from a pale yellow getting darker
towards the center, to a deep golden yellow (Figure 2.1 and Figure 2.2). Size of colonies
varied between species with A. hydrophila, A. media, and A. ichthiosmia showing larger-
sized colonies, approximately 2 mm in diameter, and with the other five species
producing smaller colonies, less than 1 mm in diameter (Figure 2.1 and Figure 2.2). In
form, all species displayed roundish, but not perfectly round, colonies with a slightly
irregular shape. Most all species showed a convex elevation except for A. hydrophila
showing a more raised elevation. Almost all species showed an entire margin except for
A. ichthiosmia, which displayed an undulate margin (Figure 2.3). One of the most distinct
features shown for all the Aeromonas species was that the insides of the colonies showed
a textured/cloudy structure. This ranged from being subtle to very distinct, although all
species showed this characteristic.
After 48 hr of growth most species looked the same apart from the colonies being
slightly larger in size and darker in color. Some species that had a more textured center
became sparkly around the margins as well (Figure 2.5). Aeromonas hydrophila took on a
darker center with the outer parts of the colony showing a pale-yellow halo, looking a
little bit like a fried egg (Figure 2.6). All species were also Gram stained and examined

Texas Tech University, Matthew S Smith, December 2018
19
under the oil immersion objective with all showing thin pink/red rods of about 0.5 µm in
diameter and 2.5–4 µm in length (Figure 2.7).
Observing Plates for Growth of Aeromonas
After 48 hr of growth all plates were examined under a dissecting microscope for
Aeromonas colonies and colony counts were recorded. Observations were concentrated
on colonies that were yellow, roundish but not perfectly round, and were textured inside
the colony. Colonies that were questionable or appeared frequently were also subjected to
an oxidase test and growth in the presence of 3% NaCl. All tested colonies were oxidase
positive. Only two colonies tested on 3% NaCl grew, which is characteristic of the genus
Vibrio but not Aeromonas, and were not counted in this study.
Aeromonas grown on media with 100 mg sodium desoxycholate grew very
slowly, formed small colonies, and seemed to be under stress; some strains would not
grow at all. Fifty mg desoxycholate-containing media showed much better overall growth
of Aeromonas while still inhibiting the growth of Gram-positive bacteria when tested
with S. epidermidis and B. subtilis.
All values for counted Aeromonas are shown in Table 1 for the first round of
samples and Table 2 for the second round of samples, taken 2 weeks after the first round.
All averages on AIM+AMP were less than those on the control AIM plates except for the
Dunbar Historical Lake second-round samples, which showed the same average between
AIM and AIM+AMP. Averages from each lake for both rounds were also averaged and
are shown in Table 3.3. Overall numbers of Aeromonas per 0.1 mL of water at each lake

Texas Tech University, Matthew S Smith, December 2018
20
varied, with Mackenzie Park Lake showing the most Aeromonas overall at 93.6 cells/0.1
mL and Buddy Holly (Conquistador Lake) the least at 17.7 cells/0.1 mL for the Canyon
Lakes System (Table 3.3). Playa lakes also varied in overall Aeromonas growth with
Maxey Park Playa Lake showing the most at 246.6 cells/0.1 mL and Miller Park Playa
Lake showing the least at 37.6 cells/0.1 mL (Table 3.3). The percent differences between
overall Aeromonas and ampicillin-resistant Aeromonas were also recorded and are shown
in Table 4. For the canyon lakes, Buddy Holly Lake showed the largest percent difference
at 45.5%, which slowly decreased down the canyon lakes, except for Mackenzie Park
Lake which increased slightly to 47.1%, with Ransom Canyon Lake having the smallest
percent difference at 24.3%. Among playa lakes, Miller Park Playa Lake showed the
highest percent difference at 79.9% and Higginbotham Park Playa Lake showed the least
at 17.8%.
No Aeromonas grew on any of the AIM+CIP plates. While mostly fungal colonies
grew on these plates, a few non-Aeromonas bacteria were seen growing and were
recorded and shown in Table 5. Most lakes showed less than one ciprofloxacin-resistant
colony per mL except for Dunbar Historical Lake and Maxey Park Playa Lake, with
Maxey being the highest at approximately 1.8 colonies/mL.
Spatial Distribution of Antibiotic Resistance
Data plots for each canyon lake were put into a scatter plot, and linear regression
was shown with a best fit line for the points (Figure 3.8). Pearson’s Correlation
Coefficient from this plot gave an R value of –0.9346. Our critical value in this situation
is 0.950 (α-0.05, df-2). The R value is less than the Critical value, and therefore the null

Texas Tech University, Matthew S Smith, December 2018
21
hypothesis cannot be rejected. A third-order polynomial graph was shown for percent
difference averages and displayed a sizable decrease between Mackenzie and Dunbar
lakes with not much difference between the others (Figure 3.9). Scatterplot showing both
samples separate is also shown in Figure 3.10 with a best-fit linear trend line and third-
order polynomial for each sample. Percent differences for sample 1 showed near opposite
results from sample 2 and both with poor R2 values of 0.0769 and 0.2083 respectively.
One-way ANOVA for total Aeromonas was run for both rounds of samples, and
both were shown to be statistically significant (p=0.01 & p<0.001) for variance between
lakes (Table 3.6). Tukey’s post-hoc test was run for these data sets to access the location
of the variance (Table 3.7). For the first sample, Buddy Holly (Conquistador Lake) was
not significant between Dunbar and Ransom Canyon but was shown to be significant
between Mackenzie (p=0.08). Additionally, Mackenzie was shown to not be significant
between Dunbar and Ransom Canyon, although close, and Dunbar was not significant
between Ransom Canyon. For sample 2, Mackenzie was shown to be significant between
all three lakes (p<0.001 for all) while all other lakes were shown to be not significant
between each other.

Texas Tech University, Matthew S Smith, December 2018
22
Figure 3.1: Aeromonas hydrophila colonies after 24 hr of growth on AIM.

Texas Tech University, Matthew S Smith, December 2018
23
Figure 3.2: Aeromonas encheleia colonies after 24 hr of growth on AIM.

Texas Tech University, Matthew S Smith, December 2018
24
Figure 3.3: Aeromonas ichthiosmia colonies after 24 hr of growth on AIM.
Texas Tech University, Matthew S Smith, December 2018
25
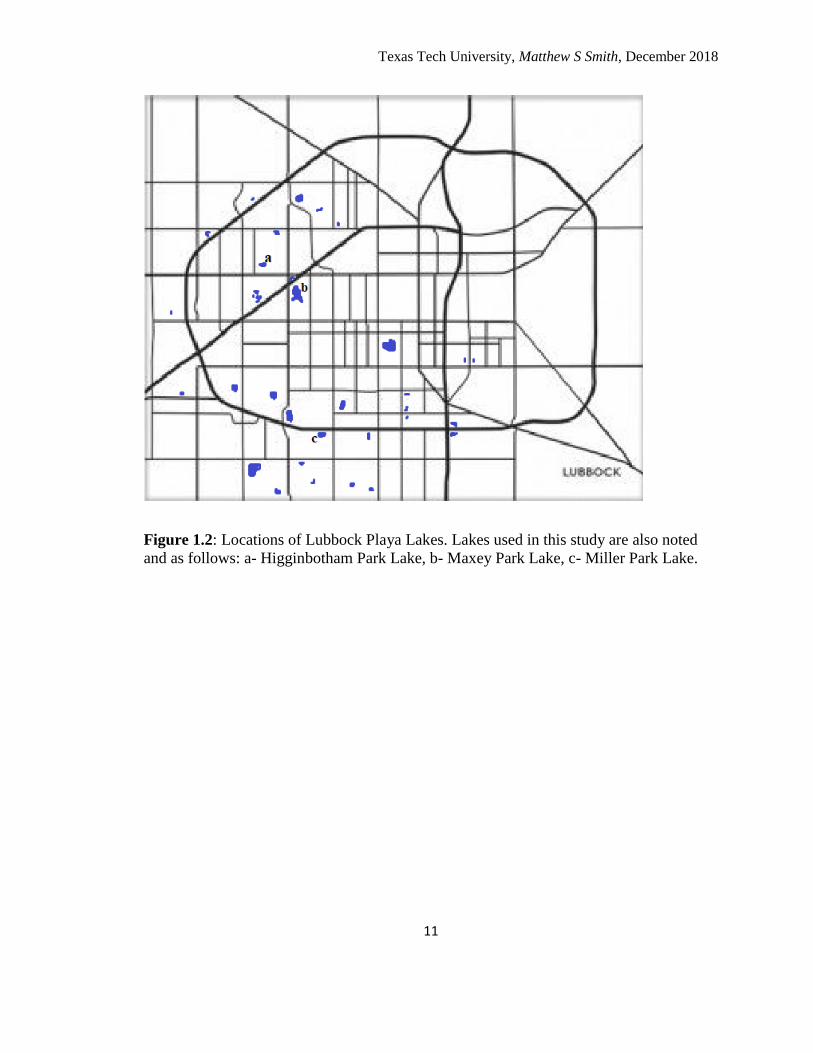
Figure 3.4: Aeromonas media colonies after 24 hr of growth on AIM.
Texas Tech University, Matthew S Smith, December 2018
26
Figure 3.5: Aeromonas encheleia colonies after 48 hr of growth on AIM.

Texas Tech University, Matthew S Smith, December 2018
27
Figure 3.6: Aeromonas hydrophila colonies after 48 hr of growth on AIM.
Texas Tech University, Matthew S Smith, December 2018
28
Figure 3.7: Gram stain of Aeromonas media under oil immersion showing thin pink rod
shaped cells approx. 3 µm in length and approx. 0.5 µm in width.

Texas Tech University, Matthew S Smith, December 2018
29
Table 3.1: Aeromonas colony counts on each plate for the first round of samples
including those for AIM and AIM+AMP. Three replicates were made for each sample
and those values were averaged for each sample. Three samples for each lake were
averaged giving an overall average for the lake, shown in bold. Samples were taken at:
Buddy Holly Park (Conquistador Lake), Mackenzie Park Lake, Dunbar Historical Lake,
Ransom Canyon Lake, Miller Park Playa Lake, Maxey Park Playa Lake, and
Higginbotham Park Playa Lake. Numbers indicate the counted number of Aeromonas
colonies on each plate. TNTC = Too numerous to count.
AIM1 AIM2 AIM3 AVG AMP1 AMP2 AMP3 AVG
BH1 31 17 23 23.7 7 10 14 10.3
BH2 14 21 15 16.7 8 2 6 5.3
BH3 19 29 16 21.3 11 24 9 14.7
20.6 10.1
Mack1 16 19 33 22.7 15 21 17 17.7
Mack2 60 32 47 46.3 18 24 30 24.0
Mack3 147 118 166 143.7 150 120 122 130.7
70.9 57.4
Dunbar1 13 22 13 16.0 11 24 19 18.0
Dunbar2 39 60 26 41.7 9 10 5 8.0
Dunbar3 42 33 55 43.3 23 24 28 25.0
33.7 17.0
Ransom1 33 25 33 30.3 21 16 16 17.7
Ransom2 22 32 51 35.0 28 18 15 20.3
Ransom3 39 TNTC 22 30.5 34 28 26 29.3
31.9 22.4
Miller1 63 49 23 45.0 9 9 11 9.7
Miller2 86 146 56 96.0 23 28 31 27.3
Miller3 45 55 43 47.7 36 24 42 34.0
62.9 23.7
Maxey1 440 400 360 400.0 360 310 320 330.0
Maxey2 270 214 251 245.0 269 224 255 249.3
Maxey3 166 196 146 169.3 58 73 63 64.7
271.4 214.7
Higgin1 84 159 142 128.3 164 127 103 131.3
Higgin2 314 320 321 318.3 300 221 293 271.3
Higgin3 78 87 55 73.3 56 67 63 62.0
173.3 154.9

Texas Tech University, Matthew S Smith, December 2018
30
Table 3.2: Aeromonas colony counts on each plate for the second round of samples, 2
weeks after the first samples were taken, including those for AIM and AIM+AMP. Three
replicates were made for each sample and those values were averaged for each sample.
Three samples for each lake were averaged giving an overall average for the lake, shown
in bold. Samples taken were: Buddy Holly Park (Conquistador Lake), Mackenzie Park
Lake, Dunbar Historical lake, Ransom Canyon Lake, Miller Park Playa Lake, Maxey
Park Playa Lake, and Higginbotham Park Playa Lake. Numbers indicate the counter
number of Aermonas colonies on each plate X = No growth on plate.
AIM1 AIM2 AIM3 AVG AMP1 AMP2 AMP3 AVG
BH1 8 9 13 10.0 9 6 11 8.7
BH2 1 8 7 5.3 3 4 2 3.0
BH3 24 40 23 29.0 19 33 22 24.7
14.8 12.1
Mack1 191 202 184 192.3 88 105 112 101.7
Mack2 97 103 66 88.7 41 44 33 39.3
Mack3 54 56 X 55.0 37 42 23 34.0
112.0 58.3
Dunbar1 97 64 63 74.7 113 93 76 94.0
Dunbar2 21 28 22 23.7 6 11 8 8.3
Dunbar3 14 9 12 11.7 8 9 6 7.7
36.7 36.7
Ransom1 18 15 11 14.7 12 17 13 14.0
Ransom2 33 25 19 25.7 30 24 24 26.0
Ransom3 9 15 17 13.7 8 9 13 10.0
18.0 16.7
Miller1 7 8 4 6.3 6 3 2 3.7
Miller2 14 6 11 10.3 9 10 4 7.7
Miller3 10 17 33 20.0 15 12 16 14.3
12.2 8.6
Maxey1 253 199 88 180.0 98 115 78 97.0
Maxey2 212 X 89 150.5 102 60 82 81.3
Maxey3 415 310 183 302.7 303 159 197 219.7
211.1 132.7
Higgin1 37 30 38 35.0 10 31 17 19.3
Higgin2 80 81 79 80.0 45 55 41 47.0
Higgin3 71 50 43 54.7 46 47 44 45.7
56.6 37.3

Texas Tech University, Matthew S Smith, December 2018
31
Table 3.3: Average number of Aeromonas colonies counted per 0.1 mL on AIM and
AIM+AMP for each canyone lake and playa lake. values are means ± standard error from
each lake for both sample times combined.
Lake Average number of
Aeromonas/0.1 mL
Average number of
ampicillin-resistant
Aeromonas/0.1 mL
Buddy Holly 17.7 ± 9.7 11.1 ± 8.4
Mackenzie 93.6 ± 63.4 57.9 ± 44.7
Dunbar 35.2 ± 24.1 26.8 ± 32.3
Ransom Canyon 24.6 ± 11.0 19.6 ± 7.6
Miller 37.6 ± 36.2 16.1 ± 11.5
Maxey 246.6 ± 107.4 173.7 ± 106.0
Higginbotham 114.9 ± 99.3 96.1 ± 90.1
Table 3.4: Percent difference between average overall Aeromonas colonies and
ampicillin-resistant Aeromonas colonies ( Table 3.3) for each canyon lake and playa lake
tested.
Lake % Difference
Buddy Holly 45.6
Mackenzie 47.1
Dunbar 26.9
Ransom Canyon 24.3
Miller 79.9
Maxey 34.7
Higginbotham 17.8

Texas Tech University, Matthew S Smith, December 2018
32
Table 3.5: Overall number of isolated Ciprofloxacin-resistant bacterial colonies from
each canyon lake and playa lake. Middle column shows total bacterial colonies isolated
from all plates for each lake. Right column shows calculated number of resistant bacteria
for each lake per mL of lake water.
Lake
Total number of bacterial
ciprofloxacin-resistant
colonies
Ciprofloxacin-resistant
bacteria per mL
Buddy Holly 4 0.7
Mackenzie 2 0.3
Dunbar 7 1.2
Ransom Canyon 2 0.3
Miller 4 0.7
Maxey 11 1.8
Higginbotham 0 0
Figure 3.8: Scatter plot for the percent difference values (Table 3.4) of the Canyon Lakes
and a best-fit trend line and R2 Value was added. X-axis for lakes are placed in order
from left to right based on water flow through the canyon lakes from start to end.
Numbers associated with the following lakes: 1-Buddy Holly (Conquistador), 2-
Mackenzie, 3-Dunbar, 4-Ransom Canyon.
R² = 0.8274
0
10
20
30
40
50
60
70
80
90
100
1 2 3 4
PER
CEN
T D
IFFE
REN
CE
CANYON LAKES

Texas Tech University, Matthew S Smith, December 2018
33
Figure 3. 9: Third-order polynomial graph for the percent difference values between total
Aeromonas and antibiotic resistant Aeromonas of the Canyon Lakes (Table 3.4) with best
fit trend line and R2 value added. X-axis for lakes are placed in order from left to right
based on water flow through the canyon lakes from start to end Numbers are associated
with the following lakes: 1-Buddy Holly (Conquistador), 2-Mackenzie, 3-Dunbar, 4-
Ransom Canyon.
R² = 1
0
10
20
30
40
50
60
70
80
90
100
1 2 3 4
PER
CEN
T D
IFFE
RN
ECE
CANYON LAKES

Texas Tech University, Matthew S Smith, December 2018
34
Figure 3.10: Scatter plot showing percent difference values between total Aeromonas and
antibiotic resistant Aeromonas of the Canyon Lakes for both samples separate: Blue-
Sample 1, Orange- Sample 2. Best-fit linear and third-order polynomial trend lines weres
added for each as well as R2 values for both linear trend lines. X-axis for lakes are placed
in order from left to right based on water flow through the canyon lakes from start to end
Numbers are associated with the following lakes: 1-Buddy Holly (Conquistador), 2-
Mackenzie, 3-Dunbar, 4-Ransom Canyon.
R² = 0.0769
R² = 0.2083
-20
0
20
40
60
80
100
1 2 3 4
PER
CEN
T D
IFFE
REN
CE
CANYON LAKES

Texas Tech University, Matthew S Smith, December 2018
35
Table 3.6: One-way ANOVA for both samples, sample 1 and sample 2, of total
Aeromonas between canyon lakes using IBM SPSS 24. Shows values between lake
groups, within lake groups, and total values for the sum of squares, df, mean square, F
value, and Signifigance.
Sum of Squares df Mean Square F Sig.
Total Aeromonas Isolated
from Canyon Lakes, Sample
1
Between Groups 12838.757 3 4279.586 4.474 .010
Within Groups 29653.986 31 956.580
Total 42492.743 34
Total Aeromonas Isolated
from Canyon Lakes, Sample
2
Between Groups 59362.312 3 19787.437 16.518 .000
Within Groups 37136.431 31 1197.949
Total 96498.743 34

Texas Tech University, Matthew S Smith, December 2018
36
Table 3.7: Tukey’s post-hoc test for both samples, sample 1 and sample 2, of total
Aeromonas between canyon lakes using IBM SPSS 24. Shows the mean difference
values, standard error, and significance for each canyon lake compared to the others.
Dependent Variable
(I) Canyon
Lakes
(J) Canyon
Lakes
Mean Difference
(I-J) Std. Error Sig.
95% Confidence
Interval
Lower
Bound
Upper
Bound
Total
Aeromonas
Isolated from
Canyon Lakes,
Sample 1
Tukey
HSD
Buddy
Holly
Mackenzie -50.33333* 14.57990 .008 -89.9042 -10.7624
Dunbar -13.11111 14.57990 .805 -52.6820 26.4598
Ransom_Canyon -11.56944 15.02861 .867 -52.3582 29.2193
Mackenzi
e
Buddy Holly 50.33333* 14.57990 .008 10.7624 89.9042
Dunbar 37.22222 14.57990 .071 -2.3487 76.7931
Ransom_Canyon 38.76389 15.02861 .067 -2.0248 79.5526
Dunbar Buddy Holly 13.11111 14.57990 .805 -26.4598 52.6820
Mackenzie -37.22222 14.57990 .071 -76.7931 2.3487
Ransom_Canyon 1.54167 15.02861 1.00
0
-39.2471 42.3304
Ransom_
Canyon
Buddy Holly 11.56944 15.02861 .867 -29.2193 52.3582
Mackenzie -38.76389 15.02861 .067 -79.5526 2.0248
Dunbar -1.54167 15.02861 1.00
0
-42.3304 39.2471
Total
Aeromonas
Isolated from
Canyon Lakes,
Sample 2
Tukey
HSD
Buddy
Holly
Mackenzie -104.34722* 16.81812 .000 -149.9928 -58.7016
Dunbar -21.88889 16.31597 .544 -66.1716 22.3938
Ransom_Canyon -3.22222 16.31597 .997 -47.5049 41.0605
Mackenzi
e
Buddy Holly 104.34722* 16.81812 .000 58.7016 149.9928
Dunbar 82.45833* 16.81812 .000 36.8127 128.1039
Ransom_Canyon 101.12500* 16.81812 .000 55.4794 146.7706
Dunbar Buddy Holly 21.88889 16.31597 .544 -22.3938 66.1716
Mackenzie -82.45833* 16.81812 .000 -128.1039 -36.8127
Ransom_Canyon 18.66667 16.31597 .666 -25.6161 62.9494
Ransom_
Canyon
Buddy Holly 3.22222 16.31597 .997 -41.0605 47.5049
Mackenzie -101.12500* 16.81812 .000 -146.7706 -55.4794
Dunbar -18.66667 16.31597 .666 -62.9494 25.6161
*. The mean difference is significant at the 0.05 level.

Texas Tech University, Matthew S Smith, December 2018
37
Table 3.8: One-way ANOVA for percent differences between total Aeromonas and
ampicillin resistant Aeromonas in each canyon lake (Square-root transformed) for both
samples, sample 1 and sample 2, and both samples combined using IBM SPSS 24. Shows
values between lake groups, within lake groups, and total values for the sum of squares,
df, mean square, F value, and Signifigance.
Sum of
Squares df Mean Square F Sig.
Percent Differences between
Total Aeromonas and
Ampicillin Resistant
Aeromonas (Sqrt
Transformed)- Sample 1
Between Groups 57.706 3 19.235 2.359 .091
Within Groups 252.759 31 8.154
Total 310.465 34
Percent Differences between
Total Aeromonas and
Ampicillin Resistant
Aeromonas (Sqrt
Transformed)- Sample 2
Between Groups 47.526 3 15.842 2.502 .078
Within Groups 196.302 31 6.332
Total 243.828 34
Percent Differences between
Total Aeromonas and
Ampicillin Resistant
Aeromonas (Sqrt
Transformed)- Samples
Combined
Between Groups 36.271 3 12.090 1.512 .219
Within Groups 527.646 66 7.995
Total 563.918 69

Texas Tech University, Matthew S Smith, December 2018
38
CHAPTER IV
DISCUSSION
Although the overall trend between the Canyon Lakes displays an overall positive
correlation in prevalence of antibiotic resistance among canyon lakes and a decrease in
percent difference upon moving down the lake system, this cannot be confirmed
statistically. While the correlation for the overall averages was strong, because the R
value was less than that of the Critical value, the data could have been due to chance and
the R value does not reach the threshhold of statistical significance (Hunt, 1986).
Therefore, we cannot accept the proposed hypothesis 1 and instead must accept the null
hypothesis.
One thing that was frequently observed in this study was the high degree of
variation in both total Aeromonas counts and percent difference with ampicillin-resistant
Aeromonas. This phenomenon is not unknown and has been observed frequently over the
decades (Van Donsel, 1967, Warren, 2004). As can be seen in Table 3.3, some of the
lakes such as Mackenzie, Dunbar, and Maxey have huge standard deviations for each,
some almost as large as the mean itself. Also shown in Figure 3.10 where the percent
differences are separated for each sample run, we see surprisingly almost opposite results.
Correlation values of the best-fit line for each week’s results were poor for both, which is
an opposing trend to what we see in the overall averages. With both rounds of samples
being taken 2 weeks apart, it raises the question if other factors may have caused this
high degree of variation in both total cells and rate of antibiotic resistance. This is

Texas Tech University, Matthew S Smith, December 2018
39
especially true for the Mackenzie and Dunbar Canyon Lakes where the most variation is
seen in the way of a large drop in overall Aeromonas going from Mackenzie to Dunbar
along with a large drop in percent difference for combined samples. This high degree of
variation is consistent with previous studies and can be due to several phenomena
including various pH, temperature, hydrological retention time, landscape, and dissolved
organic carbon (Lindstrom et al., 2005, Sommaruga, 2009, Yannarell, 2005, Yannarell,
2004). The variance in these results could be due to these reasons as well as the
observation of large amounts of rain between the two weeks that samples were taken,
which could skew certain factors such as hydrological retention time. More studies would
need to be conducted at each of these lakes to learn more about any differences they
might possess between each other. Because of this high degree of variation for each lake
and possible differences in characteristics, more samples at different time points would
need to be made in order to better understand what is going on as well as to have more
power in the ANOVA by increasing the degrees of freedom (Hoaglin, 1976). Having
samples at multiple points of the lakes with varying conditions could also assist us in
better understanding the true nature for each lake.
Although this study was unable to show a significant trend of antibiotic resistance
among the Canyon Lakes, the possibility is still present due to the fact that an overall
negative correlation was observed with a high R value. Further studies can determine if
there really is no relationship between rates of antibiotic resistance among the Canyon
Lakes, or if there really is one. These studies might include using more samples and runs,
as stated earlier due to our high degree of variance, as well as collecting from more of the

Texas Tech University, Matthew S Smith, December 2018
40
Canyon Lakes, which include Llano Estacado Lake, Comancheria Lake, and Buffalo
Springs Lake. This would allow us to have a larger sample size and increase the overall
precision of the data. Another option would also be metagenomic analysis by 16S rRNA
gene identification (Muyzer, 1993) to more accurately identify Aeromonas. While in this
study much caution and consistency went into identifying Aeromonas colonies on the
agar plates, there is still the possibility of some Aeromonas colonies being missed or
other non-aeromonads being counted. Genetic analysis would allow for even higher
accuracy in the number of Aeromonas counted.
While no Aeromonas grew on any of the AIM+CIP plates, some other bacterial
colonies were seen growing and were recorded. The highest numbers were found in
Maxey Park Playa Lake at an average value of 1.8 colony-forming units (CFU)/mL. The
reason for this could be due to the location of this lake and interaction with its immediate
surroundings, which include a playground, baseball fields, and a hospital. Observations
made when taking samples included seeing many people in the vicinity engaging in a
variety of activities such as fishing, playing, sports, etc. However, comparison with
Higginbotham Park Playa Lake, which was also observed to have a large amount of
recreational activity, puts this into question. Focus then turns to Covenant Children’s
Hospital north of Maxey Park Playa Lake. Because the rate of antibiotic resistance is
shown to be much higher in clinical isolates rather than environmental ones (Aravena-
Roman et al., 2012), it might be possible that more clinical isolates are being passed into
the nearby lake and transferring antibiotic-resistance genes to the environmental flora. A
possible analysis in comparing genetic similarities between antibiotic-resistance genes in

Texas Tech University, Matthew S Smith, December 2018
41
clinical isolates from the hospital to those found in Maxey Park Playa Lake could help
determine if this might be the case. Dunbar Historical Lake also showed a fairly high
number of ciprofloxacin-resistant bacteria compared to the other lakes at 1.2 CFU/mL.
While this lake is also seen to have high amounts of recreational activity, especially
fishing, the reason behind this is unknown.

Texas Tech University, Matthew S Smith, December 2018
42
Literature Cited
Alonso, A., Sanchez, P., & Martinez, J. L. (2002). Environmental Selection of Antibiotic
Resistance Genes. Environmental Microbiology, 3(1), 1-9.
Angulo, F. J., Baker, N. L., Olsen, S. J., Anderson, A., & Barrett, T. J. (2004). Antimicrobial Use
in Agriculture: Controlling the Transfer of Antimicrobial Resistance to Humans.
Seminars in Pediatric Infectious Diseases, 15(2), 78-85.
Aravena-Roman, M., Inglis, T. J. J., Henderson, B., Riley, T. V., & Chang, B. J. (2012).
Antimicrobial Susceptibilities of Aeromonas Strains Isolated from Clinical and
Environmental Sources to 26 Antimicrobial Agents. Antimicrobial Agents and
Chemotherapy, 56(2), 1110-1112.
Ash, R. J., Mauck, B., & Morgan, M. (2002). Antibiotic Resistance of Gram-Negative Bacteria
in Rivers, United States. Emerging Infectious Diseases, 8(7), 713-716.
Barel-Cohen, K., Shore, L. S., Shemesh, M., Wenzel, A., Mueller, J., & Kronfeld-Schor, N.
(2006). Monitoring of Natural and Synthetic hormones in a polluted river. Journal of
Environmental Management, 78(1), 16-23.
Baquero, F., Martinez, J. L., & Canton, R. (2008). Antibiotics and Antibiotic Resistance in Water
Environments. Current Opinion in Biotechnology, 19(3), 260-265.
Berger, S. (2014). GIDEON Guide to Antimicrobial Agents (2014 Edition). GIDEON
Informatics, INC, 2014.
Carmeli, Y. (2008). Strategies for Managing todays infections. Clinical Microbiology and
Infection, 14(3), 22-32.
Chopera, A. K., Xu, X., Ribardo, D., Gonzalez, M., Kuhl, K., Peterson, J. W., & Houston, C. W.
(2000). The Cytotoxic Enterotoxin of Aeromonas hydrophila Induces Proinflammatory
Cytokines Production and Activates Arachidonic Acid Metabolism in Macrophages.
Infection and Immunity, 68(5), 2808-2818.
Clardy J., Fischbach M. A., & Walsh, C. T. (2006). New Antibiotics from Bacterial Natural
Products. Nature Biotechnology, 24, 1541-1550.
Colwell, R. R., MacDonell, M. R., & De Ley, J. (1986). Proposal to Recognize the Family
Aeromonadaceae fam. nov. International Journal of Systematic Bacteriology, 36, 473-
477.
Fleming, A. (1929). On the Antibacterial Action of Cultures of a Penicillium, with Special
Reference to their Use in the Isolation of B. influenzae. The British Journal of
Experimental Pathology, 10(3), 226-236.
Goni-Urriza, M., Capdepuy, M., Arpin C., Raymond, N., Caumette, P., & Quentin, C. (2000).
Impact of an Urban Effluent on Antibiotic Resistance of Riverine Enterobacteriaceae
and Aeromonas spp. Applied and Environmental Microbiology, 66(1), 125-132.

Texas Tech University, Matthew S Smith, December 2018
43
Gracey, M., Burke, V., & Robinson, J. (1982). Aeromonas-Associated Gastroenteritis. The
Lancet, 320(8311), 1304-1306.
Gustavson, T. C. (1994). Development of Playa Basins, Southern High Plains Texas and New
Mexico, p. 5-14. In L. V. Urban and A. W. Wyatt (ed.), Proceedings of the Playa Basin
Symposium. Water Resources Center, Texas Tech University, Lubbock.
Hall, D. L. (1997). Species Diversity of Aquatic Macroinvertibrates in Playa Lakes: Island
Biogeographic and Landscape Influences. Ph.D dissertation. Texas Tech University,
Lubbock.
Hazen, T. C., Fliermans, C. B., Hirsch, R. P., & Esch, G. W. (1978). Prevalence and Distribution
of Aeromonas hydrophila in the United States. Applied and Environmental Microbiology,
36(5), 731-738.
Hoaglin, D. C., & Welsch, R. E. (1976). The Hat Matrix in Regression and ANOVA. The
American Statician, 31(1), 17-22.
Huddleston, J. R. (2003). Antibiotic and Metal-Resistant Aeromonas Isolated from
Environmental Sources. Texas Tech University, Lubbock, Texas.
Huddleston, J. R., Zak, J. C., & Jeter, R. M. (2006). Antimicrobial Susceptibilities of Aeromonas
spp. Isolated from Environmental Sources. Applied and Environmental Microbiology,
72(11), 7036-7042.
Huddleston, J. R., Zak, J. C., & Jeter, R. M. (2007). Sampling Bias Created by Ampicillin in
Isolation Media for Aeromonas. Canadian Journal of Microbiology, 53(1), 39-44.
Huddleston, J. R., Brokaw, J. M., Zak, J. C., & Jeter, R. M. (2013). Natural Transformation as a
Mechanism of Horizontal Gene Transfer among Aeromonas Species. Systematic and
Applied Microbiology 36(4), 224-234.
Hunt, R. J. (1986). Percent Agreement, Pearson’s Correlation, and Kappa as Measurers of
Interexaminer Reliability. Journal of Dental Research, 65(2), 128-130.
Huys, G. (2014). The Family Aeromonadaceae. In: Rosenberg E., DeLong E.F., Lory S.,
Stackebrandt E., Thompson F. (eds.) The Prokaryotes. Springer, Berlin, Heidelberg
Janda, J. M., & Abbott S. L. (1996). Human Pathogens, p. 151-173. In B. Austin. M.
Altwegg, P. J. Gosling, and S. Joseph (eds.), The Genus Aeromonas. John Wiley &
Sons, Chichester, England.
Janda, J. M., & Abbott, S. L. (2010). The Genus Aeromonas: Taxonomy, Pathogenicity, and
Infection. Clinical Microbiology Reviews, 23(1), 35-73.
Kirov, S. M. (1993). The Public Health Significance of Aeromonas spp. in Foods. International
Journal of Food Microbiology, 20(4), 179-198.
Lederberg, J., Shope, R. E., & Oaks, S. C. (1992). Emerging Infections: Microbial Threats to
Health in the United States. National Academy Press, Washington, D.C.

Texas Tech University, Matthew S Smith, December 2018
44
Lindstrom, E. S., Kamst-Van Agterveld, M. P., & Zwart, G. Distribution of Typical Freshwater
Bacterial Groups is Associated with pH, Temperature, and Lake Water Retention Time.
Applied and Environmental Microbiology, 71(12), 8201-8206.
Martinez, J. L. (2008). Antibiotics and Antibiotic Resistance Genes in Natural Environments.
Science 321(5887), 365-367.
Muyer, G., de Waal, E. C., & Uitterlinder, A. G. (1993). Profiling of Complex Microbial
Populations by Denaturing Gradient Gel Electrophoresis Analysis of Polymerase Chain
Reaction-Amplified Genes Coding for 16S rDNA. Applied and Environmental
Microbiology, 59(3), 695-700.
Neu, H. C., (1992). The Crisis in Antibiotic Resistance. Science. 257(5073), 1064-1073.
Parker, J. L., & Shaw, J. G. (2011). Aeromonas spp. Clinical Microbiology and Disease. Journal
of Infection, 62(2), 109-118.
Riesenfeld, C. S., Goodman, R. M., & Handelsman, J. (2004). Uncultured Soil Bacteria are a
Reservoir of New Antibiotic Resistance Genes. Environmental Microbiology, 6(9), 981-
989.
Smith, E. D., Sweazy, R. M., Whetstone, G. A., and Ramsey, R. H. (1979). A Study of the Reuse
of Reused Water. Groundwater, 17, 366-374.
Smolinski, M. S., Hamburg, M. A., & Lederberg, J. (2003). Editors, Committee on Emerging
Microbial Threats to Health in the 21st Century. Microbial Threats to Health: Emergence,
Detection, and Response. Washington, D.C.: The National Academies Press.
Sommaruga, R., & Casamayo, E. Q. (2009). Bacterial ‘Cosmopolitanism’ and Importance of
Local Environmental Factors for Community Composition in Remote High-altitude
Lakes. Freshwater Biology, 55(5), 994- 1005.
Spellber, B., Guidos, R., Gilbert, D., Bradley, J., Boucher, H. W., Scheld, W. M., Bartlett, J. G.,
& Edwards, J. Jr. (2008). The Epidemic of Antibiotic-Resistance Infections: A Call to
Action for the Medical Community from the Infectious Diseases Society of America.
Clinical Infectious Diseases, 46(2), 155-164.
Spellberg, B., Powers, J. H., Brass, E. P., Miller, L. G., and Edwards, & J. E. Jr. (2004). Trends
in Antimicrobial Drug Development: Implications for the Future. Clinical Infectious
Diseases, 38(9), 1279-1286.
Stafford, T. (1981). Alluvial Geology and Archaeological Potential of the Texas Southern High
Plains. American Antiquity, 46(3), 548-565.
Tenover, F. C. (2006). Mechanisms of Antimicrobial Resistance in Bacteria. American Journal
of Infection Control, 34(5), S3-10.
Trust, T. J., & Chipman, D. C. (1979). Clinical Involvement of Aeromonas hydrophila.
Canadian Medical Association Journal, 120(8), 942-946.

Texas Tech University, Matthew S Smith, December 2018
45
Van Donsel D. J., Geldreich E. E., & Clarke, N. A. (1967). Seasonal Variations in Survival of
Indicator Bacterial in Soil and their Contribution to Storm-water Pollution. Applied and
Enivronmental Microbiology, 15(6), 1362-1370.
VanLandeghem, M. M., Meyer, M. D., Cox, S. B., Sharma, B., & Patino, R. (2012). Spatial and
Temporal Patterns of Surface Water Quality and Ichthyotoxicity in Urban River Basins in
Texas. Water Research, 46(20), 6638-6651.
Warren, W. J., Jeter, R. M., Kimbrough, R. C., & Zak, J. C. (2004). Population Patterns and
Antimicrobial Resistance of Aeromonas in Urban Playa Lakes. Canadian Journal of
Microbiology, 50(6), 397-404.
Witte, W. (1998). Medical Consequences of Antibiotic Use in Agriculture. Science, 279(5353),
996-997.
Woodford N., & Ellington, M. J. (2006). The Emergence of Antibiotic Resistance by Mutation.
Clinical Microbiology and Infection, 13(1), 5-18.
Yannarell, A. C., & Triplett E. W. (2005). Geographic and Environmental Sources of Variation
in Lake Bacterial Community Composition. Applied and Environmental Microbiology,
71(1), 227-239.
Yannarell, A. C., & Triplett E. W. (2004). Composition of Bacterioplankton Communities:
Investigations Using Multiple Spatial Scales. Applied and Environmental Microbiology,
70(1), 214-223.
Yu, G. B., Zhang, Y. L., Lau, Y. L., Yao, F., Vilches, S., Merino, S., Tomas, J. M., Howard, S.
P., & Leung, K. Y. (2005). Identification and Characterization of Putative Virulence
Genes and Gene Clusters in Aeromonas hydophila PPD134/91. Applied and
Environmental Microbiolgy, 71(8), 4469-4477.
Zhang, X. X., Zhang, T., & Fang, H. H. P. (2009). Antibiotic Resistance Genes in Water
Environments. Applied Microbiolgy and Biotechnology, 82(3), 397-414.


![Clinical and Therapeutic Implications of Aeromonas Bacteremia: … · 2016-12-28 · Aeromonas bacteremia are malignancy and hepatobiliary dis-eases [5]. Aeromonas spp. tend to produce](https://img.pdfslide.us/doc/110x75/5ec79db8c2bd727c0b32cc58/clinical-and-therapeutic-implications-of-aeromonas-bacteremia-2016-12-28-aeromonas.jpg)