Embed Size (px)
Citation preview

Variation in US states’ COVID-19 policy responses
BSG-WP-2020/034
Version 3.0May 2021
BSG Working Paper SeriesProviding access to the latest policy-relevant research
Copyright for all BSG Working Papers remains with the authors.
Laura Hallas, Blavatnik School of Government, University of Oxford
Ariq Hatibie, Department of International Development, University of Oxford
Rachelle Koch, University of Texas Southwestern Medical Center
Saptarshi Majumdar, Blavatnik School of Government, University of Oxford
Monika Pyarali, Baylor College of Medicine
Andrew Wood, Blavatnik School of Government, University of Oxford
Thomas Hale, Blavatnik School of Government, University of Oxford

1
Variation in US states’ COVID-19 policy responses
BSG-WP-2020/034 Version 3.0
7 May 2021
This working paper is updated frequently. Check for most recent version here:
www.bsg.ox.ac.uk/covidtracker
The most up-to-date version of technical documentation will always be found on the project’s
GitHub repo: www.github.com/OxCGRT/covid-policy-tracker
Authors:
Laura Hallas, Research Assistant, Blavatnik School of Government, University of Oxford
Ariq Hatibie, MSc Candidate, Department of International Development, University of Oxford
Rachelle Koch, MD Candidate, University of Texas Southwestern Medical Center
Saptarshi Majumdar, Research Assistant, Blavatnik School of Government, University of Oxford
Monika Pyarali, MD Candidate, Baylor College of Medicine
Andrew Wood, Blavatnik School of Government, University of Oxford
Thomas Hale, Associate Professor, Blavatnik School of Government, University of Oxford
Abstract: The first 100 days of the Biden administration contained several important pandemic
milestones. As the world passed the one-year anniversary of the pandemic, the US simultaneously
experienced the rollout of vaccinations and the rollback of restrictions—even as hints of a fourth
wave began. Using OxCGRT indicators and aggregate indices, we describe ongoing variation in
state responses over time and by region and political leaning, and identify correlates of more or
less intense responses. We find that rollbacks of policy increased in the new year, with fewer states
having active closure and containment policies than at any point since April 2020, and that
Northeastern and Democrat-led states were more likely to experience higher stringency policies.
We also explore a new set of policies around vaccine eligibility, showing that policies of universal
eligibility took hold by early April, though with significant variation in how broadly or narrowly states
made vaccines available on the path to universal availability. Finally, we compare OxCGRT
stringency indices alongside mobility data, showing that stringency coincided with changes in
mobility, though mobility trends gradually shifted towards normal after periods of high policy
stringency, indicating potential policy fatigue. In combination, this paper provides an overview of
US states’ COVID-19 policy action as well as unique applications of OxCGRT data to inform policy
making and research as the US enters a new stage of both pandemic and political leadership.
Recommended citation for this paper: Laura Hallas, Ariq Hatibie, Rachelle Koch, Saptarshi
Majumdar, Monika Pyarali, Andrew Wood, Thomas Hale. “Variation in US states’ responses to
COVID-19 3.0.”
OxCGRT contributors to the USA sub-national dataset:
Andrew Brown, Anthony Sudarmawan, Ariana Detmar, Ariq Hatibie, Ashton Wagner, Barbora
Bacyte, Catherine O'Donnell, Christian Lumley, Dar-Yin Li, Erin Kanzig, Gemma Mortell, Grace Xu,
Hannah Klim, Helene Jow, Hunter McGuire, India Clancy, Jeremy Ng, Jonathan Chan, Jonathan,
David Roberts, Joohee Uhm, Juliet O'Brien, Kaitlyn Green, Katherine McCreery, Kelly Kon, Kevin

2
Parham, Laura de Lisle, Laura Hallas, Michelle Sharma, Mikafui Dzotsi, Monika Pyarali, Nathaniel
Dolton-Thornton, Quynh Lam Vo, Rachel Dixon, Rachelle Koch, Rahima Hanifa, Shelly Lim,
Stephanie Guyett, Swathi Rayasam, Veronique Gauthier

3
Summary
Key findings
● State policy responses to COVID-19 have decreased since the start of 2021 as measured
by Oxford COVID-19 Government Response Tracker indicators, with the most precipitous
drops in policy stringency occurring in March 2021. Fewer states had active closure and
containment policies than at any point since April 2020.
● Regional and political variation in stringency has continued, and even widened, with
Northeastern and Democrat-led states having the most stringent policy responses and
Midwest and Republican-led states having the least.
● New federal action has consisted mostly of renewed recommendations, particularly
around the areas of mask mandates and school reopenings.
● Targeted geographic policies continued to lead where states lifted statewide policies,
though these were often politically contested.
● Mobility data shows that home permanence tended to increase and visits to non-essential
retail tended to decrease when policy stringency was highest, though such effects
seemed to gradually decline after periods of high stringency, possibly indicating policy
fatigue.
Key trends in vaccine policies
● Initial vaccination eligibility policies largely followed CDC guidance, though with
significant variation in the definition of specific priority groups (such as categories of
essential workers)
● After a slow start in December that featured primarily healthcare workers and care home
residents, more than half of US states had policies of universal vaccine eligibility by early
April that allowed all residents aged 16+ to be vaccinated.
● States with early policies of universal eligibility did not always vaccinate fastest. Indeed,
some of the last states to institute policies for universal vaccination eligibility ranked among
the highest in vaccination rates by the end of April.

4
Table of contents
Variation in US state COVID-19 policy responses 1
Version 3.0 1
Summary 3
Key findings 3
Key trends in vaccine policies 3
Table of contents 4
1. Introduction 6
2. Data and measurement 8
3. Policy Indices of the COVID-19 Policy Response 11
4. The US context, a year on 14
Variants racing vaccines 14
New national leadership, decreasing state stringency 17
5. Cases racing vaccines: state variations in reopening and response 20
Political trends 24
6. Variation in individual policy areas - lessened stringency 25
Mask mandates and facial covering policies 26
New national action 26
State easing 26
Ongoing political battles 26
Evolving guidance 27
Growing gatherings and events 28
State easing 28
State rollbacks lead to more local policies 29
Back to work 30
State easing 30
Varied strategies, new outbreak responses 30
Back to school 32
New national action 32
State easing 32
Increased state involvement 33
New mitigation measures 33
7. Variation in vaccination rollout policies 35
Tracking vaccine eligibility 35
5
Federal guidance 36
Trends in state eligibility policies 38
Variation in state eligibility policies 40
Policy details and timeline 40
Eligibility rollouts and reopening 41
8. Mobility 44
9. Conclusion 50

6
1. Introduction
The first months of 2021 saw significant milestones for the US experience of COVID-19. A
new presidential administration was sworn in amid January’s all-time high in cases and deaths,
vaccination levels increased steadily from rocky starts in January and February, and states began
to lift COVID-19 restrictions significantly as the one-year anniversary of the US pandemic came
and went. Critically, large stockpiles of vaccines have enabled widespread vaccination, with US
states shifting from targeted policies prioritizing high-risk populations at the start of 2021 to general
availability by the end of April 2021, an important milestone as the Biden Administration
completed its first 100 days in office. At the same time, the challenge of vaccinating hesitant
segments of the population and the threat of new, more virulent variants have illustrated the
continued importance of closure and containment policies and other mitigation measures, with
public health agencies such as the CDC emphasizing the need for coordination between policy
responses and vaccination to avoid spring spikes in cases and deaths.1 More than a year on from
March 2020’s shutdowns, policymakers and decision makers are once again grappling with how
to respond to this next phase of the COVID-19 pandemic.
This paper focuses on US COVID-19 policy action in the first 100 days of the Biden
administration, from January 20 to April 30, capturing both changes in COVID-19 brought on by
the political movement at the national level as well as the period of policy change coinciding
with two important features of the COVID-19 pandemic history—the downswing of a January
peak in new COVID-19 cases and deaths, and the beginning of widespread COVID-19
vaccination.
OxCGRT data for all 50 US states plus Washington DC is used to analyze ongoing variation
in policy stringency between states and between specific policy areas. We find that despite the
change in administration, policy stringency on the national level has remained low, with federal
policy largely consisting of recommendations to be adopted (or not) by individual states and
sectors. However, despite the high-level similarities in COVID-19 policies pre- and post-
inauguration, the qualitative nature of federal policies did in fact shift, with CDC and White House
guidance displaying more similarities across key policy areas including school and workplace
reopenings, as well as mask-wearing as states adjusted their response on these and similar policy
areas.
While there were signs of increased consistency and coherence on the national level,
state-level policy responses continued to show significant variation in overall stringency and
individual policy responses. Overall, 2021 saw decreases in stringency across closure and
containment indicators, sometimes in high-profile and politically-contested ways. Specific policy
areas including school and workplace reopenings, mask mandates, and gathering restrictions
remained political battlegrounds. Regional and political patterns in state COVID-19 policymaking
continued to exist, with more stringent states more likely to be in the Northeast and Democrat-led.
Finally, policymaking remained highly decentralized, not only between the federal and state
1Borchering RK, Viboud C, Howerton E, et al. Modeling of Future COVID-19 Cases,
Hospitalizations, and Deaths, by Vaccination Rates and Nonpharmaceutical Intervention
Scenarios — United States, April–September 2021. MMWR Morb Mortal Wkly Rep. ePub: 5 May
2021. DOI: http://dx.doi.org/10.15585/mmwr.mm7019e3
external icon

7
levels, but also within states, where geographically targeted, sub-state policies continued to lead,
creating intra-state variation as well as inter-state.
A new feature of the COVID-19 policy response in the US has been the rollout of
vaccination campaigns, which in turn have prompted policies and guidance surrounding who
should get vaccinated, when. Federal guidance was an important starting point in this regard,
but states went beyond federal guidance to make their own decisions on rollout priorities,
especially as it related to identifying categories of essential workers and the use of age-based
prioritization. States reached levels of universal vaccine access policies (most commonly defined
as 16+) at different points, though early policy expansion did not necessarily translate to higher
rates of vaccination. Even so, more than half of states had policies of widespread vaccine
eligibility by early April. All states were ultimately able to meet President Biden’s April 19th deadline
for universal vaccine access for US adults, a significant policy milestone. Even so, lagging vaccine
rates and ongoing logistical concerns have sparked worries about US vaccination campaigns’
ability to achieve herd immunity.
Finally, this paper contextualizes OxCGRT policy data with mobility data relating to home
permanence and visits to non-essential retail, critical markers of policy’s impacts on the ground.
Drawing from Google mobility data in comparison with OxCGRT stringency index, we illustrate that
peaks and troughs in stringency level are mirrored by mobility data, with a steady decline in home
permanence and a steady increase in non-essential retail visits since March. Further research into
such relationships is crucial as the US enters a lighter-touch stage of COVID-19 policies.
This paper is one of an ongoing series documenting COVID-19 policy development in the
US, accompanying the publication of the continuously updated, publicly available OxCGRT
subnational dataset for the US—data we hope will be used by journalists, researchers, and
policymakers. We hope this work will help to inform the difficult questions facing US policymakers
and help to identify useful patterns of policy making amid a fragmented national response.

8
2. Data and measurement
For US states, OxCGRT reports publicly available information on 17 of 21 indicators (see
Table 1) of government response. The indicators are of three types:
● Ordinal: These indicators measure policies on a simple scale of severity or intensity. These
indicators are reported for each day a policy is in place. Many have a further flag to note
if they are “targeted”, applying only to a sub-region of a jurisdiction, or a specific sector;
or “general”, applying throughout that jurisdiction or across the economy. (Note, the flag
for indicator E1 has a different interpretation.)
● Numeric: These indicators measure a specific monetary value in USD. These indicators are
only reported on the day they are announced.
● Text: This is a “free response” indicator that records other information of interest.
Table 1: OxCGRT indicators2
ID Name Type Targeted/General? US states
Containment and closure
C1 School closing Ordinal Geographic ✓
C2 Workplace closing Ordinal Geographic ✓
C3 Cancel public events Ordinal Geographic ✓
C4 Restrictions on gathering size Ordinal Geographic ✓
C5 Close public transport Ordinal Geographic ✓
C6 Stay at home requirements Ordinal Geographic ✓
C7 Restrictions on internal movement Ordinal Geographic ✓
C8 Restrictions on international travel Ordinal No ✓
Economic response
E1 Income support Ordinal Sectoral ✓
E2 Debt/contract relief for households Ordinal No ✓
E3 Fiscal measures Numeric No
2 See Github repository for detailed coding information:
https://github.com/OxCGRT/covidpolicy-tracker/blob/master/documentation/codebook.m

9
ID Name Type Targeted/General? US states
E4 Giving international support Numeric No
Health systems
H1 Public information campaign Ordinal Geographic ✓
H2 Testing policy Ordinal No ✓
H3 Contact tracing Ordinal No ✓
H4 Emergency investment in healthcare Numeric No
H5 Investment in Covid-19 vaccines Numeric No
H6 Facial coverings Numeric No ✓
H7 Vaccination policy Numeric Payment source ✓
H8 Protection of elderly people Numeric Geographic ✓
Miscellaneous
M1 Other responses Text No ✓
Data is collected from publicly available sources such as news articles and government
press releases and briefings. These are identified via internet searches by a team of more than 40
Oxford University students, staff, and collaborators and partners. OxCGRT records the original
source material so that coding can be checked and substantiated, available in the “notes”
version of the data files on GitHub.
OxCGRT measures for US states do not include federal policies that apply to the country
as a whole (e.g., international travel bans, the March 2020 CARES Act). However, the dataset does
include a measure for the US federal government itself, which records only federal level policies.
Data that considers both applicable federal policies as well as state policies are viewable in the
country dataset on GitHub.
In order to ensure accuracy and consistency in the interpretation of the sources, all data
collectors are required to complete a thorough training process. We also hold weekly meetings
to discuss and clarify how to code edge cases, building a shared understanding of the codebook
and its interpretation in light of concrete examples. Every data point is reviewed by a second
coder, who examines the data entry and the original source, and either confirms the coding
choices of the original coder or flags the data entry for escalation. Data may be corrected via
this review process or following external feedback. Substantial revisions are rare.

10
The US subnational data is presented in a US-only subnational dataset as well as part of
the main OxCGRT dataset, both of which are publicly available on GitHub.3 In the US-only dataset,
the data includes measures taken by an individual level of government and by lower levels of
government within that jurisdiction, connotated by the suffix “_WIDE”. This level of coding without
higher-level policies is used by this paper. This US-only data also includes the suffix “_GOV” where
policy responses are tracked for only a single level of government. At present the US-dataset
includes this “_GOV” distinction for federal policy data only. In the main OxCGRT dataset, the
data captures the total set of policies that apply to a given jurisdiction. This is identified by the
suffix “_TOTAL” and includes measures adopted at higher levels of government that may
supersede local policies, for example, a ban on international arrivals adopted by the federal
government that applies to all subnational units.
Data-collection occurs in once-a-week cycles and the database will continue to be
updated and reviewed to provide accurate real-time information on the US subnational
government response. The data is published in real time and made available immediately on
GitHub, via an API and licensed under the Creative Commons Attribution CC BY 4.0 standard.
3 https://github.com/OxCGRT/covid-policy-tracker has data alongside other countries (and includes national US government policies in the calculations), and
https://github.com/OxCGRT/USA-covid-policy has a dataset that records only state-level policy.

11
3. Policy Indices of the COVID-19 Policy
Response
Governments’ responses to COVID-19 exhibit significant nuance and heterogeneity.
Moreover, like any policy intervention, their effects are likely to be highly contingent on local
political and social contexts. These issues create substantial measurement difficulties when
seeking to compare government responses in a systematic way.
Composite measures – which combine different indicators into a general index – inevitably
abstract away from these nuances. This approach brings both strengths and limitations. Helpfully,
cross-jurisdiction measures allow for systematic comparisons across different states. By measuring
a range of indicators, they mitigate the possibility that any one indicator may be over- or mis-
interpreted. However, composite measures also leave out much important information, and make
strong assumptions about what kinds of information counts. If the information left out is
systematically correlated with the outcomes of interest, or systematically under- or overvalued
compared to other indicators, such composite indices may introduce measurement bias.
Broadly, there are three common ways to create a composite index: a simple additive or
multiplicative index that aggregates the indicators, potentially weighting some; Principal
Component Analysis (PCA), which weights individual indicators by how much additional variation
they explain compared to the others; Principal Factor Analysis (PFA), which seeks to measure an
underlying unobservable factor by how much it influences the observable indicators. Each
approach has advantages and disadvantages for different research questions. In this paper we
rely on simple, additive unweighted indices as the baseline measure because this approach is
most transparent and easiest to interpret. PCA, PFA, or other approaches can be used as
robustness checks.
For US states, the indicators described above are aggregated into four policy indices,
each of which measures a different set of government responses (the indicators that make up
each index are listed in Table 2):
1. A containment and health index, showing how many and how forceful the measures to
contain the virus and protect citizen health are (this combines ‘lockdown’ restrictions and
closures with health measures such as testing policy and contact tracing)4
2. An economic support index, showing how much economic support has been made
available (such as income support and debt relief)
3. A stringency index, which records the strictness of ‘lockdown style’ closure and
containment policies that primarily restrict people’s behavior
4. An overall government response index which records how the response of states has
varied over all indicators, capturing the full range of government responses
4 Because the term “lockdown” is used in many different ways, we do not define this term here
but instead refer to the number and restrictiveness of closure and containment policies.

12
Table 2: OxCGRT indices
Index name C1 C2 C3 C4 C5 C6 C7 C8 E1 E2 H1 H2 H3 H6 H7 H8
Government
Stringency Index x x x x x x x x x x x x x x x x
Containment and
health Index x x x x x x x x x x x x x x
Stringency Index x x x x x x x x x
Economic Support
Index x x
Each index is composed of a series of individual policy response indicators. For each
indicator, we create a score by deducting half a point from the ordinal value for a targeted flag,
where such a geographic flag exists. We then rescale each of these by their maximum value to
create a score between 0 and 100, with a missing value contributing 0.5 These scores are then
averaged to get the composite indices.6
Importantly, the indices should not be interpreted as a measure of the appropriateness or
effectiveness of a government’s response. They do not provide information on how well policies
are enforced, nor does it capture demographic or cultural characteristics that may affect the
spread of COVID-19. Furthermore, they are not comprehensive measures of policy. They only
reflect the indicators measured by the OxCGRT (see Tables 1 and 2), and thus may miss important
aspects of a government response. The value and purpose of the indices is instead to allow for
efficient and simple cross state comparisons of government interventions. Any analysis of a
specific state should be done on the basis of the underlying policy, not on an index alone. In the
sections that follow, we display principally the Stringency Index, as it correlates most closely with
the kinds of policies considered as ‘lockdown’ measures.
5 We use a conservative assumption to calculate the indices. Where data for one of the component indicators are missing, they contribute “0” to the Index. An alternative assumption
would be to not count missing indicators in the score, essentially assuming they are equal to the
mean of the indicators for which we have data for. Our conservative approach therefore “punishes” states for which less information is available, but also avoids the risk of over-
generalizing from limited information. 6 Full details on the construction of the indices is available on Github: https://github.com/OxCGRT/covid-
policytracker/blob/master/documentation/index_methodology.md

13
Figure 1: Mean index values for 50 states and DC, over time, weighted by share of US population
(source: OxCGRT)

14
4. The US context, a year on
Variants racing vaccines
Throughout the COVID-19 pandemic, the US has stood out for its relatively high rate of cases and
deaths. The overall pattern of US COVID-19 cases can be described in distinct ‘waves’, based on
graphical representations of new recorded cases [Figure 2]. Initial cases in 2020 were focused in
Washington and New York City, quickly spreading throughout the country to primarily affect the
Northeast and South in summer 2020, before shifting to the Midwest and West in early fall in the
second ‘wave’ [Figure 3]. However, the largest peak in new cases and deaths was, by far, during
the late fall and winter holiday season. The pandemic reached its peak in January, with at points
there being more than 200,000 reported cases and more than 5,000 deaths per day, record highs
that were just barely turning the corner by Biden’s inauguration.7 At this point, the US was the
country most affected by COVID-19, with more than 16 million cumulative cases and more than
300,000 total deaths.8 Cases then steadily dropped until March, when new cases began again to
uptick—an early indication that led the new CDC director to comment on a sense of ‘impending
doom’ amid reopening.9 10 11 This has not been the wintertime surge of December and January,
but generally focused within specific states [Figure 3].12 Overall, April saw a discernible increase in
new cases, sparking concerns of a fourth wave even as vaccinations expanded—an uptick that
settled by the end of the month [Figure 2].
7https://graphics.reuters.com/world-coronavirus-tracker-and-maps/countries-and-
territories/united-states/ 8 https://coronavirus.jhu.edu/data/new-cases 9https://www.reuters.com/article/us-health-coronavirus-usa-trends/u-s-covid-19-cases-rise-for-
third-straight-week-hospitalizations-also-up-idUSKBN2BL2KR 10 https://www.nytimes.com/live/2021/04/07/world/covid-vaccine-coronavirus-cases 11https://khn.org/morning-breakout/impending-doom-biden-cdc-director-warn-of-fourth-wave-
if-nation-lets-down-guard/ 12https://www.healthline.com/health-news/here-are-the-states-where-covid-19-is-increasing-
2#block-7560b4e1-bf82-4661-a1f2-4efa99fc9604

15
Figure 2: Daily new confirmed COVID-19 cases over time (source: JHU)

16
Figure 3: Cases per 100,000 for each state as of the first day of each month (source: JHU)

17
Rising cases have often been discussed in relation to the increasing purchase of so-called
‘variants of concern’ in the US (variants of SARS-CoV-2 that differ from the original or ‘wild type’)
such as B.1.1.7 that have gained ground in the US.13 The presence of more transmissible variants
has been posited to have intensified the impact of COVID-19 in most-affected countries, and
while existing vaccines indicate protection from COVID-19’s most severe effects across variants,
they have nonetheless raised questions about how much population-wide protection vaccination
campaigns will be able to achieve should variants continue to evolve and reach increased
variance. In this context, the role of non-pharmaceutical interventions and closure and
containment policies have remained relevant even in the pandemic’s second year. And with US
vaccination programs slowing and global inequities in vaccine access feeding case spread, it has
become clear that herd immunity even in a country with high vaccine distribution is not a given.14
New national leadership, decreasing state stringency
Confronting these epidemiological trends is the US’ diverse and decentralized
governance structure. Policy responses to COVID-19 have remained diffuse into 2021, spread
between the White House, legislature, federal agencies, and state and county departments of
health and legal bodies. From the beginning of the US pandemic response, the majority of policy
action has occurred at the state level, and this has remained true even as the Biden administration
entered office. OxCGRT data comparisons of maximum stringency, average state government
stringency, and federal stringency illustrate this dynamic [Figure 4]. Federal policies displaying
lower stringency than average, population-weighed state policies at almost every time period, a
trend that continued into Biden’s first 100 days in office [Figure 4]. Meanwhile, average weighted
state stringency reached its lowest levels since April 2020.
13 https://www.cdc.gov/coronavirus/2019-ncov/transmission/variant-cases.html 14 https://www.nytimes.com/2021/05/03/health/covid-herd-immunity-vaccine.html

18
Figure 4: Comparison of maximum recorded stringency, average weighted stringency of states,
and stringency of federal government.
This low federal policy stringency does not necessarily indicate policy stagnation. Though
OxCGRT ordinal levels remained largely consistent in the Trump-Biden transition, some policies did
signal increases in OxCGRT ordinal coding scales. For example, Biden’s first 100 days saw the
passage of additional income support, an executive order creating a pandemic testing board,
and required mask-wearing for all federal lands and buildings.15 Even where OxCGRT ordinal
levels remained the same, there were often qualitative differences between policy
communication and intra-category variation in policy that arose in Biden’s first 100 days. While
vaccine rollout remained primarily the domain of states, Biden gave press releases in which he set
(and funded) national vaccine goals and deadlines by which state governments should make all
their citizens eligible for the vaccine. 16 17 Other non-coded policies and executive orders focused
more specifically on infrastructure or departmental changes, such as the creation of the White
House COVID-19 Response Team (to replace past transitional and Trump administration bodies),
and an equity task force in HHS. Still others centered on tweaking and strengthening existing policy
areas, such as implementing additional mask-wearing and testing requirements for international
travelers entering the US. Such issue-specific policies are outlined in-depth in section 6.
15https://www.whitehouse.gov/briefing-room/presidential-actions/2021/01/20/executive-order-protecting-the-federal-workforce-and-requiring-mask-
wearing/#:~:text=Accordingly%2C%20to%20protect%20the%20Federal,Federal%20lands%20shou
ld%20all%20wear 16 https://edition.cnn.com/2021/03/11/politics/joe-biden-one-year-covid-address/index.html 17 https://edition.cnn.com/2021/04/06/politics/coronavirus-vaccine-deadline-biden/index.html

19
But despite national policy changes that nominally strengthened the stringency of some
policies, the story of US COVID-19 policy in the first months of 2021 is primarily one of reopening
and loosening restrictions at the state level. Figure 4 illustrates how both maximum recorded
stringency and average state stringency have markedly decreased over 2021 against backdrops
of both vaccination rollout and the passage of the pandemic’s one-year mark in the US.
The following sections of this paper will expand on these trends by outlining variation in
where and how ‘reopening’ took place [Section 5], trends in the loosened stringency of individual
relevant indicators [Section 6], and how these reopening policies related to vaccination rollouts
and eligibility [Section 7].

20
5. Cases racing vaccines: state variations in
reopening and response
This paper finds continued overall variation between states in the stringency and duration
of the public policy response and a continuation of trends identified in the past versions of this
working paper. As Figure 5 shows, the stringency of states’ policy response has varied substantially
relative to their daily case rate. Particular trends emerge not only in the regional variation in high
(Northeast and West Coast) and low (Midwest and South) stringency. States displayed clear spikes
in winter cases that were sometimes met with increased policy stringency (ex: Pennsylvania,
Virginia), and others with unchanging or even decreasing policy stringency (ex: Alabama,
Georgia). Other states, such as Vermont and Hawaii, maintained relatively high policy stringency
throughout the pandemic’s first year as cases remained relatively low.
In almost all states, however, stringency in 2021 either remained somewhat constant or fell
[Figure 6]. Midwestern and Southern states maintained the lowest stringency levels throughout the
first year of the pandemic, and were generally less likely to have re-entered periods of high
stringency in December and January when other states re-upped their policy responses to COVID-
19. Trends in minimal time spent under high stringency were maintained from December— North
and South Dakota, Utah, Oklahoma, Wisconsin, Alabama, Iowa, and Texas had the least time
spent under >60 stringency, in the same rank order. Such states were more likely to have entered
lower stringency periods in 2021. And while states such as New Mexico and New York experienced
periods of especially high stringency, as time has progressed past the one-year mark, these peaks
in stringency did not translate to having the most days overall at high stringency levels. Rather it
was states such as Vermont, Hawaii, and Washington which have maintained higher stringency
over time.

21
Figure 5. Relationship between daily cases (seven-day running average) and OxCGRT state stringency

22
Figure 6: Chart showing the time periods states spent under different stringency index values,
ordered by length of time spent at stringency index > 60

23
The first weeks of March were particularly active as some state leaders were vocal in their
desire to loosen some of the more publicly visible restrictions of the pandemic such as school
closures and mask mandates.18 Indeed, Texas’ governor went so far as to say that it was time for
the state to open “100%”. 19 These states acted quickly. By the end of April, Southern and
Midwestern states were the most ‘reopened’, with Western states also experiencing large drops in
overall stringency [Figure 7].
Figure 7: Changes in stringency compared by region (simple average)
18https://blogs.bsg.ox.ac.uk/2021/03/30/with-a-fourth-wave-looming-many-us-states-are-
dropping-pandemic-policy-measures/ 19https://www.dallasnews.com/news/politics/2021/03/02/abbott-hints-at-exciting-news-tuesday-
that-could-include-rollback-of-texas-covid-19-restrictions/

24
Political trends
Although cases tapered nation-wide, the gap in cases between Republican-governed
and Democrat-governed states persists, and even widened starting mid-January. Notable states
that may have contributed to this include Arizona, Utah, and South Carolina, Tennessee, and
Oklahoma, all of which began the year with a case growth of at least 100 per 100,000 per day. As
shown in Figure 8 and consistent with trends demonstrated in previous OxCGRT US working papers,
states with Republican governors have had some of the least stringent policies. This also manifests
in their rate of dialing back restrictions. For example, 8 Republican-led states had dialed back
gathering limits completely by April, compared to just 2 Democratic states. Notably, Democrat-
governed states were not spared high case rates, either, as states like Rhode Island, California,
and Connecticut, all three of which are among the most stringent, also experienced heavy
caseloads. Michigan, another Democrat-governed state, even experienced a second wave in
March that is now just subsiding, with 7-day averages rivaling that of the first wave and despite
having made progress in vaccination drives [Figure 5].
Figure 8: Cumulative cases per 100,000 by party of governor over time

25
6. Variation in individual policy areas -
lessened stringency
The OxCGRT collects data on 17 out of 21 different indicators for the US states, some of
which have been featured in US policy discussions as particularly politically salient or as central
features to states 2021 reopening policies. Figure 9 illustrates the policy indicators that experienced
the most change in 2021, with policy stringency level decreasing the most in containment and
closure policies and select health system policies. Most closure and containment policies were
active in fewer states than at any point since April 2020. Below, we provide further detail on state
policy trends related to mask mandates, restrictions on gatherings and events, and workplace
and school closures and reopenings. The following section provides an overview of the indicator
that first arose in 2021 — vaccine access.
Figure 9: Comparison of share of states with active policies in different categories

26
Mask mandates and facial covering policies
New national action
Following inauguration on January 20, President Biden issued an executive order requiring
federal employees and individuals in federal buildings to wear masks — the first instance where
masks became required at a federal level. Under the same Executive Order, President Biden
mandated the Secretary of Health and Human Services to support efforts to maximize compliance
with mask-wearing. The following day, January 21, President Biden issued an executive order
which required the use of masks while using domestic modes of transportation such as airports
and public transportation. Despite this notable federal action, mandates regarding the use of
facial coverings in the general US population continue to be implemented at the state and local
levels, and have become more localized into 2021.
State easing
On Jan 1, 2021, the most common policy level was a requirement for face coverings in all
public spaces where social distancing is not possible and that policy being in place statewide
[Figure 10]. The Northeast region continued to have widespread face covering requirements, with
all states in at this policy level or stricter. In contrast, only 5 of 12 states in the Midwestern region
remained at this policy level at the start of 2021. The Midwest was also the region to demonstrate
the earliest decrease in policy stringency on January 18, with North Dakota becoming the first
state to allow its statewide executive order requiring face masks to expire followed by Iowa in the
subsequent weeks. From the start of 2021 through April, a total of 12 states have transitioned away
from their previous statewide requirements of face coverings in favor of more localized
requirements or recommendations: North Dakota, Iowa, Montana, Mississippi, Texas, Wyoming,
Arizona, Arkansas, Indiana, Alabama, Kansas and Wisconsin. Notably, 10 out of these 12 states are
led by Republican governors and none of these states are part of the Northeast region, which
continues to maintain more stringent requirements for face coverings.
Ongoing political battles
State-level policymaking around masks have remained a contentious point, reflected in
back and forths about the legality of state-wide policies. In two Democrat- led states where face
covering requirements decreased in early 2021(Kansas and Wisconsin), these changes were due
to governors’ actions to extend statewide mask mandates being overturned. In Kansas, the
Governor’s executive order extending the face covering requirement was revoked by the Kansas
Legislative Coordinating Council, which favored local restrictions instead. Similarly, the Wisconsin
Supreme Court ruled Governor Tony Evers exceeded his authority, and barred from issuing a new
mask mandate once the current policy expired April 5. North Dakota went even further—
attempting to bar state officials from passing future mask mandates. In contrast, a similar
legislative push to end Kentucky’s mask mandate was blocked by a circuit court, allowing the
state mandate to continue through the end of April, when restrictions were eased to allow large
open-air events.
In many states without statewide requirements for facial coverings, stricter policies
continue to exist at the local level—though their implementation remains contentious. In Arizona,
Governor Ducey explicitly mandated that all county and city orders enforcing mask mandates

27
other than in government buildings or public transportation be rescinded. However, some
localities in Arizona continue to enforce their previously issued mask mandates despite these state
orders. For example, the City of Phoenix responded by declaring that their mask mandate will stay
in effect until the City Council votes to end or amend it.20 In Iowa, despite the lifting of the
statewide mask mandate in February, at least 4 major cities were noted to continue enforcing
local mask mandates past the date when this state order was implemented.21 Florida continued
this tension between state and local action in early May, with a state executive order suspending
more stringent local restrictions, including local mask mandates.22
Evolving guidance
The headline event in April mask policies was the April 27 updated CDC guidance allowing
vaccinated individuals to gather with other vaccinated individuals (or one other household)
without a mask. While this influenced some state’s policies (such as Alaska’s and Connecticut’s
statewide adjustment to the guidance), other state and local policies updated mask-wearing
requirements independent of the federal action. Most of these focused around specific settings,
such as Indiana’s March 31 statewide mandate that transitioned from requiring face coverings in
indoor and outdoor settings where social distancing cannot be maintained, to only requiring face
coverings at K-12 educational facilities, inside state facilities, and at testing and vaccinations sites.
At a more local level, the city of Nashville significantly relaxed requirements for face coverings in
a variety of scenarios on April 9, such as outdoors and at workplaces when social distancing can
be maintained. Interestingly, in some states where mask mandates have been rescinded, masks
continue to be required in certain scenarios. For example, many Wisconsin school districts
continue requiring students to use masks in educational settings despite Wisconsin’s state mask
mandate expiring. As vaccinations and reopenings continue, we may expect to see more and
more granularity in mask mandates as states and localities tailor their policies.
20http://web.archive.org/web/20210425194416/https://www.azfamily.com/news/continuing_coverage/coronavirus_coverage/city-of-phoenix-keeps-mask-mandate-in-place-despite-gov-
duceys-order/article_cd2fb89e-9718-11eb-ae15-2fe185f394ac.html 21https://web.archive.org/web/20210208191818if_/https://www.washingtonpost.com/health/2021/02/07/iowa-covid-mask-restrictions/ 22 https://www.flgov.com/wp-content/uploads/orders/2021/EO_21-102.pdf

28
Figure 10: State variation in mask mandates over time, first of each month
Growing gatherings and events
State easing
Prior to 2021, states remained in a somewhat steady pattern of recommending cancelling
public events, or have permitted large venues to hold public events at various specified
percentages of original capacity. Restrictions on private gatherings generally fell within 11-100
people on average, though many states limited gatherings to 10 people or fewer. In both the
case of public event cancellation and gathering restrictions, the majority of counties and cities
aligned with their corresponding statewide policies.
Over the past four months, however, statewide policies relaxed to allow for public events
at various percentages of original occupancy or to remove capacity restrictions entirely [Figure
11]. Despite less stringent statewide policies, the number of counties and cities that maintained
occupancy restrictions on large venues and public events increased concurrently. Population
density (in the case of populous counties) or differing political affiliations of county and city

29
councils from state councils may account for the relative lag in counties and cities removing
restrictions on public events.
Restrictions on private gatherings also decreased since the start of the year. In January, 41
(80.4%) jurisdictions limited gatherings to 100 people or fewer, but by April, that dropped to 31
(60.8%) jurisdictions. Moreover, gatherings limited to 10 people or fewer dropped markedly from
23 states to 8 states over the past four months. From January to April, there was an increase from
8 to 16 states lifting all gathering bans. Similar to the trend seen with public event limitations,
regional restrictions remain more stringent in many states where statewide gathering restrictions
are eased.
There has been a gradual shift from state policies that require cancellation of public event
venues toward policies that recommend cancellation or percentage restrictions on occupancy
in public event venues. The relaxation of public event cancellation policies tends to parallel easing
of private gathering restrictions, though paradoxically, limitation of the number of people at
private gatherings remains under greater policy restriction than the number of people at public
event venues (which are more commonly limited by total occupancy percentages).
State rollbacks lead to more local policies
South Dakota was notably the only state to have no public event or gathering restrictions
as of January 2021, and this has remained the case. Nebraska soon followed suit at the end of
January, and by April, Alabama was the third state to remove all event and gathering restrictions.
Although Florida, Kentucky, and Utah had no statewide restrictions on public gatherings in
January, counties within the states continued to impose restrictions on the capacity of event
venues. By April, Hawaii, Oregon, and Vermont were the only jurisdictions states with statewide
mandates cancelling statewide cancellation of public events.
There was greater flux in private gathering restrictions, with many states tending to
gradually decrease the stringency of measures from 10 or fewer people to 100 or fewer people.
At the start of 2021, eight states had no gathering restrictions: Alabama, Iowa, Nebraska, New
Hampshire, North Dakota, Oklahoma, South Dakota, and Utah. Arkansas and Pennsylvania
removed all gathering restrictions in March, followed by Arizona, Georgia, Kansas, Kentucky, and
Mississippi in April. Eight jurisdictions continue to limit private gatherings to 10 or fewer people: the
District of Columbia, Delaware, Hawaii, Massachusetts, Nevada, Ohio, Oregon, and Washington.

30
Figure 11: State variation in public events and gathering caps over time, first of each month
=
Back to work
State easing
The most common policies from the new year until present were those of recommended
closures or of reopening with significant capacity, sanitation, or social distancing restrictions
[Figure 12]. Overall, states trended towards easing business restrictions, with some states lifting
restrictions altogether. In addition to Nebraska, South Dakota, and West Virginia, which had
already lifted workplace closure policies moved to record no workplace restrictions since last year,
six other states also had moved to having no active policies, the most recent being Indiana on
April 6. Other, less extensive, reductions in workplace restrictions tend to accompany these
movements. North Dakota, for example, rescinded its capacity limitations in January, and Iowa
by February 7 had even removed social distancing guidelines for bars, restaurants, and casinos,
instead encouraging voluntary action by individual businesses.
Varied strategies, new outbreak responses
Among states with more active workplace closure policies, states used a variety of
approaches. Several states also consistently recorded a level of some business closures, although
within this level often only a few sectors are closed. Rhode Island, which had seen the sharpest
spike in the Northeast, kept nightclubs closed but allowed most other businesses to open with
restrictions. Others operated on a tier system with geographically-targeted policies, wherein
businesses in certain areas might have to close depending on case rate. For example, counties
designated “Yellow” in New Mexico, must close bars and clubs.

31
Only New York and Washington, DC ever experienced the most stringent value of requiring
closure of all-but-essential businesses during this period. Even in New York, the policy was always
targeted rather than general in their geographic scope, affecting “Red Zone” counties at highest
risk of reopening. DC moved directly from policy of closing all but essential businesses to only
limited restrictions on January 22, relaxing stringent business restrictions enacted during the holiday
season.
Increasingly, states have also enacted temporary curfews on businesses to control
episodic outbreaks, a policy common elsewhere in the world, but until 2021 limited in the US. For
example, Maine enforced a 9PM curfew from November to February on sectors such as outdoor
amusement venues, restaurants, and casinos, until the case rate declined.
Figure 12: State variation in workplace closure policies over time on the first of each month

32
Back to school
New national action
School closures have been an active policy area since the start of the COVID-19
pandemic, where sweeping closures resulted in consistently high stringency in responses across all
states. School reopenings, in contrast, have been much more fragmented since August 2020 —
both between states, as well as in differences between federal and state guidance. Where the
Trump administration’s school guidance was marked by strong encouragement for in-person
teaching and sometimes contradictory guidance from different federal agencies, the Biden
administration’s policies consolidated guidance, with executive orders supporting school
reopenings and mandating that federal agencies provide evidence-based guidance on
potential in-person learning and mitigation measures. The CDC released a new resource for school
policy—the Operational Strategy for K-12 Schools through Phased Mitigation to guide reopenings,
with other updated CDC guidance focusing on ventilation and social distancing, including a
March 19 shift recommendation of six feet of physical distancing to that of at least 3 feet (where
mask use is universal). The Biden administration also bolstered mitigation measures by directing
$10 billion in funding to be used towards expanding COVID screening at schools.23
State easing
School reopening policies continued to follow typical school year patterns, with
geographically- targeted school closures at some levels to the most common policy level at the
start of 2021 (38 states), and some states dropping in stringency as K-12 and universities began
spring terms in January (7 states easing in January) [Figure 13]. Iowa and Montana were outliers in
this regard, where a public university postponed spring semester and a school district closed a
school to in-person learning, respectively countered a previous period of statewide reopenings.
Other states also experienced individual district delays to in-person class due to post-holiday
community transmission, but by January 19 many had transitioned back to in-person teaching,
either all at once or phased by grade level (elementary, then middle and high schoolers).
Throughout February and March, many schools that had previously operated only through
remote learning transitioned toward in-person instruction—sometimes the first such teaching since
March 2020. For example, after many delays in reopening throughout the fall, Anchorage School
District in Alaska began phasing in K-2 students in January with a full transition to in-person learning
for all students K-12 by March 15. In California, San Francisco School District coordinated with the
teacher’s union to set the goal of returning to in-person learning once the city reached Red Tier if
staff and teachers are able to be vaccinated or Orange Tier if vaccines were not available. In
Illinois, the transition back to in-person learning after a prolonged period of remote learning was
challenging for high school students, as reflected by poor student attendance in high schools
reopening outside Chicago. Conversely, many schools in New Jersey announced plans to
transition from remote back to hybrid learning for the last few weeks of this school year amidst
rising pressure from state officials to reopen in-person teaching.
23https://www.npr.org/sections/coronavirus-live-updates/2021/03/17/978262865/white-house-
announces-10-billion-for-covid-19-testing-in-schools

33
Increased state involvement
Overall, there was more direct state involvement in school reopenings in early 2021, with
many issuing executive orders, emergency proclamations or guidance documents requiring
schools to offer in-person instruction—previously, only a few states such as Florida and Arkansas
had such orders. The earliest order mandating schools to reopen was signed by Governor
Reynolds of Iowa on January 28 for a February 15 start date for full-time in-person learning. Similar
requirements for in-person learning options followed in at least 9 other states: West Virginia, New
Hampshire, North Carolina, Arizona, California, Kentucky, Kansas, Washington and Oregon.
Interestingly, these states represent a fairly even distribution of governor political affiliation and all
major regions of the US. In states that left decision making with districts, 2021 still saw updated
guidance or recommendations that encourage the transition towards in-person learning.
Maryland, Michigan, New Mexico, and Virginia all took this approach over state-imposed
reopening.
Additionally, there has also been a trend towards updating guidance, both at the K-12
and university levels, to allow for greater variations in COVID-19 mitigation methods across schools.
Following the relaxation of mask mandates in some states, this issue has been brought to the
forefront of discussions regarding COVID mitigation in school settings. After Texas’s mask mandate
was lifted in March, the Texas Educational Agency updated its public health guidance to
delegate full authority to school boards in determining policies on mask use. Similarly, schools in
Montana were also allowed this decision, with many universities and school districts electing to
keep masks as a compulsory measure. However, there was at least one instance where a school
district decided to remove the mask requirement - on February 18, Bigforks school district voted to
remove the mask mandate in schools after March 12, giving high-risk educators the option to
continue teaching remotely.
New mitigation measures
States continue a targeted approach to school closures and re-closures, which are largely
driven by clusters of COVID cases within the school or overall high community transmission. While
many schools continue to mitigate the spread of disease with temporary closures, some schools
prioritize maintaining in-person instruction by utilizing alternative methods of mitigation. New York
City provides a very clear example of increasing tolerance for maintaining in-person learning in
the face of active COVID cases in schools: previously, schools that detected two or more COVID
cases were required to close for cleaning. On April 5, Mayor de Blasio replaced this “two case
rule” in favor of increased testing in response to two or three cases and only switching to remote
learning if four or more cases are identified. Other states also demonstrated a strong focus on
maintaining in-person learning despite spikes of COVID cases within K-12 schools. One Minnesota
county’s pause on youth sports and additional precautionary measures in early March in response
to a few confirmed cases of the COVID-19 variant B.1.1.7, but did not recommend school closures.
Universities such as the University of North Carolina expressed similar willingness for in-person
teaching, and others such as UC Davis used incentives such as a $75 “Spring Break Grant” to
discourage travel that brought case spikes back in March 2020.

34
Figure 13: State variation in school closure policies over time

35
7. Variation in vaccination rollout policies
The introduction of widespread vaccination in the US has been a relative high point of the
US pandemic experience. While non-pharmaceutical measures have largely remained in place
and the emergence of new variants threatens complete reliance on vaccination, the US has
nonetheless held the privileged position of high access to vaccines, and has subsequently been
able to vaccinate almost 40% of its adult population, ranking alongside Israel, the United Kingdom,
and Chile as among the highest rates in the world.24 Of these countries, the US is the largest and
has the most decentralized political system, making analysis of the US COVID-19 response
particularly critical to study at the subnational level, both to understand current COVID-19 impacts
domestically, as well as inform other subnational vaccine rollouts.
Tracking vaccine eligibility
OxCGRT data analyzes how states carried out vaccination policy planning by tracking the
types of groups that have been extended eligibility in state policy and recording qualitative data
about the content and context of these policies. Levels of expansion are defined broadly, with
the three primary categories being key workers (such as healthcare workers and teachers),
clinically vulnerable groups (such as individuals identified as high risk for severe COVID-19 due to
underlying conditions), and elderly groups (such as care home residents or defining an age floor
of 60+ or 70 + for vaccination). Policies are considered more stringent as more and more
subgroups of these three categories qualify for vaccination within a jurisdiction. For example, if
healthcare workers, teachers, and individuals aged 75+ were eligible in a vaccine policy,
recording would consider two broad groups having been included — essential workers and
elderly individuals. To be considered an active policy, states must record de jure policies of
prioritization and have evidence of both sufficient supplies to begin rollout and actual shots-in-
arms.
Using these criteria, it is possible to build an overall picture of vaccine eligibility policies and
their progression in US states. Figure 14 shows how vaccine eligibility has varied over time in the US,
from limited group eligibility in early December to a rapid uptick in expansion in mid-March. The
most common policies from January through the beginning of March were that of eligibility within
two groups, most commonly essential workers and elderly individuals, with 39 states falling into this
category by March 1. However, by March 15, the modal value had shifted. By this point, 36 states
had expanded eligibility within the three primary groups of key workers, elderly, and clinically
vulnerable people as well as additional widespread groups to account for substantial portions of
the population. And by the end of April, all states had policies with universal eligibility — with all
individuals able to access vaccines under state prioritizations, though sometimes with varied
capacities to roll out and vaccine supplies.25
24 https://ourworldindata.org/covid-vaccinations 25 Universal expansion is considered where all populations approved under current vaccine
emergency use authorisations are also eligible under state policies. Details can be found in the

36
Figure 14: Variation in vaccine eligibility, first of each month
This broader pattern vaccine policy can be further analyzed by examining OxCGRT
qualitative data in OxCGRT database notes regarding the content and patterns of eligibility
policies.26
Federal guidance
Planning around vaccine administration has been in process since May 2020, when then-
president Trump announced the launch of Operation Warp Speed — a public-private initiative to
accelerate the development, access, and distribution of COVID-19 vaccines. With pre-existing
purchases from the Trump administration and subsequent purchases from the Biden
administration, vaccine rollout began almost immediately as vaccines gained emergency
authorization, with the first distributions beginning December 14 (Pfizer and Moderna in December,
OxCGRT interpretation guide. https://github.com/OxCGRT/covid-policy-
tracker/blob/master/documentation/interpretation_guide.md 26 Notes are included in OxCGRT data downloads, available for the US at:
https://github.com/OxCGRT/covid-policy-tracker/tree/master/data

37
Johnson & Johnson in February).27 Gains (and delays) in production and distribution further
influenced the timing of distribution of vaccines to states based on population makeup.28
While not directly setting specific state guidelines for rollout, CDC guidance provided a
recommended roadmap of prioritization based Advisory Committee on Immunization Practice
guidelines, with three primary levels [Table 3].29 30 31 This guidance offered additional (if somewhat
broad) recommendations for special consideration for state-level decision making: to “reduce
death and disease as much as possible,” “preserve functioning of society,” and reduce additional
COVID-19 burdens on “people already facing disparities.”
Table 3. Summarized CDC recommendations for vaccine eligibility
CDC recommended
policy stage
Recommended eligible groups
Phase 1a ● Residents of long-term care facilities ● Healthcare personnel
Phase 1b ● People aged 75+ ● Frontline essential workers: Fire fighters, police officers, corrections
officers, food and agricultural workers, United States Postal Service workers, manufacturing workers, grocery store workers, public transit workers, and those who work in the educational sector
Phase 1c ● People aged 16-64 with underlying medical conditions which increase the risk of serious, life-threatening complications from COVID-19
● Other essential workers: people who work in transportation and logistics, food service, housing construction and finance, information technology, communications, energy, law, media, public safety, and public health
Federal guidelines and targets addressed the pace of vaccination eligibility as well as the
makeup of recommended groups. President Biden set various targets for vaccination rollout within
his first 100-days in office (Jan 20-April 30). After the starting goal upon entering office of 100 million
vaccines in the first 100 days was reached by day 58, expansions continued to 200 and then 200
million on March 25 — a target reached on April 22 (day 92).32 This coincides with an additional
target set (and met) by the Biden administration in early April, for all adults to be eligible for
vaccination by April 19, a goal that was ultimately met [Figure 16]. On May 4, an additional goal
to improve vaccine uptake was announced, featuring a shifted vaccination strategy aimed
towards vaccinating 70% of adults with at least one dose by July 4.33
27 https://www.hhs.gov/coronavirus/covid-19-vaccines/distribution/index.html 28 https://www.cdc.gov/coronavirus/2019-ncov/vaccines/distributing.html 29 https://www.cdc.gov/coronavirus/2019-ncov/vaccines/recommendations.html 30 https://www.cdc.gov/mmwr/volumes/69/wr/mm6949e1.htm 31https://web.archive.org/web/20210428191929/https://www.cdc.gov/mmwr/volumes/69/wr/m
m695152e2.htm?s_cid=mm695152e2_w 32https://www.whitehouse.gov/briefing-room/speeches-remarks/2021/04/21/remarks-by-president-biden-on-the-covid-19-response-and-the-state-of-vaccinations-2/ 33 https://www.washingtonpost.com/politics/2021/05/04/joe-biden-live-updates/
38
Trends in state eligibility policies
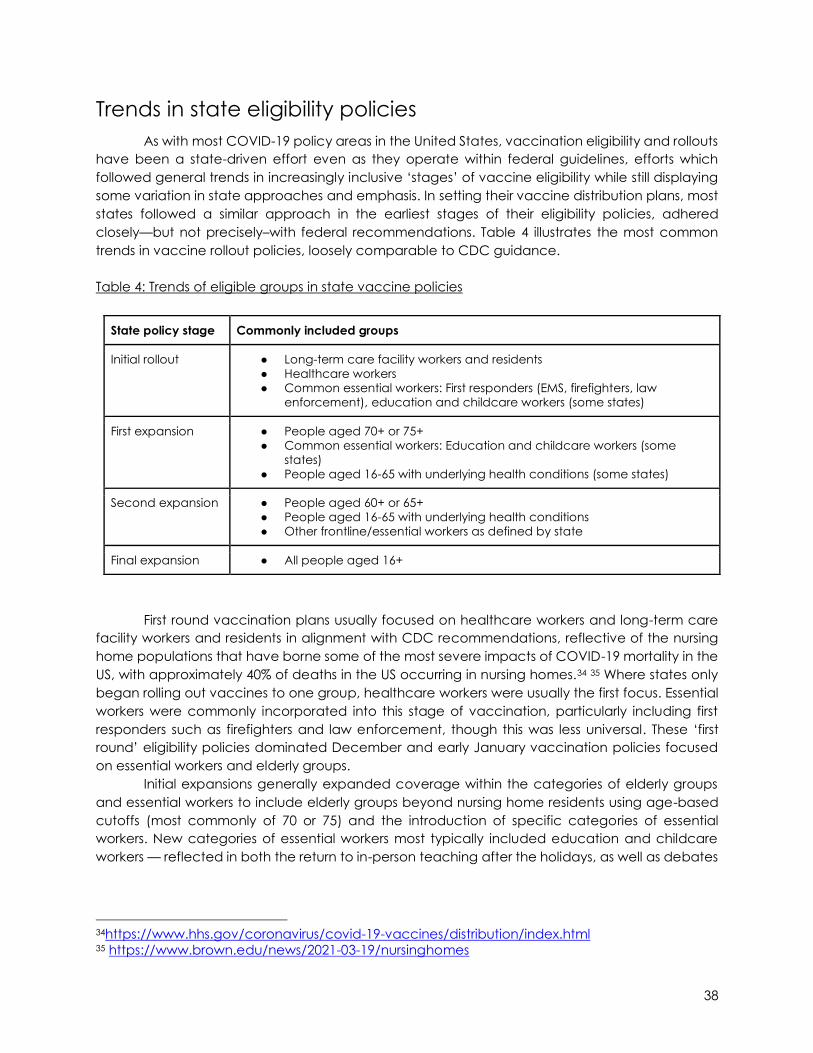
As with most COVID-19 policy areas in the United States, vaccination eligibility and rollouts
have been a state-driven effort even as they operate within federal guidelines, efforts which
followed general trends in increasingly inclusive ‘stages’ of vaccine eligibility while still displaying
some variation in state approaches and emphasis. In setting their vaccine distribution plans, most
states followed a similar approach in the earliest stages of their eligibility policies, adhered
closely—but not precisely–with federal recommendations. Table 4 illustrates the most common
trends in vaccine rollout policies, loosely comparable to CDC guidance.
Table 4: Trends of eligible groups in state vaccine policies
State policy stage Commonly included groups
Initial rollout ● Long-term care facility workers and residents ● Healthcare workers ● Common essential workers: First responders (EMS, firefighters, law
enforcement), education and childcare workers (some states)
First expansion ● People aged 70+ or 75+ ● Common essential workers: Education and childcare workers (some
states) ● People aged 16-65 with underlying health conditions (some states)
Second expansion ● People aged 60+ or 65+ ● People aged 16-65 with underlying health conditions ● Other frontline/essential workers as defined by state
Final expansion ● All people aged 16+
First round vaccination plans usually focused on healthcare workers and long-term care
facility workers and residents in alignment with CDC recommendations, reflective of the nursing
home populations that have borne some of the most severe impacts of COVID-19 mortality in the
US, with approximately 40% of deaths in the US occurring in nursing homes.34 35 Where states only
began rolling out vaccines to one group, healthcare workers were usually the first focus. Essential
workers were commonly incorporated into this stage of vaccination, particularly including first
responders such as firefighters and law enforcement, though this was less universal. These ‘first
round’ eligibility policies dominated December and early January vaccination policies focused
on essential workers and elderly groups.
Initial expansions generally expanded coverage within the categories of elderly groups
and essential workers to include elderly groups beyond nursing home residents using age-based
cutoffs (most commonly of 70 or 75) and the introduction of specific categories of essential
workers. New categories of essential workers most typically included education and childcare
workers — reflected in both the return to in-person teaching after the holidays, as well as debates
34https://www.hhs.gov/coronavirus/covid-19-vaccines/distribution/index.html 35 https://www.brown.edu/news/2021-03-19/nursinghomes

39
over the need for fully-vaccinated teachers as a prerequisite to returning to the classroom.36 Of
states to consider educators in their policies, Kentucky was the first to fully vaccinate school
employees, Ohio required its schools to commit to reopening by March 1 for early vaccinations,
and other states such as Pennsylvania emphasized vaccination prior to school reopening to in
person teaching.
However, lists of essential workers remained generally more limited than the examples for
phase 1b given by the CDC. States that enacted such policies usually did so in late January or in
the first half of February. Additions within the categories of ‘essential’ and ‘elderly’ continued in
February, often tempered by vaccine supply from federal shipments as states gained capacity to
expand. This commonly included varied professions making up frontline workers (with variations
by state), and individuals aged 16-65+ with underlying health conditions likely to cause them to
be vulnerable to severe COVID-19.
With Biden’s target vaccine eligibility deadlines approaching and wider availability of
vaccines on the state level, mid-March and early April saw many states move to greatly expand
availability, sometimes by adding expansive categories of qualified individuals and then by setting
minimal age floors for vaccination. While some states experienced shortages that prevented
immediate full coverage all states had a policy reflecting near-universal access by Biden’s April
19 target. The most common policy type was that of allowing all individuals aged 16+ to be
vaccinated, though Montana and Nebraska used 18 as the cutoff, likely in line with existing
vaccine approvals and state supply of specific vaccine types.37 38 Many states, such as Colorado
and Texas moved directly from policies that covered limited categories within the basic primary
groups (essential workers, elderly people, clinically vulnerable people) to policies allowing for
people 16+ to be vaccinated. A minority first incorporated broader additional groups (such as
Louisiana and Arkansas’ more extensive lists of eligible professions and population groups such as
students) before authorizing vaccination of individuals 16+. Figure 15 shows how the share of states
with the most expansive policies (usually 16+ eligibility) rapidly increased in April to having such
policies become ubiquitous, though mapping policy movement against vaccination rates
indicate that, at least in the aggregate, expansive policies led vaccine rollout itself.
36https://khn.org/morning-breakout/vaccination-access-is-key-part-of-debate-over-reopening-
schools/ 37 The Johnson & Johnson and Moderna vaccines are approved for people aged 18+ in the US under emergency use authorizations, Pfizer for 16+ 38 https://www.cdc.gov/vaccines/covid-19/info-by-product/clinical-considerations.html

40
Figure 15: Movement of states toward widespread availability over time
Variation in state eligibility policies
Policy details and timeline
More granular analysis shows how states sometimes deviated from these trends in both
policy content and timeline. First, not all states followed a group-based expansion model. After
following initial group-based eligibility requirements, Arizona and Utah were early adopters of
expanding vaccine eligibility policies based on age—the kind of approach utilized by the UK and
Israel in vaccine rollouts. Other states, such as Delaware, Georgia, New Hampshire, Rhode Island,
did not transition to a totally age-based approach, but did offer more granularity in age eligibility
than most states along with eligibility for other priority groups. For example, Rhode Island’s April
vaccine policies featured stepwise expansion from groups aged 60+, to 50+, to 40+ before
reaching widespread availability to all aged 16+.
Equity considerations were another differentiating factor in policy administration. While not
tracked systematically, OxCGRT recorded frequent considerations for equity using language
relating to “equity”, “minority” or “underserved” communities, and more occasional
considerations for racial or ethnic background. Many of these policies related to data collection
concerns, such as Nebraska, Minnesota, North Carolina, and South Carolina’s publication of
disaggregated racial, ethnic, and gender-based data about vaccine uptake. Population-
targeted messaging and informational distribution about vaccines was also offered in many
states, with California, Louisiana, Maryland, Missouri, Ohio, forming specific equity metrics,
information campaigns, and advisory groups to inform equity of rollout. Finally, some states such
as Montana specified racial or ethnic background as a qualifying factor for vaccine eligibility
prioritize people of color who may be at elevated risk for COVID-19 due to structural factors.

41
Eligibility rollouts and reopening
While all states reached a widespread level of eligibility by Biden’s deadline April 19, there
was significant variation in when this target was met, and how policies around eligibility translated
to actualized shots-in-arms [Table 5].
Early introduction of eligibility policy did not necessarily translate to more expansive
vaccination. Of the first 20 states to expand eligibility to all residents aged 16+, 16 were
Republican-led, and only one was located in the Northeast (10 were in the south, 6 were in the
Midwest, and 3 in the West). However, of these states only Ohio landed in the top 10 jurisdictions
in terms of total vaccinations by end of April, and none of these early adopters were among the
top 10 in vaccinations per 100 people. Instead, jurisdictions with high per capita vaccination were
dominated by Democrat-led and Northeastern states by the end of April. Interestingly, some of
these states were among the latest to have implemented policies of universal vaccine access —
Hawaii, Rhode Island, and Massachusetts had all done so on the last day of Biden’s
recommended deadline (April 19) despite ranking among the highest in actualized vaccination
rates (Table 5).
Table 5: Comparisons of first states with universal access policies compared to vaccination
rollout as of April 30
First 10 jurisdictions to
enact a policy of universal access39
Last 10 jurisdictions to
enact a policy of universal access40
Top 10 jurisdictions in
vaccinations per 100 people as of April 1
Top 10 jurisdictions in
vaccinations per 100 people as of April 30
Alaska (March 9) Hawaii (April 19) New Mexico Connecticut
Mississippi (March 16) Rhode Island (April 19) South Dakota Vermont
West Virginia (March 22) Massachusetts (April 19) Alaska Massachusetts
Utah (March 24) Oregon (April 19) Connecticut Maine
Georgia (March 25) New Jersey (April 19) North Dakota Hawaii
Louisiana (March 29) Vermont (April 19) Washington DC Rhode Island
Kansas (March 29) Virginia (April 18) Rhode Island New Mexico
North Dakota (March 29) California (April 15) Massachusetts Washington DC
Ohio (March 29) Washington (April 15) Vermont New Hampshire
Oklahoma (March 29)
Texas (March 29)
Pennsylvania (April 13) Maine New Jersey
39 Where states had the same date of expansion to universal eligibility, they were secondarily ordered by date of earliest previous expansion (Ex: ordered by earliest ordinal level 5 code, then
earliest ordinal level 4). 40 Where states had same date of expansion of expansion to universal eligibility, they were secondarily ordered by date of latest previous expansion (Ex: ordered by latest ordinal level 5
code, then latest ordinal level 4)

42
The picture is slightly different when looking at April 1, when expansive eligibility was limited
to only about half of states. Total vaccination rankings looked similar, but states with the highest
rollout as measured by vaccination per 100 people were more evenly distributed between West,
Midwest and Northeast. Here, the potential effects of early policy expansion are also more
evident, with both Alaska and North Dakota ranking among the earliest to enact universal access
policies, and having the highest vaccination rate April 1. South Dakota ranked unexpectedly high
in vaccinations per 100 people, having neither expanded vaccination to individuals aged 16+ by
April 1, having a rural population, and having implemented very few closure and containment
policies throughout the pandemic. New Mexico, ranks just above South Dakota in vaccination per
100 people on April 1, and has had much more stringent policy responses throughout the
pandemic.
Total vaccination rankings reflect baseline population — unsurprising considering federal
distribution of vaccines based on state population. However, these rankings weren’t set in stone
— Georgia slightly underperformed, at 9th most populous and 12th most vaccinated despite
having a universal access policy in late March.
In the race between variants and vaccines, it’s important to examine the way vaccine
rollout relates to reopening and cases. The goal of vaccination policies is, of course, to prevent
further spread of COVID-19. But policy statements alone do not guarantee shots-in-arms, and
vaccine campaigns have risen against a backdrop of loosening containment policies. As above
figure 15 and table 5 show, expanded policies do not translate directly into high vaccination rates,
and figure 16 details this variation further. States with fewer restrictions and fewer cases tended to
have fewer vaccinations (mostly in the West), perhaps reflecting attitudes toward COVID-19 that
extends to vaccines, or that vaccines are not perceived to be as important as they might be in
areas where cases are spiking. Alabama, Georgia, Kansas, display the strongest relationships in
this regard. And while Northeastern states were slightly more likely to have increased vaccinations
alongside increased cases, most states had insignificant relationships between stringency
changes and case changes. Florida stands slightly as an outlier—with only a mid-tier vaccination
rate amid lessened policy stringency and increasing case counts, perhaps reflective of specific
spring-break spikes in cases in April.

43
Figure 16: Cases’ growth compared to reopening policies, by vaccination level, from March 30
to April 30

44
8. Mobility Whilst OxCGRT data measures the strength and timing of policy interventions for COVID-
19, it does not measure the extent to which they are enforced or complied with. One method of
understanding population behavior, an indicator of compliance with the policy environment, is
to examine population-level mobility. Google’s phone mobility data is one such mobility metric,
which measures the change in average mobility at the county, state and national levels at
different locations when compared to the first five weeks of 2020.41 It can generally be seen that
there is a trend of decreasing home permanence and increased time at non-essential retail,
especially noticeable during periods of maintained high stringency.
Daily time spent at residential property, a measure of home permanence, is shown in figure
17 below, with state-wise percentage differences from the average time spent at home (left y-
axis) shown since February 2020 plotted alongside the OxCGRT Stringency Index (right y-axis). The
largest and smallest overall mean home permanence changes are shown in Table 6, with
Washington and New Jersey having the largest increases in home permanence, and Montana
and Wyoming the smallest. Common amongst all states is an increase in home permanence
during March 2020 and a smaller increase in December 2020 to January 2021, with gradual
declines after sharp changes. These results align with research that suggests that individuals suffer
from some degree of “lockdown fatigue,” with changes in behavior weakening after prolonged
periods of closure and containment policies.42 The summer 2020 decline appears to be in line with
a relaxation of policies in late spring, however changes in mobility vary significantly across states
and across periods above and beyond policy differences. Secondary reimposition of lower
stringency lockdowns, as seen most clearly in Michigan, Wyoming, Alaska and Massachusetts,
correspond with smaller second increases in home permanence.
Table 6: Largest and Smallest State-Wise Overall Mean Increase in Home Permanence with
OxCGRT Stringency Index for reference
Ranked Largest Statewide Increase in Home
Permanence (Mean Stringency Index)
Ranked Smallest Statewide Increase in Home
Permanence (Mean Stringency Index)
1. Washington DC 67.0 2. New Jersey 58.7
3. Maryland 62.4 4. Massachusetts 62.7
5. Hawaii 71.9
6. California 62.9 7. New York 69.6
8. Washington 61.5
9. Virginia 57.4 10. Minnesota 60.3
1. Montana 55.2 2. Wyoming 59.9
3. Idaho 55.1 4. South Dakota 44.5
5. Mississippi 54.8
6. Arkansas 56.8 7. West Virginia 55.8
8. North Dakota 44.5
9. Oklahoma 46.7 10. South Carolina 53.5
41 https://www.google.com/covid19/mobility/ 42 https://papers.ssrn.com/sol3/papers.cfm?abstract_id=3774252

45
Figure 17: State-wide residential home-permanence compared to OxCGRT Stringency Index
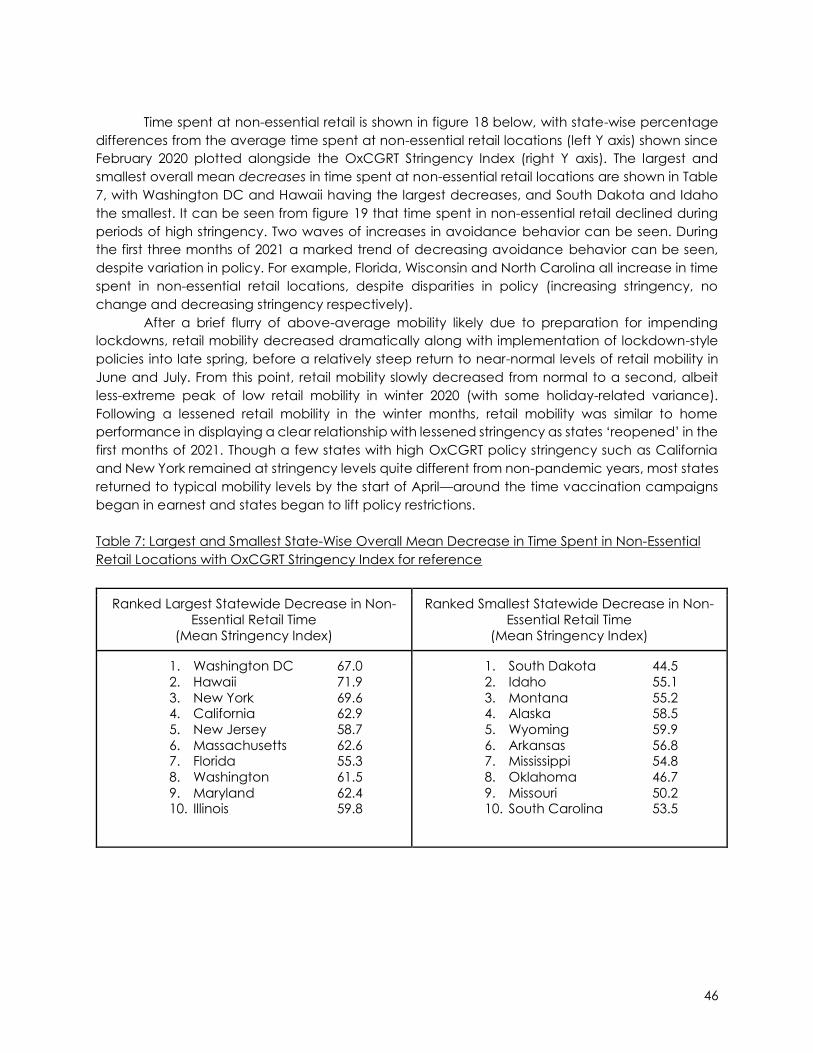
46
Time spent at non-essential retail is shown in figure 18 below, with state-wise percentage
differences from the average time spent at non-essential retail locations (left Y axis) shown since
February 2020 plotted alongside the OxCGRT Stringency Index (right Y axis). The largest and
smallest overall mean decreases in time spent at non-essential retail locations are shown in Table
7, with Washington DC and Hawaii having the largest decreases, and South Dakota and Idaho
the smallest. It can be seen from figure 19 that time spent in non-essential retail declined during
periods of high stringency. Two waves of increases in avoidance behavior can be seen. During
the first three months of 2021 a marked trend of decreasing avoidance behavior can be seen,
despite variation in policy. For example, Florida, Wisconsin and North Carolina all increase in time
spent in non-essential retail locations, despite disparities in policy (increasing stringency, no
change and decreasing stringency respectively).
After a brief flurry of above-average mobility likely due to preparation for impending
lockdowns, retail mobility decreased dramatically along with implementation of lockdown-style
policies into late spring, before a relatively steep return to near-normal levels of retail mobility in
June and July. From this point, retail mobility slowly decreased from normal to a second, albeit
less-extreme peak of low retail mobility in winter 2020 (with some holiday-related variance).
Following a lessened retail mobility in the winter months, retail mobility was similar to home
performance in displaying a clear relationship with lessened stringency as states ‘reopened’ in the
first months of 2021. Though a few states with high OxCGRT policy stringency such as California
and New York remained at stringency levels quite different from non-pandemic years, most states
returned to typical mobility levels by the start of April—around the time vaccination campaigns
began in earnest and states began to lift policy restrictions.
Table 7: Largest and Smallest State-Wise Overall Mean Decrease in Time Spent in Non-Essential
Retail Locations with OxCGRT Stringency Index for reference
Ranked Largest Statewide Decrease in Non-
Essential Retail Time
(Mean Stringency Index)
Ranked Smallest Statewide Decrease in Non-
Essential Retail Time
(Mean Stringency Index)
1. Washington DC 67.0
2. Hawaii 71.9
3. New York 69.6 4. California 62.9
5. New Jersey 58.7
6. Massachusetts 62.6 7. Florida 55.3
8. Washington 61.5
9. Maryland 62.4 10. Illinois 59.8
1. South Dakota 44.5
2. Idaho 55.1
3. Montana 55.2 4. Alaska 58.5
5. Wyoming 59.9
6. Arkansas 56.8 7. Mississippi 54.8
8. Oklahoma 46.7
9. Missouri 50.2 10. South Carolina 53.5

47
Figure 18: State-wide non-essential retail mobility compared to OxCGRT Stringency Index

48
There also appears to be a difference between home permanence on weekdays and
weekends. Increases in home permanence tended to be higher on weekdays as compared to
weekends, likely exhibiting the effect of work-from-home policies, whether state-implemented or
voluntary. The strength of the weekend/day divide was not consistent across states. In general,
Southern and Western states had less dramatic differentiation of weekday home permanence,
perhaps reflecting lower stringency in workplace-related policies on the state and local levels
[Table 8]. In most states, the weekend/day gap in home permanence tended to narrow over the
course of the pandemic—by 2021, several states such as Maine, Iowa and South Carolina that
had seen a well-defined weekend/day gap had narrowed substantially in the new year.
Table 8: Home Permanence Weekday vs Weekend Differences (brackets indicate weekends
larger than weeks)
Ranked Largest Differences Between Weeks
and Weekends (Mean Stringency Index)
Ranked Lowest Differences Between Weeks
and Weekends (Mean Stringency Index)
1. Washington DC 67.0
2. New Jersey 58.7
3. Maryland 62.4 4. Massachusetts 62.6
5. New York 69.6
6. Michigan 57.3 7. Minnesota 60.3
8. Illinois 59.8 9. Virginia 57.4
10. Connecticut 65.5
1. Wyoming 59.9
2. Mississippi 54.8
3. Montana 55.2 4. Louisiana 60.6
5. Arkansas 56.8
6. Idaho 55.1 7. Florida 55.3
8. Alabama 48.2 9. Oklahoma 46.7
10. South Dakota 44.5
Table 9: Non-essential Retail Weekday vs Weekend Differences (brackets indicate weekends
larger than weeks)
Ranked Largest Differences Between
Weeks and Weekends (5-3.8%)
Ranked Lowest Differences Between Weeks
and Weekends (0-1.5%)
States 1. New Mexico
2. North Dakota
3. Oklahoma 4. Minnesota
5. Louisiana
6. Colorado 7. Arkansas
8. Nebraska
9. Montana 10. Alabama
1. Maine
2. Alaska
3. Idaho 4. Connecticut
5. (Wisconsin)
6. West Virginia 7. (New York)
8. Iowa
9. South Dakota 10. New Jersey
The initial decline in home permanence in summer 2020 appears to be in line with the
relaxation of strict policies in late spring. However, as lockdowns were held at a constant
stringency level over the summer, there was a trend of decreasing home permanence and
increased time at non-essential retail and recreation businesses, exemplified best by New York,

49
Florida, Hawaii, Louisiana, and Washington. These differences may be from variation of specific
indicators, with the imposition and lifting of work and stay-at-home policies specifically being
potentially relevant, as the imposition and lifting of these policy types were more closely aligned
with changes in these specific areas than stringency overall. The implementation of winter policy
measures was similarly uniform in the effects on home permanence and time in non-essential
retail. While the second peak change in mobility in winter 2020 was decidedly less pronounced
than the first in spring 2020, home permanence displayed a similar pattern of closely-linked
increase followed by gradual decline. There was also significant variation in the speed in which
states’ retail mobility increased in the post-lockdown summer period, and how closely retail
mobility aligned with pre-pandemic levels. Maine, for example, experienced retail mobility levels
similar to pre-pandemic levels despite relatively high stringency over the summer and early fall.
As state leadership seeks to balance pandemic policy fatigue against the hope of
vaccines, and concerns over more virulent variants, mobility data contextualizes the impact of
policy action and provides insight in how impacts may shift over time. With periods of maintained
high stringency it can be seen that there is a general trend of decreasing home permanence and
increased time at non-essential retail locations, suggesting that as time goes on compliance to
policies may start to decline.

50
9. Conclusion
Even as US policymakers passed important pandemic milestones, common debates
around COVID-19 responses remain. What policies might implement, for how long, and whether
they affect behavior all remain open questions from the beginning of the pandemic. These open
questions have taken on new urgency in the US as states move to reopen amid ongoing
vaccinations and hopes that the worst spikes of the winter months might be left behind—even as
new variants and declining vaccination rates threaten progress gained. Substantiating patterns
in states policy, inter- and intra-state variation in decision making, and policies’ relationship to
external data such as vaccination rates and mobility provide starting points to these questions as
the US enters a new phase of the pandemic.
We have identified the first months of 2021 as a period defined by reopening and
continued state control, with certain policy areas such as gathering restrictions, workplace
closures, and mask wearing dropping precipitously in the new year. While federal action on
COVID-19 policy remains mostly confined to updated guidance and logistical involvement in
vaccine distribution, federal leadership did alter policy experiences across several indicators
tracked by OxCGRT, including mask wearing, school reopening, and vaccination eligibility
policies.
Familiar patterns continued in state policy variation. While divergence in stringency
lessened as more states moved toward phases of reopening, Northeastern and Democrat-led
states maintained the most stringent policies, while Midwestern, Southern and Republican-led
states making up the states with the least stringent ongoing responses. Throughout all regions,
geographically-targeted policies remained common as state-wide policies were lifted, and city
or county levels took center stage. Mobility data supports these trends, showing that lessened
policy stringency coincided with less time at home, and more time at non-essential retail settings.
Periods of high policy stringency were followed by gradual movement toward ‘normal’ mobility,
hinting at possible effects of policy fatigue.
In many ways, these familiar policy actions were overshadowed by 2021’s main event—
vaccination campaigns. The US has remained unique in its privileged access to several effective
vaccines and decentralized distribution, factors making study of its subnational rollout policies
especially crucial. Vaccine eligibility policies followed similar broad patterns. December and
January saw limited vaccine eligibility and accessed, focused on healthcare workers and care
home residents in line with CDC guidance. But as time went on and vaccine supplies expanded,
states began to diverge in their rollout specifics. Key variance occurred in definitions of essential
workers, prioritizations of certain groups, and decisions about whether to pursue primarily age-
based or occupation-based vaccination rollouts. And while states faced logistical and supply
shortages through February and March that at times limited expansion of eligible categories, the
tide began to turn toward vaccine eligibility for all 16+ individuals by the beginning of April, with
all states reaching the federal deadline of April 19 for expanding eligibility to all adults in the state.
This promises to remain a dynamic policy area as the world grapples with variants and inequitable
vaccine access, and the US moves toward vaccinating children and fights waning interest in
vaccination amid the population.
51
It is imperative to study which measures are effective (and which are not) to both limit
COVID-19 spread and reduce disruption to life and livelihood. While the OxCGRT data presented
is descriptive and cannot measure effectiveness of different policy measures directly, they can
be useful input to studies that analyze factors affecting disease progression. OxCGRT seeks to
contribute to this knowledge gap by providing efficient and simple comparisons of government
interventions and individual policy actions in the US, as well as several comparable aggregate
indices and risk of openness measures. These provide a starting point for building evidence-based
policies and assessing effectiveness of non-pharmaceutical interventions. It is our hope that
scholars, medical professionals, policymakers, and concerned citizens alike will use the OxCGRT
data to inform and improve responses to the COVID-19 pandemic.
The data will continue to be updated on a regular basis, and will be refined and improved
over time. The most up-to-date technical documentation can always be found on our GitHub
repository.43 44 We welcome constructive feedback and collaboration on this project as it evolves.
43 https://github.com/OxCGRT/covid-policy-tracker 44 https://github.com/OxCGRT/USA-covid-policy
![Gene Regulatory Variation Mediates Flowering Responses to … · Gene Regulatory Variation Mediates Flowering Responses to Vernalization along an Altitudinal Gradient in Arabidopsis1[W][OPEN]](https://img.pdfslide.us/doc/110x75/5f98e88dad46a25c2151eba2/gene-regulatory-variation-mediates-flowering-responses-to-gene-regulatory-variation.jpg)