Embed Size (px)
Citation preview

Variation in the Ribosomal Internal Transcribed Spacers (ITS1 and ITS2) among Eight Taxa of the Mimulus guttatus Species Complex’
Carol E. Ritland, Kermit Ritland, and Neil A. Straw Department of Botany, University of Toronto
The internal transcribed spacer region (ITS 1 and ITS2) of the 1 SS-25s nuclear ribosomal DNA sequence and the intervening 5.8s region were sequenced from three individuals in each of eight taxa of the Mimulus guttatus species complex. Three discrete variants, or “types,” of ITS sequences were found, among which 30%-40% of sites differed, compared with l%-2% within types. Dot plots indicate that these types were not related by conspicuous rearrangements or inversions. More than one ITS type was often found in the same taxon, and two of three ITS types span species boundaries, indicating their presence prior to speciation. These ITS sequences showed essentially no positional homology with the nearest sequenced relative, tomato. In contrast, the 5.8s region was relatively unvaried, with 8 of 162 sites varied in the sample among all eight taxa, The phylogeny inferred by the most common ITS sequence type, rooted by the two other ITS types, agreed with isozymes in showing the distinctness of M. nudatus, M. luciniatus, and ikf. tilingii from the other five taxa.
Introduction
The major ribosomal RNA (rRNA) genes of plants are localized in clusters of highly repeated sequences, each repeat consisting of sequences for the 18S, 5.8S, and 25s ribosomal subunits. These genes show little sequence divergence between closely related species. Within each repeat, these conserved regions are separated by internal transcribed spacers ( ITS), which show higher rates of divergence. The designation for the spacer between the 18s and 5.8s genes is “ITS 1”; the designation for the spacer between the 5.8s and 25s genes is “ITS2.” A third spacer, the large intergenic spacer (IGS), is found between the 3’ end of the 25s and the 5’ beginning of the 18s genes. Restriction-fragment-length polymorphism (RFLP) analyses of the ITS regions was useful for inferring phylogenies of closely related species ( Appels and Dvorak 1982a, 19826; Furlong and Maden 1983; Rogers and Bendich 1987; Schaal and Learn 1988; King and Schaal 1989; Sytsma and Schaal 1990) and even for inferring phylogenies of closely related individuals and populations (Learn and Schaal 1987; Schaal et al. 1987).
While DNA sequences for the 18S, 5.8S, and 25s subunits have been well char- acterized for many different organisms (Hamby and Zimmer 1992)) sequences of ITS regions have only recently received significant attention (Furlong and Maden 1983;
1. Key words: internal transcribed spacers (ITS), Mimulus, Scrophulariaceae, phylogeny, sequence variation.
Address for correspondence and reprints: Carol E. Ritland, Department of Botany, University of Toronto, Toronto, Ontario M5S 3B2, Canada.
Mol. Biol. Evol. 10(6):1213-1288. 1993. 0 1993 by The University of Chicago. All rights reserved. 0131~4038/93/1006-0010$02.00
1273
1274 Ritland et al.
Gonzalez et al. 1990; Baldwin 1992; Lee and Taylor 1992). Baldwin ( 1992) found high sequence alignability yet divergence of up to 20% in the Madiinae and concluded that the ITS regions have apparent value as source of phylogenetic data but stressed that other plant groups need examination.
DNA sequence assays have been greatly aided by the discovery of the polymerase chain reaction (PCR; Saiki et al. 1988), which makes possible the rapid amplification of specific pieces of DNA from small amounts of starting tissue, as well as direct sequencing of PCR products without cloning. While rapid assay of spacer sequences is now possible, the potential for polymorphism at ITS nucleotide sites warrants caution against indiscriminate direct sequencing of PCR products.
The Mimulus guttatus species complex is an actively evolving group of 8- 12 (depending on taxonomic treatment) intercrossable species. The first morphological study defining these taxa was by Grant ( 1924). Chromosome counts of these species vary from n = 13 to n = 15 (Campbell 1950; Mukherjee and Vickery 1960). Vickery ( 1964) proposed that this group was a living example of Wright’s ( 1932) model for rapid evolution and speciation. A previous study of reproductive characters and isozyme differences among eight taxa of the M. guttatus species complex (Ritland and Ritland 1989) indicated that inbreeding and a suite of characters associated with inbreeding have evolved at least twice in this group.
In this paper, we present the results of a survey of DNA sequences spanning the 5.8s region and flanking spacers (ITS 1 and ITS2) of eight closely related taxa of the M. guttatus species complex. Determination of complete DNA sequences for three individuals of each taxon allows a glimpse of population-level variation for these genes. Results from a molecular phylogenetic analysis further demonstrate the potential for the use of rDNA spacer sequences to infer phylogenetic relationships among plant taxa.
Material and Methods
The following eight taxa, all members of the common yellow monkey flower species complex, were used for sequence determination of the 5.8s gene and flanking transcribed spacers: Mimulus micranthus, M. laciniatus, M. nasutus, M. guttatus, M. tilingii, M. glaucescens, M. platycalyx, and M. nudatus. All collections were from California (table 1)) and all except one (M. guttatus) were from the same location as in an earlier study (Ritland and Ritland 1989). In 1987-89, seed capsules were collected
Table 1 Location of Populations of the Eight Taxa of Mimulus Section Simiolus Used in This Study
Taxa Location (in California)
M. guttatus . . M. nasutus . . . M. glaucescens . . M. tilingii . . . . M. nudatus . . . . . . M. laciniatus . . M. platycalyx . . . . M. micranthus . . .
Chimney Rock, Pt. Reyes, Marin County 5 Miles southeast of Middletown, Lake County Richardson Springs, Butte County Sonora Summit, Mono County Highway 20, at the border of Lake County and Colusa County Lake Eleanor Road, Hetch-Hetchy Valley, Tuolumne County Crystal Springs Reservoir, San Mateo County Stevens Creek Park, Santa Clara County
Variation in the Ribosomal ITS Mimulus guttatus 1275
from several individuals (up to 20) of each taxa. Each capsule contained 100-500 seeds. Seeds were pooled from each population and were grown under standard-growth room conditions ( 16 h of day at 18°C and 8 h of night at 12°C).
At peak flowering, for each taxon, leaves were harvested from the pool of indi- viduals ( - 1,000)) and total DNA was isolated immediately by the CTAB (cetyltri- methylammonium bromide) method of Doyle and Dickson ( 1987). To avoid mis- labeling or cross-contamination of DNA, DNAs from different species were isolated on different days. The yield and purity of isolations were determined as described elsewhere (Ritland and Straus 1993 ) .
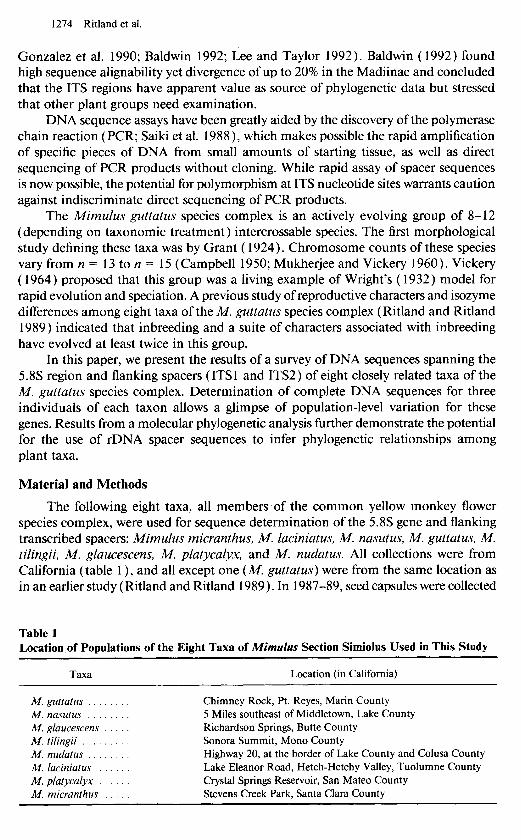
From this pooled DNA, PCR was used to amplify DNA to sufficient levels for direct molecular cloning. Conserved areas from the 3’ end of the 18s sequence and from the 5’ end of the 25s sequence were used as PCR primers. To avoid mislabeling or contamination of products, PCR reactions for different taxa were done on different days. Cloning and sequencing were performed as described by Ritland and Straus ( 1993). Sequences were obtained for each of three independent clones per taxon (except for M. platycalyx, for which four independent clones were sequenced). To confirm each sequence, we sequenced in both directions (by using complementary strands), and the sequences from the nontranscribed strand were converted to their complementary sequence. Figure 1 gives the areas sequenced.
Overlapping sequence data from the same clone (individual) were assembled into complete clonal sequences by using ESEE, an eyeball sequence editor (B. Chabot, Simon Fraser University, British Columbia). The 25 complete sequences from the eight taxa were then aligned by means of the multiple-alignment program, TreeAlign (Hein 1989). This method first constructs a matrix of similarity between unaligned sequences based on k-tuple frequencies and then aligns sequences (or groups of se- quences) according to their inferred relationship.
Dot plots (not shown) were constructed to examine the relationship between spacers that fell into distinct types. The best resolution was deemed to occur with a filter that allowed >7 of 10 matches. Comparisons were also made to the nearest sequenced relative, tomato.
Phylogenies were then estimated from the aligned sequences, by using PHYLIP ( version 3.4; Felsenstein 1989). DNADIST first created a matrix of distances among sequences (with one rate model assumed), then NEIGHBOR (the neighbor-joining method of Saitou and Nei 1987) inferred the network of relationships from the distance matrix. The resulting tree, with branch lengths proportional to number of changes, was plotted by DRAWTREE. The distance-matrix method was used because of its incorporation of base-substitution models. Such models allow unbiased estimation of
sequenced area FIG. 1 .-Region of the rDNA sequenced in this study
1276 Ritland et al.
the total number of evolutionary changes among sequences with lower similarity, whereas parsimony methods provide only a minimum estimate.
Because of its very low similarity, the tomato could not be used to root the Mimulus ITS tree. We therefore rooted the phylogeny of the most common Mimulus ITS type (type I, found in 19 of 25 sequences) by the other two Mimulus ITS types.
Results Sequence Length, % (G+C) Content, and Alignment
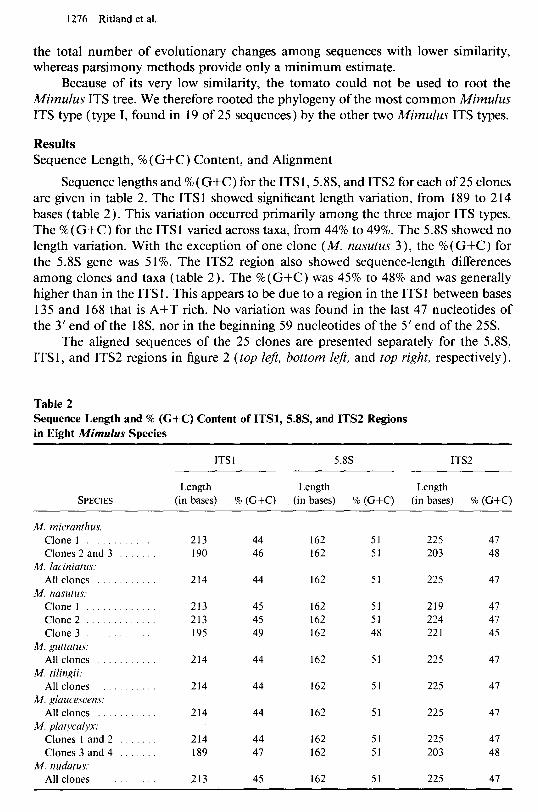
Sequence lengths and % (G+C) for the ITS 1,5.8S, and ITS2 for each of 25 clones are given in table 2. The ITS 1 showed significant length variation, from 189 to 2 14 bases (table 2). This variation occurred primarily among the three major ITS types. The % (G+C) for the ITS1 varied across taxa, from 44% to 49%. The 5.8s showed no length variation. With the exception of one clone (M. nasutus 3), the % (G+C) for the 5.8s gene was 5 1%. The ITS2 region also showed sequence-length differences among clones and taxa (table 2). The %( G+C) was 45% to 48% and was generally higher than in the ITS 1. This appears to be due to a region in the ITS 1 between bases 135 and 168 that is A+T rich. No variation was found in the last 47 nucleotides of the 3’ end of the 18S, nor in the beginning 59 nucleotides of the 5’ end of the 25s.
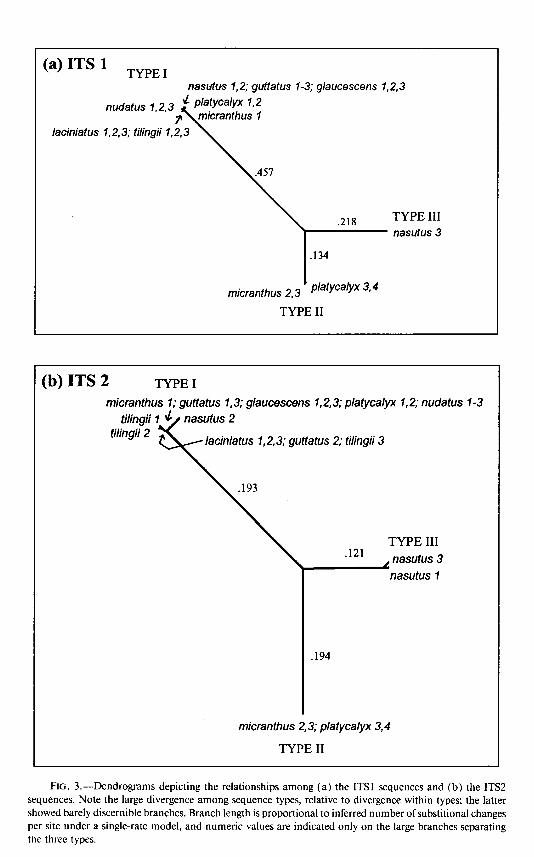
The aligned sequences of the 25 clones are presented separately for the 5.8S, ITSl, and ITS2 regions in figure 2 (top left, bottom le$, and top right, respectively).
Table 2 Sequence Length and % (G+C) Content of ITSl, 5X3, and ITS2 Regions in Eight Mimulus Species
SPECIES
ITS 1 5.8s ITS2
Length Length Length (in bases) % (G+C) (in bases) % (G+C) (in bases) % (G+C)
M. micranthus. Clone 1 Clones 2 and 3
M. laciniatus. All clones .
M. nasutus: Clone 1 Clone 2 . Clone 3
M. guttatus: All clones
M. tilingii: All clones .
M. glaucescens. All clones
M. platycalyx: Clones 1 and 2 Clones 3 and 4
M. nudatus: All clones
213 44 162 51 225 47 190 46 162 51 203 48
214 44 162 51 225 47
213 45 162 51 219 47 213 45 162 51 224 47 195 49 162 48 221 45
214 44 162 51 225 47
214 44 162 51 225 47
214 44 162 51 225 47
214 44 162 51 225 47 189 47 162 51 203 48
213 45 162 51 225 47


nasutus 1,2; guftatus 1-3; glaucescens 1,2,3
nudatus 1,2,3
laciniatus 1,2,3; tilingii 1,2,3
TYPE III nastius 3
’ micranthus 2,3 platycalyx 3,4
TYPE II
(b) ITS 2 TYPE I
micranthus I; guttatus 7,3; glaucescans 7,2,3; platycalyx tilingii
tilingii 2 2; tilingii 3
nudatus 1-3
TYPE III .121
1 nasutus 3 nasutus 1
micranthus 2,3; platycalyx 3,4
TYPE II
FIG. 3.-Dendrograms depicting the relationships among (a) the ITS1 sequences and (b) the ITS2 sequences. Note the large divergence among sequence types, relative to divergence within types; the latter showed barely discernible branches. Branch length is proportional to inferred number of substitional changes per site under a single-rate model, and numeric values are indicated only on the large branches separating the three types.

Variation in the Ribosomal ITS Mimulus guttatus 128 1
divergence within ITS types, is clearly indicated by the relative branch lengths: branch lengths within types [barely discernible in fig. 3(a) and (b)] are l%-5% of branch lengths between types.
Molecular Phylogeny of the Eight Taxa
Because the large differences among the three ITS types make it difficult to align the nucleotides homologously, we examined the most phylogenetically informative subset of data, the type I group of sequences, including both spacers and the 5.8s. The phylogeny based on these sequences is shown in figure 4 (point deletions were included as individual characters). We rooted the type I group with the other two types.
Figure 4 shows some separation of the eight taxa. On the basis of the position of the root, A4. tilingii and M. laciniatus constitute a smaller clade on the tree; M. guttatus and M. glaucescens both occupy the middle, ancestral portion of the tree; and M. nudatus, M. platycalyx, M. micranthus, and M. nasutus constitute a larger clade at the other end of the tree.
fus 7,3; glaucescens 7,2,3
Root (to type II and III sequences)
iniat us 7,2,3; tilingii 3
FIG. 4.--Inferred phylogeny of the Mimulus taxa, using only those 19 individuals showing the ITS type I spacers, rooted by the other two sequence types (II and III).
1282 Ritland et al.
G A
C A a A
A-U C-G
G-C
C-GA
U
5’
\ (A)@d
C
UG AGUGU GAAUUGC
III IIIII UGC CUUAAGA
G-C
U-A
A-U
G-C
C - @ (A) AAUC
A U
A U
CAAG
U VJm- G
(G)n G-C
U C
(G)@ U-A
VJml .c u
A U-A
C C
A G-U
A G-U
CGGAUAUCUU-G
3’ C
\
UGGGCUGCGACUCCGUCUGUA
(A)
GCUCmA GGCuu
I I I I I I I CGAGABCCGGC
(G)
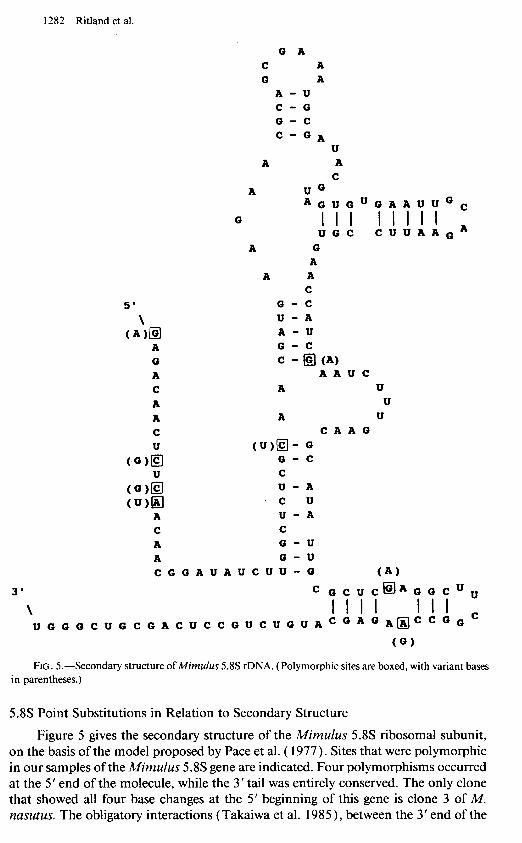
FIG. 5.-Secondary structure of Mimulus 5.8s rDNA. (Polymorphic sites are boxed, with variant bases in parentheses.)
5.8s Point Substitutions in Relation to Secondary Structure
Figure 5 gives the secondary structure of the A4imulus 5.8s ribosomal subunit, on the basis of the model proposed by Pace et al. ( 1977). Sites that were polymorphic in our samples of the Mimulus 5.8s gene are indicated. Four polymorphisms occurred at the 5’ end of the molecule, while the 3’ tail was entirely conserved. The only clone that showed all four base changes at the 5’ beginning of this gene is clone 3 of M. nasutus. The obligatory interactions (Takaiwa et al. 1985), between the 3’ end of the

Variation in the Ribosomal ITS Mimulus guttatus 1283
5X gene and the 5’ beginning of the 25s gene, do not appear to be greatly affected by these nucleotide-substitution changes. The other base changes in the 5.8s (at the end of loop I and loop VI, fig. 3) do not affect base pairing at all. The two transitional changes at bases 99 and 124 also do not cause any major structural change.
Discussion rDNA ITS Evolution
The ITS regions do not encode an rRNA subunit and show the expected greater sequence variation than in the 5.8s region. This variation is primarily attributable to the presence of three major sequence types [ fig. 3(a) and (b)] . Within each type, evolutionary changes are on the order of 1 / 100 nucleotide sites, while, between types, evolutionary changes are on the order of 30-50/ 100 nucleotide sites. The great dif- ferences among types makes their alignment, and hence the precise degree of variation among’types, difficult to determine. In our sample of only three individuals per taxa, two of eight taxa contained two different ITS sequence types, and a third taxon (M. nasutus) had all three ITS types. The most common type (type I) was found in all taxa, but the rarest type (type III) was found in only one taxon (M. nasutus).
Taxa polymorphic for these ITS sequence types reside at one side of the phylogeny in figure 5 (the side with M. platycalyx, M. micranthus, and M. nasutus). This argues for an origin of these types after the origin of the M. guttatus species complex. However, a larger sample from M. laciniatus, M. tilingii, and M. nudatus is needed before we can rule out the presence of polymorphism in these taxa. In addition, the large diver- gence among types, relative to that within types, argues for the opposite: a relatively ancient age of these ITS types, likely predating the origin of the M. guttatus species complex, particularly if these sequences are clocklike in their evolution.
Previous studies of ITS regions, while demonstrating sequence variability, have not found polymorphism for discrete sequence types. Restriction-fragment-length variants for the ITS region were found within populations of Lisianthius skinner-i (Sytsma and Schaal 1985, 1990), but, in the absence of sequence information, the homology of these variants cannot be established. The IGS region, which also does not encode an rRNA subunit, was also shown by Appels and Dvorak ( 1982a, 1982b) to harbor great variation.
Our sample of three DNA sequences per taxon, while sufficient to demonstrate polymorphism, is much too small to enable us to make good statistical inferences about numbers and diversity of sequence types. There are probably several more, undiscovered sequence types. However, if sequence types are homogeneously distrib- uted among taxa, and if the PCR has no bias of amplification, then these additional types are likely to be low in frequency. If an undiscovered type has frequency p, the probability that it will be found in a sample size of 25 is 1 - ( 1 -P)*~, indicating that, with -95% probability, we will have detected a type with frequency >p = 0.10. If types are concentrated in one or few taxa, frequencies of undiscovered types can be much greater: if a sequence type is present in only one population, we have detected it with 95% probability only if its frequency is >-p = 0.63.
Our data say little about the actual frequencies of ITS sequence types. Population geneticists regard a sufficient sample size for estimating gene frequency as 30 diploid individuals, or 60 haploid gametes. However, it is clearly impractical to sequence 60 clones from each taxon. Nonsequencing methods for rapid assay of DNA sequence

1284 Ritland et al.
variation, such as denaturing gradient gel electrophoresis ( Lessa 1992)) may substitute for sequence assay to detect the type of variation we have found.
Recently, variations in rDNA repeat units were found in single individuals (Bobala et al. 1992). In our study, it is unlikely that the different ITS sequence types were sampled from the same individual. Because we used PCR on bulk DNA of thousands of individuals, the chance that different clones were sampled from the same individual is on the order of 1 / 1,000. However, it is still possible that the three ITS sequence types represent different regions, each region sampled from a dz&-ent individual.
Ribosomal 5.8s DNA Evolution
As predicted by Schaal and Learn ( 1988 ) for plants, there was little within-pop- ulation sequence variation in the 5.8s ribosomal subunit. Mimulus nasutus, A4. mi- cranthus, and M. platycalyx showed a few point changes in the 5.8s region, but other taxa showed even less variation. Only 8 of the 162 sites were variable among the 25 clones sequenced from eight taxa. The 3’ end of the 18s rDNA gene and the 5 ’ beginning of the 25s rDNA gene were also completely identical in sequence among the eight taxa (data not shown). The %( G+C) content for the Mimulus 5.8s gene (5 1%) is lower than in most other plant species ( Ritland and Straus 1993 ) . The 162-base length of the Mimulus 5.8s gene is also shorter than in most plant species ( - 164- 165 bases long; see Ritland and Straus 1993 ) .
In the 5.8s gene, the substitutional changes observed among the clones and taxa (fig. 5) appear to be of little consequence for base pairing. Changes occurred either in the loops, immediately adjacent to loops, or along the 5’ tail. Internal paired regions of the 5.8s and its 3’ tail, which strongly interacts with the 5’ tail of the 25s subunit, showed no sequence variation. Apparently, mutations during the evolutionary history of the Mimulus 5.8s subunit have been filtered by natural selection to allow only those substitutions having minimal effect on the secondary structure of the ribosomal subunits.
Phylogenetic Inferences
Because the three ITS sequence types are shared among taxa, a phylogeny con- structed with all 25 complete sequences primarily represents the phylogeny of “genes” (e.g., sequence types) rather than the phylogeny of taxa within the M. guttatus species complex. However, within a given sequence type, the phylogeny of Mimulus taxa can be inferred, to the extent that sufficient variation occurs and that sufficient numbers of taxa possess the sequence type. It is interesting that the other sequence type(s) can be used to root the tree of a given sequence type. This rooting assumes that these ITS types are paralogous sequences and that their origins predate the origins of the taxa under study.
The most common ITS sequence, type I, was found in 19 individuals among all eight taxa, and the rooted phylogeny based on this type (fig. 4)) wherein the root was inferred from the other two ITS types, is not in conflict with that based on isozymes (Ritland and Ritland 1989). Mimulus tilingii and M. laciniatus cluster as one group, and M. nudatus separates out as another group. The other taxa also fall into distinct nodes, with the exception of M. guttatus and M. glaucescens, which are intermixed in the interior of the phylogeny. These two taxa are also similar for reproductive allocation characters ( Ritland and Ritland 1989).
There was no obvious relationship between chromosome number and molecular
Variation in the Ribosomal ITS Mimulus guttatus 1285
relationships. A4imulus taxa have chromosome numbers from n = 13 to n = 15, with the modal number of n = 14. One population of M. nasutus reported by Vickery (not used for this study) had n = 13 (Mukherjee and Vickery 1960)) and one other pop- ulation of M. platycalyx has n = 15. Vickery ( 1964) showed that this extra chromosome could be an accessory chromosome.
The phylogeny of the three ITS types is less certain, as the three types are difficult to align, making inferences about relationship on the basis of point substitutions very uncertain. Like the comparison of two Xenopus species by Furlong and Maden ( 1983), several short sequence elements are identical between the ITS types (fig. 2)) but, overall, similarity is low. The high frequency of type I in our sample suggests that type I may be the most ancient ITS type.
Mating System
The patterns of rDNA variation do not correlate with the mating systems of these taxa. As one would expect, the outbreeding M. nasutus showed within-species sequence variation. However, M. micranthus, an extreme inbreeder (Ritland and Ritland 1989), also showed within-species sequence variation. Mimulus platycalyx is also highly in- breeding but also showed infraspecific variation. By contrast, isozyme variation shows a significant negative association with levels of inbreeding (Ritland and Ritland 1989). The lack of correlation between rDNA variation and level of inbreeding may occur because of the unusual factors involved in the evolution of ribosomal sequences. These factors-which include gene conversion, unequal crossing-over, and mechanisms of concerted evolution (as coined in Zimmer et al. 1980)) as well as secondary-structure constraints-may override the classical factors of effective population size and genetic drift as the agents regulating ribosomal genetic variation.
Use of PCR
Because PCR is the most rapid method for isolating a particular sequence from the genome, the fastest way to sequence the same locus from a large number of different species would be to directly sequence PCR amplification products. Because the actual number of target sites is very large during the first PCR cycle, and because the error rate for Taq polymerase is quite low (Tindall and Kunkel 1988 ) and is expected to be random, the actual number of PCR-induced errors at any one site along a sequence should be too small to interfere with the reading of a DNA sequencing ladder. Therefore, the direct sequencing approach has the added theoretical advantage of avoiding se- quence errors that result from the misincorporation of a nucleotide by thermally stable polymerases.
Numerous attempts were therefore made to directly sequence PCR products. Several techniques were tried, including high-temperature sequencing with BST poly- merase to open secondary structures, use of deaza GTP, as well as Taq sequencing at high temperature ( 60°C). All resulted in a high frequency of signals across more than one sequencing lane for most of the species. In hindsight, most of this probably resulted from the presence of multiple ITS sequence types (types I, II, and III, fig, 2, top left, bottom left, and top right, respectively).
Thus, we resorted to the approach of sequencing both strands of three independent recombinant plasmid clones for each of eight taxa (four clones were sequenced for M. platycalyx) . Three or more clones were sequenced, because even low rates of PCR misreplication can cause problems when few informative base changes are available
1286 Ritland et al.
for phylogenetic inferences (Bloch 199 1). With at least three independent clones, the occasional PCR error would be detected by a difference between one clone and the other two. Such differences may be confused with actual interindividual variation. In this study, the strategy of sequencing three or more clones per taxa led to the unexpected discovery of several discrete ITS sequence types.
We exercised added caution in use of the PCR technique. First, great care was taken to avoid cross-contamination by performing PCR reactions of different taxa on different days. Second, the fidelity of the PCR reaction was tightly controlled. Studies have shown that the Tag enzyme used for PCR can show high fidelity under certain concentrations of dNTPs and Mgf2 (Eckert and Kunkel 1990). Our experimental conditions met these requirements (dNTP was 1 mM final, Mg+2 was > 1.5 mM final, and Taq was >2.5 units/reaction in a loo-@ vol).
Conclusion
DNA sequence comparisons of the ribosomal 5.8s and ITS regions among eight closely related Mimulus species have raised intriguing questions regarding the origin and maintenance of ribosomal sequences. The extent of sequence divergence among the three ITS sequence types argues for their presence prior to the origin of the M. guttatus species complex. However, either natural selection or concerted evolution (Zimmer et al. 1980) may maintain the integrity of each ITS type through evolutionary time spans, thus biasing our perception of the origin of these ITS types to a more distant past. Larger population samples, as well as assays of taxa closely related to Mimulus, would help resolve this question of age. Further investigation is also needed to document the role of secondary structure in favoring the evolutionary conservation of the 5.8S, as well as that of regions within the ITS.
Sequence Availability
The nucleotide sequence data reported in this paper have all (except one, noted below) been submitted to GenBank and have been assigned the following accession numbers: Mimulus micranthus 1, L02794; M. micranthus 2 (and 3), L02795; A4. laciniatus, L02796; A4. nasutus I, L02797; M. nasutus 2, L02798; M. nasutus 3, L02799; A4. guttatus 1 (and 3), LO2800; M. guttatus 2, LO2801; M. tilingii 1, LO2802; M. tilingii 2, LO2803; M. tilingii 3, LO2804; A4. platycalyx 1 ( 1 and 2), LO2805; M. platycalyx 2 (3 and 4), LO2806; A4. nudatus, LO2807; and M. glaucescens, Zl5097 (EMBL data bank).
Acknowledgments
We would like to thank Bess Wong for her invaluable technical help during the course of this project, and we thank Fernando Ferreira for his assistance in sequencing the numerous clones discussed in this paper. We also thank the two anonymous re- viewers for very helpful comments. The research was supported by an NSERC grant (to N.A.S.).
LITERATURE CITED
APPELS, R., and J. DVORAK. 1982a. The wheat ribosomal DNA spacer region: its structure and variation in populations and among species. Theor. Appl. Genet. 63:337-348.
-. 19826. Relative rates of divergence of spacer and gene sequences within the rDNA

Variation in the Ribosomal ITS Mimulus guttatus 1287
region of species in the Triticeae: implications for the maintenance of homogeneity of a repeated gene family. Theor. Appl. Genet. 63:361-365.
BALDWIN, B. 1992. Phylogenetic utility of the internal transcribed spacers of nuclear ribosomal DNA in plants: an example from the Compositae. Mol. Phylogenet. Evol. 1:3-16.
BLOCH, W. 199 1. A biochemical perspective of the polymerase chain reaction. Biochemistry 30:2735-2747.
BOBOLA, M. S., D. E. SMITH, and A. S. KLEIN. 1992. Five major nuclear ribosomal repeats represent a large and variable fraction of the genomic DNA of Picea rubens and P. mariana. Mol. Biol. Evol. 9:125-137.
CAMPBELL, G. R. 1950. Mimulus guttatus and related species. El Aliso 2:3 19-335. DOYLE, J. J., and E. E. DICKSON. 1987. Preservation of plant samples for DNA restriction
endonuclease analysis. Taxon 36:7 15-722. ECKERT, K. A., and T. A. KUNKEL. 1990. High fidelity DNA synthesis by the Thermus aquaticus
DNA polymerase. Nucleic Acids Res. l&3739-3744. FELSENSTEIN, J. 1989. PHYLIP: phylogeny inference package. Cladistics 5: 164- 166. FURLONG, J. C., and B. E. H. MADEN. 1983. Patterns of major divergence between the internal
transcribed spacers of ribosomal DNA in Xenopus borealis and Xenopus laevis and of minimal divergence within ribosomal coding regions. EMBO J. 2:443-448.
GONZALEZ, I. L., J. E. SYLVESTER, T. F. SMITH, D. STAMBOLIAN, and R. D. SCHMICKEL. 1990. Ribosomal RNA gene sequences and hominoid phylogeny. Mol. Biol. Evol. 7:203-219.
GRANT, A. L. 1924. A monograph of the genus Mimulus. Ann. MO. Bot. Garden 11:99-388. HAMBY, R. K., and E. A. ZIMMER. 1992. Ribosomal RNA as a phylogenetic tool in plant
systematics. Pp. 50-91 in P. S. SOLTIS, D. E. SOLTIS, and J. J. DOYLE, eds. Molecular sys- tematics of plants. Chapman & Hill, New York.
HEIN, J. 1989. Unified approach to alignment and phylogenies. Methods Enzymol. 183:626- 645.
KING, L. M., and B. A. SCHAAL. 1989. Ribosomal-DNA variation and distribution in Rudbeckia missouriensis. Evolution 43: 1117- 1119.
LEARN, G. H., and B. A. SCHAAL. 1987. Population subdivision for ribosomal DNA repeat variants in Clematis fremontii. Evolution 41:433-438.
LEE, S. B., and J. W. TAYLOR. 1992. Phylogeny of five fungus-like protoctistan Phytophtora species, inferred from the internal transcribed spacers of ribosomal DNA. Mol. Biol. Evol. 9:636-653.
LESSA, E. P. 1992. Rapid surveying of DNA sequence variation in natural populations. Mol. Biol. Evol. 9:323-330.
MUKHERJEE, B. B., and R. K. VICKERY, JR. 1960. Chromosome counts in the section simiolus of the genus Mimulus (Scrophulariaceae) IV. Madrono 15:239-245.
PACE, N. R., T. A. WALKER, and E. SCHROEDER. 1977. Structure of the 5.8s RNA component of the 5.8S-28s ribosomal RNA junction complex. Biochemistry 16:5321-5328.
RITLAND, C., and K. RITLAND. 1989. Variation of sex allocation among eight taxa of the Mimulus guttatus species complex (Scrophulariaceae). Am. J. Bot. 76: 173 l-l 739.
RITLAND, C., and N. A. STRAUS. 1993. High evolutionary divergence of the 5.8s rDNA gene and internal transcribed spacer regions in Mimulus glaucescens ( Scrophulariaceae ) relative to other higher plant species. Plant Mol. Biol. 22:69 l-696.
ROGERS, S. O., and A. J. BENDICH. 1987. Ribosomal RNA genes in plants: variability in copy number and in the intergenic spacer. Plant Mol. Biol. 9:509-520.
SAIKI, R. K., U. B. GYLLENSTEN, and H. A. ERLICH. 1988. The polymerase chain reaction. Pp. 14 I- 15 1 in K. DAVIES, ed. Gene technology: a practical approach. IRL, Oxford.
SAITOU, N., and M. NEI. 1987. The neighbor-joining method: a new method for reconstructing phylogenetic trees. Mol. Biol. Evol. 4:406-425.
SCHAAL, B. A., and G. H. LEARN, JR. 1988. Ribosomal DNA variation within and among plant populations. Ann. MO. Bot. Garden 75: 1207- 12 16.
1288 Ritland et al.
SCHAAL, B. A., W. J. LEVERICH, and J. NIETO-SOTELO. 1987. Ribosomal DNA variation in the native plant Phlox divaricata. Mol. Biol. Evol. 4:6 1 l-62 1.
SYSTMA, K. J., and B. A. SCHAAL. 1985. Phylogenetics of the Lisianthius skinneri (Gentianaceae) species complex in Panama utilizing DNA restriction fragment analysis. Evolution 39:594- 608.
-. 1990. Ribosomal DNA variation within and among individuals of Lisianthius (Gen- tianaceae) populations. Plant Syst. Evol. 170:97-106.
TAKAIWA, F., K. 00~0, and M. SUGIURA. 1985. Nucleotide sequence of the 17S-25s spacer region from rice rDNA. Plant Mol. Biol. 4:355-364.
TINDALL, K. D., and T. A. KUNKEL. 1988. Fidelity of DNA synthesis by the Thermus aquaticus DNA polymerase. Biochemistry 27:6008-60 13.
VICKERY, R. K. 1964. Barriers to gene exchange between members of the it4imulus guttatus complex (Scrophulariaceae). Evolution l&52-69.
WRIGHT, S. 1932. The roles of mutation selection in evolution. Proceedings of the Sixth Inter- national Congress of Genetics. Vol. 1. Brooklyn Botanic Garden, Menasha, Wis.
ZIMMER, E. A., S. L. MARTIN, S. M. BEVERLEY, Y. W. KAN, and A. C. WILSON. 1980. Rapid duplication and loss of genes coding for the L chains of hemolglobin. Proc. Natl. Acad. Sci. USA 77:2 158-2 162.
ELIZABETH ZIMMER, reviewing editor
Received November 20, 1992; revision received May 27, 1993
Accepted July 27, 1993