Embed Size (px)
Citation preview

Variation and improving services: case studies and key questions
Authors: Tom Love and Nieves Ehrenberg, Sapere Research Group
Date: 2 April 2014

Contents
Executive summary ............................................................................................ 3
1. Case study: polypharmacy in the elderly .............................................. 51.1 Background ................................................................................... 5 1.2 Review ........................................................................................ 10 1.3 Analysis ....................................................................................... 14 1.4 Actions ........................................................................................ 171.5 Commentary ................................................................................ 19
2. Case study: ventilation tubes .............................................................. 212.1 Background ................................................................................. 21 2.2 Review ........................................................................................ 24 2.3 Analysis ....................................................................................... 27 2.4 Actions ........................................................................................ 30 2.5 Commentary ................................................................................ 31
3. Understanding variation ....................................................................... 333.1 Types of care ............................................................................... 33 3.2 Key questions .............................................................................. 33
4. Addressing variation ............................................................................ 384.1 Need to manage variation ............................................................ 38 4.2 Approaches for managing variation ............................................. 38
5. References ............................................................................................ 43
Published May 2014 by the Health Quality & Safety Commission, PO Box 25496, Wellington 6146, New Zealand
ISBN: 978-0-478-38580-9 (print) ISBN: 978-0-478-38581-6 (online)
Available online at: www.hqsc.govt.nz

Executive summary Addressing variation in health services is one of the major challenges for
clinicians and managers, both in New Zealand and internationally. Observing
variation raises difficult questions about the equity, quality and consistency of
care, and is an important starting point for quality improvement and service
development. Better management of variation is one of the core elements of
performance improvement identified by an Expert Advisory Group to the Ministry
of Health in developing a new Integrated Performance and Incentive Framework
(Expert Advisory Group 2014).
The Health Quality & Safety Commission’s Atlas of Healthcare Variation (the
HQSC Atlas) is a starting point for analysing variation in a local area, and for
developing service improvement activities to address variation. This guidance
provides advice and examples of analysing variation and working towards
reducing variability and improving care. It considers two case studies of variation
derived from the HQSC Atlas and applies a generic framework to each in order to
tease out the issues relevant to the local population, and to identify priorities for
quality improvement. The two case studies are polypharmacy in the elderly,
analysed in the context of the Canterbury population, and the use of ventilation
tubes (grommets) for children under five, analysed in the context of the
Waitematā population.
The generic framework considers these questions:
• Is there uncertainty or ambiguity in the clinical evidence?
• Are there quality issues?
• Is there inequity for patients?
• Is there inefficient use of resources?
• What environmental and population factors are relevant?
• How much variation should you expect?
In the examples of the two case studies this approach leads to quite different
conclusions about the most productive approach for improving quality of care for
the local population. In the case of polypharmacy the indicated approach is
3

centred around improved information and support for clinicians, while in the case
of grommets, patient expectation and information are key strategies.
Ultimately, managing variation is about the core functions of clinical governance.
Both within New Zealand and internationally there is increasing interest in using
observations of variation as the starting point for identifying and prioritising quality
improvement and clinical governance activities. The HQSC Atlas approach can
support careful analysis, judicious use of clinical judgement, and challenging
work with clinical professionals. Effectively utilised, there is enormous potential
for positive effect in the form of improved health services for patients and
communities.
4

1. Case study: polypharmacy in the elderly
1.1 Background Polypharmacy is defined in various ways, including: the use of multiple
medications or medications which are not indicated; inappropriate or
unnecessary drug use; use of many or more concurrent medicines; mismatch
between medicine and diagnosis; or potentially inappropriate prescribing. Where
many definitions are possible, it is important to identify the definition which is
most meaningful in the local context, and to the clinicians who will be involved in
the discussion about addressing variation.
Since elderly people have a higher rate of comorbid conditions than younger
people, applying routine treatment guidelines can easily lead to polypharmacy.
This can bring risks of adverse effects and interactions, non-adherence,
medication errors, falls, hospital admission and increased mortality.
Polypharmacy raises difficult issues about the application of clinical evidence to
the case of complex patients with multiple comorbidities.
Atlas information
The HQSC Atlas provides several views of polypharmacy data. It provides data
for people aged 65 and older, and specific measures for:
• people receiving five or more long-term medications • people receiving five to seven long-term medications • people receiving eight to ten long-term medications • people receiving 11 or more long-term medications.
There are particular issues of risk, especially for falls, where sedatives and other
psychoactive medicines are involved. Combinations of other medicines with
anticoagulants can also flag clinical risk. The HQSC Atlas therefore provides
specific cuts of data for people who receive:
5

• an antipsychotic • benzodiazepine/zopiclone • both an antipsychotic and a benzodiazepine • both an antiplatelet and an anticoagulant.
Atlas results for Canterbury
In 2009, the HQSC Atlas shows that moderate polypharmacy (5 to 7 long-term
medicines) for people aged over 64 in Canterbury is not higher than across the
rest of New Zealand, but that Canterbury is significantly higher than the rest of
New Zealand in the number of people aged over 64 with 8 to 10, and 11 or more,
medications.
Canterbury is shown as purple in Figures 1–6 and Figure 8 below.
Figure 1: Canterbury – 5 to 7 long-term medications 2009
Figure 2: Canterbury – 8 to 10 long-term medications 2009
6

Figure 3: Canterbury – 11 or more long-term medications 2009
In 2009 Canterbury had the highest rate of antipsychotic prescribing for the
elderly in New Zealand, by a substantial margin.
Figure 4: Antipsychotics for people aged 65 and over 2009
By contrast the rate of benzodiazepines for people aged over 64 was not
significantly higher in Canterbury than the New Zealand average.
Figure 5: Benzodiazepines for people aged 65 and over 2009
7
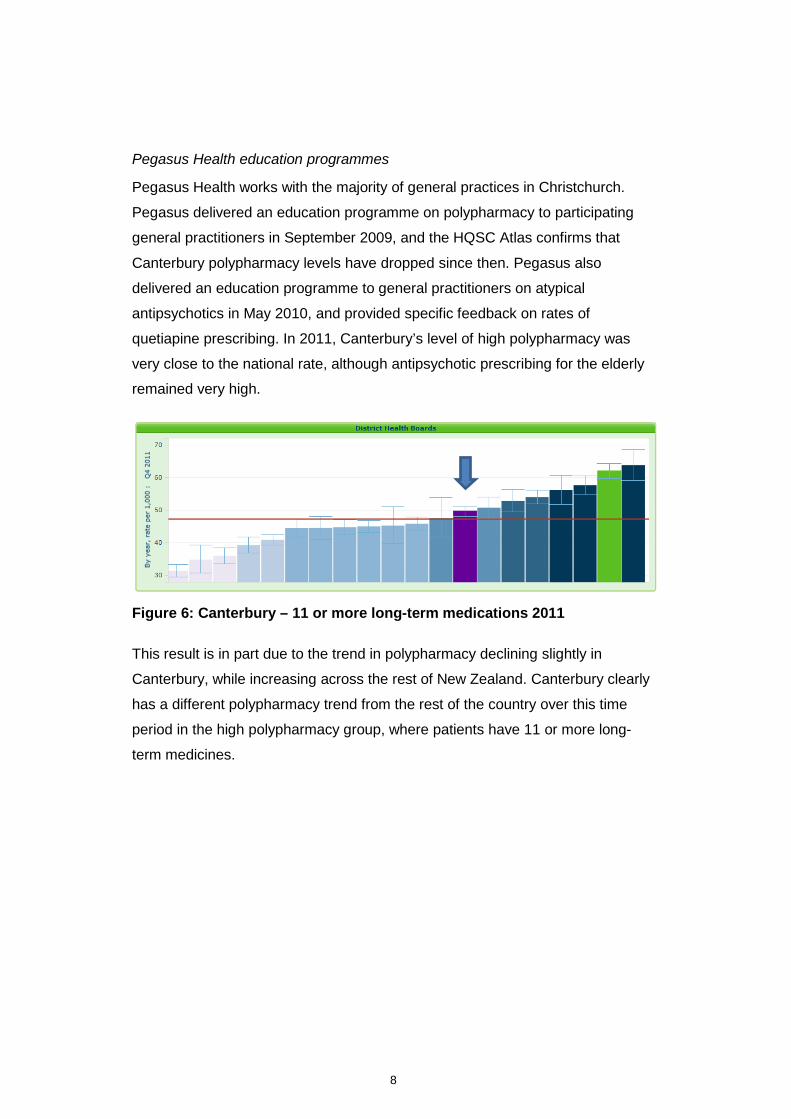
Pegasus Health education programmes
Pegasus Health works with the majority of general practices in Christchurch.
Pegasus delivered an education programme on polypharmacy to participating
general practitioners in September 2009, and the HQSC Atlas confirms that
Canterbury polypharmacy levels have dropped since then. Pegasus also
delivered an education programme to general practitioners on atypical
antipsychotics in May 2010, and provided specific feedback on rates of
quetiapine prescribing. In 2011, Canterbury’s level of high polypharmacy was
very close to the national rate, although antipsychotic prescribing for the elderly
remained very high.
Figure 6: Canterbury – 11 or more long-term medications 2011
This result is in part due to the trend in polypharmacy declining slightly in
Canterbury, while increasing across the rest of New Zealand. Canterbury clearly
has a different polypharmacy trend from the rest of the country over this time
period in the high polypharmacy group, where patients have 11 or more long-
term medicines.
8

Figure 7: Patients aged 65+ with 11 or more medications 2009–2011
Figure 8: Antipsychotics for people aged 65 and over 2011
While Canterbury is high for antipsychotics across all age bands for the elderly,
this is particularly the case for the very elderly, aged 85 and over.
Figure 9: Antipsychotics by age band
9

1.2 Review Are the data complete and accurate?
The data used to analyse variation are very complete and accurate in terms of
dispensed prescription medicines, although prescribed (but not dispensed) and
over-the-counter medication are not included in the data. The national dataset on
dispensing has the advantage of being nationally validated and regularly
updated. The challenge is that these data cannot easily be linked to patient
denominator information within a PHO, making analysis at the level of individual
prescriber very difficult, if not impossible, to conduct robustly. This is particularly
the case in polypharmacy, because it is inherent in the nature of the problem that
there will often be many prescribers involved in the care of the patient, so
attributing prescribing decisions to any one practitioner is difficult to do in a robust
fashion. In using the HQSC Atlas data as a starting point for looking at
polypharmacy in Canterbury, the analysis therefore focuses upon describing
patterns of polypharmacy across the district, and is complemented by providing
query files to general practitioners to facilitate their analysis of data from their
own practice systems.
The difficulty with facilitating analysis of data from practice management systems
is that, since it is clear that many different prescribers are commonly involved in
the care of this patient group, a practice management system may only capture
part of the prescribing picture for a given patient. In this case the data, while
readily accessible to the general practitioner, may be incomplete, and provide
limited support for reviewing patient management.
The answers to these challenges involve working to improve information at two
levels. The first is to continue the implementation of shared care records, allowing
general practitioners, pharmacists and hospital clinicians to share information for
the care of individual patients. In the case of Canterbury, electronic shared care
records are well down the path of implementation, and are supporting clinicians
to have more complete information about the care provided to patients under
their management.
The second challenge is to improve the management of national pharmaceutical
datasets so that they can be linked, securely and with appropriate restrictions
10

upon access and use, to denominator data from patient registers. From the
perspective of analysing variation in prescribing within a district, this allows
significantly more valuable analysis to be performed in a robust fashion, and
information to be provided to clinicians about their own practice.
Is there uncertainty or ambiguity in the clinical evidence?
There is both clarity and uncertainty in clinical evidence around polypharmacy,
summarised in the HQSC Atlas. Evidence of the downsides of polypharmacy is
clear, both in New Zealand and international data, with increased medicine
interactions, and hospitalisations (Davis et al 2002). Polypharmacy is clearly
associated with increased risk of side effects, interactions, adverse events and
hospital admissions (Patterson et al 2012). There is a lack of evidence for the use
of antipsychotics in the elderly.
At another level, evidence about polypharmacy in disease management is often
unclear, or the applicability of evidence is uncertain. If practice guidelines focus
on advice for the management of patients with a single disease, the prescriber
may be left with considerable uncertainty about the best management of a patient
with complex comorbidities. Polypharmacy for the elderly, then, is a phenomenon
which emerges in the presence of considerable uncertainty at the individual level
about the clinical best practice, and there is scope to provide advice and support
to prescribers who work within this uncertain environment.
Are there quality issues?
Variation in polypharmacy primarily raises questions about quality of care. There
is extensive material which can be provided to local prescribers about adverse
events, and about addressing polypharmacy for elderly people (eg, Patterson et
al 2012), while New Zealand studies have been conducted which document the
level of hospital admission which can be attributed to medication error, strongly
associated with polypharmacy (Davis et al 2002).
Is there inequity for patients?
Polypharmacy is not an equity issue in itself, although the consequences of
polypharmacy may fall out differently for patients in different categories of age,
sex and ethnicity. Polypharmacy may need to be balanced against the potential
for unmet need for medicines for some population groups.
11

Is there inefficient use of resources?
Most variation in polypharmacy does not directly raise issues about the inefficient
use of health system resources, although where the consequences of
polypharmacy involve pharmacists in addressing complex medication issues, or
avoidable hospital activity as a consequence of adverse events, polypharmacy
may be associated with avoidable use of health care resources.
Where polypharmacy variation may raise a more direct question about the
efficient use of health care resources is in the use of antipsychotics. The
antipsychotics olanzapine, quetiapine and risperidone accounted for $2.9 million
in medicine cost for the Canterbury health system in the 2009 calendar year, with
prescribing analysis suggesting that low-dose off-label prescribing is likely to
account for a significant element of this, particularly with quetiapine. There may
well be potential to redirect some of this health care resource to other more
beneficial uses.
What environmental and population factors are relevant?
There are many complex environmental factors which could increase or decrease
the prevalence of polypharmacy in a given area, or for a given prescriber. In
Canterbury these include:
• information systems, and access to shared care records, allowing clinicians to have a comprehensive view of care provided to individual patients. These have been widely implemented in Canterbury since 2010.
• the presence of multidisciplinary medicines review programmes, such as medicines therapy assessment or medicines management programmes. Medicines management has been implemented in Canterbury, with a large number of patients having their medication reviewed by a community pharmacist.
• hospital discharge policies, and secondary care clinical practices
• the general health of the population. In an area of high morbidity, a greater degree of polypharmacy might be expected. While Canterbury has a large population of elderly people, there is no specific reason to think that they have a higher general level of morbidity than other parts of New Zealand.
• the number of psycho-geriatric beds in the district, which is high in Canterbury
12

• the Canterbury earthquakes. These have likely had an adverse impact on the physical and mental health of the population, potentially creating marked increase in health need for some population groups. Evidence from other natural disasters finds a particular impact on mental health across the population, which anecdotally is supported by the experience in Canterbury.
Each of these factors can have a strong influence upon the environment in which
individual primary care practitioners manage patients with complex comorbidity.
System-level structures, such as shared information systems and medicines
review programmes, have the potential to make a marked difference to the
information available to prescribers, and to support the decisions they make with
individual patients.
The other important system-level factor arises from hospital practice. As with
many aspects of care, particular practices or procedures in a hospital can affect a
whole population, across many different primary care services. In the case of
Canterbury, hospital services have engaged in a specific programme for
reviewing polypharmacy upon discharge (known as the Pill Pruning Project),
which in this case is complementary to education programmes delivered to
general practitioners.
How much variation should you expect?
At the inter-district level it might be expected that there would be substantial
variation in polypharmacy, since there are a number of environmental or system-
level factors which are likely to vary across districts. But within a district the
numbers of elderly receiving multiple medications is large, and the effect of
random variation between individual prescribers is likely to be small. It could be
expected that within a district there should be relatively little polypharmacy
variation, although measuring this robustly is complex because of the difficulty of
linking patients to prescribers in a simple and robust fashion. If there is
substantial variation between practitioners this is likely to represent an issue of
quality of care, and it could reasonably be expected that this should narrow with
improved clinical guidance and information systems.
13

1.3 Analysis The data issues in analysing polypharmacy are complex. The dataset available to
Pegasus comes from the national pharmaceutical data warehouse, available to
most DHBs and many PHOs and networks, and is the same basic source of
information used by HQSC to develop the Atlas. This dataset is comprehensive,
very complete and well validated.
The major challenge with the data is that, while prescribers are identified by
medical council number, patient identifiers are encrypted. This means that patient
information cannot be linked to other data, such as PHO registers. Consequently,
attributing the prescribing for any one patient to a particular prescriber is difficult.
For example, in the last quarter of 2009, 3862 people were prescribed 11 or more
continued medicines, using a methodology similar to that in the HQSC Atlas.
These patients had an average of 3.6 different prescribers involved in their care
over a six-month period. Only 16 percent of these patients were prescribed
medicines by a single doctor in the six-month period.
Figure 10: Number of prescribers per patient
Although in principle a patient’s general practitioner should have an overall
coordinating role in prescribing medication for an individual person, and reviewing
prescribing post hospital discharge is an important task for a general practitioner,
14

the data do not support attribution of an individual’s care to registration with a
specific general practitioner. This means firstly that analysis of variation within the
district is very difficult, and secondly that it is not possible to use these data to
feed back polypharmacy information to individual prescribers with a high degree
of robustness.
The strategy to address this is twofold:
• Firstly, use the pharmaceutical warehouse data to describe the general characteristics of polypharmacy in this population.
• Secondly, provide prescribers with tools to analyse their own information from practice data.
At Therapeutic Group level 2, the most common categories of medicines for
patients receiving 5–7 medicines are shown in Table 1.
Therapeutic Group 2 Patients receiving medicine Analgesics 12,918
Antithrombotic Agents 10,085 Lipid-Modifying Agents 7738 Agents Affecting the Renin-Angiotensin
7395
Beta Adrenoceptor Blockers 6769 Antiulcerants 5163 Diuretics 5077 Vitamins 4625 Calcium Channel Blockers 4251 Minerals 3248 Antidepressants 2946 Diabetes 2455 Laxatives 1714 Drugs Affecting Bone Metabolism 1662 Thyroid and Antithyroid Agents 1561 Alpha Adrenoceptor Blockers 1532 Sedatives and Hypnotics 1434 Non-Steroidal Anti-Inflammatory Drugs 1177 Nasal Preparations 1058 Nitrates 1027
Table 1: Top 20 medicines for patients receiving 5–7 medicines 2009
15
The contents and rank order of medicines in this table is similar for patients
receiving a larger number of medicines, and across the two periods for which
data were available. It is unsurprising that the core medicines are those
associated with heart disease and secondary prevention, with laxatives, diabetes,
antidepressants, thyroid and sedative agents entering the list lower down.
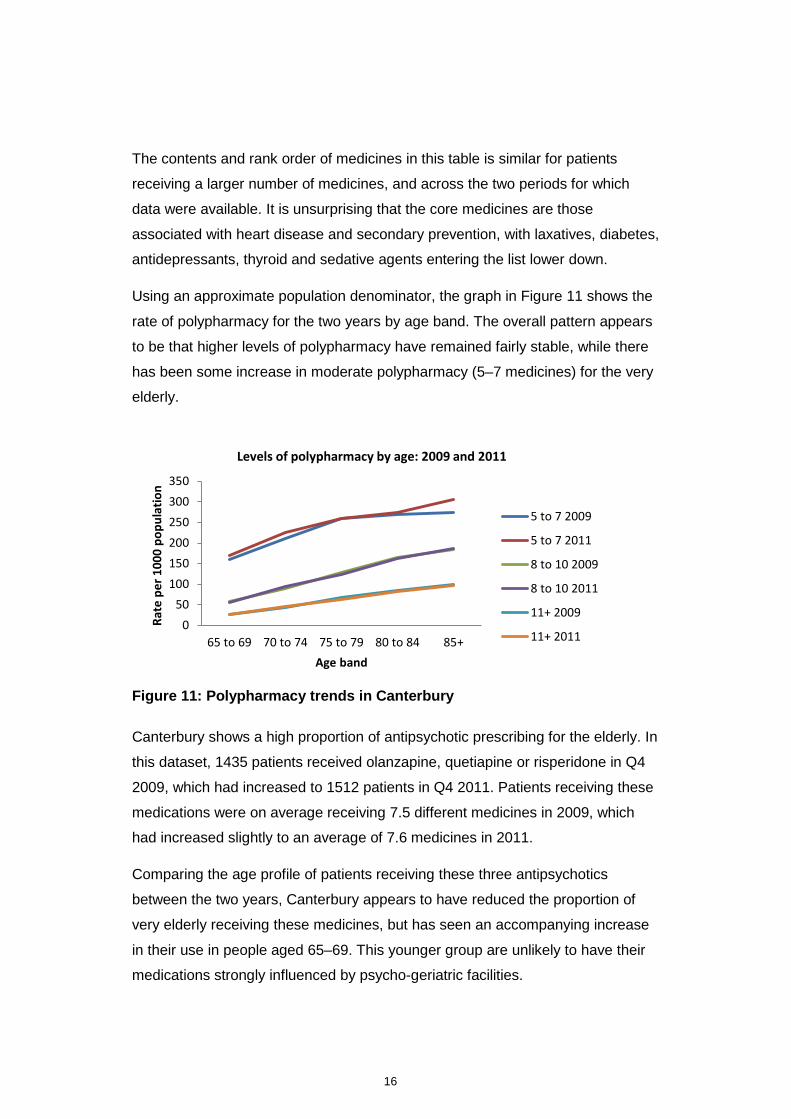
Using an approximate population denominator, the graph in Figure 11 shows the
rate of polypharmacy for the two years by age band. The overall pattern appears
to be that higher levels of polypharmacy have remained fairly stable, while there
has been some increase in moderate polypharmacy (5–7 medicines) for the very
elderly.
Figure 11: Polypharmacy trends in Canterbury
Canterbury shows a high proportion of antipsychotic prescribing for the elderly. In
this dataset, 1435 patients received olanzapine, quetiapine or risperidone in Q4
2009, which had increased to 1512 patients in Q4 2011. Patients receiving these
medications were on average receiving 7.5 different medicines in 2009, which
had increased slightly to an average of 7.6 medicines in 2011.
Comparing the age profile of patients receiving these three antipsychotics
between the two years, Canterbury appears to have reduced the proportion of
very elderly receiving these medicines, but has seen an accompanying increase
in their use in people aged 65–69. This younger group are unlikely to have their
medications strongly influenced by psycho-geriatric facilities.
050
100150200250300350
65 to 69 70 to 74 75 to 79 80 to 84 85+
Rate
per
100
0 po
pula
tion
Age band
Levels of polypharmacy by age: 2009 and 2011
5 to 7 2009
5 to 7 2011
8 to 10 2009
8 to 10 2011
11+ 2009
11+ 2011
16
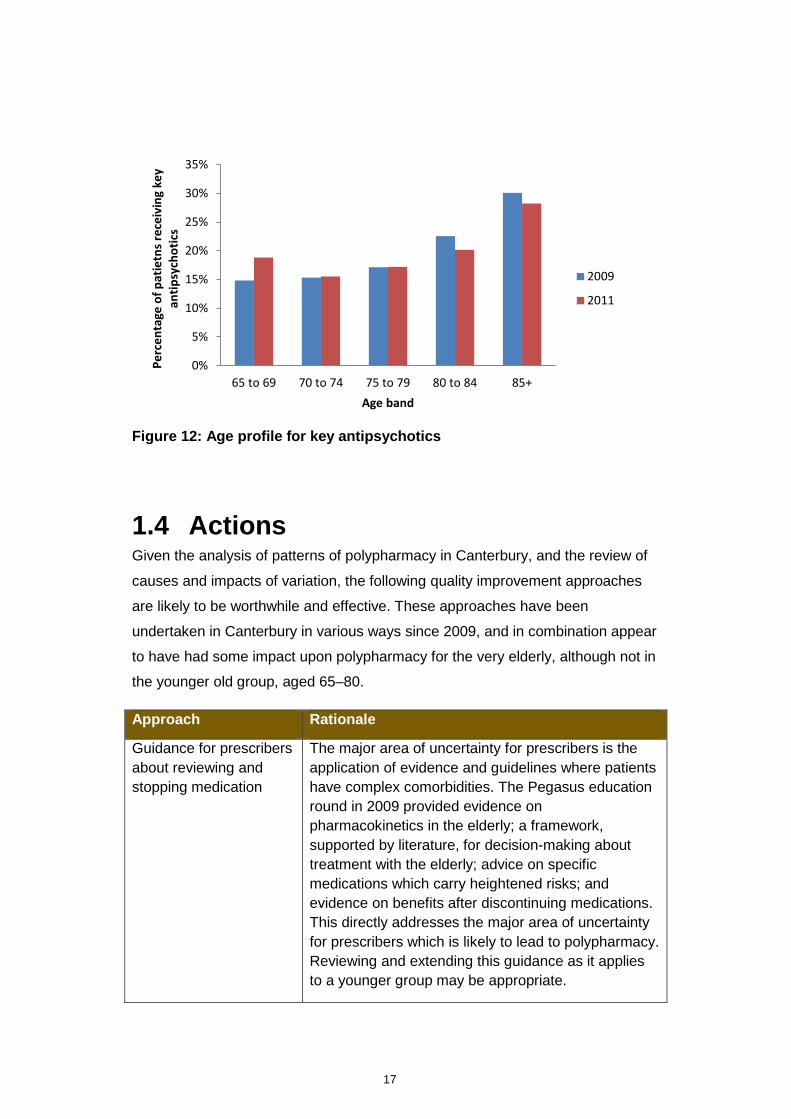
Figure 12: Age profile for key antipsychotics
1.4 Actions Given the analysis of patterns of polypharmacy in Canterbury, and the review of
causes and impacts of variation, the following quality improvement approaches
are likely to be worthwhile and effective. These approaches have been
undertaken in Canterbury in various ways since 2009, and in combination appear
to have had some impact upon polypharmacy for the very elderly, although not in
the younger old group, aged 65–80.
Approach Rationale
Guidance for prescribers about reviewing and stopping medication
The major area of uncertainty for prescribers is the application of evidence and guidelines where patients have complex comorbidities. The Pegasus education round in 2009 provided evidence on pharmacokinetics in the elderly; a framework, supported by literature, for decision-making about treatment with the elderly; advice on specific medications which carry heightened risks; and evidence on benefits after discontinuing medications. This directly addresses the major area of uncertainty for prescribers which is likely to lead to polypharmacy. Reviewing and extending this guidance as it applies to a younger group may be appropriate.
0%
5%
10%
15%
20%
25%
30%
35%
65 to 69 70 to 74 75 to 79 80 to 84 85+
Perc
enta
ge o
f pat
ietn
s rec
eivi
ng k
ey
antip
sych
otic
s
Age band
2009
2011
17

Provide specific evidence and guidance on antipsychotic use
An education round on atypical antipsychotics was delivered in 2010, and further work may be needed to monitor and follow up in this area.
Improved sharing of patient information
Polypharmacy touches upon the activity of multiple health professionals. Improving the shared information between health professionals supports prescribers in making informed decisions with patients, and helps to make them aware of the full range of medicines being received by a patient.
Facilitate prescribers’ analysis of their own data.
Pegasus provided MedTech queries to help general practitioners identify patients from their own practices who receive multiple long-term medications. Analysis of practice could be further supported by follow-up and structured comparison of data in peer groups.
Work with secondary care clinicians to align primary and secondary care prescribing patterns
Hospital activity is likely to be an important driver of prescribing patterns post discharge, supporting secondary care clinicians with evidence and guidance, as well as designing hospital processes. An important multidisciplinary approach is likely to be needed for the management of psychogeriatric beds, where there may be a particular issue in Canterbury.
As with any analysis of health data, there are many questions which arise and
which are worthy of further investigation. Some of these issues are susceptible to
further analysis with information which is already available in primary care in
Canterbury, while other questions may require further information, or better
capacity to link datasets to support robust analysis.
Key questions for further investigation are:
• What is driving the use of antipsychotics in the younger elderly?
• Can prescribing data be attributed accurately to general practice populations?
• If prescribing data could be linked to hospital discharge data, could specific analysis of patterns of medication post discharge be examined and fed back to both primary and secondary clinicians?
• How variable is the uptake of medicines management programmes and the use of multidisciplinary pharmacist input to manage polypharmacy across the district?
18

1.5 Commentary This case study of variation in polypharmacy highlights a number of points.
• Because the same data were available, and the HQSC Atlas website provides explicit documentation of the methodology used, reproducing the particular definitions of polypharmacy used in the HQSC Atlas was reasonably straightforward. There were some ambiguities in the documented method, including whether the years used were calendar or financial.
• Because the HQSC Atlas definition of polypharmacy was easily reproduced, various slices of Atlas data for the particular district were a useful starting point, and provided a good overall context for the pattern and trend of variation.
• In this case, using national data to provide direct feedback to individual primary care prescribers is difficult to do robustly. Providing data to general practitioners on their own practice requires working with them to use their own practice management system information.
• It was possible to extend some elements of the analysis to tease out additional components of variation at a local level, although this was limited by the data available.
• In this case, a number of quality improvement initiatives in this area had already been developed and implemented, and may have contributed to the stable level of polypharmacy, compared to the national trend.
• Reviewing polypharmacy for Canterbury reveals a number of environmental drivers of polypharmacy, suggesting that a quality improvement focus should be both upon primary care prescribers and upon system factors, including clinical information systems, hospital prescribing and discharge, and delivering multidisciplinary medicine review programmes.
• Pharmaceutical data are very rich, but they are also complex to analyse. It is important to be able to manage a large dataset with a suitable database programme, and to be meticulous about the logic of calculating patient ages and rates. It is easy for simple mistakes to produce artefactual conclusions, and it is important that analysis be peer reviewed thoroughly before being shared with clinicians.
Overall, even in an area as complex and multifactorial as polypharmacy, where
the ability to link data to individual practitioner is limited, a systematic approach
suggests a range of quality improvement interventions which can be undertaken
within a district. In a complex field such as this it is likely that a number of
simultaneous approaches to the issue will be more successful than a single
approach, so the combination of working with individual prescribers with system-
19

level approaches such as information sharing, the pharmacist medicines
management programme, and hospital “pill pruning project” will all contribute
towards a result. The example in Canterbury, where the trend in polypharmacy
has remained steady by comparison with a nationally increasing trajectory of
polypharmacy, suggests that these approaches can, in combination, have some
impact.
20
2. Case study: ventilation tubes
2.1 Background In New Zealand, ventilation tubes (commonly known as grommets) are most
commonly used to treat recurrent acute otitis media and otitis media with effusion
(OME, or ‘glue ear’). Over 90 percent of children in New Zealand are believed to
experience an episode of OME before they reach school age. Alternative
treatments for these conditions include watchful waiting and antibiotics.
A review of evidence for a New Zealand PHO in 2012 found that while a number
of Cochrane reviews had shown that grommets were beneficial in improving
hearing over a period of six months post-surgery, longer term outcomes were no
better under surgery than without. The conclusion is that in children with OME,
the effect of grommets on hearing is small and diminishes after 6 to 9 months, by
which time natural resolution also leads to improved hearing in non-surgically
treated children. While grommets may reduce recurrent acute otitis media, they
also bring complications, including an increased risk of mild tympanosclerosis,
and tympanic membrane abnormalities.
Atlas information
The HQSC Atlas provides several views of grommet data for patients aged under
15. The unit of measure is the number of grommet surgeries performed per 1000
population. This is summarised by the rate per year by DHB (for three years,
ending June 2012). The data can be broken down by ethnicity and five-year age
band.
Atlas results for Waitematā
Between July 2009 and July 2012, Waitematā had an average annual rate of 7.5
grommets per 1000 population (for patients under the age of 15). This is 14
percent higher than the national average of 6.6. The rate in Waitematā increased
over the three years, while the national rate remained constant over the time
period.
21

Figure 13: Grommet surgeries per 1000 population by DHB, three-year average June 2009 to July 2012
Across the country the highest rate of grommets is in those aged 0–4 and who
are Māori. In Waitematā this difference is greater than the national average. This
can be seen in Figures 14 and 15. Waitematā appears to differ from the national
average, particularly in the rate of grommet use for younger children, under 5,
rather than for children aged 5 to 14 (orange = Waitematā, red = national average).
22

Figure 14: Grommet surgery by age group 2012
Figure 15: Grommet surgery by ethnic group 2012
The significant difference in grommets for Waitematā therefore appears to be in
the high rate which they provide for children under 5, and for Māori children, in
particular.
Approximately half of New Zealand’s DHBs have guidelines for referral and for
surgery. Waitematā have guidelines for both.
Referral Surgery
Waitematā Yes Yes
Other DHBs 10 Yes 9 No 9 Yes 10 No
Table 2: OME guidelines in DHBs
23
2.2 Review Are the data complete and accurate?
The data in the HQSC Atlas derive from the National Minimum Dataset. While
this is therefore complete and accurate on its own terms, there are a number of
issues which might limit the conclusions which could be drawn.
• Where there is a vigorous private health care market, as is the case in Waitematā, privately funded surgery will not appear in the National Minimum Dataset. This could have the impact of underestimating the true level of referral for grommets in some areas, and of creating an appearance of variation where none exists. However, in the case of Waitematā, the overall rate is higher than in the rest of New Zealand, especially for younger children, even without considering the additional volume of surgery provided privately. The impact of missing private sector data would therefore be to underestimate Waitematā’s rate of grommet use, making the difference from the national rate even greater than estimated in this dataset.
• The HQSC methodology does not distinguish between grommet procedures for a single ventilation tube, or where two tubes are inserted at once. Different practice across different hospitals could potentially distort comparisons, if some hospitals have a policy of doing only one ear at a time while others will do both.
There is considerable potential for analysing local data, but this would require
collaboration between PHOs and the DHB. The best approach would probably be
to try to link data, with suitable privacy protocols in place, between the DHB for
inpatient and outpatient care, and practice registers, for the denominator of
enrolled children. Analyses which could be performed would include:
• general practice rates of grommet insertion
• more detailed analysis of deprivation and ethnicity effects in the rate of grommet insertion, and how they interact
• potentially linking to prescribing data to look at how many episodes of antibiotics have been used in the population of children who have received grommets
• if diagnosis data are available, measuring the proportion of children diagnosed with acute otitis media and OME who receive grommets.
24

As an initial starting point for locality analysis, it is possible to use national data to
examine whether there is variation within Waitematā, albeit on a geographical
basis rather than on the basis of enrolment with different practices.
Is there uncertainty or ambiguity in the clinical evidence?
The evidence on benefits and risks from use of grommets is relatively clear.
There are several Cochrane reviews showing relatively limited and short-term
benefit, and guidelines have been made available in Waitematā. The National
Health Committee issued a technology note in January 2013 summarising the
evidence for use of grommets, which noted the substantial variation in use of the
procedure across DHBs, and that no standard pathway of care exists across
DHBs.
Overall, there is relatively little uncertainty in the evidence for the clinical impact
and appropriate use of grommets.
Are there quality issues?
Inappropriate use of grommets can risk exposing children to complications such
as tympanosclerosis, which may in turn have a moderate impact upon hearing.
Use of grommets also exposes children to anaesthetic risk. The quality issue is
generally about whether children are exposed to unnecessary care which brings
little benefit.
Is there inequity for patients?
At one level there is clearly a difference in the use of grommets between Māori
children and those of other ethnicities. The high use among Māori children could
reflect a greater prevalence of OME and acute otitis media in this population, or it
could reflect later presentation with greater recurrence or more severity, thereby
raising the probability of referral. The major question of inequity which variation in
grommet use raises is about the effective provision of preventive care for children
of Māori ethnicity. The Communicable Disease Centre recommends avoiding
second-hand smoke and air pollution, ensuring full immunisation and
breastfeeding as preventive measures for paediatric ear infections.
25

Is there inefficient use of resources?
Elective surgical procedures are in high demand in New Zealand, and the
shortage of supply and length of waiting time to receive surgery are prominent
and politically controversial issues. If elective surgery is being used
inappropriately, or with a low level of benefit, this represents an inefficient use of
resources which could potentially be better used for the health of the population.
In this case the resources include the specialist surgical workforce, both in
assessment consultations and in theatre time, as well as the nursing and allied
workforce involved in delivering the services, the physical resources of theatre,
and the time and resources of the patient and their family, who may have to set
aside time and possibly travel to hospital services. There is considerable scope
for variation in use of grommets to suggest inefficient use of health system
resources.
What environmental and population factors are relevant?
As well as the individual referral decisions of clinicians in primary care, a number
of environmental factors could influence the rate of grommet use.
• Patient expectations and community experience. Grommets are a good example of preference-sensitive care, in which the benefits and downsides are not necessarily clear. In this case community expectations of the benefit of grommet use could be an important factor in the overall utilisation of ventilation tubes, and there may be a place for improving consumer information for parents.
• Surgical practice. Since hospital services tend to be relatively centralised within a district, the practice of a small number of hospital specialists can influence patterns of care across a whole population.
• High prevalence rates. If there is a higher prevalence rate of OME and acute otitis media, then the issue is less one of patterns of health care, and more one of epidemiology and prevention
• High levels of severity. If patients present later, having experienced more occurrences of OME and acute otitis media, this may generate a higher level of referral. Higher levels of severity can be related to health-seeking behaviour, which can vary markedly across different cultures, and with barriers to accessing primary care.
Environmental and population factors could potentially be very important in
determining local rates of use of grommets.
26

How much variation should you expect?
While there is variation across New Zealand, at a rate of approximately 10 per
1000 under-5-year-olds, grommets are still a relatively rare procedure in
population terms. The statistics of this are robust at district level (the HQSC Atlas
shows clear differences with confidence intervals between DHBs), but analysis
may be more difficult within districts, as a relatively unusual procedure with
smaller numbers of children could be difficult to compare across practices and
small communities. Random variability is likely to be a challenge for analysis.
This issue is examined further in the analysis below.
2.3 Analysis The data used for this analysis were extracted from the National Minimum
Dataset, and therefore have the limitation that they do not include information on
private sector procedures, nor can they be linked to primary care denominator
data. But these limitations do not mean that the information is not useful for
drawing conclusions about variation, equity and effective use of public health
resources. The data do include more detailed area information, based upon
patient residence, which allow some degree of analysis of whether there is
variation within the district.
Compared to the rest of New Zealand, Waitematā has:
• approximately half the proportion of Māori people, and nearly twice the proportion of Asian. Since Māori have a high rate of grommets insertion, this would predict a lower overall rate for Waitematā, all things being equal.
• less deprivation (mean 2.7 vs 3.1, on the NZDep06 quintile scale), with only 10 percent of people in the most deprived quintile
• similar sex and age distribution to the national average.
Within the Waitematā district, there are 144 area units, with an average of 250
children under 5 living in each one. In the year ending June 2012 there were 552
ventilation tube surgeries for children in Waitematā. The rate of surgery for
children across the area units in Waitematā is shown in Figure 16.
27

Figure 16: Grommet surgery/1000 children aged 0–4 by census area unit
Rates of grommet insertion per 1000 children under five appear to vary markedly
across the district. However, while the mean number of children living in a census
area unit is approximately 250, there is a considerable range, and some areas
have smaller numbers of young children. A simulation of how much variation is
expected across Waitematā area units shows that the expected variation is
almost identical to the variation actually observed. While there is a wide
distribution with a long tail of higher rates, this is exactly what would be expected
on the basis of a relatively rare intervention at population level (see Figure 17 –
the coloured bars show the actual distribution, the black line shows the simulated
distribution, with 95 percent confidence intervals in broken lines above and
below).
28

Figure 17: Expected and observed variation in grommet surgery rates by census area unit
Within Waitematā, there was no strong relationship observed between the
deprivation of patients and the rate of grommets, although there is a slightly
higher rate in children from deprivation quintile four. The interaction between
deprivation and ethnicity could be a subject of further analysis at local level.
29

Figure 18: Grommet operations by deprivation category/1000 children 0–4
2.4 Actions Given this analysis, and what is already known about the issue of ventilation
tubes, the following approaches are likely to be worth investigating. These are
premised upon the basis that Waitematā has a high rate of grommet use as a
district, although there is little evidence of strong variation within the district. An
analysis on the basis of enrolled patient denominators might change this view,
but on the present information the focus of quality improvement should be much
more upon shifting the whole curve of grommet use within Waitematā, rather than
focusing on variation across individual referrers and specific practice populations.
Essentially, reviewing this variation suggests that the issue is one of significance,
with implications for both the quality of care and the efficient use of health
resources, and that environmental factors operating across the district are likely
to be more important than specific aspects of practice style and difference in
clinical decision-making among referrers.
30

Approach Rationale
Review patient information resources
If patient demand is a major factor, then resources to support general practice in informing patients about the evidence on benefit and risk of ventilation tubes may help referrers to manage demand, and support referrers to engage in watchful waiting, rather than early referral. There may be potential to work with preschool education facilities and other community organisations to disseminate information to the wider population, and to modify demand for the procedure.
Undertake clinical audit Support referrers to undertake clinical audit of children referred with grommets, collecting and critiquing information on presentation, recurrence, and management prior to referral.
Undertake work on prevalence of OME and acute otitis media
A possible approach could be to establish a number of pilot practices to code consistently for OME and acute otitis media, allowing accurate assessment of the local burden of disease. While Gribben et al (2012) have analysed the prevalence of acute otitis media nationally, those results do not allow differential analysis by district, and understanding whether Waitematā was different in this respect would help to inform future action. An informed planning and funding role across the health system is likely to seek the best available information on cost-effectiveness and need for grommets, and to work with funding mechanisms and pathways to match the estimate of most appropriate and cost-effective need.
2.5 Commentary This brief example of variation in ventilation tubes highlights a number of points:
• the interconnectedness of the issue across the health system, from patient information and knowledge, to referrer evidence, to surgical practice
• the importance of environmental factors in determining local patterns of health care
• apparent large local-level variation can be an artefact of small numbers and low rates, meaning that within a district, variation is a less important factor than the overall level of utilisation in the district
31

• the need for further information, but much of this is centred around the actual incidence of the disease, and understanding the nature of need and demand in the population, rather than necessarily being focused upon clinicians and their practice.
32
3. Understanding variation
3.1 Types of care A common approach to thinking about the impact of variation is to consider the
kind of care involved, and how susceptible it might be to different influences upon
clinical decision-making. Wennberg (2011) has developed the following
approach.
• Effective care: defined as interventions for which the benefits far outweigh the risks; in this case the ‘right’ rate of treatment is 100 percent of patients defined by evidence-based guidelines to be in need. Unwarranted variation is generally a matter of underuse.
• Preference-sensitive care: when more than one generally accepted treatment option is available, such as elective surgery. The right rate should depend on informed patient choice, but treatment rates can vary extensively because of differences in professional opinion.
• Supply-sensitive care: clinical activities such as doctor visits, diagnostic tests, and hospital admissions, for which the frequency of use relates to the capacity of the local health care system. The key issue with this one is that, at least in the United States, those living in regions with a high-intensity pattern of care have worse or no better survival than those living in low-intensity regions. This means that greater intensity of care does not necessarily equate to improved outcomes.
This taxonomy explicitly addresses the issue of how clinicians and patients make
decisions about care, and makes useful distinctions between the kind of
influences which might generate variation.
3.2 Key questions It is important to focus quality improvement efforts where they will make the most
difference, and to make the best judgement about the nature of a given example
of variation possible with the available data. Before trying to address variation, it
is therefore important to think about what it means and why it matters in any one
particular case. Systematically considering these questions can help in deciding
how to interpret observations of variation.
33

1 Is there uncertainty or ambiguity in the clinical evidence? Wide variation can be an indicator that clinical evidence is ambiguous or difficult
to apply, or that there is a change in practice which is spreading throughout a
group of professionals. This raises one of the fundamental issues in interpreting
variation – which is that across an observed range of practice, it can sometimes
be very difficult to identify the preferred rate of intervention or service delivery at a
population level.
2 Are there quality issues? Observing variation can raise questions about the underlying quality of care,
particularly if there is clear evidence about where an intervention should be used,
and what benefits and side effects exist. Where evidence is less clear, then
issues of quality associated with variation are likely to be more difficult to pin
down, with different points of view among professionals about what constitutes
best practice.
Where variation is suspected to be a sign of a quality problem, the challenge is
typically to seek to narrow the curve, bringing practice within a closer range of
consensus (Figure 19).
Figure 19: Narrowing a wide distribution
34
3 Is there inequity for patients? Variation can be a sign of inequity in the delivery of health services. This can
operate in two different ways.
• Inequity in resource allocation. Variation can reflect differences in the resource devoted to different populations, and can potentially reveal differences in fairness or equity of resource allocation, or underlying differences in which resources are used across different services. For example, a high intervention rate might reflect supplier-induced demand, where a high rate of supply means a high rate of delivery (eg, more private hospitals means more private surgery, even where need across populations is equal).
• Inequity of access. Inequity of access can be related to inequity of resources, but can also be a wider issue of access on the basis of timing of service delivery, financial barriers, workforce mix and availability, and other factors.
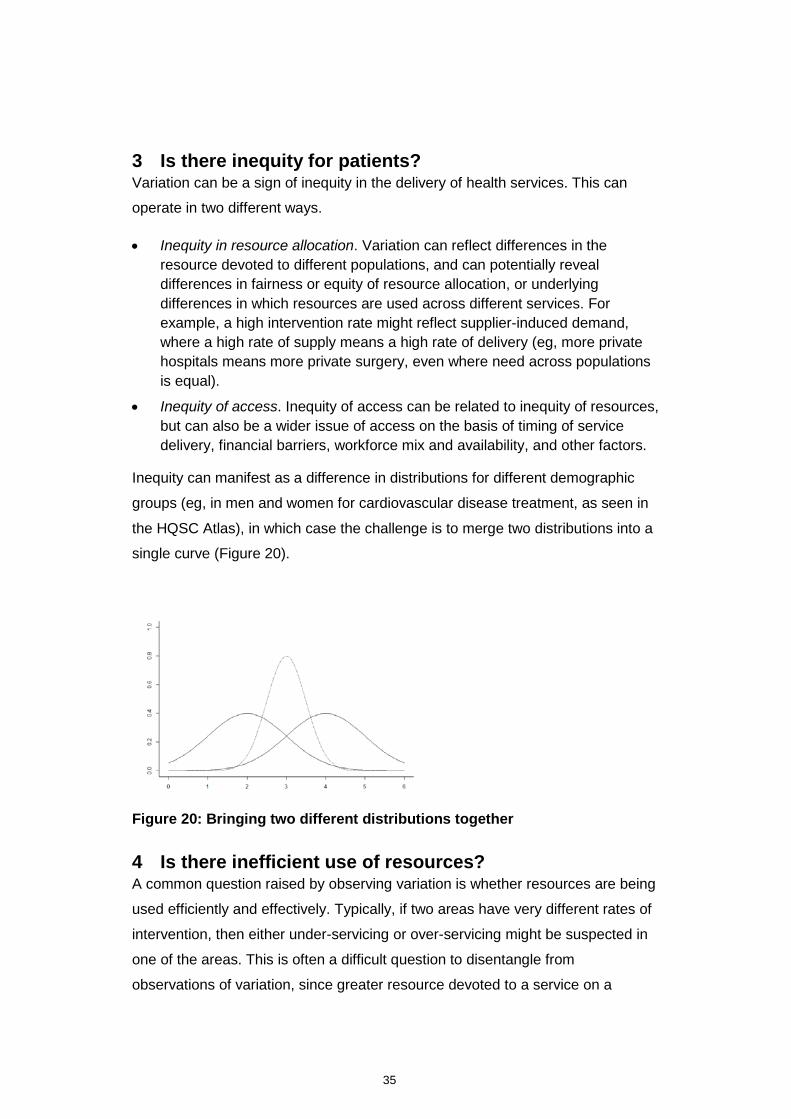
Inequity can manifest as a difference in distributions for different demographic
groups (eg, in men and women for cardiovascular disease treatment, as seen in
the HQSC Atlas), in which case the challenge is to merge two distributions into a
single curve (Figure 20).
Figure 20: Bringing two different distributions together
4 Is there inefficient use of resources? A common question raised by observing variation is whether resources are being
used efficiently and effectively. Typically, if two areas have very different rates of
intervention, then either under-servicing or over-servicing might be suspected in
one of the areas. This is often a difficult question to disentangle from
observations of variation, since greater resource devoted to a service on a
35

population basis (eg, higher prescribing of analgesics) might actually reflect a
lack of resource elsewhere in the health system (eg, waiting times for surgery).
In this case, the goal is likely to be to shift the whole curve, as well as to narrow
it, either by ensuring that at least a minimum level of resource is delivered (if the
problem is under-servicing), or setting limits to the maximum amount of service
which the system can resource.
For example, under-servicing might mean that the goal is to shift the curve to the
right, narrow the variation and set a minimum level of intervention (Figure 21).
Figure 21: Addressing under-servicing
If there is an issue of over-servicing, the challenge will be to move the curve to
the left, and to narrow the variation. If over-servicing and under-servicing both
exist at once, then the issue reduces to the general problem of improving quality,
and narrowing the distribution. Working with clinical leaders to establish
consensus on whether there is under-servicing or over-servicing for specific
interventions can play a key role in addressing issues of variation.
5 What environmental and population factors are relevant? Variation, especially across areas, can reflect a range of environmental and
population factors, as well as variation in individual clinical decision-making. Such
factors include population age, sex, ethnicity and deprivation structure, but might
also include aspects such as differing levels of hospital service provision, which
in turn can impact upon the way that primary care delivers services. Factors such
36

as rurality, or particular health-related risks (such as a dangerous road, or
presence of particular industries), could reasonably result in different ways of
delivering care and different approaches to practice at the individual clinical level.
New Zealand has a relatively localised health system, with a high level of
discretion for DHBs to make decisions in response to different needs and
priorities. So some degree of variation is to be expected, and is built into the
structure of the health system. Understanding the role of environmental
influences upon clinical practice and the delivery of care can be an important
starting point for developing service and quality improvement programmes. This
aspect of variation can be an important catalyst for thinking about what influences
clinical practice in a given area, and whether those influences are appropriate for
the needs of the population.
6 How much variation should you expect? Variation is often seen as a surprise, but many things can drive variability,
including the random statistics of small numbers, differences in training, and
differences in patient expectation. Before deciding whether variation is a problem
it can be helpful to step back and assess how much variation you should actually
expect to see.
Considering how much variation to expect can involve:
• reviewing the clarity of evidence for clinical decision-making
• assessing whether small numbers and statistical effects generate variation
• considering environmental drivers of variation across different areas.
In the end, the question of how much variation is too much is a judgement, and
pragmatically should depend upon what is believed about the impact of variation,
and whether there are ways of addressing it. If there is substantial variation in
some measure, but it does not provoke concerns about quality, equity or
efficiency, then it may not be worth devoting precious quality improvement
resources to addressing the issue. By contrast, if even a relatively small level of
variation raises serious issues about quality of care, then it is worthy of attention
and follow-up.
37
4. Addressing variation
4.1 Need to manage variation The challenges of quality, equity and efficiency are all, in themselves, good
reasons for health service organisations to use the tools available to them for
addressing variation. The direction set by the Ministry of Health Expert Advisory
Group for an Integrated Performance and Incentive Framework (IPIF) for primary
care performance explicitly envisages a focus on variation at a local level. In this
framework PHOs and DHBs take responsibility for managing resources more
effectively, and for using clinical governance mechanisms to reduce variability.
This is likely to take place at two levels: variation on national system level
indicators will be monitored centrally, while local alliances will be likely to have a
high degree of freedom to identify and address quality and resource issues within
each district across New Zealand. Reducing variation in clinical outcomes and in
effective resource use is likely to be an increasingly explicit element of
performance monitoring in New Zealand health care. There will be increasing
expectation that planners and funders will work collaboratively with service
delivery organisations to monitor and manage variation (Expert Advisory Group
2014).
4.2 Approaches for managing variation At a high level, Wennberg (2010) recommends adopting three key strategies for
addressing the challenges of variation:
• promoting organised systems of health care delivery to prevent underuse of effective care. Team medicine seems to lead to less unwarranted variation.
• establishing informed patient choice as the ethical and legal standard for decisions surrounding elective surgeries, drugs, tests, and procedures, and care at the end of life. In terms of preference-sensitive care, treating patients according to their preferences – and not giving them treatments they do not want – requires a clinical environment that supports shared decision-making and encourages the active engagement of patients in the choice of treatment.
38

• improving the science of health care delivery. In terms of supply-sensitive care, the most important challenge to the clinical and research communities is to rationalise the clinical pathways for managing chronic disease: to undertake the clinical research required to convert supply-sensitive care into evidence-based care that is effective or preference-sensitive.
The generic approach is therefore to engage in effective service improvement
and clinical governance as the mechanism for addressing the fundamental issues
raised by variation. Achieving this requires effective, expert clinical leadership
and high quality analysis, conducted by clinicians and analysts working closely
together.
The toolbox for addressing variation includes the following five key elements.
1 Good analysis (but don’t get hung up on perfection) Good quantitative analysis, informed by strong clinical expertise, is essential. It is
important for analysts to bring technical expertise about datasets, data validity
and statistical techniques, and to work closely with clinicians who can refine
questions about what is going on in the data, and understand the significance of
different observations. Ideally analysts and clinicians should work together,
interrogating data and cutting it in different ways, coming to a joint interpretation
of the observed variation which is both statistically and clinically robust.
The HQSC Atlas provides data at DHB level on a number of quality indicators.
This information is presented in context with a summary of relevant evidence for
each indicator, and with the definitions and methodology used in the underlying
analysis (circled in the Atlas page example in
Figure 22 below). This resource represents a flying start for analysis on these
indicators, since the complex job of assessing the data and developing workable
definitions that are comparable across areas has already been completed. For
example, working definitions of polypharmacy are provided in the background
material linked to Atlas pages, and these can serve as a guide for analysts to
extract and present data in a standardised and comparable format.
39
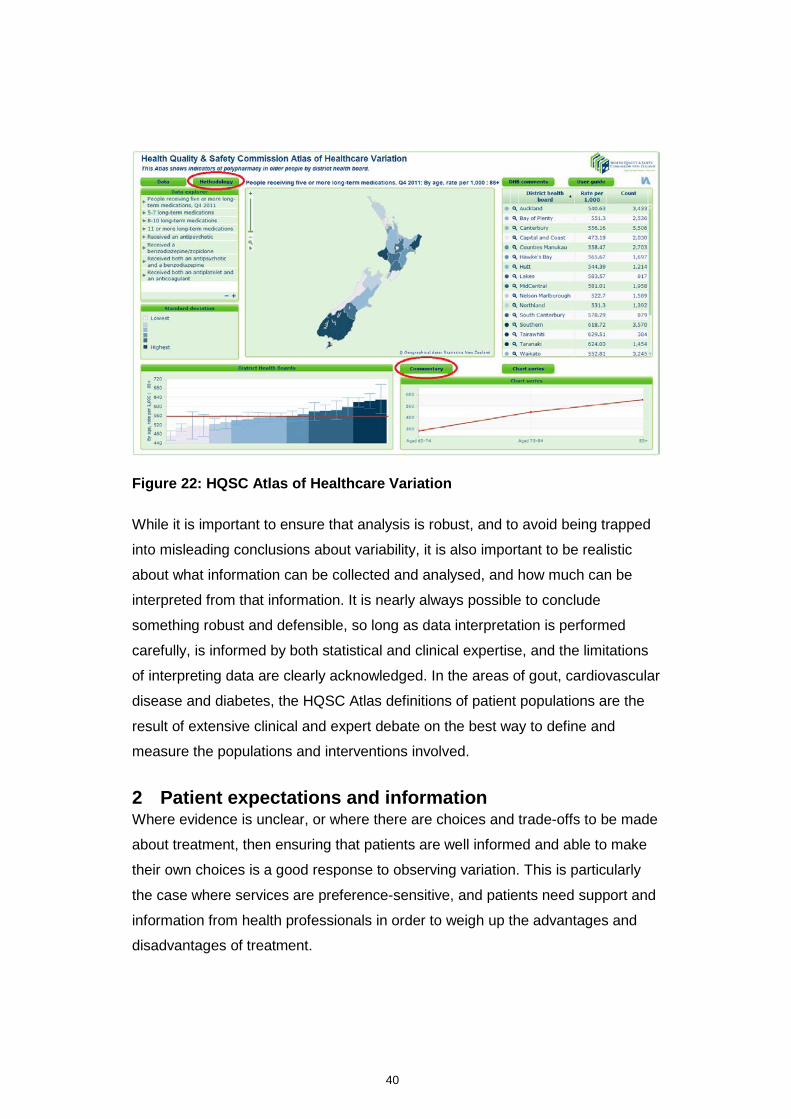
Figure 22: HQSC Atlas of Healthcare Variation
While it is important to ensure that analysis is robust, and to avoid being trapped
into misleading conclusions about variability, it is also important to be realistic
about what information can be collected and analysed, and how much can be
interpreted from that information. It is nearly always possible to conclude
something robust and defensible, so long as data interpretation is performed
carefully, is informed by both statistical and clinical expertise, and the limitations
of interpreting data are clearly acknowledged. In the areas of gout, cardiovascular
disease and diabetes, the HQSC Atlas definitions of patient populations are the
result of extensive clinical and expert debate on the best way to define and
measure the populations and interventions involved.
2 Patient expectations and information Where evidence is unclear, or where there are choices and trade-offs to be made
about treatment, then ensuring that patients are well informed and able to make
their own choices is a good response to observing variation. This is particularly
the case where services are preference-sensitive, and patients need support and
information from health professionals in order to weigh up the advantages and
disadvantages of treatment.
40

3 Work with practitioners at extremes of variation It is important to be clear that a practitioner who is at the extreme end of some
measure of service may be there for a good reason, or even purely by chance –
particularly if they see a small number of patients, or have a patient population
with special characteristics. If there are practitioners who appear to be well
outside the usual range, then they should be provided with comparative
information which informs them about their practice, and a professional peer
could be assigned to work with them in order to understand whether their practice
genuinely is different, whether there is a need for change, and what support the
practitioner needs.
Some organisations may be tempted to take a punitive attitude towards
professionals who are outliers on service measures, but a measured approach
based upon good information and peer expertise is often more likely to result in
service improvement.
4 Using and disseminating clinical information Good analysis is important, but its impact depends upon effective use of the
information with clinicians. The key elements here are:
• identifying strengths and weaknesses in information at practice level, and providing support so that information can be continuously improved
• providing tools for clinicians within practices to interrogate and compare their own clinical information, allowing for exploration and dissection of data within individual practice teams
• providing well analysed material back to clinicians, comparing their activity to their peers within a network or across an area.
The important principles are that the collection and dissemination of information
should be friendly to clinicians, providing clinicians with the tools and support they
need to answer questions about practice, and to provide information and
evidence in an accessible, useable fashion. These are core clinical governance
functions of PHOs and networks, although the degree to which they are delivered
can be variable across New Zealand.
41

5 Consensus management and service design Where evidence is ambiguous or unclear, there may be benefit in attempting to
establish local consensus on disease management, based upon evidence and
international best practice, and acknowledging the role of varying patient
preference. In the absence of clear evidence it may be reasonable to have a
range of practice, but if the result is inequity in treatment across the population, or
a mismatch of clinical resources which could be used more effectively, then it
may be important to establish more standardised approaches to care. For the
indicators covered in the HQSC Atlas, links are provided to evidence on best
practice and patient pathways.
Examples of consensus patient management built into service design include
standardised referral or post-discharge protocols. Increasingly, in New Zealand, a
range of disease management programmes provide resources more consistently
to clinicians, and potentially reduce variation in the management of key
conditions. Providing ready access to specialist opinion when needed, with clarity
about the information needed with a referral, can support primary care
professionals and reduce variation in the use of diagnostics and referral patterns.
42

5. References Davis PB, Lay-Yee R, Briant R, et al. 2002. Adverse events in New Zealand
public hospitals I: Occurrence and impact. New Zealand Medical Journal 115(1167).
Diehr P. 1990. What is too much variation? The null hypothesis in small-area analysis. Health Services Research 24(6): 741–71.
Expert Advisory Group. 2014. Integrated performance and incentive framework: Expert Advisory Group final report. Wellington: Ministry of Health. URL: http://www.hiirc.org.nz/page/45527/
Gribben B, Salkeld LJ, Hoare S, et al. 2012. The incidence of acute otitis media in New Zealand children under five years of age in the primary care setting. Journal of Primary Health Care 4(3): 205–12.
Wennberg J. 2010. Tracking medicine: A researcher’s quest to understand health care. Oxford: University Press.
Wennberg J. 2011. Time to tackle unwarranted variations in practice. British Medical Journal 342(7799): 687–90.
43