Embed Size (px)
Citation preview
TRANSPORTATION RESEARCH RECORD 1171 139
Variables Affecting Marshall Test Results ZAHUR SIDDIQUI, MARTIN w. TRETHEWEY, AND DAVID A. ANDERSON
The Marshall method of mix design Is one of the most widely used methods for designing and controlllng hot-mix paving mixtures. However, Inconsistencies among results occur when different Marshall equipment Is used; thl'> often leads to disputes when verification or acceptance test results vary significantly from the contractor's quality control results. This research Identified key equipment-related factors associated with Inconsistencies In test results obtained with different compaction and testJng equipment. Techniques and procedures for quantifying tbe effects of these variables and their Interactions are currently unavailable. In the absence of such a procedure, several U.S. and Canadian private and public agencies regular.ly participate In round-robin or mix-exchange programs, which are dL~cussed. To examine the ablllty to measure the fundamental proccs.s parameters of the Marshall compaction operation, several mix specimens were compacted with a mechanical hammer Instrumented with accelerometers. From the analysis of data obtaJned, It was concluded tl1at technology for measuring the amount of energy delivered to the specimen during the compaction process Is currently available. Research and development needed for adaptlng this technology to the field calibration of the Marshall hammer are recommended.
The Marshall method of mix design and control was originally developed in the late 1930s by Bruce G. Marshall of the Mississippi Highway Department. The method evolved between World War II and the late 1950s when the Department of Defense recognized the need for a procedure that could be used for designing asphalt concrete mixes to withstand the increasing wheel loads and tire pressures of military aircraft (1). Today the Marshall method of mix design is one of the most widely used methods for the design and control of hot-mix paving mixtures (2). However, the current method has evolved through a number of changes and refinements (J).
In its current form, the Marshall method of mix design consists of (a) compacting mix specimens, (b) conducting a density-voids analysis on the compacted specimens, and (c) testing the compacted specimens for stability and flow. Details of the procedure and equipment are provided in ASTM (D 1559), AASHTO (T 245), and Military (MIL-STD-620A) standards. The ASTM standard (D 1559) specifies the use of a manual compaction hammer whereas both AASHTO and MILSTD-620A pennit the use of a mechanical hammer, provided it is properly correlated with the standard hand hammer. Currently, however, most highway agencies and contractors use a mechanical hammer for the purpose of design, control, and acceptance of hot-mix asphalt concrete.
Industry and highway agency personnel have long been aware of inconsistencies between test results when mix specimens are prepared and tested in different Marshall equipment
The Pennsylvania Transportation Institute, The Pennsylvania State University, University Park, Pa. 16802.
(3-5). The objectives of the study reported in this paper were (a) to identify the key equipment-related factors associated with inconsistencies in test results obtained by using different compaction equipment and (b) to recommend calibration equipment and techniques that could be used to calibrate Marshall compaction equipment.
IDENTIFICATION OF VARIABLES
On the basis of their experience and a review of the literature, the research team identified eight compaction equipment-related variables that may have an influence on the level of compaction achieved in the laboratory (Table 1). These eight variables were included in a questionnaire used for conducting telephone interviews with several agency and industry personnel and researchers at universities. A total of 11 persons were interviewed. Two of these were university-based researchers with national reputations; two were from large, private material-testing laboratories; one represented a large paving contractor; one was a consultant currently conducting research on a federally sponsored project related to bituminous concrete; and five were from progressive state highway agencies (including one from Canada). Three of these state highway agencies, and several other people contacted, have also been involved in a series of round-robin (mix-exchange) testing programs with the objective of studying the variability in Marshall test results. Some of these round-robin testing programs are discussed later in this paper.
The frequency with which the persons surveyed rated the eight compaction-equipment variables as important to the level of compaction achieved in the laboratory is summarized in Table 1. All variables were considered by at least three persons to have a significant influence on the level of compaction
TABLE 1 FREQUENCY WITH WHICH VARIABLE WAS CONSIDERED IMPORTANT TO COMPACTION ACHIEVED
Compaction Equipment-Related Variable
Alignment of hammer Pedestal support Height of free-fall Weight of hammer Pedestal construction Friction between rod and hammer Mold restraint (rotating versus fixed) Dynamic response from energy transfer during impact
No. of Persons Rating Variable as Important to Compaction Achieved
9 9 8 7 7 6 3
3
140
achieved. Hammer alignment and pedestal support were cited most frequently (9 of 11) followed by the free-fall height of the hammer.
All persons contacted have the base of their Marshall hammers mounted on a standard compaction pedestal fixed lo the concrete floor slab of the building. However, several of the people interviewed have encountered situations in which anomalous test results were obtained when the standard compaction pedestal was not used or the equipment was located on an upper floor of the building.
The weight of the hammer and pedestal construction were cited by 7 of the 11 persons interviewed. Hammer alignment, hammer weight, and free-fall height can be standardized by simple length or mass measurements; however, there is no standard or straightforward technique for standardizing pedestal or floor (foundation) stiffness.
Ten of 11 persons interviewed had experienced inconsistencies in test results when hot-mix asphalt concrete specimens were compacted with different Marshall equipment. The age of the Marshall hammers used by the people surveyed ranged between 7 and 20 years. However, their equipment is periodically inspected and parts are replaced or repaired as needed.
The telephone survey revealed that significant differences were perceived in the Marshall compaction equipment made by different manufacturers. One of the differences cited pertains lo the mass of the sliding weight, and the experience of the authors confirms this source of difference. Two Marshall hammers from different manufacturers were ordered for their laboratory. When the hammers were received, it was found that the falling weights differed by 266 g. The respondents to the questionnaire also cited differences in the type of reaction (pedestal construction) and the shape of the hammer assembly foot (flat versus beveled) as major differences between manufacturers.
Eight of the 11 persons interviewed attributed differences in compaction test results to both equipment- and operator-related factors. When asphalt concrete mix specimens are compacted in a given compactor, differences in the compaction temperature and the actual preparation of the specimens can significantly influence the test results. Clearly, these are operatorrelated variables. In addition, a laboratory technician who has been preparing and testing Marshall specimens for several years may, for convenience, develop some shortcuts to the procedure without realizing that he is deviating from the specified procedure.
In addition to compaction density (and the associated voids analysis), asphalt concrete mixes are also tested for stability and flow. The Marshall stability and flow of compacted mix specimens are determined with the help of a breaking head and flowmeter. Nine of the 11 persons interviewed had encountered a breaking head or flowmeter that did not meet ASTM or AASHTO specifications. The major discrepancy was associated with the dimensions of the breaking head, including the dimensions of the bevel. Although the specifications require a 1/4-in. bevel, breaking heads with 3/s-in. bevels were encountered. Often the breaking head did not have the standard 2-in. radius. Research has shown that these differences in the breaking head result in significant variability in stability and flow neasurements (3). Again, operator-related factors, such as conlitioning of the specimen and the duration of the actual testing
TRANSPORTATION RESEARCH RECORD 1171
process, were cited as sources of differences between test results.
Marshall Round-Robin and Mix-Exchange Programs
Discrepancies in Marshall test results have long been of concern to both industry and state highway agency personnel. ASTM Subcommittee D04.20, private testing laboratories such as the AASHTO Materials Reference Laboratory (AMRL) and the Chicago Testing Laboratory, and several state highway agencies, both in the United States and in Canada, have conducted extensive interlaboratory testing programs to study the repeatability and reproducibility of Marshall test results. ASTM Subcommittee D04.20 has conducted several roundrobin tests, but the test data were not available for analysis by the authors. Georgia and Utah have conducted in-house research to study the variability in Marshall test results. Although these studies have not been published, the researchers have obtained special permission to summarize the studies in this paper.
Georgia Study
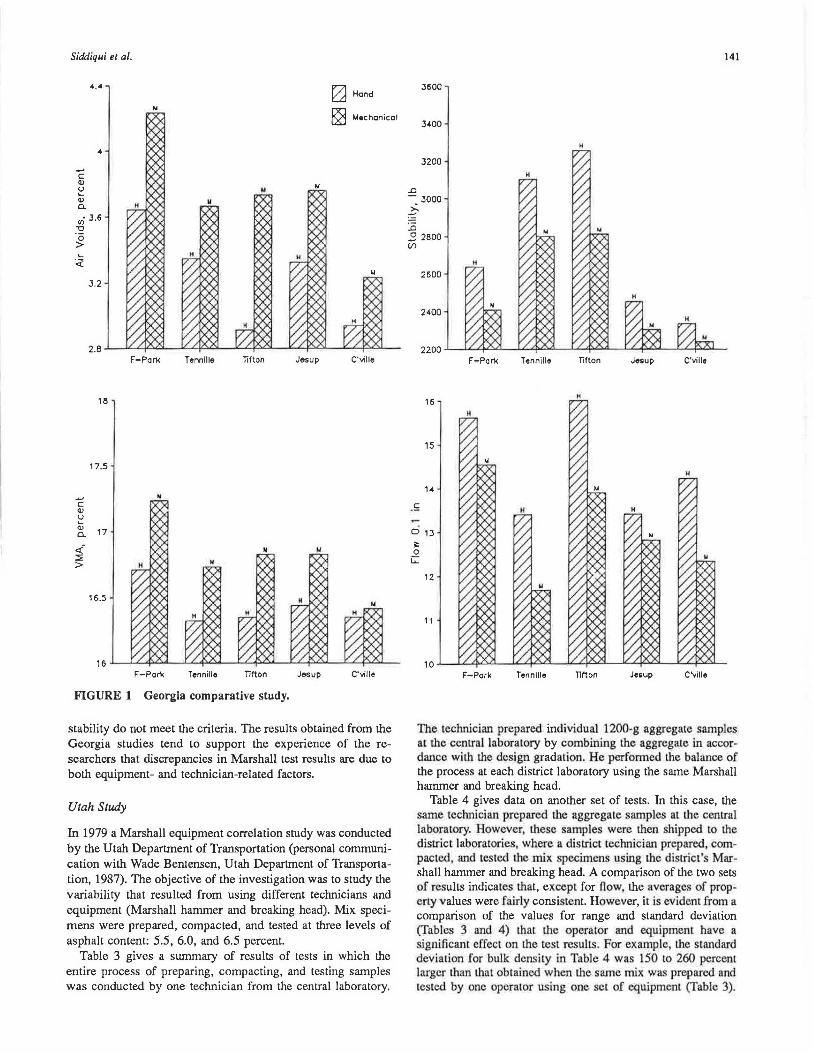
In 1980 Georgia conducted an interlaboratory investigation in which five laboratories participated (personal communication with Ronald Collins, Georgia Department of Transportation, 1987). The central laboratory weighed and separately packaged the aggregate for each sample before shipping it to the participating laboratories. Each laboratory prepared and tested the mixes in accordance with the recommended procedure. Each laboratory used both a manual and a mechanical hammer. The graphs shown in Figure 1 represent results for the Marshall properties tested: voids in mineral aggregate (VMA), percentage of air voids, stability, and flow. On each graph, H and M represent the hand hammer and the mechanical hammer, respectively. In each laboratory, the specimens compacted with the mechanical hammer yielded larger VMA and percentage air voids and smaller stability and flow values than those compacted with the hand hammer. The larger specimen densities obtained with the manual hammer may be attributed to the kneading action that takes place when the hammer strikes the sample at a slight angle from the vertical (2). These results are in general agreement with the experience of the persons contacted during telephone interviews.
In 1986 four laboratories of the Georgia Department of Transportation and five industry laboratories cooperated in a study to compare test results obtained with the standard 50-blow Marshall procedure (personal communication with Ronald Collins, Georgia Department of Transportation, 1987). Georgia's Type B mix was used in the study. The research results are given in Table 2. Georgia's criteria require a review of the procedure or equipment, or both, if a laboratory average exceeds the following ranges when compared with the overall average:
• Density: ±1.5 lb/ft3,
• Stability: ±400 lb, and • F1ow: ±0.02 in.
In general, the data meet Georgia's interlaboratory criteria; however, there are instances in which the density, flow, and
Siddiqui el al.
_, c: Cl)
~ Cl)
a.
4.4
,,; 3.6 "Cl
g I....
·~
3.2
17.5
...,, c: Cl) u I.... (I)
17 a.
<i ::::;;; >
16.5
F-Pari< Tennille Tiiton
FIGURE 1 Georgia comparative study.
0 Hond
f2'.j Mechanical
J$$Up C'ville
stability do not meet the criteria. The results obtained from the Georgia studies tend to support the experience of the researchers that discrepancies in Marshall test results are due to both equipment- and technician-related factors.
Utah Study
In 1979 a Marshall equipment correlation study was conducted by the Utah Deparunent of Transportation (personal communication with Wade Bentensen, Utah Department of Transportation, 1987). The objective of the investigation was to study the variability that resulted from using different technicians and equipment (Marshall hammer and breaking head). Mix specimens were prepared, compacted, and tested at three levels of asphalt content: 5.5, 6.0, and 6.5 percent.
Table 3 gives a summary of results of tests in which the entire process of preparing, compacting, and testing samples was conducted by one technician from the central laboratory.
141
J600
3-400
H
3200
.ri - JOOO
.~
.ri 2 2800 VJ
2600
2-400
16
15
14
. ~
o 1J
1:: 0
G:
12
11
F-Parl<
F-Park
Tennille Tiiton Jesup C'ville
Tennille nrton Jesup C\lille
The technician prepared individual 1200-g aggregate samples at the centraJ laboratory by combining the aggregate in accordance with the design gradation. He performed the balance of the process at each district laboratory using the same Marshall hammer and breaking head.
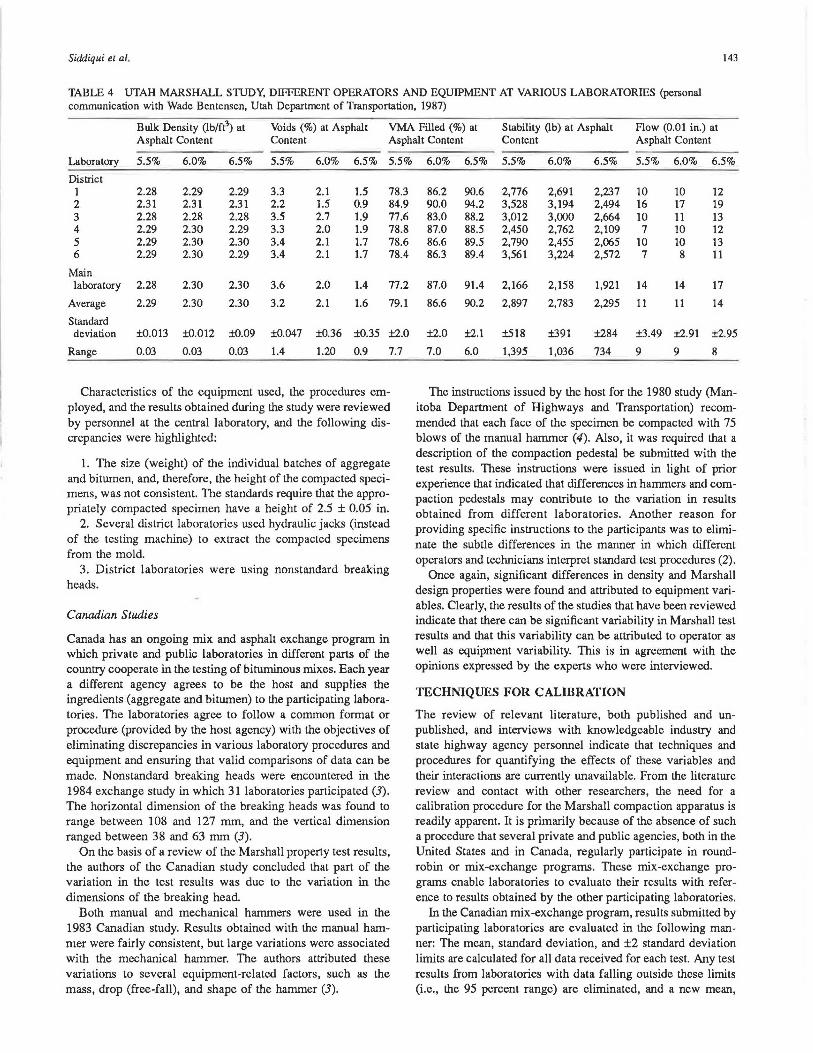
Table 4 gives data on another set of tests. Jn this case, the same technician prepared the aggregate samples at the central laboratory. However, these samples were then shipped to the district laboratories, where a district technician prepared, compacted, and tested the mix specimens using the district's Marshall hammer and breaking head. A comparison of the two sets of results indicates that, except for flow, the averages of property values were fairly consistent. However, it is evident from a comparison of the values for range and standard deviation (Tables 3 and 4) that the operator and equipment have a significant effect on the test results. For example, the standard deviation for bulk density in Table 4 was 150 co 260 percent larger than that obtained when the same mix was prepared and tested by one operator using one set of equipment (Table 3).
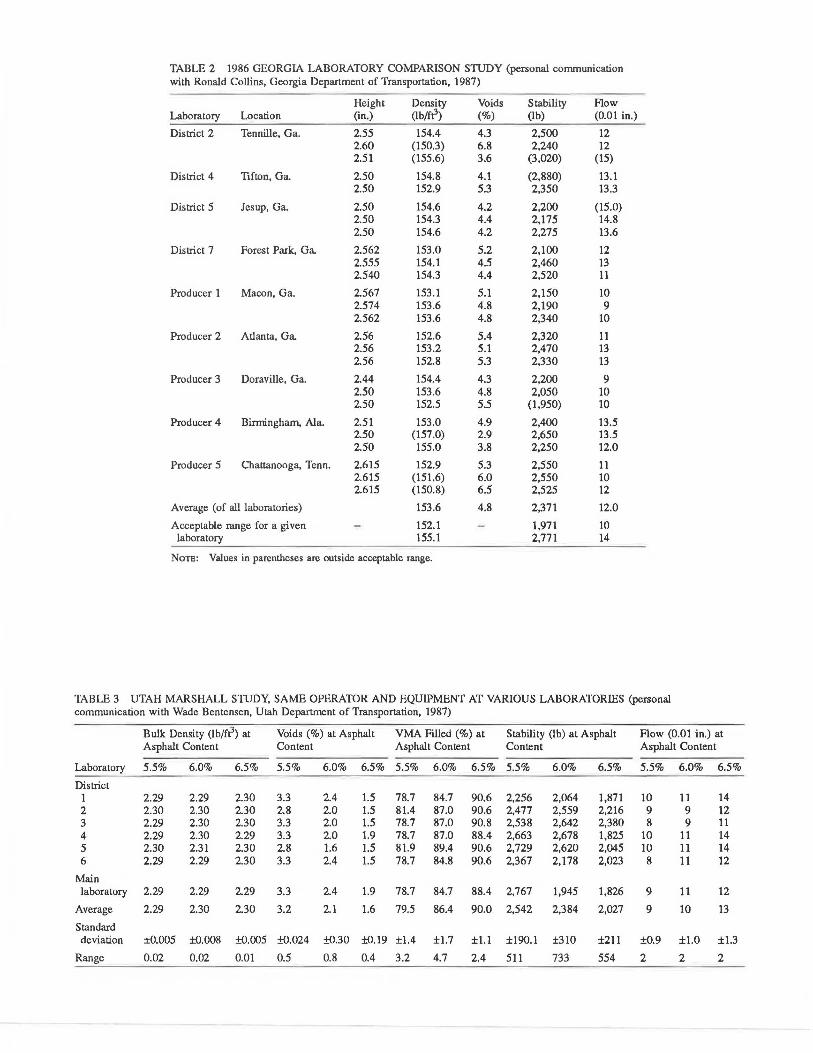
TABLE 2 1986 GEORGIA LABORATORY COMPARISON STUDY (personal communication with Ronald Collins, Georgia Department of Transportation, 1987)
Height Density Voids Stability Flow Laboratory Location (in.) (lb/ft3) (%) (lb) (0.01 in.)
District 2 Tennille, Ga. 2.55 154.4 4.3 2,500 12 2.60 (150.3) 6.8 2,240 12 2.51 (155.6) 3.6 (3,020) (15)
District 4 Tifton, Ga. 2.50 154.8 4.1 (2,880) 13.1 2.50 152.9 5.3 2,350 13.3
District 5 Jesup, Ga. 2.50 154.6 4.2 2,200 (15.0) 2.50 154.3 4.4 2,175 14.8 2.50 154.6 4.2 2,275 13.6
District 7 Forest Park, Ga. 2.562 153.0 5.2 2,100 12 2.555 154.1 4.5 2,460 13 2.540 154.3 4.4 2,520 11
Producer 1 Macon, Ga. 2.567 153.1 5.1 2,150 10 2.574 153.6 4.8 2,190 9 2.562 153.6 4.8 2,340 10
Producer 2 Atlanta, Ga. 2.56 152.6 5.4 2,320 11 2.56 153.2 5.1 2,470 13 2.56 152.8 5.3 2,330 13
Producer 3 Doraville, Ga. 2.44 154.4 4.3 2,200 9 2.50 153.6 4.8 2,050 10 2.50 152.5 5.5 (1,950) 10
Producer 4 Birmingham, Ala. 2.51 153.0 4.9 2,400 13.5 2.50 (157.0) 2.9 2,650 13.5 2.50 155.0 3.8 2,250 12.0
Producer 5 Chattanooga, Tenn. 2.615 152.9 5.3 2,550 11 2.615 (151.6) 6.0 2,550 10 2.615 (150.8) 6.5 2,525 12
Average (of all laboratories) 153.6 4.8 2,371 12.0
Acceptable range for a given 152.1 1,971 10 laboratory 155.1 2,771 14
Norn: Values in parentheses are outside acceptable range.
TABLE 3 UTAH MARSHALL STUDY, SAME OPERATOR AND EQUIPMENT AT VARIOUS LABORATORIES (personal communication with Wade Bentensen, Utah Department of Transportation, 1987)
Bulk Density (lb/ft3) at Voids (%) at Asphalt VMA Filled (%) at Stability (lb) at Asphalt Flow (0.01 in.) at Asphalt Content Content Asphalt Content Content Asphalt Content
Laboratory 5.5% 6.0% 6.5% 5.5% 6.0% 6.5% 5.5% 6.0% 6.5% 5.5% 6.0% 6.5% 5.5% 6.0% 6.5%
District 1 2.29 2.29 2.30 3.3 2.4 1.5 78.7 84.7 90.6 2,256 2,064 1,871 IO 11 14 2 2.30 2.30 2.30 2.8 2.0 1.5 81.4 87.0 90.6 2,477 2,559 2,216 9 9 12 3 2.29 2.30 2.30 3.3 2.0 1.5 78.7 87.0 90.8 2,538 2,642 2,380 8 9 11 4 2.29 2.30 2.29 3.3 2.0 1.9 78.7 87.0 88.4 2,663 2,678 1,825 IO 11 14 5 2.30 2.31 2.30 2.8 1.6 1.5 81.9 89.4 90.6 2,729 2,620 2,045 10 11 14 6 2.29 2.29 2.30 3.3 2.4 1.5 78.7 84.8 90.6 2,367 2,178 2,023 8 11 12
Main laboratory 2.29 2.29 2.29 3.3 2.4 1.9 78.7 84.7 88.4 2,767 1,945 1,826 9 11 12
Average 2.29 2.30 2.30 3.2 2.1 1.6 79.5 86.4 90.0 2,542 2,384 2,027 9 10 13
Standard deviation ±0.005 ±0.008 ±0.005 ±0.024 ±0.30 ±0.19 ±1.4 ±1.7 ±1.l ±190.1 ±310 ±211 ±0.9 ±1.0 ±1.3
Range 0.02 0.02 O.Dl 0.5 0.8 0.4 3.2 4.7 2.4 511 733 554 2 2 2
Siddiqui el al. 143
TABLE 4 UTAH MARSHALL STUDY, DIFFERENT OPERATORS AND EQUIPMENT AT VARIOUS LABORATORIES (personal communication with Wade Bentensen, Utah Department of Transportation, 1987)
Bulk Density (lb/ft3) at Voids (%) at Asphalt VMA Filled (%) at Stability (lb) at Asphalt Flow (0.01 in.) at Asphalt Content Content Asphalt Content Content Asphalt Content
Laboratory 5.5% 6.0% 6.5% 5.5% 6.0% 6.5% 5.5%
District 1 2.28 2.29 2.29 3.3 2.1 1.5 78.3 2 2.31 2.31 2.31 2.2 1.5 0.9 84.9 3 2.28 2.28 2.28 3.5 2.7 1.9 77.6 4 2.29 2.30 2.29 3.3 2.0 1.9 78.8 5 2.29 2.30 2.30 3.4 2.1 1.7 78.6 6 2.29 2.30 2.29 3.4 2.1 1.7 78.4
Main laboratory 2.28 2.30 2.30 3.6 2.0 1.4 77.2
Average 2.29 2.30 2.30 3.2 2.1 1.6 79.1
Standard deviation ±0.013 ±-0.012 ±0.09 ±0.047 ±0.36 ±0.35 ±2.0
Range 0.03 0.03 0.03 1.4 1.20 0.9 7.7
Characteristics of the equipment used, the procedures employed, and the results obtained during the study were reviewed by personnel at the central laboratory, and the following discrepancies were highlighted:
1. The size (weight) of the individual batches of aggregate and bitumen, and, therefore, the height of the compacted specimens, was not consistent. The standards require that the appropriately compacted specimen have a height of 2.5 ± 0.05 in.
2. Several district laboratories used hydraulic jacks (instead of the testing machine) to extract the compacted specimens from the mold.
3. District laboratories were using nonstandard breaking heads.
Canadian Studies
Canada has an ongoing mix and asphalt exchange program in which private and public laboratories in different parts of the country cooperate in the testing of bituminous mixes. Each year a different agency agrees to be the host and supplies the ingredients (aggregate and bitumen) to the participating laboratories. The laboratories agree to follow a common format or procedure (provided by the host agency) with the objectives of eliminating discrepancies in various laboratory procedures and equipment and ensuring that valid comparisons of data can be made. Nonstandard breaking heads were encountered in the 1984 exchange study in which 31 laboratories participated (3). The horizontal dimension of the breaking heads was found to range between 108 and 127 mm, and the vertical dimension ranged between 38 and 63 mm (3).
On the basis of a review of the Marshall property test results, the authors of the Canadian study concluded that part of the variation in the test results was due to the variation in the dimensions of the breaking head.
Both manual and mechanical hammers were used in the 1983 Canadian study. Results obtained with the manual hammer were fairly consistent, but large variations were associated with the mechanical hammer. The authors attributed these variations to several equipment-related factors, such as the mass, drop (free-fall), and shape of the hammer (3).
6.0% 6.5% 5.5% 6.0% 6.5% 5.5% 6.0% 6.5%
86.2 90.6 2,776 2,691 2,237 10 10 12 90.0 94.2 3,528 3,194 2,494 16 17 19 83.0 88.2 3,012 3,000 2,664 10 11 13 87.0 88.5 2,450 2,762 2,109 7 10 12 86.6 89.5 2,790 2,455 2,065 10 10 13 86.3 89.4 3,561 3,224 2,572 7 8 11
87.0 91.4 2,166 2,158 1,921 14 14 17
86.6 90.2 2,897 2,783 2,295 11 11 14
±2.0 ±2.1 ±518 ±391 ±284 ±3.49 ±2.91 ±2.95
7.0 6.0 1,395 1,036 734 9 9 8
The instructions issued by the host for the 1980 study (Manitoba Department of Highways and Transportation) recommended that each face of the specimen be compacted with 75 blows of the manual hammer (4). Also, it was required that a description of the compaction pedestal be submitted with the test results. These instructions were issued in light of prior experience that indicated that differences in hammers and compaction pedestals may contribute to the variation in results obtained from different laboratories. Another reason for providing specific instructions to the participants was to eliminate the subtle differences in the manner in which different operators and technicians interpret standard test procedures (2).
Once again, significant differences in density and Marshall design properties were found and attributed to equipment variables. Clearly, the results of the studies that have been reviewed indicate that there can be significant variability in Marshall test results and that this variability can be attributed to operator as well as equipment variability. This is in agreement with the opinions expressed by the experts who were interviewed.
TECHNIQUES FOR CALIBRATION
The review of relevant literature, both published and unpublished, and interviews with knowledgeable industry and state highway agency personnel indicate that techniques and procedures for quantifying the effects of these variables and their interactions are currently unavailable. From the literature review and contact with other researchers, the need for a calibration procedure for the Marshall compaction apparatus is readily apparent. It is primarily because of the absence of such a procedure that several private and public agencies, both in the United States and in Canada, regularly participate in roundrobin or mix-exchange programs. These mix-exchange programs enable laboratories lo evaluate their results with reference to results obtained by the other participating laboratories.
In the Canadian mix-exchange program, results submitted by participating laboratories are evaluated in the following manner: The mean, standard deviation, and ±2 standard deviation limits are calculated for all data received for each test. Any test results from laboratories with data falling outside these limits (i.e., the 95 percent range) are eliminated, and a new mean,
144 TRANSPORTATION RESEARCH RECORD 1171
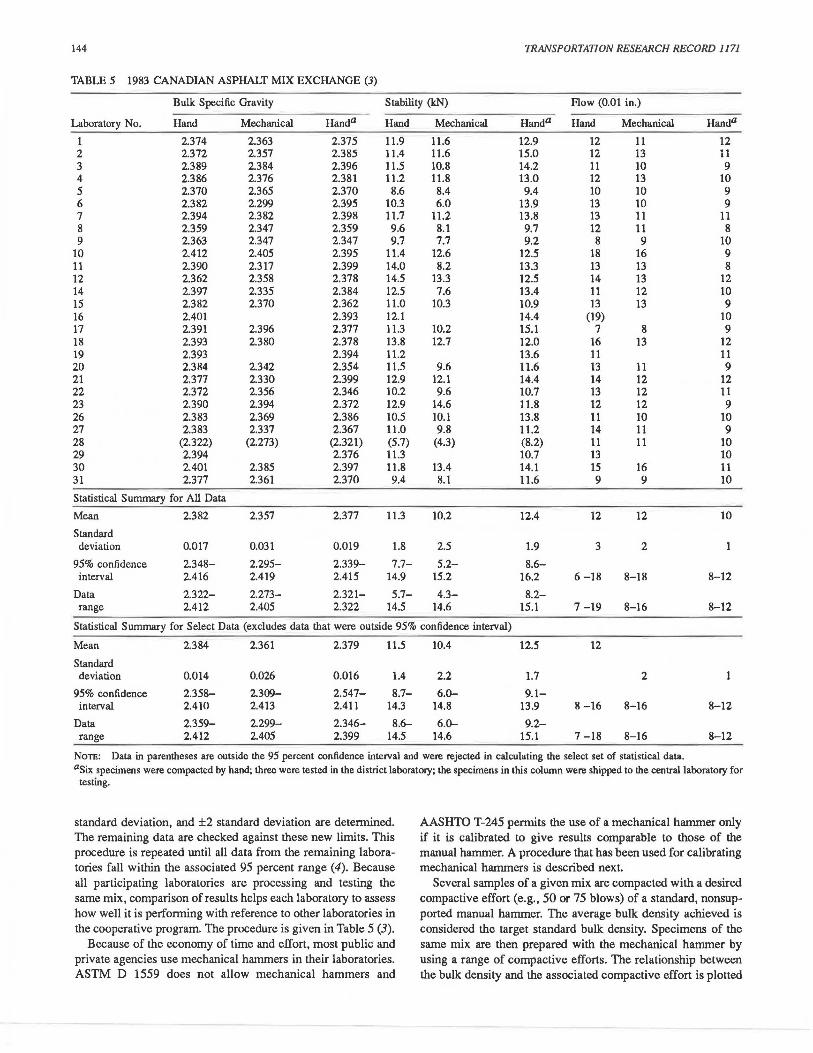
TABLE 5 1983 CANADIAN ASPHALT MIX EXCHANGE (3)
Bulle Specific Gravity Stability (kN) Flow (0.01 in.)
Laboratory No. Hand Mechanical Handa Hand Mechanical Handa Hand Mechanical Handa
1 2.374 2.363 2.375 11.9 11.6 12.9 12 11 12 2 2.372 2.357 2.385 11.4 11.6 i5.0 12 13 11 3 2.389 2.384 2.396 11.5 10.8 14.2 11 10 9 4 2.386 2.376 2.381 11.2 11.8 13.0 12 13 10 5 2.370 2.365 2.370 8.6 8.4 9.4 10 10 9 6 2.382 2.299 2.395 10.3 6.0 13.9 13 10 9 7 2.394 2.382 2.398 11.7 11.2 13.8 13 11 11 8 2.359 2.347 2.359 9.6 8.1 9.7 12 11 8 9 2.363 2.347 2.347 9.7 7.7 9.2 8 9 10
10 2.412 2.405 2.395 11.4 12.6 12.5 18 16 9 11 2.390 2.317 2.399 14.0 8.2 13.3 13 13 8 12 2.362 2.358 2.378 14.5 13.3 12.5 14 13 12 14 2.397 2.335 2.384 12.5 7.6 13.4 11 12 10 15 2.382 2.370 2.362 11.0 10.3 10.9 J3 13 9 16 2.401 2.393 12.1 14.4 (19) 10 17 2.391 2.396 2.377 11.3 10.2 15.1 7 8 9 18 2.393 2.380 2.378 13.8 12.7 12.0 16 13 12 19 2.393 2.394 11.2 13.6 11 11 20 2.384 2.342 2.354 11.5 9.6 11.6 13 11 9 21 2.377 2.330 2.399 12.9 12.1 14.4 14 12 12 22 2.372 2.356 2.346 10.2 9.6 10.7 13 12 11 23 2.390 2.394 2.372 12.9 14.6 11.8 12 12 9 26 2.383 2.369 2.386 10.5 10.l 13.8 11 10 10 27 2.383 2.337 2.367 11.0 9.8 11.2 14 11 9 28 (2.322) (2.273) (2.321) (5.7) (4.3) (8.2) 11 11 10 29 2.394 2.376 11.3 10.7 13 10 30 2.401 2.385 2.397 11.8 13.4 14.1 15 16 11 31 2.377 2.361 2.370 9.4 8.1 11.6 9 9 10
Statistical Summary for All Data
Mean 2.382 2.357 2.377 11.3 10.2 12.4 12 12 10
Standard deviation 0.017 0.031 0.019 1.8 2.5 1.9 3 2
95% confidence 2.348- 2.295- 2.339- 7.7- 5.2- 8.6-interval 2.416 2.419 2.415 14.9 15.2 16.2 6-18 8-18 8-12
Data 2.322- 2.273- 2.321- 5.7- 4.3- 8.2-range 2.412 2.405 2.322 14.5 14.6 15.1 7 -19 8-16 8-12
Statistical Summary for Select Data (excludes data that were outside 95% confidence interval)
Mean 2.384 2.361 2.379 11.5 10.4 12.5 12
Standard deviation 0.014 0.026 0.016 1.4 2.2 1.7 2
95% confidence 2.358- 2.309- 2.547- 8.7- 6.0- 9.1-interval 2.410 2.413 2.411 14.3 14.8 13.9 8 -16 8-16 8-12
Data 2.359- 2.299- 2.346- 8.6-- 6.0- 9.2-range 2.412 2.405 2.399 14.5 14.6 15.1 7-18 8-16 8-12
NoTE: Data in parentheses are outside the 95 percent confidence interval and were rejected in calculating the select set of statistical data. a six specimens were compacted by hand; three were tested in the district laboratory; the specimens in this column were shipped to the central laboratory for
testing.
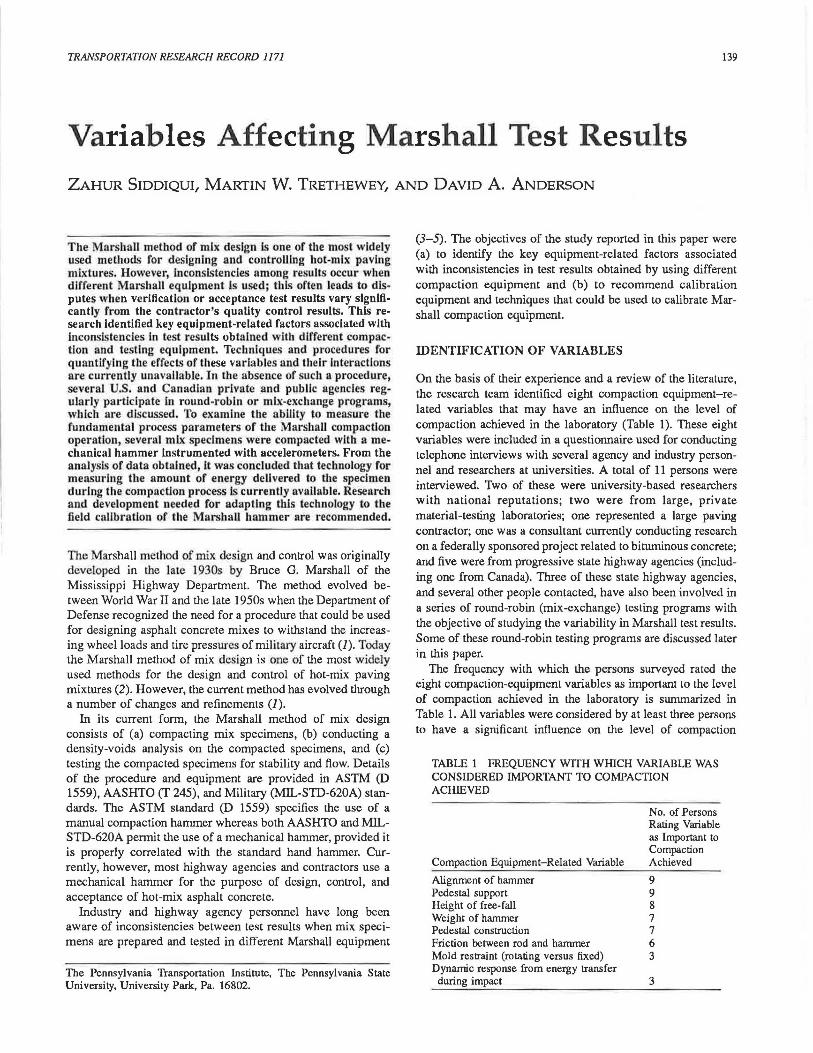
standard deviation, and ±2 standard deviation are determined. AASHTO T-245 permits the use of a mechanical hammer only The remaining data are checked against these new limits. This if it is calibrated to give results comparable to those of the procedure is repeated witil all data from the remaining labora- manual hammer. A procedure that has been used for calibrating tories fall within the associated 95 percent range (4). Because mechanical hammers is described next. all participating laboratories are processing and testing the Several samples of a given mix are compacted with a desired same mix, comparison of results helps each laboratory to assess compactive effort (e.g., 50 or 75 blows) of a standard, nonsup-how well it is performing with reference to other laboratories in ported manual hammer. The average bulk density achieved is the cooperative program. The procedure is given in Table 5 (3). considered the target standard bulk density. Specimens of the
Because of the economy of time and effort, most public and same mix are then prepared with the mechanical hammer by private agencies use mechanical hammers in their laboratories. using a range of compactive efforts. The relationship between ASTM D 1559 does not allow mechanical hammers and the bulk density and the associated compactive effort is plotted
Siddiqui el al.
152
151 .. ~ ,!!
' 15 ..... :J: ~
149 "' 3t
~ 148 z :::>
147
146-0
75 BLOW HANDHAMMER DENSITY
50 BLOW HANDHAMMER DENSITY
10 20 30 40 50 60 70 80
NUMBER OF BLOWS
145
However, it is possible that the associated pedestal and foundation reactions also varied, creating additional and undocumented sources of variability. Thus, in order to reduce the between-laboratory variation in bulk density results for a given mix, it would be necessary to calibrate each hammer used with the same standard, unsupported manual hammer. Also, the calibration procedure should be periodically repeated to account for wear and repair or replacement of equipment components. Finally, calibration of the hammer can only address the variation in bulk density. It cannot eliminate, or even reduce, the variation in flow and stability associated with a nonstandard or defective breaking head.
FIGURE 2 Procedure for calibrating a mechanlc:d hammer.
As shown in Figure 2, it is possible that a given mechanical hammer may not achieve the target bulk density obtained with a standard manual hammer. This may result from use of a nonstandard compaction pedestal, a nonstandard reaction (foundation), or some other unknown variable. From the data presented and the state-of-the-art review it is clear that a methodology for calibrating the comp active effort of Marshall compaction devices is needed
as shown in Figure 2. The number of blows Lhat is required wilh Lhe mechanical hammer 10 airain Lhe target bulk density is then determined from the plot.
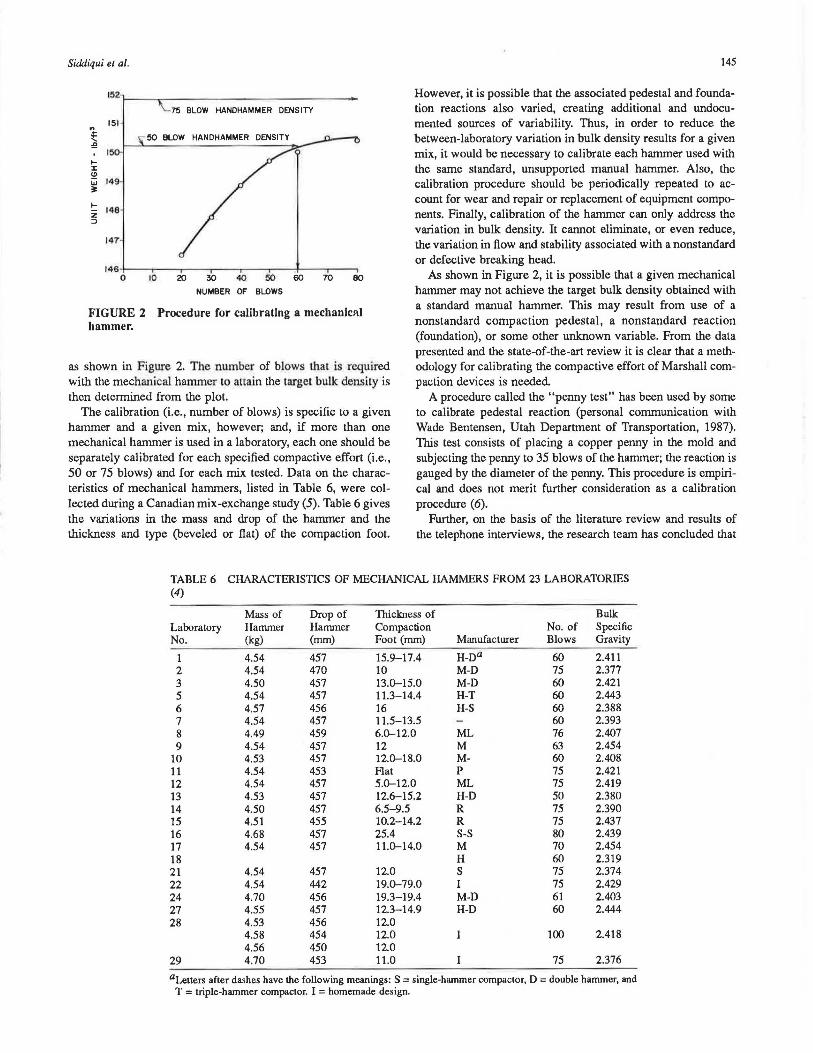
The calibration (i.e., number of blows) is specific to a given hammer and a given mix, however; and, if more than one mechanical hammer is used in a laboratory, each one should be separately calibrated for each specified compactive effort (i.e., 50 or 75 blows) and for each mix tested. Data on Lhe characteristics of mechanical hammers, listed in Table 6, were collected during a Canadian mix-exchange study (5). Table 6 gives the variations in the mass and drop of the hammer and the thickness and type (beveled or fiat) of Lhe compaction foot.
A procedure called the "penny test" has been used by some to calibrate pedestal reaction (personal communication with Wade Bentensen, Utah Department of Transportation, 1987). This test consists of placing a copper penny in the mold and subjecting the penny to 35 blows of the hammer; the reaction is gauged by the diameter of the penny. This procedure is empirical and does not merit further consideration as a calibration procedure (6).
TABLE 6 (4)
Laboratory No.
1 2 3 5 6 7 8 9
10 11 12 13 14 15 16 17 18 21 22 24 27 28
29
Further, on the basis of the literature review and results of the telephone interviews, the research team has concluded that
CHARACTERISTICS OF MECHANICAL HAMMERS FROM 23 LABORATORIES
Mass of Drop of Titlckness of Bulk Hammer Hammer Compaction No. of Specific (kg) (mm) Foot (mm) Manufacturer Blows Gravity
4.54 457 15.9-17.4 H-Da 60 2.411 4.54 470 10 M-D 75 2.377 4.50 457 13.0-15.0 M-D 60 2.421 4.54 457 11.3-14.4 H-T 60 2.443 4.57 456 16 H-S 60 2.388 4.54 457 11.5-13.5 60 2.393 4.49 459 6.0-12.0 ML 76 2.407 4.54 457 12 M 63 2.454 4.53 457 12.0-18.0 M- 60 2.408 4.54 453 Flat p 75 2.421 4.54 457 5.0-12.0 ML 75 2.419 4.53 457 12.6-15.2 H-D 50 2.380 4.50 457 6.5-9.5 R 75 2.390 4.51 455 10.2-14.2 R 75 2.437 4.68 457 25.4 S-S 80 2.439 4.54 457 11.0-14.0 M 70 2.454
H 60 2.319 4.54 457 12.0 s 75 2.374 4.54 442 19.0-79.0 I 75 2.429 4.70 456 19.3-19.4 M-D 61 2.403 4.55 457 12.3-14.9 H-D 60 2.444 4.53 456 12.0 4.58 454 12.0 100 2.418 4.56 450 12.0 4.70 453 11.0 75 2.376
a Letters after dashes have the following meanings: S = single-hammer compactor, D = double hammer, and T = triple-hammer compactor. I = homemade design.
146
practical and reliable procedures and equipment for calibrating the Marshall apparatus are currently unavailable.
PRELIMINARY EXPERIMENTAL EVALUATION
To examine the feasibility of measuring fundamental process parameters of the Marshall hammer operation, a research study was performed in the Materials Testing Laboratory at the Pennsylvania Transportation Institute. The study was designed to explore the possibility of obtaining meaningful compaction process information with a limited amount of instrumentation and sophistication and was not intended Lo be a comprehensive experimental evaluation of the compaction process.
The study conducted by the authors consisted of instrumenting a mechanical Marshall compaction hammer with three accelerometers (6). The impact-time histories of the accelerometers were recorded with an FM tape recorder. The tape recordings of the accelerations were then analyzed by applying rudimentary digital signal processing techniques. Interpretation of the data allows several conclusions with regard to the compaction process and the associated variables to be drawn. In addition, this preliminary evaluation formed the foundation for recommending further experimental testing and the instrumentation required to properly define the process variabilities between different compaction hammers.
Experimental Testing Procedure and Data Acquisition
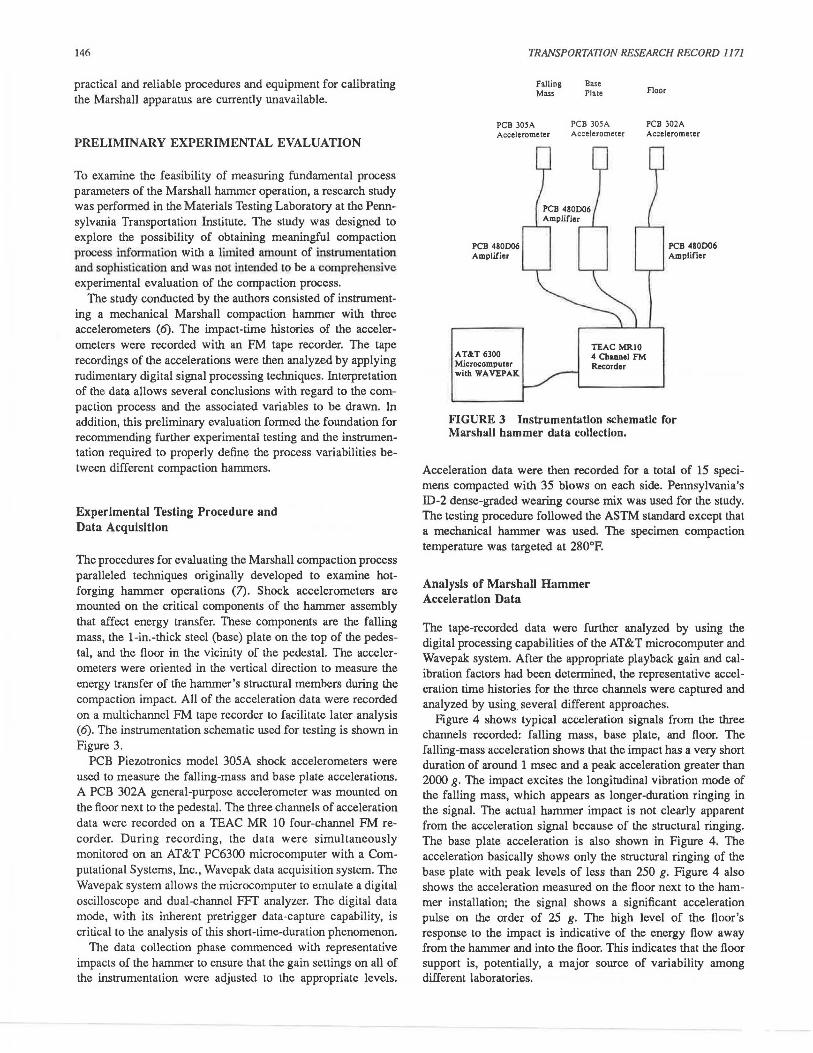
The procedures for evaluating the Marshall compaction process paralleled techniques originally developed to examine hotforging hammer operations (7). Shock accelerometers are mounted on the critical components of the hammer assembly that affect energy transfer. These components are the falling mass, the 1-in.-thick steel (base) plate on the top of the pedestal, and the floor in the vicinity of the pedestal. The accelerometers were oriented in the vertical direction to measure the energy transfer of the hammer's structural members during the compaction impact. All of the acceleration data were recorded on a multichannel FM tape recorder to facilitate later analysis (6). The instrumentation schematic used for testing is shown in Figure 3.
PCB Piezotronics model 305A shock accelerometers were used to measure the falling-mass and base plate accelerations. A PCB 302A general-purpose accelerometer was mounted on the floor next to the pedestal. The three channels of acceleration data were recorded on a TEAC MR 10 four-channel FM recorder. During recording, the data were simultaneously monitored on an AT&T PC6300 microcomputer with a Computational Systems, Inc., Wavepak data acquisition system. The Wavepak system allows the microcomputer to emulate a digital oscilloscope and dual-channel FFT analyzer. The digital data mode, with its inherent pretrigger data-capture capability, is critical to the analysis of this short-time-duration phenomenon.
The data collection phase commenced with representative impacts of the hammer to ensure that the gain settings on all of the instrumentation were adjusted to the appropriate levels.
TRANSPORTATION RESEARCH RECORD 1171
Falling Mass
PCB 305A Accelerometer
PCB 480006 Amplifier
AT&cT 6300 Microcomputer with WAVEPAK
Base Plate
PCB 305A Accelerometer
TEAC MRIO 4 Channel FM Recorder
Floor
PCB 302A Accelerometer
PCB 480006 Amplifier
FIGURE 3 Instrumentation schematic for Marshall hammer data collection.
Acceleration data were then recorded for a total of 15 specimens compacted with 35 blows on each side. Pennsylvania's ID-2 dense-graded wearing course mix was used for the study. The testing procedure followed the ASTM standard except that a mechanical hammer was used The specimen compaction temperature was targeted at 280°F.
Analysis of Marshall Hammer Acceleration Data
The tape-recorded data were further analyzed by using the digital processing capabilities of the AT&T microcomputer and Wavepak system. After the appropriate playback gain and calibration factors had been determined, the representative acceleration time histories for the three channels were captured and analyzed by using, several different approaches.
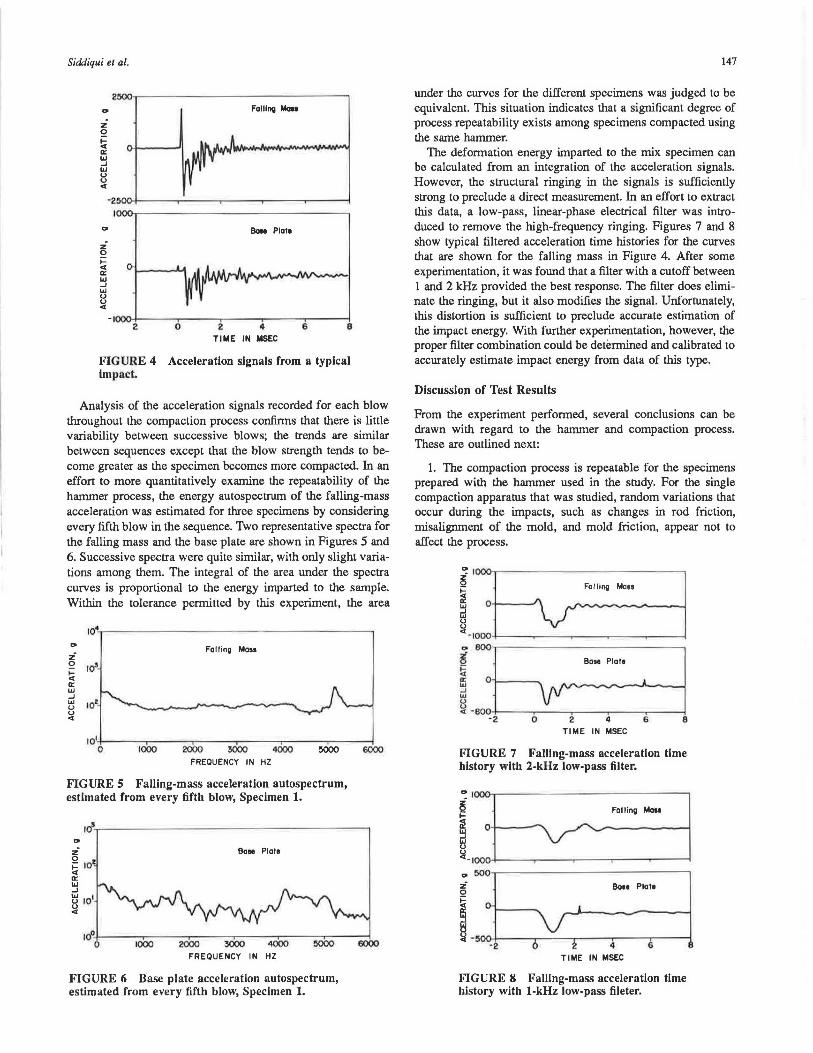
Figure 4 shows typical acceleration signals from the three channels recorded: falling mass, base plate, and floor. The falling-mass acceleration shows that the impact has a very short duration of around 1 msec and a peak acceleration greater than 2000 g. The impact excites the longitudinal vibration mode of the falling mass, which appears as longer-duration ringing in the signal. The actual hammer impact is not clearly apparent from the acceleration signal because of the structural ringing. The base plate acceleration is also shown in Figure 4. The acceleration basically shows only the structural ringing of the base plate with peak levels of less than 250 g. Figure 4 also shows the acceleration measured on the floor next to the hammer installation; the signal shows a significant acceleration pulse on the order of 25 g. The high level of the floor's response to the impact is indicative of the energy flow away from the hammer and into the floor. This indicates that the floor support is, potentially, a major source of variability among different laboratories.
Siddiqui el al.
z 0
~ 0::
"' _J
"' u u C(
"' z 0 ~ < 0::
"' _J
"' u u <
-1
Falling Mou
Booe Plate
2 0 2 4 6 e TIME IN MSEC
FIGURE 4 Acceleration signals from a typical impact.
Analysis of the acceleration signals recorded for each blow throughout the compaction process confirms that there is little variability between successive blows; the trends are similar between sequences except that the blow strength tends to become greater as the specimen becomes more compacted. In an effort to more quantitatively examine the repeatability of the hammer process, the energy autospectrum of the falling-mass acceleration was estimated for three specimens by considering every fifth blow in the sequence. Two representative spectra for the falling mass and the base plate are shown in Figures 5 and 6. Successive spectra were quite similar, with only slight variations among them. The integral of the area under the spectra curves is proportional to the energy imparted to the sample. Within the tolerance permitted by this experiment, the area
"' z Falling Moss
~ 1<>5· .... C( 0::
"' _J w IOt u u C(
101
0 1000 2000 3000 4000 5000 FREQUENCY IN HZ
FIGURE 5 Falling-mass acceleration autospectrum, estimated from every fifth blow, Specimen 1.
FREQUENCY IN HZ
FIGURE 6 Base plate acceleration autospectrum, estimated from every fifth blow, Specimen 1.
6000
147
under the curves for the different specimens was judged to be equivalent. This situation indicates that a significant degree of process repeatability exists among specimens compacted using the same hammer.
The deformation energy imparted to the mix specimen can be calculated from an integration of the acceleration signals. However, the structural ringing in the signals is sufficiently strong to preclude a direct measurement. In an effort to extract this data, a low-pass, linear-phase electrical filter was introduced to remove the high-frequency ringing. Figures 7 and 8 show typical filtered acceleration time histories for the curves that are shown for the falling mass in Figure 4. After some experimentation, it was found that a filter with a cutoff between 1 and 2 kHz provided the best response. The filter does eliminate the ringing, but it also modifies the signal. Unfortunately, this distortion is sufficient to preclude accurate estimation of the impact energy. With further experimentation, however, the proper filter combination could be determined and calibrated to accurately estimate impact energy from data of this type.
Discussion of Test Results
From the experiment performed, several conclusions can be drawn with regard to the hammer and compaction process. These are outlined next:
1. The compaction process is repeatable for the specimens prepared with the hammer used in the srudy. For the single compaction apparatus that was studied, random variations that occur during the impacts, such as changes in rod friction, misalignment of the mold, and mold friction, appear not to affect the process.
;8~ l~f. ~ Falling Mo.. 1 :_1000 ~ -~ J
r:1l---.~ 1-eoo+~~~. -~~~~~~~~~~___. -2 o 2 4 6 e
TIME IN MSEC
FIGURE 7 Falling-mass acceleration time history with 2-kHz low-pass filter.
"'1000
I tJ Falling Maas
~ [j Bose Plate
I v' : 6 ; I - 2 4 6
TIME IN MSEC
FIGURE 8 Falling-mass acceleration time history with 1-kHz low-pass fileter.
148
2. The interaction of the hammer, pedestal, and supporting foundation appears to be critical. The acceleration levels recorded indicate a significant interaction with the surrounding support structure. Although the acceleration of the base plate and the floor differed by an order of magnitude, 250 and 25 g, respectively, the magnitude of the energy transmitted is unknown because the effective mass of the floor, which is much greater than that of the pedestal, is unknown. This indicates that the relative stiffness of the supporting floor could cause variations in the compaction process and, hence, affect the test results. The authors recommend that the pedestal be mounted on a large block of concrete (e.g., at least 3 ft by 3 ft by 3 ft) rather than on the floor of a building.
3. Reliable process information can be extracted from the hammer with relatively simple instrumentation. The structural ringing makes it difficult to extract the deformation impact from the rest of the signal. Filtering reduces the ringing effect but colors the resulting signal. This distortion makes it difficult to estimate the actual impact energy, but, nevertheless, the signal can be used for comparison purposes.
4. For the hammer evaluated, the impact consisted of a single blow with no repetitive bounces resulting from rebound of the hammer head.
FINDINGS AND CONCLUSIONS
Large variations in compacted density and other Marshall mixture design values may occur when a given mix is compacted with different compaction hammers, and these variations are of concern to both public highway agencies and private industry. Although ASTM and AASHTO procedures for testing Marshall properties were originally written for a hand-held, unsupported hammer, currently, the AASHTO standard (T-245) permits the use of a mechanical hammer. This research team found that several different makes of mechanical hammer are currently in use, and some agencies use homemade hammers. A wide variation in hammer characteristics was found.
Several hammer-related variables that play a key role in influencing Marshall test results were identified. The people surveyed most frequently cited pedestal support and hammer alignment as the equipment characteristics that most significantly affect the level of compaction achieved with a given set of equipment. This finding was verified by the preliminary test results developed in the laboratory study. However, it also was found that inconsistencies in test results could be compounded by subtle differences in the interpretation of the procedures and by the use of nonstandard or defective breaking heads. Operator-related factors, factors associated with the compaction device and the breaking head, and their interactions, together, constitute a fairly complex environment.
A method (procedure and equipment) for quantifying the effect of key equipment-related variables on Marshall test results is currently not available. In the absence of such technology, several agencies, both in the United States and in Canada, regularly cooperate in round-robin or mix-exchange programs, which enable them to evaluate their own performance relative to the performance of other participating agencies. An empirical procedure for measuring the pedestal reaction of a mechanical hammer is currently available. However, this procedure, in which the diameter of a compacted penny is measured, cannot
TRANSPORTATION RESEARCH RECORD 1171
be used to calibrate the Marshall hammer; nor does it address variations in Marshall properties (stability and flow) resulting from equipment variables such as different breaking heads.
The feasibility of developing instrumentation that would measure the amount of energy delivered to the specimen during the compaction process was demonstrated. However, further development is needed to adapt this technology to the field calibration of Marshall hammers. The development and implementation of a field compaction procedure would provide
1. A means for evaluating the characteristics of different compaction devices and the interaction of these devices with the pedestal and base support. (The latter point is important because pedestal type and base support generally vary from site to site.)
2. A means to identify within- and between-operator variability associated with variations in test procedure.
3. A datum that could be used to standardize the compaction process and provide a reference in cases requiring litigation.
ACKNOWLEDGMENTS
The authors wish to thank the Arizona Department of Transportation for their financial support of this work. Particular thanks are given to Ron Collins, Wade Bentensen, and T. A. Williams for supplying data used in this paper and to the others who so graciously shared their experiences.
REFERENCES
1. T. D. White. Marshall Procedures for Design and Quality Control of Asphalt Mixtures. Proc., Association of Asphalt Paving Technologists, 1985, pp. 265-284.
2. P. S. Kandhal and W. S. Koehler. Marshall Mix Design Method: Current Practices. Proc., Association of Asphalt Paving Technologists, 1985, pp. 284-302.
3. G. I. Lee, P. I . Arsenault, and F. A. Gervais. Report on the 1983 Canadian Asphalt Mix Exchange. Proc., Twenty-Ninth Annual Conference of Canadian Technical Asphalt Association, Nov. 1984, pp. 2-29.
4. V. P. Drul and T. A. Williams. Report on the 1980 Canadian Asphalt and Mix Exchange Programs. Proc., Twenty-Sixth Annual Conference of Canadian Technical Asphalt Association, Nov. 1981, 58 pp.
5. F. A. Gervais and G. I. Lee. The 1984 Canadian Asphalt Mix Exchange. Proc, 30th Annual Conference of Canadian Technical Asphalt Association, Nov. 1985.
6. Z. Siddiqui, M. W. Trethewey, and D. A. Anderson. Calibration of Marshall Hammer. Final Report PTI 8710. Arizona Department of Transportation, Phoenix.
7. M. W. Trethewey and H. A. Evensen. Development and Application of Multiple Input Models for Structural Noise Source Identification of Forge Hammers, Part II: Application. Journal of the Acoustical Society of America, Vol. 75, No. 4, 1984, pp. 1099-1104.
Publicalion of this paper sponsored by Committee on Characteristics of Bituminous Paving Mixtures To Meet Structural Requirements.