Embed Size (px)
Citation preview

Title Page:
Variability of Repeated Coronary Artery Calcium Scoring and Radiation
Dose on 64-slice and 16-slice CT by Prospective
Electrocardiograph-triggered Axial and Retrospective
Electrocardiograph-gated Spiral CT - A Phantom Study
Jun Horiguchi, MD 1) [email protected]
Masao Kiguchi, RT 1) [email protected]
Chikako Fujioka, RT 1) [email protected]
Yun Shen, RT 2) [email protected]
Ryuichi Arie, RT 1) [email protected]
Kenichi Sunasaka, RT 3) [email protected]
Toshiro Kitagawa, MD 4) [email protected]
Hideya Yamamoto, MD 4) [email protected]
Katsuhide Ito, MD Prof 5) [email protected]
1) Department of Clinical Radiology, Hiroshima University Hospital
Address: 1-2-3, Kasumi-cho, Minami-ku, Hiroshima, 734-8551, Japan
2) CT Lab of great China, GE Healthcare
Address: L12&L15, Office Tower, Langham Place, 8 Argyle Street, Mongkok Kowloon,
Hong Kong
3) GE Yokogawa Medical Systems, Ltd.
1
Address: 4-7-127, Asahigaoka, Hino-shi, Tokyo, 101-8503, Japan
4) Department of Molecular and Internal Medicine, Division of Clinical Medical
Science, Programs for Applied Biomedicine, Graduate School of Biomedical Sciences,
Hiroshima University
Address: 1-2-3, Kasumi-cho, Minami-ku, Hiroshima, 734-8551, Japan
5) Department of Radiology, Division of Medical Intelligence and Informatics,
Programs for Applied Biomedicine, Graduate School of Biomedical Sciences,
Hiroshima University
Address: 1-2-3, Kasumi-cho, Minami-ku, Hiroshima, 734-8551, Japan
This study was financially supported by Tsuchiya Foundation
(http://www.tsuchiya-foundation.or.jp), Hiroshima, Japan.
Corresponding author:
Jun Horiguchi, MD
Tel: +81 82 2575257, Fax: +81 82 2575259
E-mail: [email protected]
Short running head:
Variability of CACS on 64- and 16-slice CT
2

Title
Variability of Repeated Coronary Artery Calcium Scoring and Radiation
Dose on 64-slice and 16-slice CT by Prospective
Electrocardiograph-triggered Axial and Retrospective
Electrocardiograph-gated Spiral CT - A Phantom Study
1
Abstract
Rationale and Objectives: To compare coronary artery calcium scores, the variability
and radiation doses on 64-slice and 16-slice CT scanners by both prospective
electrocardiograph (ECG)-triggered and retrospective ECG-gated scans.
Materials and Methods: Coronary artery models (n=3) with different plaque CT
densities (~240 HU, ~600 HU and ~1000 HU) of four sizes (1 mm, 3 mm, 5 mm and 10
mm in length) on a cardiac phantom were scanned three times in 5 heart rate sequences.
The tube current-time-products were set to almost the same on all four protocols (32.7
mAs for 64-slice prospective and retrospective scans, 33.3 mAs for 16-slice prospective
and retrospective scans). Slice-thickness was set to 2.5 mm in order to keep the
radiation dose low. Overlapping reconstruction with 1.25 mm increment was applied on
the retrospective ECG-gated scan.
Results: The coronary artery calcium scores were not different between the four
protocols (one-factor ANOVA, Agatston; p=0.32, volume; p=0.19 and mass; p=0.09).
Two-factor factorial ANOVA test revealed that the interscan variability was different
between protocols (p<0.01) and scoring algorithms (p<0.01). The average variability of
Agatston/volume/mass scoring and effective doses were 64-slice prospective scan:
16%/15%/11% and 0.5 mSv, 64-slice retrospective scan: 11%/11%/8% and 3.7 mSv,
16-slice prospective scan: 20%/18%/13% and 0.6 mSv & 16-slice retrospective scan:
16%/15%/11% and 2.9 to 3.5 mSv (depending on the pitch).
Conclusions: Retrospective ECG-gated 64-slice CT showed the lowest variability.
Prospective ECG-triggered 64-slice CT, with low radiation dose, shows low variability
2

on coronary artery calcium scoring comparable to retrospective ECG-gated 16-slice CT.
3

Key Words
CT, coronary artery, calcium, radiation dose
4
Introduction
Coronary artery calcium (CAC) scoring is performed to evaluate the presence of
coronary atherosclerosis or to assess the progression and regression of coronary
atherosclerosis [1]. Therefore, low variability and low radiation exposure are both key
requirements on CAC scoring. Interscan variability of Agatston score [2] on electron
beam CT however, yielding 20% to 37% [3-6] is high, considering that normal
progression of CAC score per year is 14-27% (average 24%) [7] and is accelerated up to
33-48% with significant coronary disease [8,9]. To reduce the variability, the volumetric
approach [3] and the calcium mass [4] were devised as alternative CAC scoring
algorithms. Also, on multidetector CT (MDCT), CAC scoring using the conventional
Agatston method on non-overlapping reconstruction, yields high interscan variability;
23% to 43% [10-12] on 4-slice spiral CT and 22% [13] on 16-slice CT. Through
retrospective ECG-gated overlapping scan, a considerable reduction of interscan
variability of Agatston scores can be achieved; 23% to 12% [10] and 22% to 13% [13],
however with the expense of increased radiation exposure compared with
ECG-triggered scan. Thin-slice images (1.25 mm or 1.5 mm) are shown to also reduce
variability of CAC in both electron beam CT [14,15] and 64-slice CT [16]. It does
however, require increased radiation dose to maintain required image quality. In these
circumstances, CAC scoring is preferably performed with a standard image thickness
(2.5 mm or 3 mm), offering the best balance of low scoring variability and low radiation
dose. The purpose of this study is, using a pulsating cardiac phantom, to assess the
variability of CAC scoring on 64- and 16-slice CT scanners by both prospective
5

ECG-triggered and retrospective ECG-gated scans.
Materials and Methods
Cardiac Phantom
A prototype cardiac phantom is commercially available (ALPHA 2, Fuyo corp.
Tokyo, Japan). The phantom consists of five components: driver, control, support,
rubber balloon and ECG. A controller with an ECG-synchronizer drives the balloon.
The main characteristics of this phantom are programmable variable heart rate
sequences and mimicking of natural heart movements. The detail of the phantom is
described elsewhere [17,18].
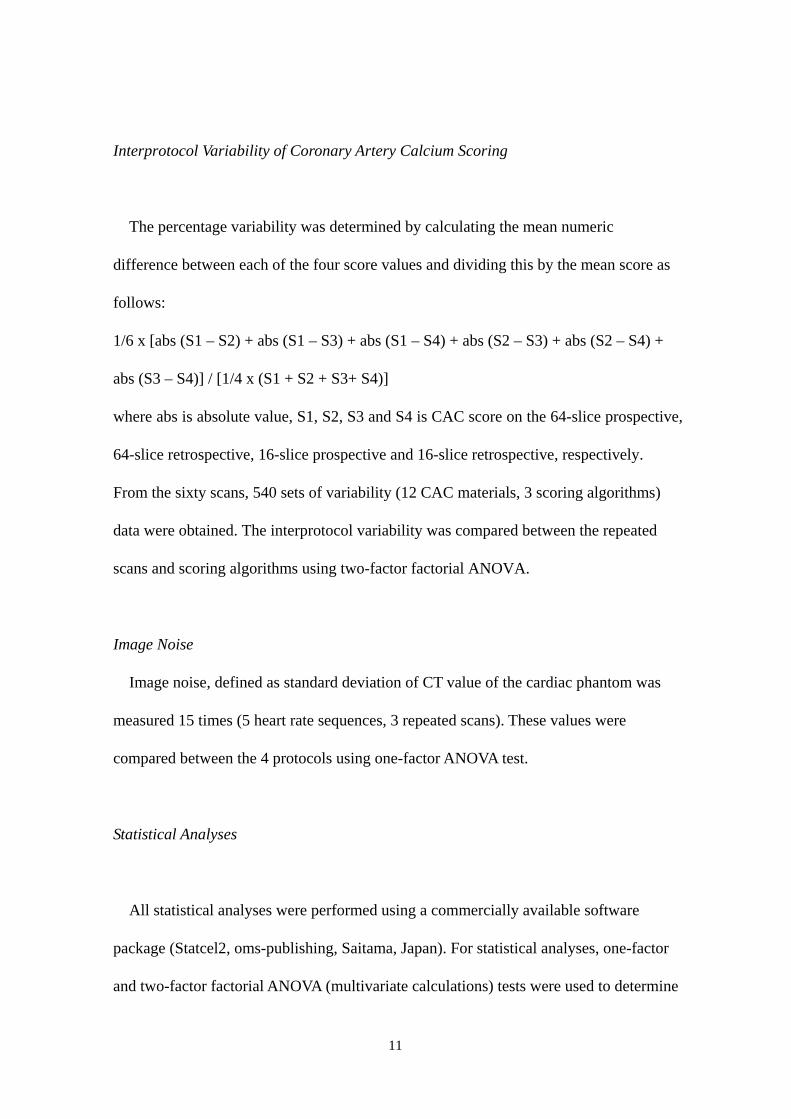
In this study, 5 types of heart rate sequences were programmed (Fig. 1). Two were
stable heart rate sequences, two were ‘shift’ sequences and the remaining one was
arrhythmia. The ‘shift’ sequence was defined as heart rate with small variation, i.e. the
sequence '55 bpm shift' repeat a cycle of 55 bpm, 60 bpm, 55 bpm and 50 bpm. The
volumes of the balloon phantom at the systolic and diastolic phases were approximately
100ml and 200 ml, respectively. The main motion of the coronary artery models was in
in-plane direction. Deformity of the balloon however, resulted in some through-plane
motion.
Coronary Artery Calcium Models
6

Three coronary artery models (plastic cylinders with a diameter of 4 mm) and
different calcified plaque CT densities (silicone: ~240 HU, putty: ~600 HU, Teflon:
~1000 HU) were manufactured for this experiment (Fuyo corp. Tokyo, Japan). Each
coronary artery model had four sizes of plaques; 1 mm, 3 mm, 5 mm and 10 mm in
length. These plaques resulted in an 82% area of stenosis. The coronary artery models
were attached to the balloon phantom (mimicking the heart) with the long axis of the
model corresponding to the z-axis and were surrounded by oil (-112 HU), simulating
epicardial fat (Fig. 2).
Prospective ECG-triggered Axial 64-slice CT Protocol
Three repeated scans with a table advancement of 1mm during the scans were
performed using a 64-slice MDCT scanner (LightSpeed VCT; GE Healthcare,
Waukesha, WI, USA). Prospective ECG-triggered axial scan was performed using 2.5
mm collimation width x 16 detectors so that the center of the temporal window
corresponded to 80% of the R-R interval (diastole of the phantom). The scanning
parameters were a gantry rotation speed of 0.35 sec/rotation, 120 kV and 140 mA. The
matrix size was 512 x 512 pixels and the display field of view was 26 cm. The
reconstruction kernel for soft tissue, which is routinely used in abdominal imaging, was
used. The temporal resolution was 175 msec.
Retrospective ECG-gated Spiral 64-slice CT Protocol
7
Retrospective ECG-gated spiral scan was performed with 1.25 mm collimation width
x 32 detectors. The tube current was controlled using the ECG modulation technique.
The maximal current was set to 140 mA during the cardiac phase 70-90%, and was
reduced in the other phase to a minimum of 30 mA. CT pitch factor was set to 0.20 by
the heart rate, according to the manufacturer’s recommendations for coronary CT
angiography protocol. Images of 2.5 mm thickness were retrospectively reconstructed
with 1.25 mm spacing to reduce partial volume averaging. Multisector reconstruction
was used on the heart rate sequences of 85 beats per minute (bpm) and 85 bpm shift.
The temporal resolution was 134 msec on 85 bpm and varied on 85 bpm shift,
depending on the combination of adjacent heart rates used for image reconstruction.
Other scanning parameters were the same as prospective ECG-triggered 64-slice CT
protocol.
Prospective ECG-triggered Axial 16-slice CT Protocol
A 16-slice MDCT scanner (LightSpeed Ultrafast 16, GE Healthcare, Waukesha, WI,
USA) was used. Scan was performed using with 2.5 mm collimation width x 8 detectors.
Gantry rotation speed was 0.5 sec/rotation. The tube current of 100 mA, which is a
standard level on CAC scoring using 0.5 sec/rotation scanners [19], was used. The
temporal resolution was 250 msec. Other scanning parameters were the same as the
prospective ECG-triggered 64-slice CT protocol.
Retrospective ECG-Gated Spiral 16-slice CT Protocol
8

The scan was performed with 1.25 mm collimation width x 16 detectors. The ECG
modulation technique was not available and the current was set to 100 mA. CT pitch
factors varied from 0.275 to 0.325 by the heart rate, according to the manufacturer’s
recommendations for coronary CT angiography protocol. Images of 2.5 mm thickness
with 1.25 mm spacing were reconstructed. Multisector reconstruction was used on the
heart rate sequences of 85 bpm and 85 bpm shift. The temporal resolution was 158 msec
on 85 bpm and varied on 85 bpm shift, depending on the combination of adjacent heart
rates used for image reconstruction. Other scanning parameters were the same as the
prospective ECG-triggered 16-slice CT protocol.
Calcium Scoring
The Agatston [2], calcium volume and mass [4], summing over all slices
corresponding to each CAC model, were determined on a commercially available
external workstation (Advantage Windows Version 4.2, GE Healthcare, Waukesha, WI,
USA), CAC-scoring software (Smartscore Version 3.5) and a calibrating
anthropomorphic phantom (Anthropomorphic Cardio Phantom, Institute of Medical
Physics, and QRM GmbH) according to the following equations:
1. Agatston score= slice increment / slice thickness x ∑(area x cofactor)
2. Volume=∑(area x slice increment)
3. Mass=∑(area x slice increment x mean CT density) x calibration factor [19]
The calcium phantom was scanned on the 4 protocols to enable calibration for
9
determining calcium mass. All CT scans were scored by one radiologist with 8 year’s
experience of CAC measurement. Interobserver variability was not investigated as CAC
scoring in this phantom study was very simple.
Coronary Artery Calcium Score
Each of the Agatston, volume and mass scores, in logarithmic scale in order to reduce
skewness, were compared between the protocols using one-factor ANOVA test. Sixty
scans (4 protocols, 5 heart rate sequences, 3 repeated scans) were performed on 12 CAC
materials.
Interscan Variability of Repeated Coronary Artery Calcium Scoring
The percentage variability was determined by calculating the mean numeric
difference between each of the three score values and dividing this by the mean score as
follows:
1/3 x [abs (S1 – S2) + abs (S2 – S3) + abs (S3 – S1)] / [1/3 x (S1 + S2 + S3)]
where abs is absolute value, S1 is CAC score on the first scan, and S2 and S3 are the
CAC scores on the second and third scans, respectively. From the sixty scans (4
protocols, 5 heart rate sequences and 3 scans), 720 sets of variability (12 CAC materials,
3 scoring algorithms) data were obtained. The interscan variability was compared
between the protocols and scoring algorithms using two-factor factorial ANOVA.
10
Interprotocol Variability of Coronary Artery Calcium Scoring
The percentage variability was determined by calculating the mean numeric
difference between each of the four score values and dividing this by the mean score as
follows:
1/6 x [abs (S1 – S2) + abs (S1 – S3) + abs (S1 – S4) + abs (S2 – S3) + abs (S2 – S4) +
abs (S3 – S4)] / [1/4 x (S1 + S2 + S3+ S4)]
where abs is absolute value, S1, S2, S3 and S4 is CAC score on the 64-slice prospective,
64-slice retrospective, 16-slice prospective and 16-slice retrospective, respectively.
From the sixty scans, 540 sets of variability (12 CAC materials, 3 scoring algorithms)
data were obtained. The interprotocol variability was compared between the repeated
scans and scoring algorithms using two-factor factorial ANOVA.
Image Noise
Image noise, defined as standard deviation of CT value of the cardiac phantom was
measured 15 times (5 heart rate sequences, 3 repeated scans). These values were
compared between the 4 protocols using one-factor ANOVA test.
Statistical Analyses
All statistical analyses were performed using a commercially available software
package (Statcel2, oms-publishing, Saitama, Japan). For statistical analyses, one-factor
and two-factor factorial ANOVA (multivariate calculations) tests were used to determine
11
differences. When statistical significance was observed by two-factor factorial ANOVA,
the results were made post hoc by Scheffé test for multiple pairwise comparisons.
P-values < 0.05 were considered to identify significant differences.
Radiation Dose
Volume computed tomography dose index (CTDIvol) displayed on Dose Report on
the CT scanner was recorded on each protocol. As dose-length product (DLP) on the
phantom is not suited for simulating DLP on patients’ scan, DLP is defined with the
assumption that the heart ranges 12 cm in the z-axis.
DLP (mGy x cm) = CTDIvol (Gy) x 12 cm
A reasonable approximation of the effective dose (E) can be obtained using the equation
[20].
E=k x DLP
where E is Effective dose estimate and k = 0.017 mSv x mGy-1x cm-1. This value is
applicable to chest scans and is the average between the male and female models.
Results
Coronary Artery Calcium Scores
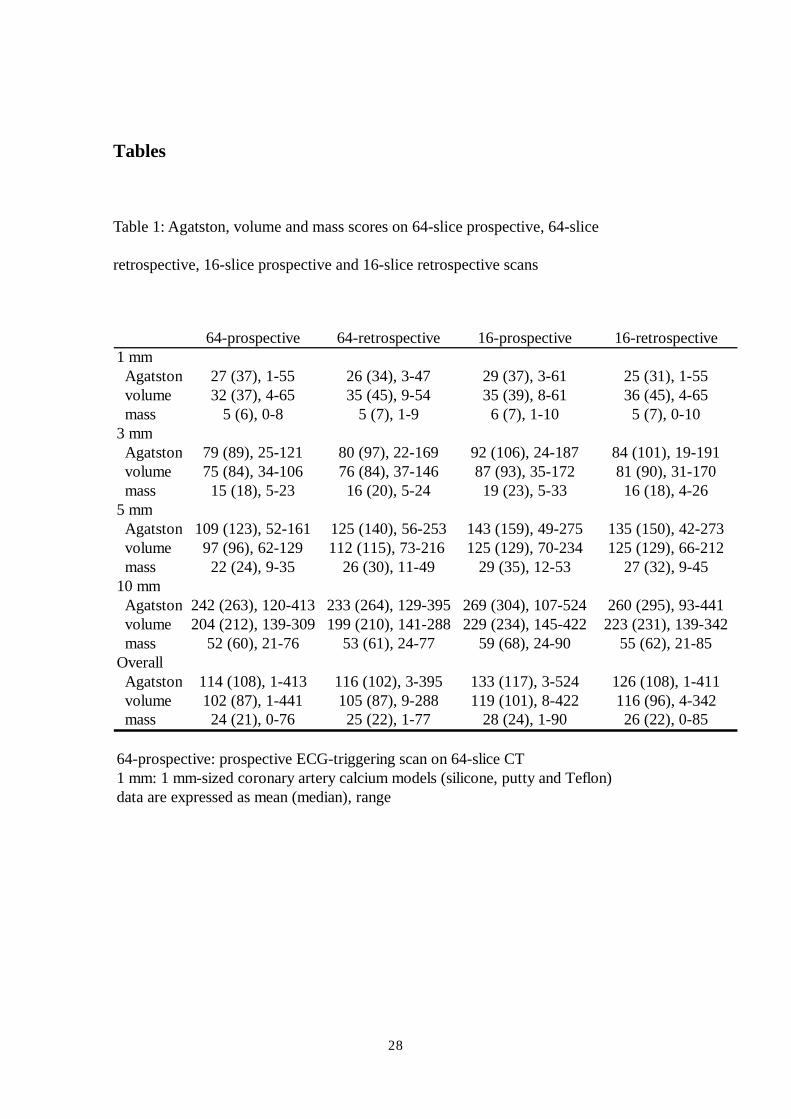
The Agatston, volume and mass scores on the protocols are summarized in Table 1.
All calcium scores were positive. The minimal score was 1, 3 and 0.4 on Agatston,
12

volume and mass scores, respectively. One-factor ANOVA revealed that there was no
statistical significance of log transformed CAC scores between protocols (Agatston;
p=0.52, volume; p=0.26 and mass; p=0.25).
Interscan Variability of Repeated Coronary Artery Calcium Scoring
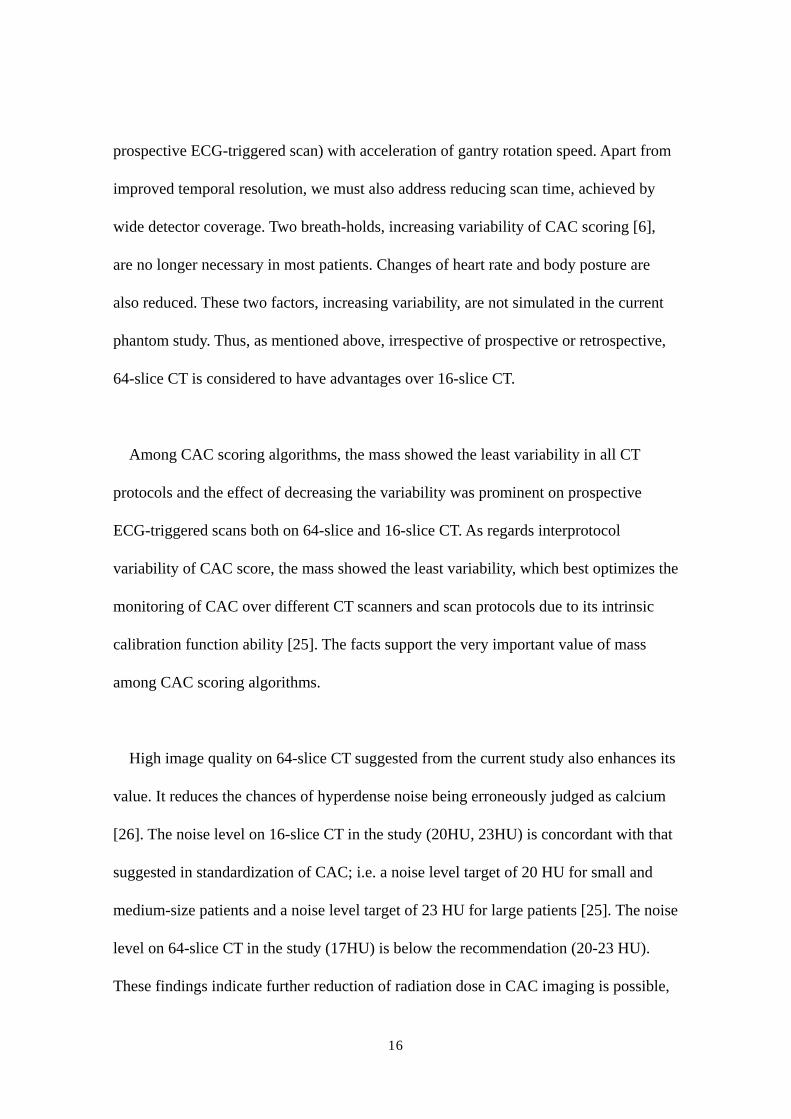
The interscan variability in Agatston, volume and mass scores on the protocols are
shown in Figure 3. Two-factor factorial ANOVA test revealed that there were significant
differences between protocols (p<0.01) and scoring algorithms (p<0.01). The Scheffé
test revealed that the interscan variability on 64-slice retrospective protocol was lower
than that on 64-slice prospective (p<0.01), 16-slice retrospective (p<0.01) or 16-slice
prospective (p<0.01) protocols. The interscan variability in mass score was lower than
that in Agatston (p<0.01) or volume (p<0.01).
Interprotocol Variability of Coronary Artery Calcium Scoring
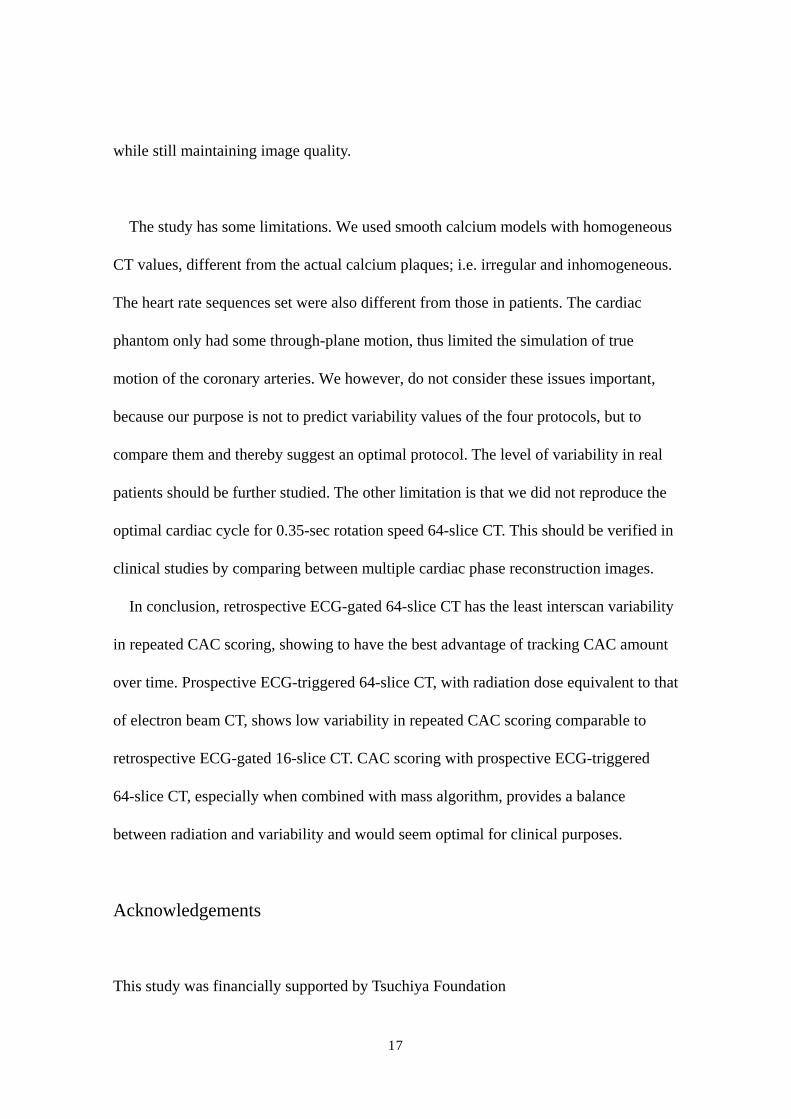
The interprotocol variability of CAC Score on Agatston, volume and mass scoring
algorithms is shown in Figure 4. Two-factor factorial ANOVA test revealed that there
were not significant differences between scans (p=0.13), however there were between
scoring algorithms (p<0.05). The Scheffé test revealed that the interprotocol variability
in mass score was lower than that in Agatston (p<0.05) or volume (p<0.05).
Image Noise
13

One-factor ANOVA revealed that image noise was different between the protocols
(p<0.01). The standard deviation of CT value on 64-slice prospective, 64-slice
retrospective, 16-slice prospective and 16-slice retrospective scans was 17.4±0.5 HU,
16.9±0.7 HU, 20.2±0.7 HU and 22.8±0.8 HU, respectively.
Radiation Dose
CTDIvol displayed on Dose Report on the CT scanner and the effective doses,
estimated for a typical patient were 64-slice prospective: 2.3 mGy/ 0.5 mSv, 64-slice
retrospective: 18.3 mGy/ 3.7 mSv, 16-slice prospective: 3.1 mGy/ 0.6 mSv and 16-slice
retrospective: 14.4 to 17.0 mGy/ 2.9 to 3.5 mSv (depending on the pitch).
Discussion
The present study is the first to compare variability of repeated CAC scoring and
radiation doses on 64-slice and 16-slice CT scanners by both prospective ECG-triggered
and retrospective ECG-gated scans. The results show that retrospective ECG-gated
64-slice CT shows the lowest variability and that prospective ECG-triggered 64-slice
CT, with low radiation dose, shows low variability on repeated measurement
comparable to retrospective ECG-gated 16-slice CT.
The partial volume averaging is known to be a major contributor influencing
14

interscan variability on CAC. The use of thin-slice images [14-16] or overlapping image
reconstruction [10,13,22] has been suggested to reduce partial volume averaging. Some
studies however, show that thin-slice images lead to significantly increased CAC scores,
due to increased noise and improved detection of subtle CAC [23,24]. This indicates
that thin-slice images need increased radiation dose in order to maintain desirable image
quality. We, therefore, decided on a slice thickness of 2.5 mm in all CT protocols. Since
the purpose of CAC scoring is screening of coronary atherosclerosis or tracing its
progression and regression, radiation exposure needs to be kept “as low as reasonably
achievable (ALARA)”. In this respect, the effective doses of prospective ECG-triggered
CT in the current study (64-slice CT; 0.5 mSv, 16-slice CT; 0.6 mSv), which are
comparable to that of electron beam CT (0.7 mSv) [21], have a definite advantage over
retrospective ECG-gated scan.
CAC scores in three scoring algorithms were not significantly different. The finding
suggests that, in the CT scanner we used, CAC score does not depend on either
prospective/ retrospective protocol or 64-slice / 16-slice CT. Concerning interscan
variability of repeated CAC score, 64-slice retrospective scan showed the least interscan
variability, implicating that this can most reliably assess the progression and regression
of coronary atherosclerosis. The interscan variability on 64-slice prospective scan also
seems to be promising, as being almost the same level of the 16-slice retrospective scan.
We believe that this finding is related to substantial reduction of motion artifacts, which
is also one of the most important factors in increasing interscan variability on CAC.
This is achieved by improved temporal resolution of 64-slice CT (175msec for
15
prospective ECG-triggered scan) with acceleration of gantry rotation speed. Apart from
improved temporal resolution, we must also address reducing scan time, achieved by
wide detector coverage. Two breath-holds, increasing variability of CAC scoring [6],
are no longer necessary in most patients. Changes of heart rate and body posture are
also reduced. These two factors, increasing variability, are not simulated in the current
phantom study. Thus, as mentioned above, irrespective of prospective or retrospective,
64-slice CT is considered to have advantages over 16-slice CT.
Among CAC scoring algorithms, the mass showed the least variability in all CT
protocols and the effect of decreasing the variability was prominent on prospective
ECG-triggered scans both on 64-slice and 16-slice CT. As regards interprotocol
variability of CAC score, the mass showed the least variability, which best optimizes the
monitoring of CAC over different CT scanners and scan protocols due to its intrinsic
calibration function ability [25]. The facts support the very important value of mass
among CAC scoring algorithms.
High image quality on 64-slice CT suggested from the current study also enhances its
value. It reduces the chances of hyperdense noise being erroneously judged as calcium
[26]. The noise level on 16-slice CT in the study (20HU, 23HU) is concordant with that
suggested in standardization of CAC; i.e. a noise level target of 20 HU for small and
medium-size patients and a noise level target of 23 HU for large patients [25]. The noise
level on 64-slice CT in the study (17HU) is below the recommendation (20-23 HU).
These findings indicate further reduction of radiation dose in CAC imaging is possible,
16
while still maintaining image quality.
The study has some limitations. We used smooth calcium models with homogeneous
CT values, different from the actual calcium plaques; i.e. irregular and inhomogeneous.
The heart rate sequences set were also different from those in patients. The cardiac
phantom only had some through-plane motion, thus limited the simulation of true
motion of the coronary arteries. We however, do not consider these issues important,
because our purpose is not to predict variability values of the four protocols, but to
compare them and thereby suggest an optimal protocol. The level of variability in real
patients should be further studied. The other limitation is that we did not reproduce the
optimal cardiac cycle for 0.35-sec rotation speed 64-slice CT. This should be verified in
clinical studies by comparing between multiple cardiac phase reconstruction images.
In conclusion, retrospective ECG-gated 64-slice CT has the least interscan variability
in repeated CAC scoring, showing to have the best advantage of tracking CAC amount
over time. Prospective ECG-triggered 64-slice CT, with radiation dose equivalent to that
of electron beam CT, shows low variability in repeated CAC scoring comparable to
retrospective ECG-gated 16-slice CT. CAC scoring with prospective ECG-triggered
64-slice CT, especially when combined with mass algorithm, provides a balance
between radiation and variability and would seem optimal for clinical purposes.
Acknowledgements
This study was financially supported by Tsuchiya Foundation
17

(http://www.tsuchiya-foundation.or.jp), Hiroshima, Japan.
Abbreviations
CT: computed tomography
CAC: coronary artery calcium
ECG: electrocardiograph
HU: Hounsfield unit
DLP: dose-length product
CTDIvol: volume computed tomography dose index
18

References
1. Callister TQ, Raggi P, Cooil B, Lippolis NJ, Russo DJ. Effect of HMG-CoA
reductase inhibitors on coronary artery disease as assessed by electron-beam
computed tomography. N Engl J Med. 1998;339:1972-1978.
2. Agatston AS, Janowitz WR, Hildner FJ, Zusmer NR, Viamonte M, Detrano R.
Quantification of coronary calcium using ultrafast computed tomography. J Am Coll
Cardiol. 1990;15:827-832.
3. Callister TQ, Cooil B, Raya SP, et al. Coronary artery disease: improved
reproducibility of calcium scoring with an electron-beam CT volumetric method.
Radiology. 1998;208:807-814.
4. Yoon HC, Greaser III LE, Mather R, Sinha S, McNitt-Gray MF, Goldin JG..
Coronary artery calcium: alternate methods for accurate and reproducible
quantitation. Acad Radiol. 1997;4:666-673.
5. Wang SJ, Detrano BC, Secci A, et al. Detection of coronary calcification with
electron-beam computed tomography: evaluation of interexamination
reproducibility and comparison of three image-acquisition protocols. Am Heart J.
1996;132:550-558.
6. Achenbach S, Ropers D, Mohlenkamp S, et al. Variability of repeated coronary
artery calcium measurements by electron beam tomography. Am J Cardiology.
2001;87:210-213.
7. Maher JE, Bielak LF, Raz JA, Sheedy PF II, Schwartz RS, Peyser PA. Progression
of coronary artery calcification: a pilot study. Mayo Clin Proc. 1999;74:347-355.
19

8. Janowitz WR, Agatston AS, Viamonte M Jr. Comparison of serial quantitative
evaluation of calcified coronary artery plaque by ultrafast computed tomography in
persons with and without obstructive coronary artery disease. Am J Cardiol.
1991;68:1-6.
9. Fischbach R, Heindel W. Detection and quantification of coronary calcification: an
update. Rofo. 2000;172:407-414.
10. Ohnesorge B, Flohr T, Fischbach R, et al. Reproducibility of coronary calcium
quantification in repeat examinations with retrospectively ECG-gated multisection
spiral CT. Eur Radiol. 2002;12:1532-1540.
11. Van Hoe LR, De Meerleer KG, Leyman PP, Vanhoenacker PK. Coronary artery
calcium scoring using ECG-gated multidetector CT: effect of individually optimized
image-reconstruction windows on image quality and measurement reproducibility.
AJR. 2003;181:1093-1100.
12. Daniell AL, Wong ND, Friedman JD et al, Reproducibility of coronary calcium
measurements from multidetector computed tomography. J Am Coll Cardiol.
2003;41:456A.
13. Horiguchi J, Yamamoto H, Akiyama Y, et al. Variability of repeated coronary artery
calcium measurements by 16-MDCT with retrospective reconstruction. AJR.
2005;184:1917-1923.
14. Callister T, Janowitz W, Raggi P. Sensitivity of two electron beam tomography
protocols for the detection and quantification of coronary artery calcium. AJR.
2000;175:1743-1746.
15. Vliegenthart R, Song B, Hofman A, Witteman JCM, Oudkerk M. Coronary
20

calcification at electron-beam CT: Effect of section thickness on calcium scoring in
vitro and in vivo. Radiology. 2003;229:520-525.
16. Horiguchi J, Matsuura N, Yamamoto H, et al. Variability of repeated coronary artery
calcium measurements by 1.25-mm- and 2.5-mm-thickness images on prospective
electrocardiograph-triggered 64-slice CT. Eur Radiol 2007; on-line DOI
10.1007/s00330-007-0734-7.
17. Horiguchi J, Shen Y, Akiyama Y, et al. Electron beam CT versus 16-MDCT on the
variability of repeated coronary artery calcium measurements in a variable heart rate
phantom. AJR. 2005;185:995-1000.
18. Horiguchi J, Shen Y, Akiyama Y, et al. Electron beam CT versus 16-slice spiral CT:
how accurately can we measure coronary artery calcium volume? Eur Radiol.
2006;16:374-380.
19. Hunold P, Vogt FM, Schmermund A, et al. Radiation exposure during cardiac CT:
Effective doses at multi-detector CT and electron-beam CT. Radiology.
2003;226:145-152.
20. Hong C, Bae KT, Pilgram TK, Suh J, Bradley D. Coronary artery calcium
measurement with multi-detector row CT: in vitro assessment of effect of radiation
dose. Radiology. 2002;225:901-906.
21. Morin RL, Gerber TC, McCollough CH. Radiation dose in computed tomography of
the heart. Circulation 2003;107:917-922.
22. Kopp AF, Ohnesorge B, Becker C, et al. Reproducibility and accuracy of coronary
calcium measurements with multi–detector row versus electron-beam CT. Radiology.
2002;225:113-119.
21
23. Achenbach S, Meissner F, Ropers D, et al. Overlapping cross-sections significantly
improve the reproducibility of coronary calcium measurements by electron beam
tomography: a phantom study. JCAT. 2001;25:569-573.
24. Muhlenbruch G, Thomas G, Wildberger JE, et al. Effect of varying slice thickness
on coronary calcium scoring with multislice computed tomography in vitro and in
vivo. Investigative Radiology. 2005;40:695-699.
25. McCollough CH, Ulzheimer S, Halliburton SS, et al. Coronary artery calcium: a
multiinstitutional, multimanufacturer international standard for quantification at
cardiac CT. Radiology. 2007;243:527-538.
26. Bielak LF, Kaufmann RB, Moll PP, MacCollough CH, Schwartz RS, Sheedy PF II.
Small lesions in the heart identified at electron beam CT: calcification or noise?
Radiology 1994;192:631-636.
22

Figure legends
Fig. 1 Heart Rate Sequences
Graph shows 5 types of heart rate sequences programmed to the ECG generator.
Heart rates in the sequence '55 bpm shift' repeat a cycle of 55 bpm, 60 bpm, 55 bpm and
50 bpm.
23

24
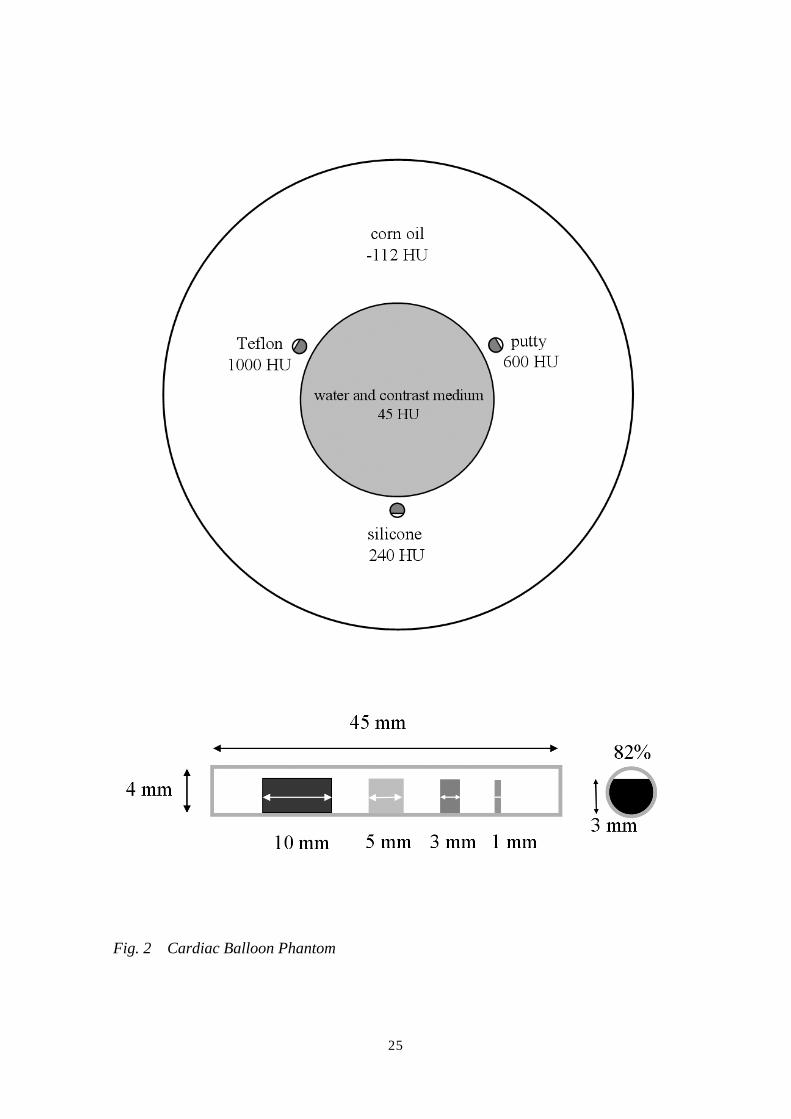
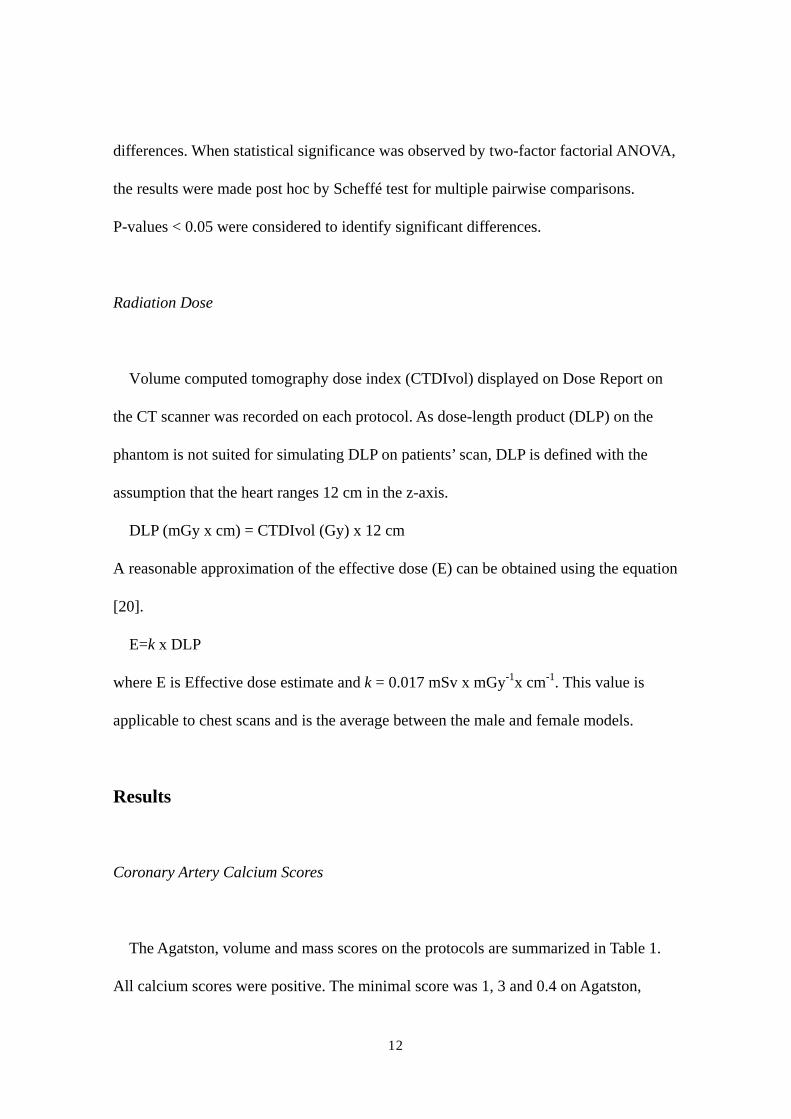
Fig. 2 Cardiac Balloon Phantom
25

Picture shows a pulsating phantom with three coronary artery models, indicated with
arrows. (Figure 2A). The coronary artery models with different CT densities were
attached to a balloon filled with a mixture of water and contrast medium (45 HU) to
simulate noncontrast blood. The balloon was submerged in corn oil (-112 HU),
simulating epicardial and pericardial fat (Figure 2B). The drawing shows four coronary
artery calcium models (1 mm, 3 mm, 5 mm and 10 mm in length) resulting in 75% area
stenosis were inserted into a coronary artery model with a diameter of 4 mm (Figure
2C).
Fig. 3 Interscan Variability of Repeated Coronary Artery Calcium Score
Graph shows the interscan variability in Agatston, volume and mass scoring
algorithms on 4 protocols (16-slice prospective; black, 16-slice retrospective; dark gray,
26

64-slice prospective; light gray and 64-slice retrospective; white). Bars and vertical
lines indicate mean and standard deviation, respectively.
Fig. 4 Interprotocol Variability of Coronary Artery Calcium Score
Graph shows the interprotocol variability of CAC Score on Agatston, volume and
mass scoring algorithms. Bars and vertical lines indicate mean and standard deviation,
respectively.
27
Tables
Table 1: Agatston, volume and mass scores on 64-slice prospective, 64-slice
retrospective, 16-slice prospective and 16-slice retrospective scans
64-prospective 64-retrospective 16-prospective 16-retrospective1 mm Agatston 27 (37), 1-55 26 (34), 3-47 29 (37), 3-61 25 (31), 1-55 volume 32 (37), 4-65 35 (45), 9-54 35 (39), 8-61 36 (45), 4-65 mass 5 (6), 0-8 5 (7), 1-9 6 (7), 1-10 5 (7), 0-103 mm Agatston 79 (89), 25-121 80 (97), 22-169 92 (106), 24-187 84 (101), 19-191 volume 75 (84), 34-106 76 (84), 37-146 87 (93), 35-172 81 (90), 31-170 mass 15 (18), 5-23 16 (20), 5-24 19 (23), 5-33 16 (18), 4-265 mm Agatston 109 (123), 52-161 125 (140), 56-253 143 (159), 49-275 135 (150), 42-273 volume 97 (96), 62-129 112 (115), 73-216 125 (129), 70-234 125 (129), 66-212 mass 22 (24), 9-35 26 (30), 11-49 29 (35), 12-53 27 (32), 9-4510 mm Agatston 242 (263), 120-413 233 (264), 129-395 269 (304), 107-524 260 (295), 93-441 volume 204 (212), 139-309 199 (210), 141-288 229 (234), 145-422 223 (231), 139-342 mass 52 (60), 21-76 53 (61), 24-77 59 (68), 24-90 55 (62), 21-85Overall Agatston 114 (108), 1-413 116 (102), 3-395 133 (117), 3-524 126 (108), 1-411 volume 102 (87), 1-441 105 (87), 9-288 119 (101), 8-422 116 (96), 4-342 mass 24 (21), 0-76 25 (22), 1-77 28 (24), 1-90 26 (22), 0-85
64-prospective: prospective ECG-triggering scan on 64-slice CT1 mm: 1 mm-sized coronary artery calcium models (silicone, putty and Teflon)data are expressed as mean (median), range
28