Embed Size (px)
Citation preview
South Dakota State University
Sadia Salam¹, Rachel McDaniel¹ and Bruce Bleakley²
¹Department of Agricultural and Biosystems Engineering, SDSU;
²Department of Biology and Microbiology, SDSU
Variability, antibiotic sensitivity, and the influence of
particle size on E. coli in Eastern South Dakota’s
streambed sediment

South Dakota State University
Outline
2
• Background
• Study Site
• Methodology
• Results and Discussions
• Conclusion
• Future Work
South Dakota State University
Introduction
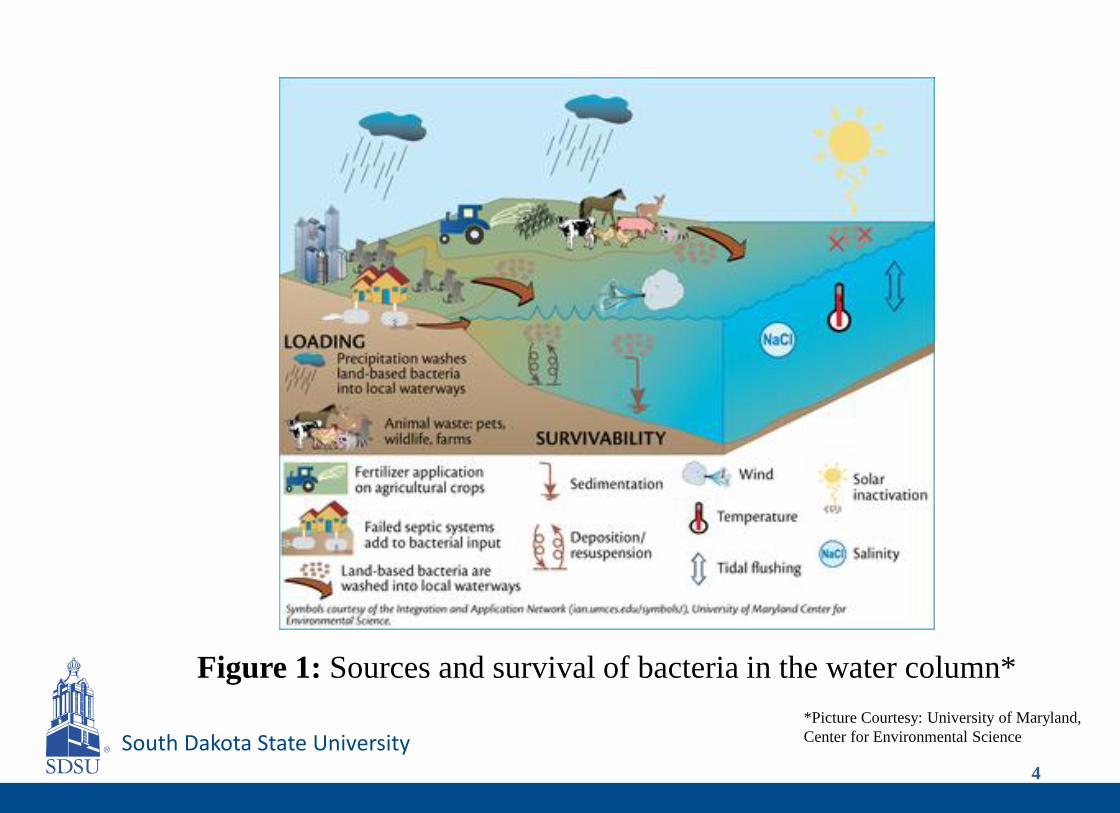
• Fecal Indicator Bacteria (FIB) are more persistent in sediment than water column (Garzio-Hadzick et al., 2010 and
Rehmann et al., 2009)
• E. coli, is the prime water quality impairment in South Dakota’s streams (EPA, 2015)
3
South Dakota State University
Figure 1: Sources and survival of bacteria in the water column*
*Picture Courtesy: University of Maryland,
Center for Environmental Science
4
South Dakota State University
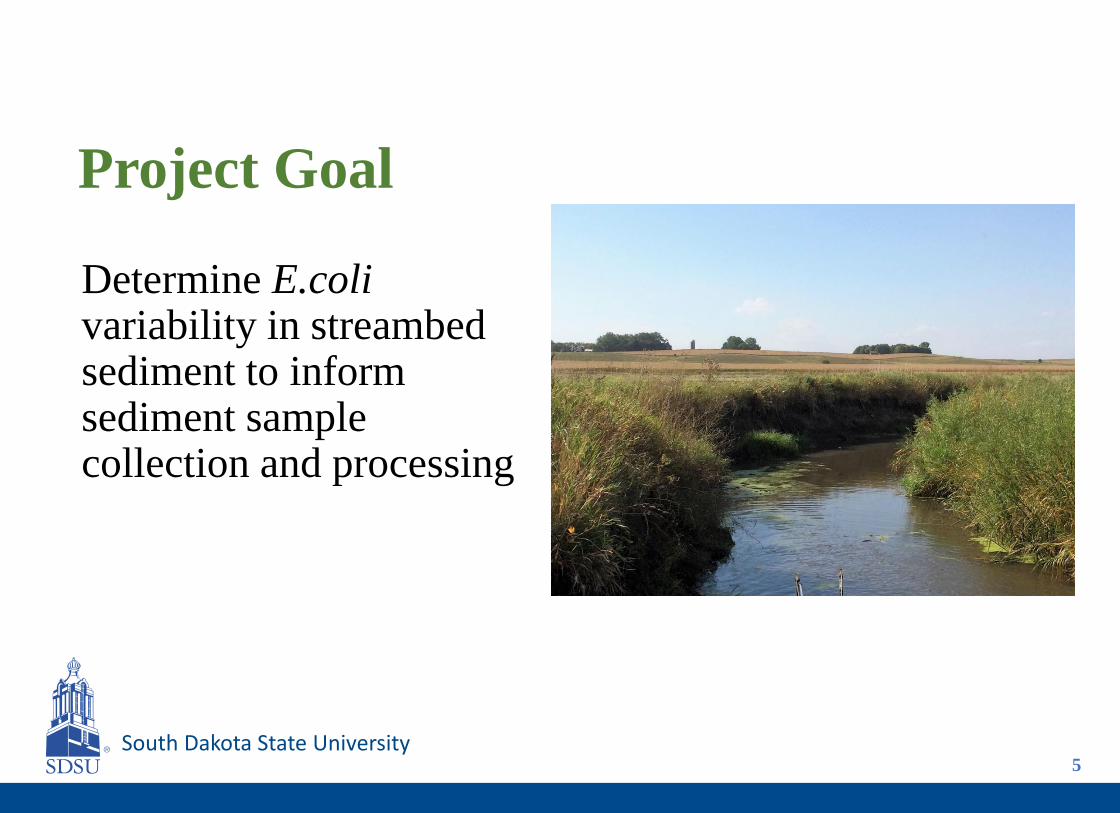
Project Goal
Determine E.colivariability in streambed sediment to inform sediment sample collection and processing
5
South Dakota State University
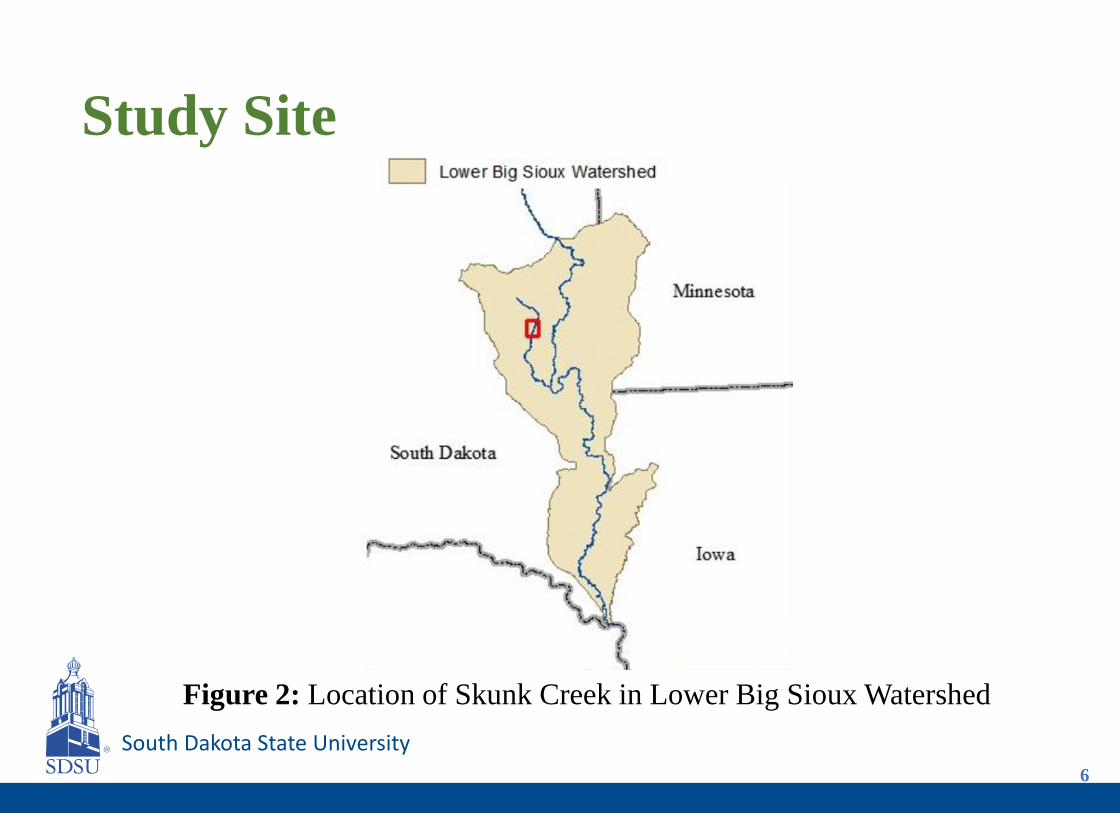
Study Site
Figure 2: Location of Skunk Creek in Lower Big Sioux Watershed
6
South Dakota State University
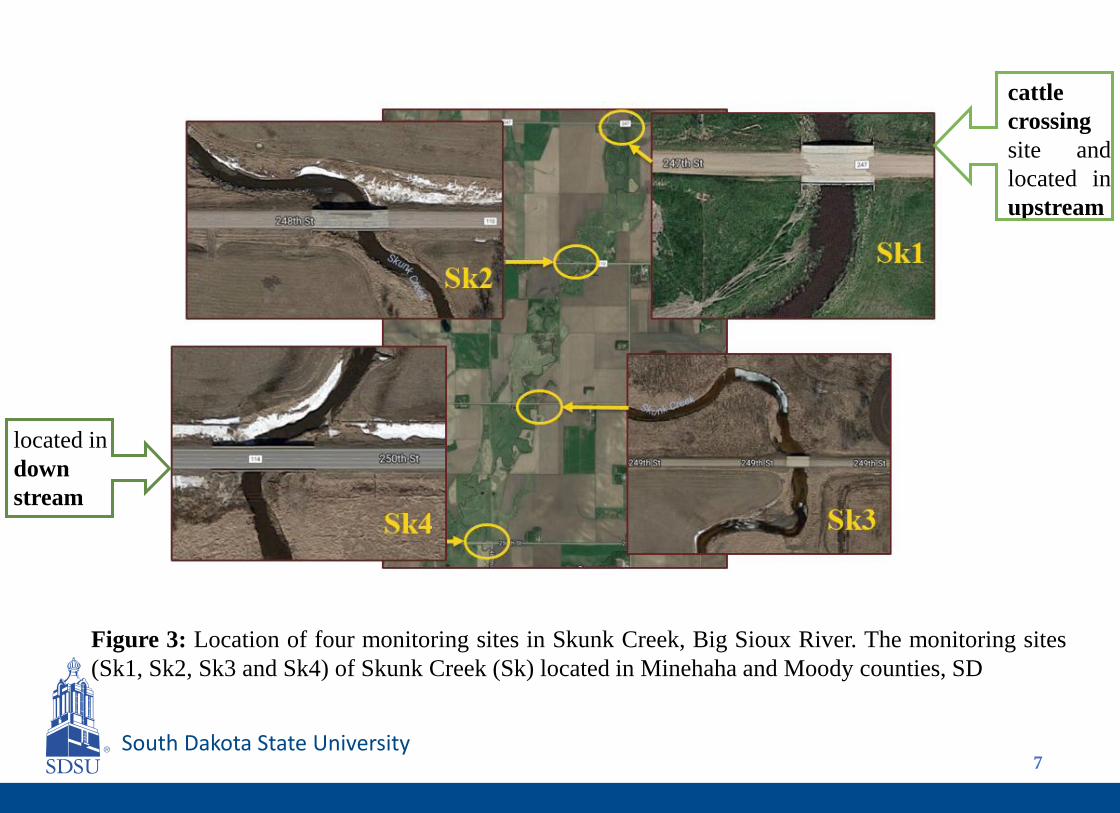
Figure 3: Location of four monitoring sites in Skunk Creek, Big Sioux River. The monitoring sites
(Sk1, Sk2, Sk3 and Sk4) of Skunk Creek (Sk) located in Minehaha and Moody counties, SD
7
cattle
crossing
site and
located in
upstream
located in
down
stream
South Dakota State University
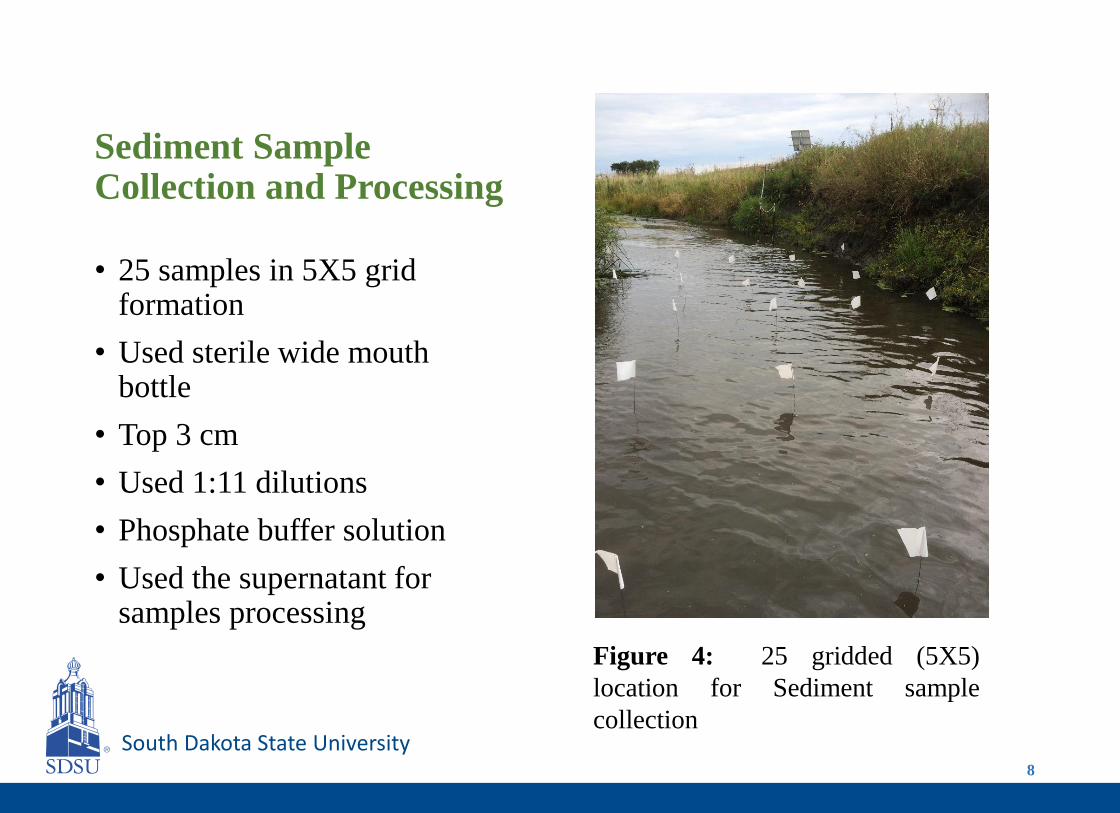
Sediment Sample Collection and Processing
• 25 samples in 5X5 grid formation
• Used sterile wide mouth bottle
• Top 3 cm
• Used 1:11 dilutions
• Phosphate buffer solution
• Used the supernatant for samples processing
Figure 4: 25 gridded (5X5)
location for Sediment sample
collection
8
South Dakota State University
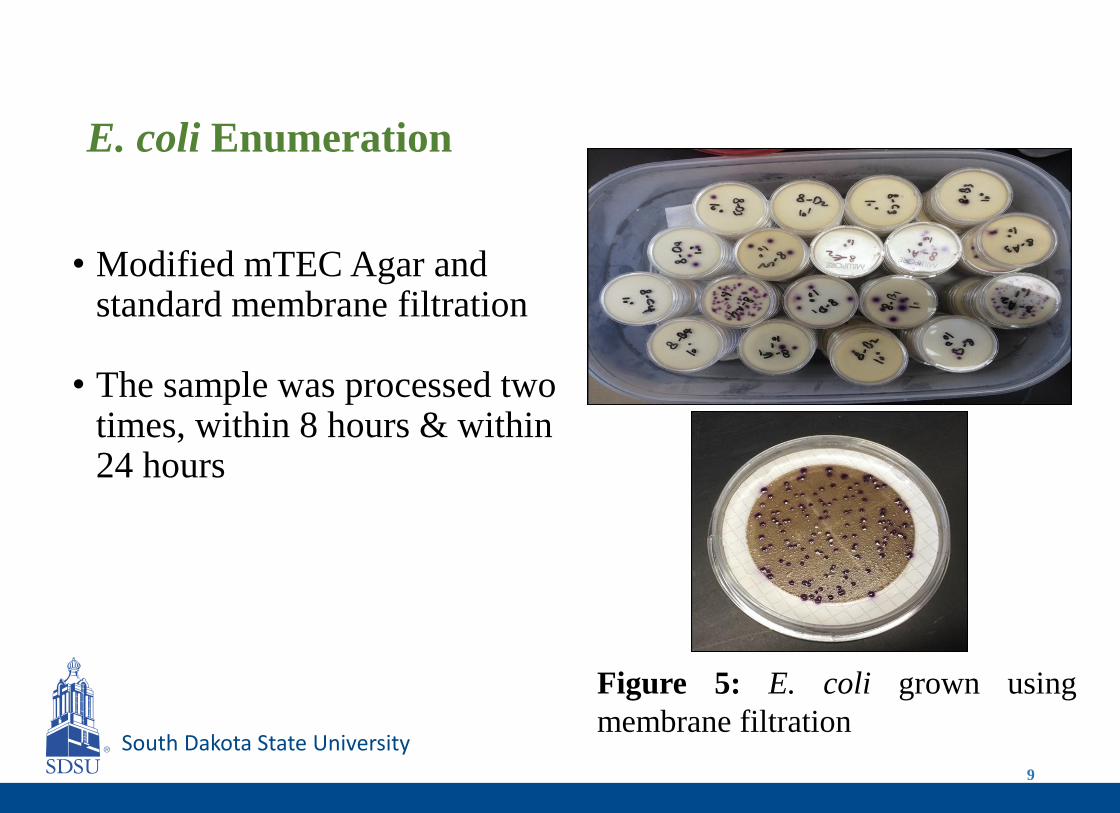
• Modified mTEC Agar and standard membrane filtration
• The sample was processed two times, within 8 hours & within 24 hours
Figure 5: E. coli grown using
membrane filtration
E. coli Enumeration
9
South Dakota State University
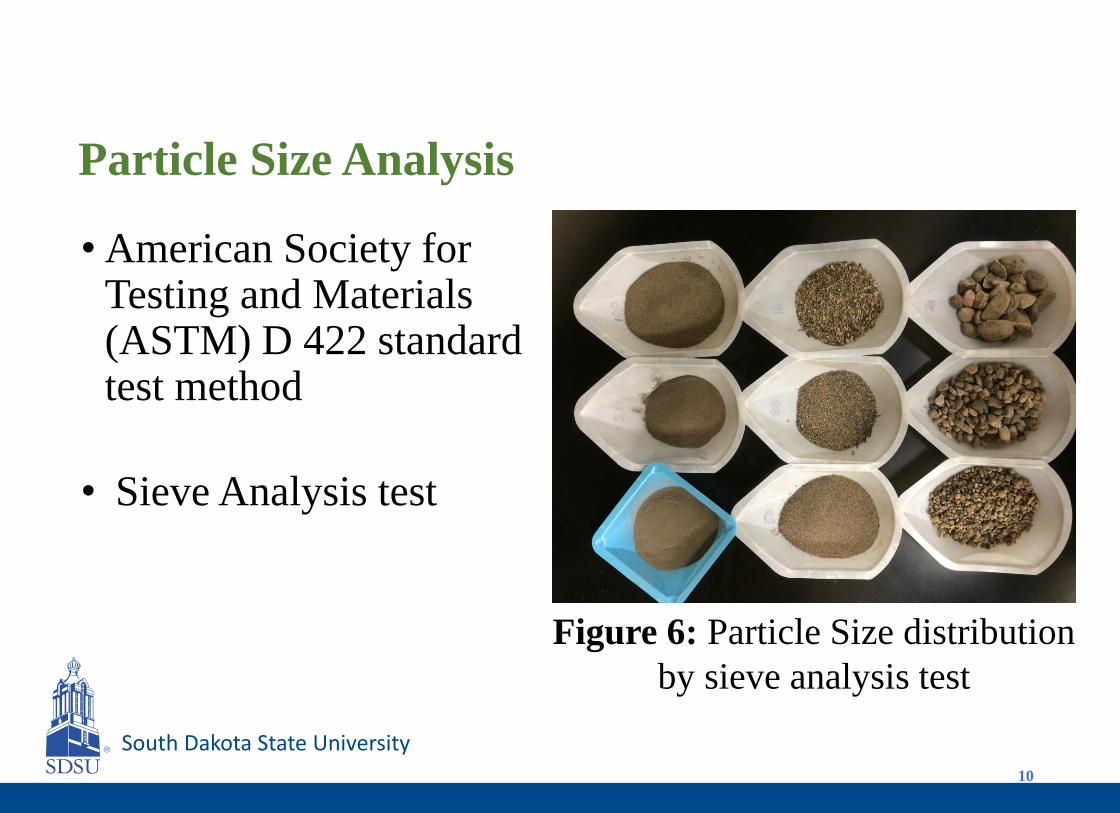
Particle Size Analysis
• American Society for Testing and Materials (ASTM) D 422 standard test method
• Sieve Analysis test
10
Figure 6: Particle Size distribution
by sieve analysis test
South Dakota State University
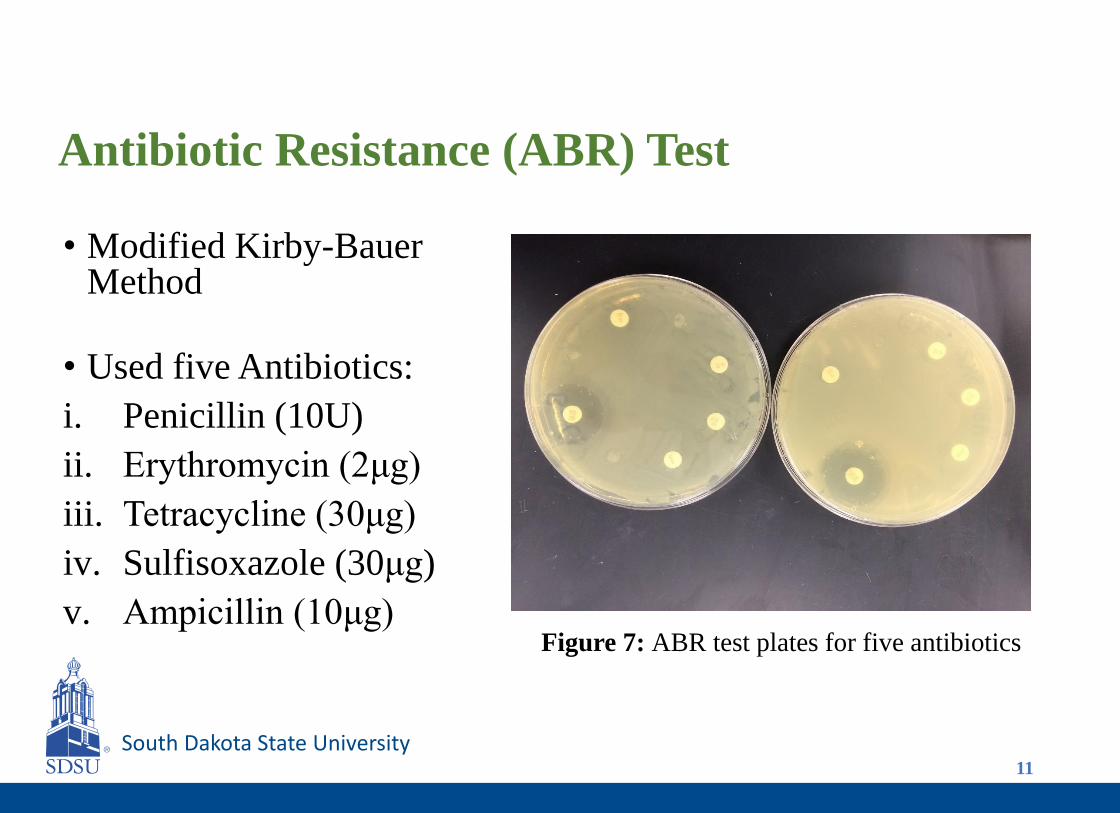
Antibiotic Resistance (ABR) Test
11
• Modified Kirby-Bauer Method
• Used five Antibiotics:
i. Penicillin (10U)
ii. Erythromycin (2μg)
iii. Tetracycline (30μg)
iv. Sulfisoxazole (30μg)
v. Ampicillin (10μg)Figure 7: ABR test plates for five antibiotics

South Dakota State University
Result and Discussion
South Dakota State University
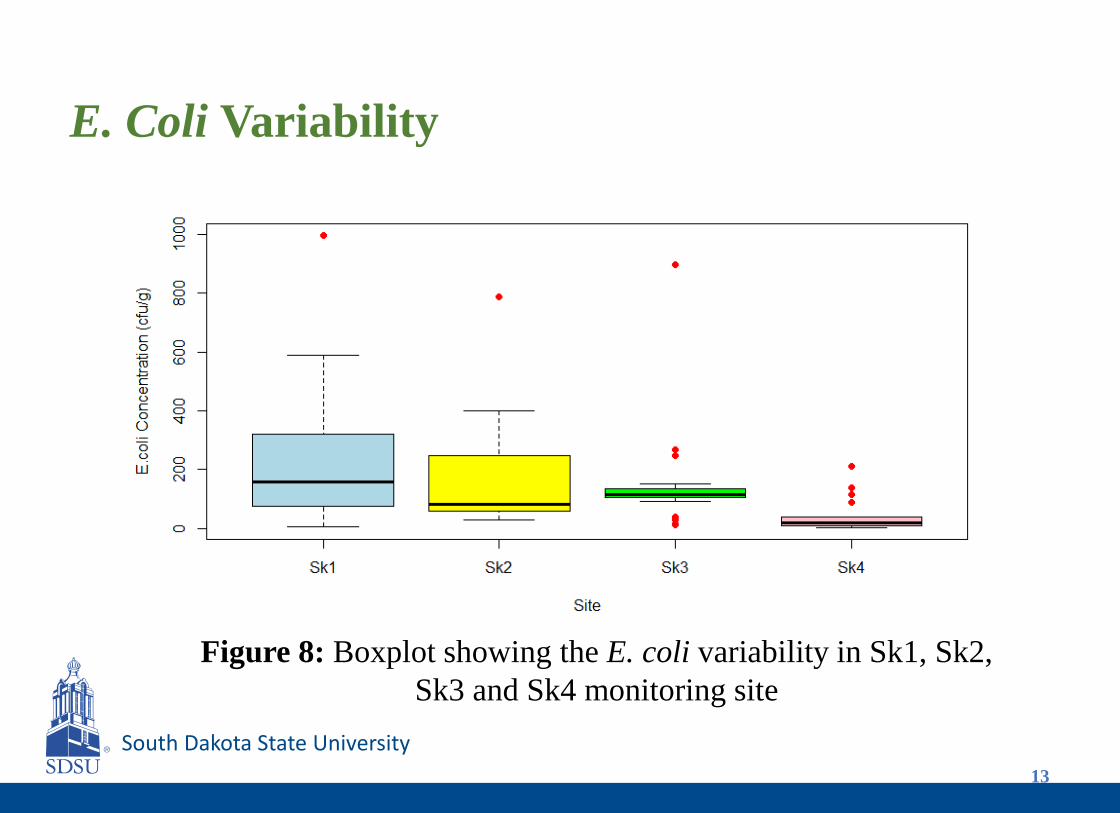
E. Coli Variability
Figure 8: Boxplot showing the E. coli variability in Sk1, Sk2,
Sk3 and Sk4 monitoring site
13
South Dakota State University
Bank of the Stream
Bank of the Stream
Flow
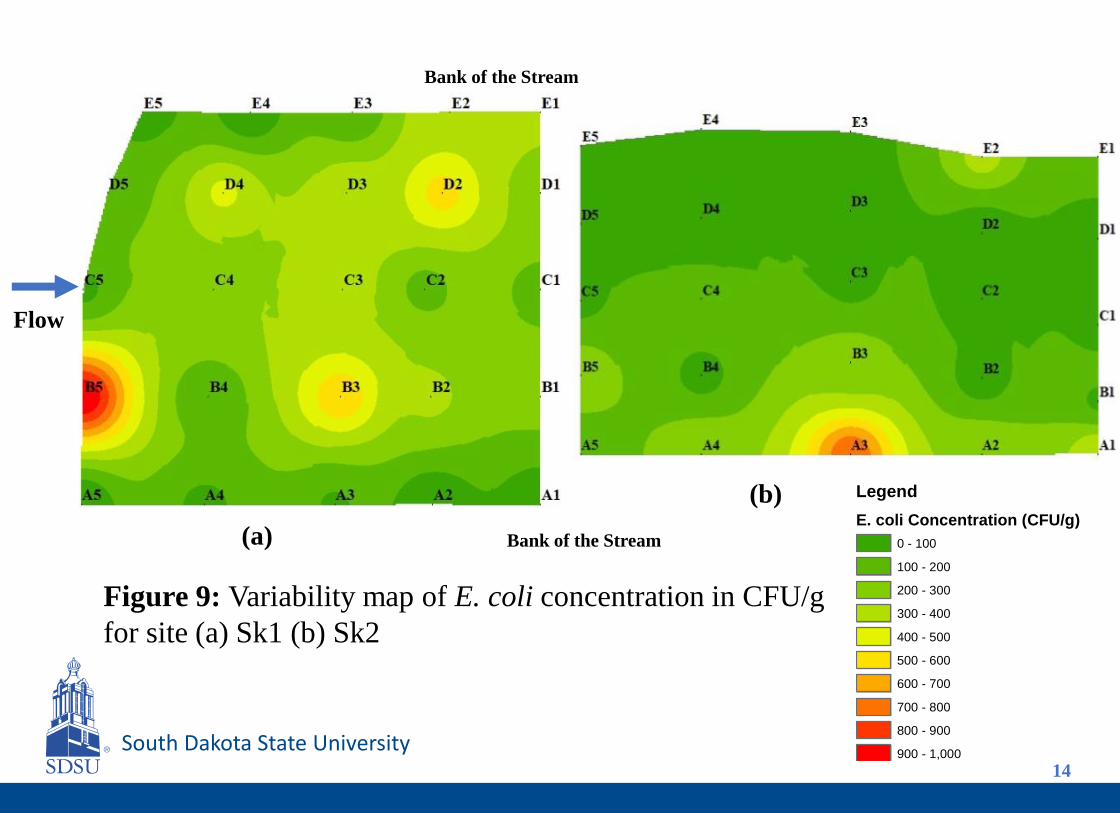
Figure 9: Variability map of E. coli concentration in CFU/g
for site (a) Sk1 (b) Sk2
14
Legend
E. coli Concentration (CFU/g)
0 - 100
100 - 200
200 - 300
300 - 400
400 - 500
500 - 600
600 - 700
700 - 800
800 - 900
900 - 1,000
(a)
(b)
South Dakota State University15
Flow
Bank of the Stream
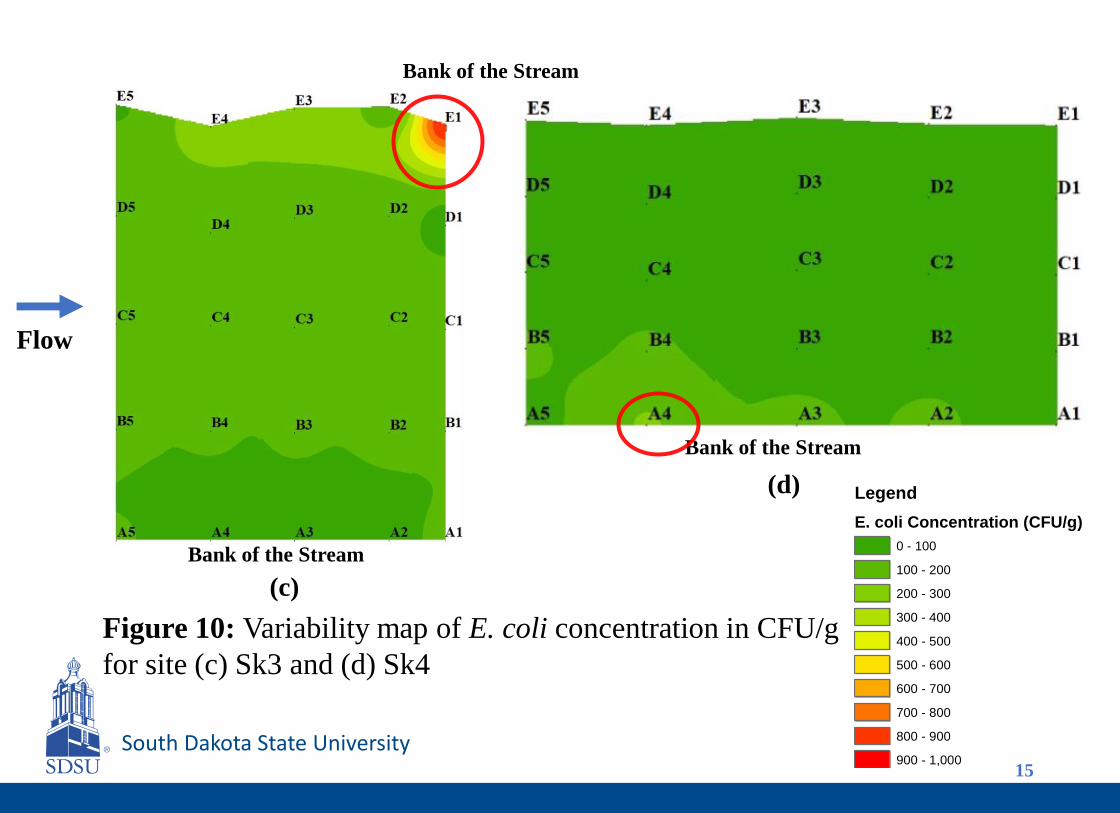
Figure 10: Variability map of E. coli concentration in CFU/g
for site (c) Sk3 and (d) Sk4
Legend
E. coli Concentration (CFU/g)
0 - 100
100 - 200
200 - 300
300 - 400
400 - 500
500 - 600
600 - 700
700 - 800
800 - 900
900 - 1,000
Bank of the Stream
Bank of the Stream
(c)
(d)
South Dakota State University
Bank of the Stream
Bank of the Stream
Flow
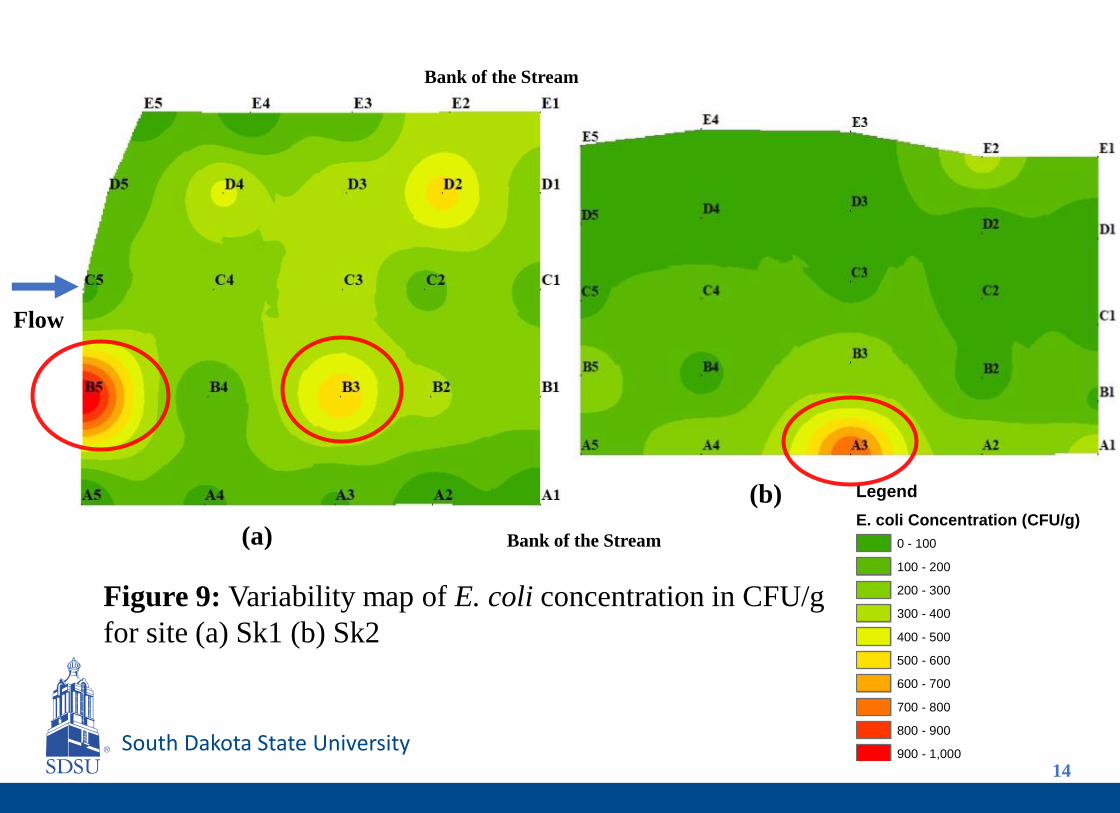
Figure 9: Variability map of E. coli concentration in CFU/g
for site (a) Sk1 (b) Sk2
14
Legend
E. coli Concentration (CFU/g)
0 - 100
100 - 200
200 - 300
300 - 400
400 - 500
500 - 600
600 - 700
700 - 800
800 - 900
900 - 1,000
(a)
(b)
South Dakota State University
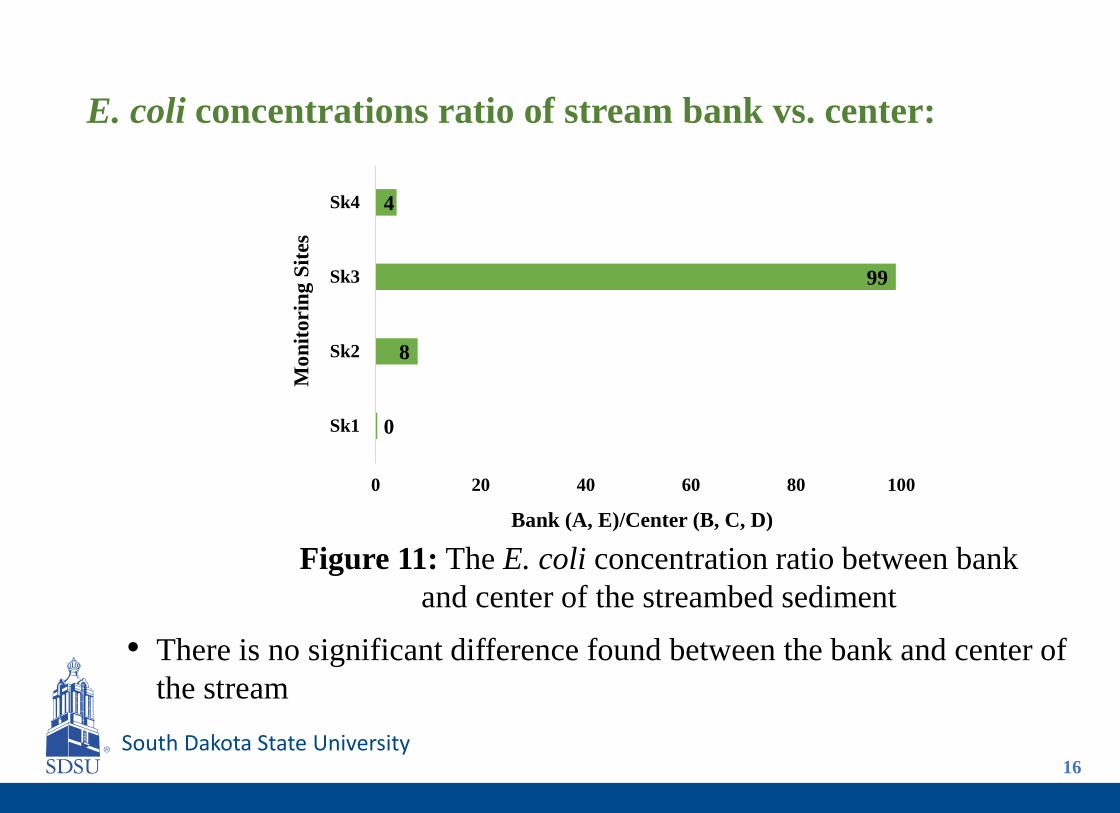
E. coli concentrations ratio of stream bank vs. center:
0
8
99
4
0 20 40 60 80 100
Sk1
Sk2
Sk3
Sk4
Bank (A, E)/Center (B, C, D)
Mo
nit
ori
ng
Sit
es
Figure 11: The E. coli concentration ratio between bank
and center of the streambed sediment
• There is no significant difference found between the bank and center of
the stream
16
South Dakota State University
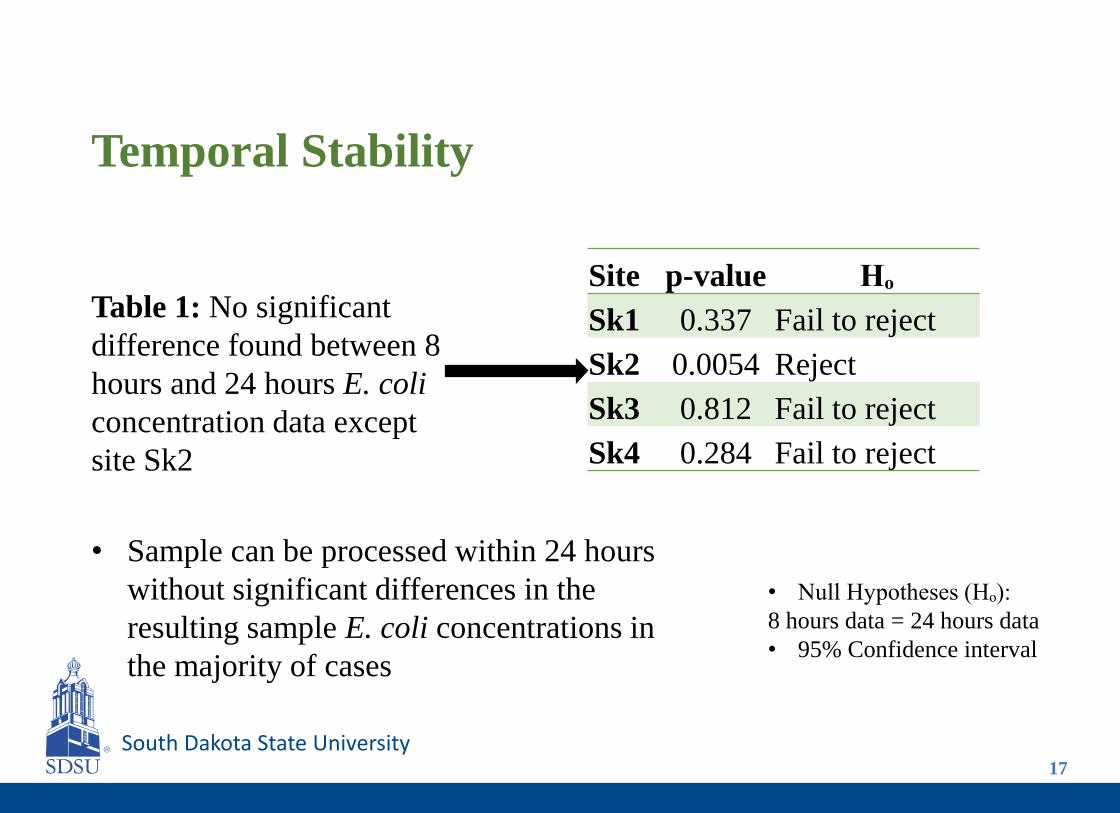
Temporal Stability
Site p-value Hₒ
Sk1 0.337 Fail to reject
Sk2 0.0054 Reject
Sk3 0.812 Fail to reject
Sk4 0.284 Fail to reject
Table 1: No significant
difference found between 8
hours and 24 hours E. coli
concentration data except
site Sk2
• Null Hypotheses (Hₒ):
8 hours data = 24 hours data
• 95% Confidence interval
17
• Sample can be processed within 24 hours
without significant differences in the
resulting sample E. coli concentrations in
the majority of cases
South Dakota State University
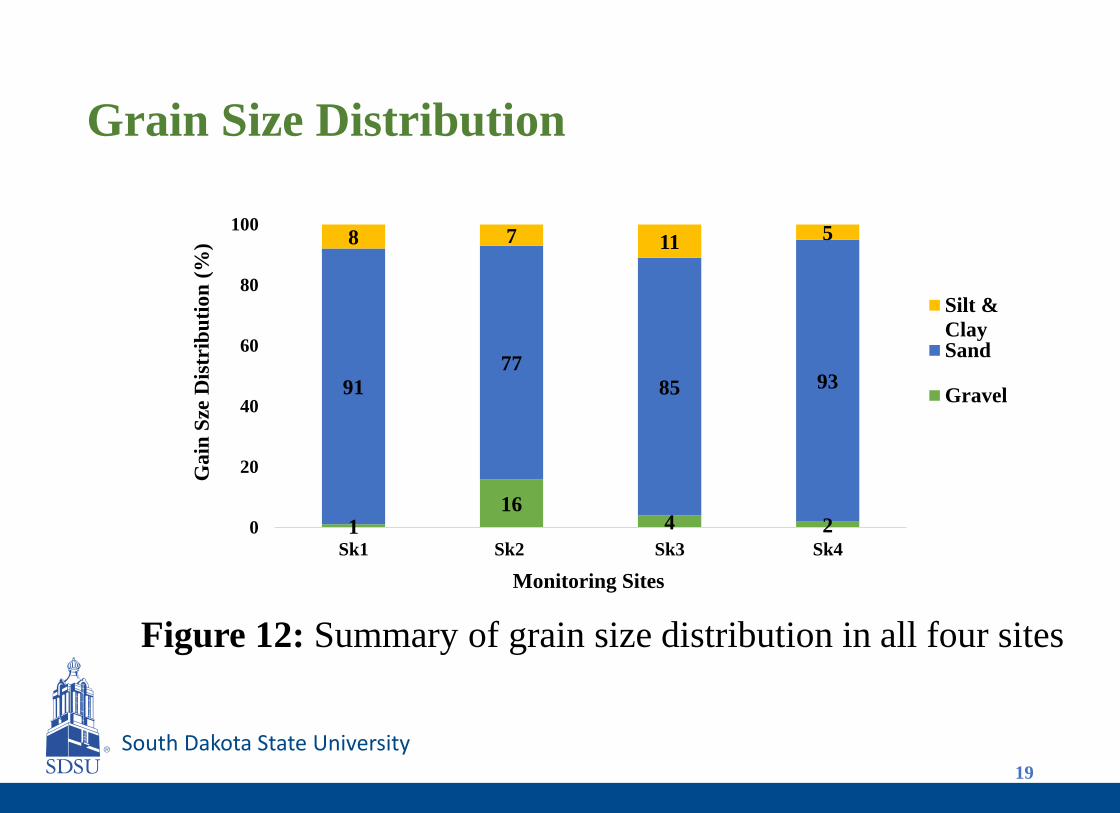
Grain Size Distribution
Figure 12: Summary of grain size distribution in all four sites
19
116
4 2
91
77
85 93
8 7 11 5
0
20
40
60
80
100
Sk1 Sk2 Sk3 Sk4
Ga
in S
ze D
istr
ibu
tio
n (
%)
Monitoring Sites
Silt &
ClaySand
Gravel
South Dakota State University
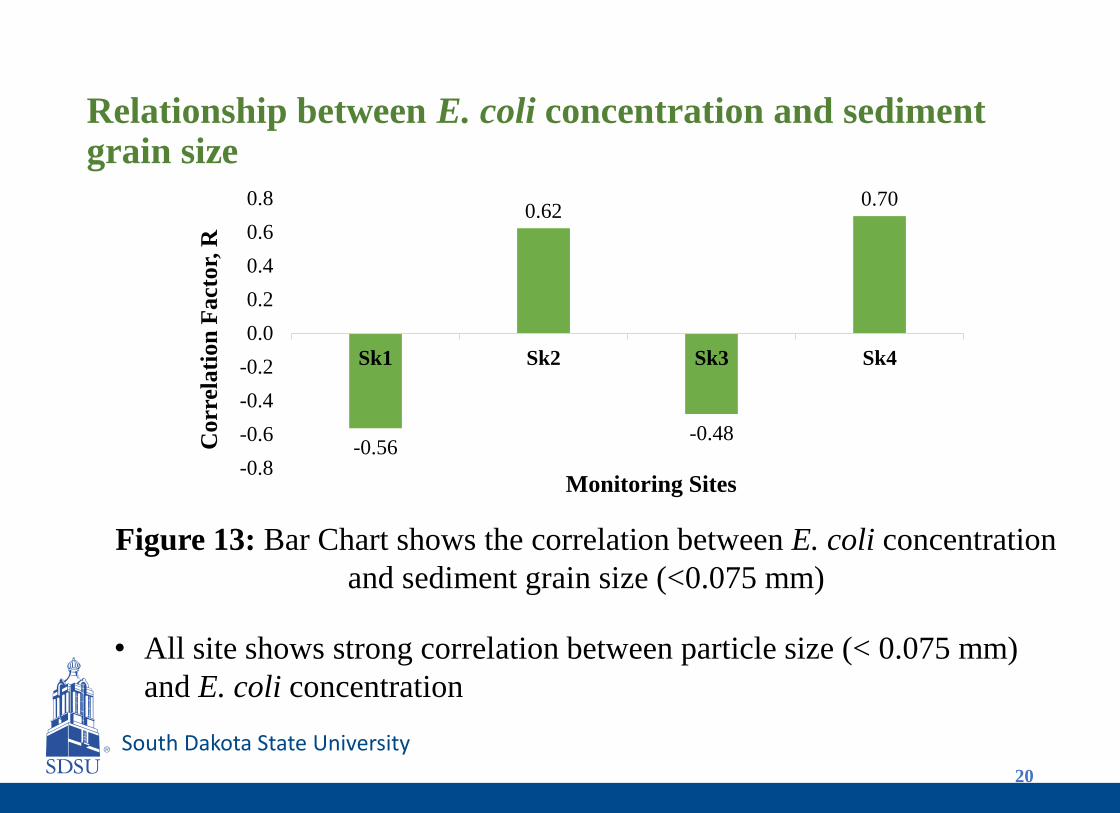
Relationship between E. coli concentration and sediment grain size
20
-0.56
0.62
-0.48
0.70
-0.8
-0.6
-0.4
-0.2
0.0
0.2
0.4
0.6
0.8
Sk1 Sk2 Sk3 Sk4
Corr
elati
on
Facto
r, R
Monitoring Sites
Figure 13: Bar Chart shows the correlation between E. coli concentration
and sediment grain size (<0.075 mm)
• All site shows strong correlation between particle size (< 0.075 mm)
and E. coli concentration
South Dakota State University
Sample Size Analysis
21
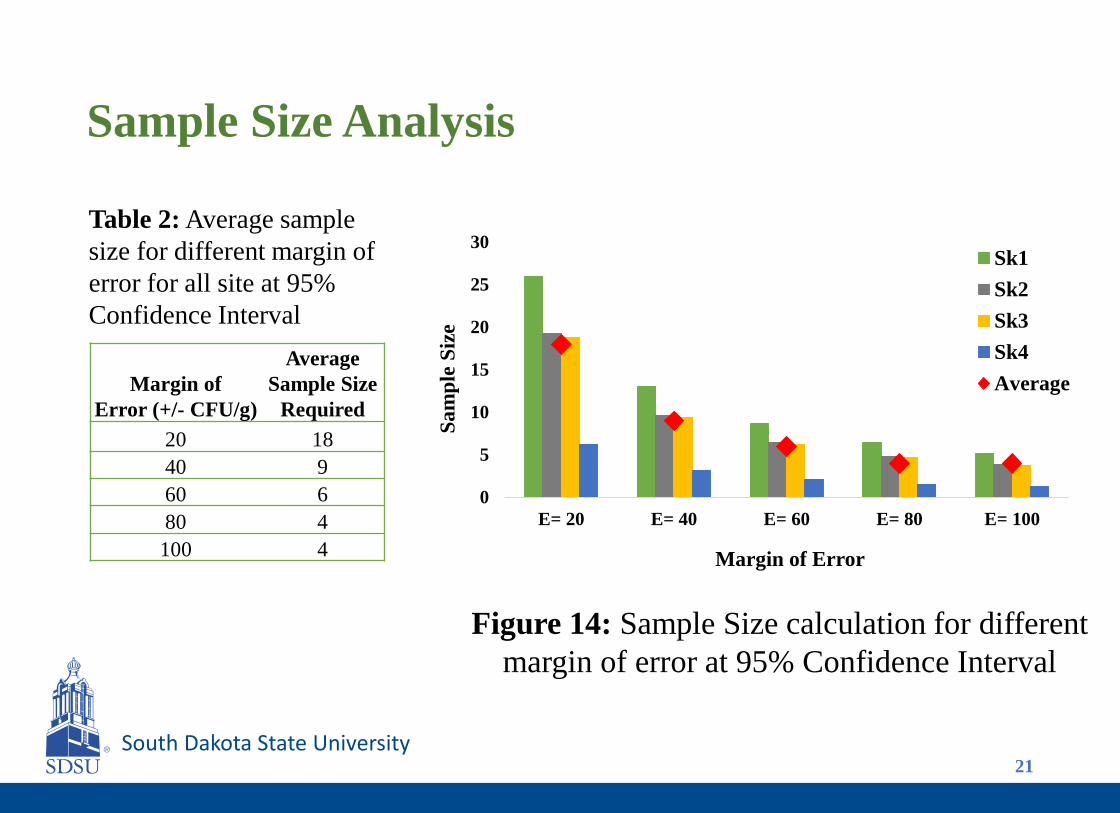
Figure 14: Sample Size calculation for different
margin of error at 95% Confidence Interval
Margin of
Error (+/- CFU/g)
Average
Sample Size
Required
20 18
40 9
60 6
80 4
100 4
Table 2: Average sample
size for different margin of
error for all site at 95%
Confidence Interval
0
5
10
15
20
25
30
E= 20 E= 40 E= 60 E= 80 E= 100
Sa
mp
le S
ize
Margin of Error
Sk1
Sk2
Sk3
Sk4
Average
South Dakota State University22
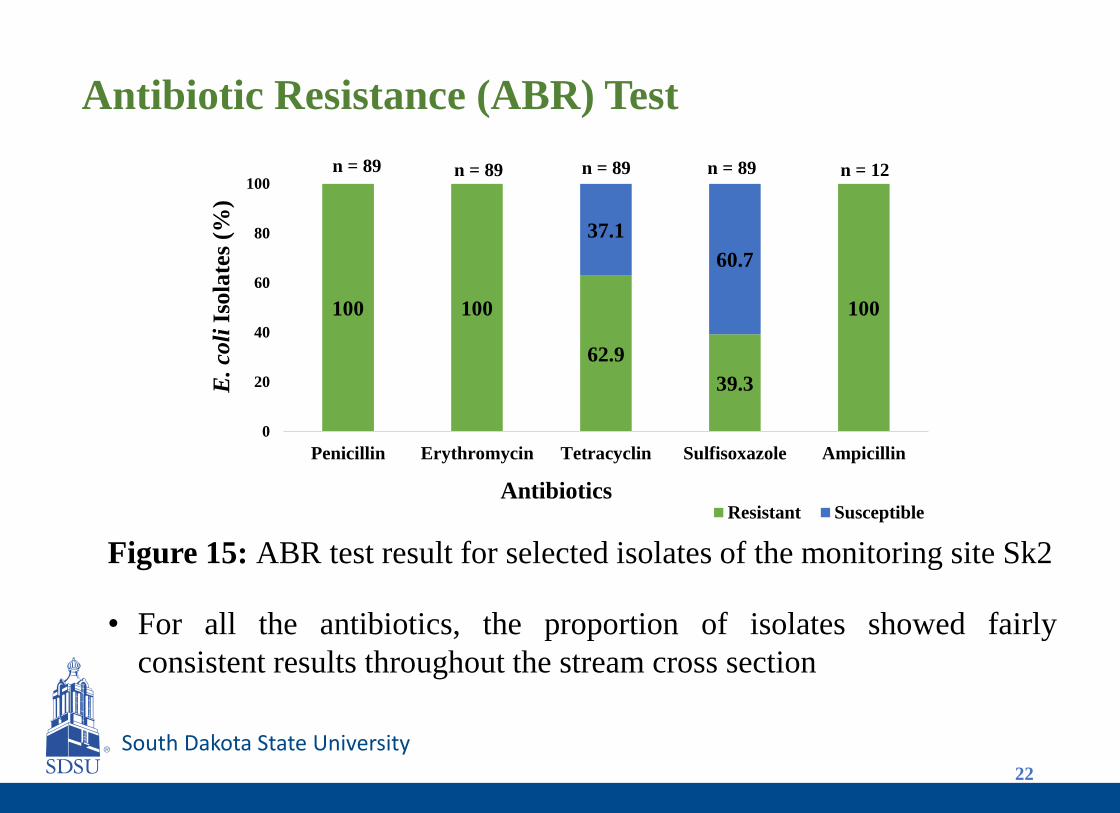
Figure 15: ABR test result for selected isolates of the monitoring site Sk2
Antibiotic Resistance (ABR) Test
100 100
62.9
39.3
100
37.1
60.7
0
20
40
60
80
100
Penicillin Erythromycin Tetracyclin Sulfisoxazole Ampicillin
E.
coli
Isola
tes
(%)
AntibioticsResistant Susceptible
• For all the antibiotics, the proportion of isolates showed fairly
consistent results throughout the stream cross section
n = 89 n = 89 n = 89 n = 12n = 89
South Dakota State University
• E. coli variability was highest in the upstream (cattlecrossing) site and lowest in the most downstream site
• There is no significant difference in E. coli concentrationsbetween the edge and middle of the stream
• Samples can be processed within 24 hours in the majority ofcases
• The streambed sediment of all the sites are dominated bysand particles
23
Conclusions
South Dakota State University
• All site shows strong correlation between particle size
(< 0.075 mm) and E. coli concentration
• Sample size analysis showed, on average, a minimum of 6 sediment samples are required to adequately represent the average E. coli concentration in the sediment for a moderate margin of error. This sample size is more than many previous studies (Garzio-Hadzick et al., 2010; Pandey et al., 2014 and Abia et al., 2015; )
• The proportion of isolates from site Sk2 showed consistentresult in ABR test throughout the stream cross section
24
South Dakota State University
Future Work
• Assess the seasonal variation of E. coli concentration in the streambed sediment
• Determine the impact of storm event on streambed sediment containing E. coli
• Assess the attachment rates of E. coli to sediment particles
• ABR testing for site Sk1 to compare cattle crossing site to downstream site
25
South Dakota State University
Reference• Abia, L. K. A., E. Ubomba-Jaswa, C. C. Ssemakalu, and M. N. B. Momba. 2015.
Development of a rapid approach for the enumeration of Escherichia coli in riverbedsediment: case study, the Apies River, South Africa. Journal of Soils and Sediments15(12):2425-2432
• Garzio-Hadzick, A., D. R. Shelton, R. L. Hill, Y. A. Pachepsky, A. K. Guber, and R.Rowland. 2010. Survival of manure-borne E. coli in streambed sediment: effects oftemperature and sediment properties. Water Res 44(9):2753-2762
• Pandey, P. K., and a. S. M. L. 2014. Assessing Linkages between E. coli Levels inStreambed Sediment and Overlying Water in an Agricultural Watershed in Iowaduring the First Heavy Rain Event of the Season. Transactions of the ASABE:1571-1581
• Rehmann, C. R., and M. L. Soupir. 2009. Importance of interactions between thewater column and the sediment for microbial concentrations in streams. Water Res43(18):4579-4589
• EPA. (2015). South Dakota Water Quality Assessment Report. Accessed Sept. 2015 at <http://ofmpub.epa.gov/waters10/attains_state.control?p_state=SD>
26

South Dakota State University
Acknowledgments
• South Dakota Department of Environment and Natural
Resources
• Dr. Rachel McDaniel and Dr. Bruce Bleakly
• Our Research Group (Miranda Lebrun, Louis Amegbletor
and Sara Mardaninejadjouneghani)
27

South Dakota State University28

South Dakota State University29