Embed Size (px)
Citation preview

Agricultural Production Systems Research Unit
Variability and Trends in Australian Wheat Yield
Graeme HammerAndries Potgieter

Overview
I. Predicting wheat yield at shire scale throughout Australia
II. Annual wheat yield variation and its association with ENSO
III. Residual trends in wheat yield after removing effects of variation in annual rainfall
IV. Association of residual trends with climate trends

(Source: ABARE)

I. Predicting Shire Wheat Yield
Study to compare modelling approaches to predicting Australian wheat yield at shire scale
Model types Empirical – regression on rainfallAgro-climatic – simple crop water balance and stress indexDynamic – crop growth and development simulation
Climate (BoM) and shire wheat production (ABS) data for 18-year period 1975-1992 for 285 shires
Source – Hammer GL, Stephens D and Butler D (1996) Development of a national drought alert strategic information system. Vol 6a. Report to the Land and Water Resources R&D Corporation.
Stephens DJ (1995) Crop yield forecasting over large areas in Australia. Ph.D Thesis, Murdoch University, Western Australia.
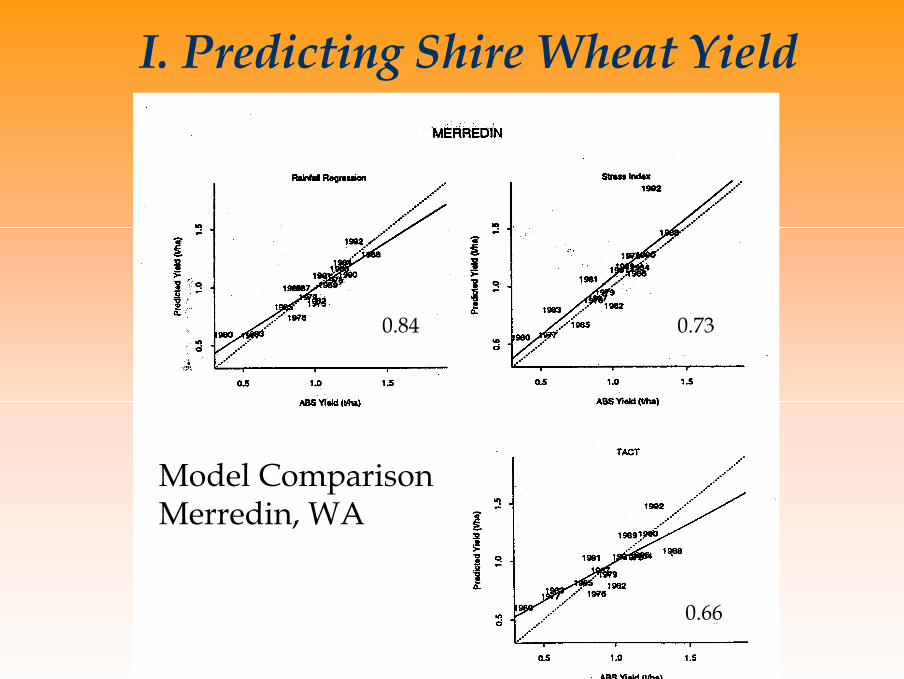
0.84
0.66
0.73
Model Comparison Merredin, WA
I. Predicting Shire Wheat Yield
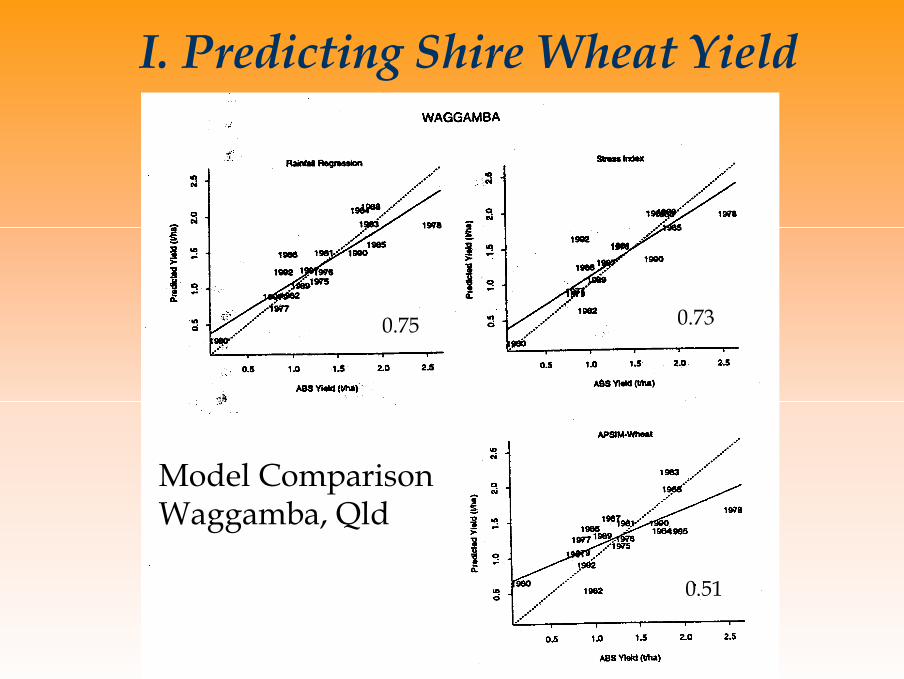
0.75
0.51
0.73
Model Comparison Waggamba, Qld
I. Predicting Shire Wheat Yield

R2 and MAE (t/ha) values from a fit of observed weighted yield (ABS) vs predicted weighted yield for
each method for each state and nationally.
Region Regression SI APSIM Wheat
R2 MAE R2 MAE R2 MAE
QLD 0.86 0.15 0.82 0.17 0.73 0.22
NSW 0.89 0.12 0.87 0.12 na na
VIC 0.88 0.13 0.90 0.12 na na
S.A. 0.88 0.11 0.85 0.13 na na
W.A. 0.86 0.07 0.91 0.08 na na
Australia 0.92 0.07 0.90 0.07 na na
Model Comparison – State and National Scales
I. Predicting Shire Wheat Yield

0.0 0.8 1.6 2.4 0.0 0.8 1.6 2.4
0.0 0.8 1.6 2.4
ABS
1
2
1
2
Pre
dY
Aus NSW QLD
SA VIC WA
SI Wheat Model: Predicted vs Actual Yield (1975-93)
Actual Yield (t/ha)
Pred
icted
Yiel
d (t/
ha)

II. Wheat Yield Variation
Shire scale yield simulation using long-term rainfall data for 20th century with average temperature, radiation and vpd
Assume current production technology
Simulate spatial and temporal variability in wheat yield associated with rainfall effects
Examine effects of ENSO phases
Source – Potgieter, A.B., Hammer, G.L. and Butler, D. (2002). Spatial and temporal patterns in Australian wheat yield and their relationship with ENSO. Aust J Agric Res 53:77-89.
Potgieter, A.B., Hammer, G.L., Meinke, H., Stone, R.C., and Goddard, L. (2005). Spatial variability in impact on Australian wheat yield reveals three putative types of El Nino. J Climate, in press.

II. Wheat Yield Variation - Spatial
WA
NT
QLD
SA
NSW
VIC
TAS
Legend0.5 - 1.0 1.0 - 1.5 1.5 - 2.0 2.0 - 2.5 2.5 - 3.0 3.0 - 3.5 3.5 - 4.0 No Data
Simulated median 20th century shire wheat yield (t/ha)

II. Wheat Yield Variation - Spatial
2004 – Shire wheat yield decile map
WA
NT
QLD
SANSW
VIC
Legend:0-10%
10-20%
20-30%
30-40%
40-50%
50-60%
60-70%
70-80%
80-90%
90-100%
±0 260 520 780 1,040130
Kilometers

II. Wheat Yield Variation - Spatial
2002 – Shire wheat yield decile map
WA
NT
SA
NSW
VIC
TAS
Legend:0-10%10-20%20-30%30-40%40-50%50-60%60-70%70-80%80-90%90-100%No data
QLD
N
0 200 400 Kilometers

II. Wheat Yield Variation - Temporal
Year
Pro
duct
ion
(Mt)
1901
1906
1911
1916
1921
1926
1931
1936
1941
1946
1951
1956
1961
1966
1971
1976
1981
1986
1991
1996
2001
10.0
12.5
15.0
17.5
20.0
22.5
Simulated Australian Wheat Production – 1996 planted area

II. Wheat Yield Variation – ENSO Effect
Wheat Yield Relative to All Years – shift in mean (no of sd)
QLD
N
WA
NT
SA
NSW
VIC
TAS35°
35°
25°25°
15°15°
105° 115°
115°
125°
125°
135°
135°
145°
145°
155°
155°
165°
165°
0 200 400 600 Kilometers
Legend:< -2-2 - -1-1 - -0.5-0.5 - -0.25-0.25 - 00 - 0.250.25 - 0.50.5 - 11 - 2> 2No data
La Nina
#
#
#
#WA
NT
SA
NSW
VIC
TAS
Roma
Dalby
Emerald
Goondiwindi
Legend :< -2-2 - -1-1 - -0.5-0.5 - -0.25-0.25 - 00 - 0.250.25 - 0.50.5 - 11 - 2> 2No data
QLD
190519111951195319691987199119921993
El Nino - The Qld footprint
#
#
#
#WA
NT
SA
NSW
VIC
TAS
Roma
Dalby
Emerald
Goondiwindi
Legend :< -2-2 - -1-1 - -0.5-0.5 - -0.25-0.25 - 00 - 0.250.25 - 0.50.5 - 11 - 2> 2No data
QLD
192519411946197219771997
El Nino - The Eastern footprint
#
#
#
#WA
NT
SA
NSW
VIC
TAS
Roma
Dalby
Emerald
Goondiwindi
Legend :< -2-2 - -1-1 - -0.5-0.5 - -0.25-0.25 - 00 - 0.250.25 - 0.50.5 - 11 - 2> 2No data
QLD
190219141919194019571965198219942002
El Nino - The Everywhere footprint

III. Wheat Yield Trends
Use simulated and actual shire wheat production (ABS) data for 18-year period 1975-1992 for 285 shires
Examine association between residual (i.e. after accounting for rainfall effect) and year
Linear regression to derive yield trend for each shire

III. Wheat Yield Trends

III. Wheat Yield Trends - % per annum
IV. Associations with Wheat Yield Trends
Wheat yield trends can be caused by -Technology change – varieties, agronomyClimate change – rainfall, temperature, CO2
Explore associations of yield trends with climate trends
Use shire scale data for yield and climate trends to avoid spatial averaging effects

IV. Associations with Rainfall Trends
Rain
Yiel
d%
-5 0 5 10
-20
24
6
Shire wheat yield trend (%) vs in-crop rainfall trend (mm/year)Data for 285 shires for period 1975-1992
Y = 1.10 + 0.12X ***
R2 = 4.7%

MinT
Yiel
d%
-0.10 -0.05 0.0 0.05 0.10 0.15
-20
24
6
IV. Associations with Min Temp Trends
Shire wheat yield trend (%) vs in-crop min temp trend (oC/year)Data for 285 shires for period 1975-1992
Y = 1.28 + 2.84X ns
R2 = 1.3%

TRange (%)
Yiel
d (%
)
-0.4 -0.2 0.0 0.2 0.4 0.6 0.8
-20
24
6
IV. Associations with Temp Range TrendsY = 1.45 - 1.35X ***
R2 = 10.0%
Shire wheat yield trend (%) vs trend in temp range (oC/year)Data for 285 shires for period 1975-1992

SummaryWheat yield can be reliably predicted at shire scale throughout Australia using simple models
High spatial and temporal variability in wheat yield generated by rainfall variability
Phases of ENSO leave spatially coherent footprints on annual wheat yield variation
Residual underlying long-term trends in wheat yield are small (0-5% per annum)
Climate trends, other than in temperature range (i.e. atmospheric demand), have minimal effects on yield trends

Agricultural Production Systems Research Unit
Variability and Trends in Australian Wheat Yield
Graeme HammerAndries Potgieter