Embed Size (px)
Citation preview
Abstract—Physiological monitoring is prone to artifacts
originating from various sources such as motion, device malfunction, and interference. The artifact occurrence not only elevates false alarm rates in clinics but also complicates data analysis in research. When techniques to characterize signal dynamics and the underlying physiology are applied (e.g., heart rate variability), noise and artifacts can produce misleading results that describe the signal artifacts more than the physiology. Signal quality metrics can be applied to identify signal segments with noise and artifacts that would otherwise lead analyses to produce non-physiologic or misleading results. In this study we utilized simulated electrocardiogram signals and artifacts to demonstrate effects of noise on heart rate variability frequency domain methods. We then used these simulations to assess an automated artifact correction algorithm that included a signal quality index comparing electrocardiogram beats to a beat template. Simulation results show that the proposed algorithm can significantly improve estimation of signal spectra in presence of various artifacts. This algorithm can be applied to automatically clean real world physiological time series before conducting variability analysis.
I. INTRODUCTION
Continuous recording of physiological waveforms such as arterial blood pressure (ABP) and electrocardiogram (ECG) are affected by noise and motion artifacts (e.g., Fig. 1 shows real-world examples of signal artifacts from experimental studies with conscious animals). Physiological signals are desired to be clean and free from artifacts in clinical monitoring as well as computerized data analysis. Measurements spoiled by artifacts can lead to false alarms during recording, misinterpretation in diagnosis and therapy, and misleading results during offline analyses. Frequency analysis of physiological time series (e.g., ECG or ABP) is a widely used technique for identifying biomarkers or investigating responses to interventions in a physiological system. For example, autonomic neuropathy due to complications of diabetes mellitus has been shown to reduce power in all spectral bands with unchanged low to high frequency power ratio on RR tachogram power spectrum [1]. However, precise estimation of power spectra entails a
F. Yaghouby, C. Daluwatte and C.G. Scully are with the Center for
Devices and Radiological Health, U.S. Food and Drug Administration, Silver Spring, MD 20993 USA (corresponding author phone: 240-402-2520; fax: 301-796-9927; e-mail: [email protected]).
continuous and clean signal as an input. Generally, artifacts are prevalent in clinical and experimental recordings (see Fig. 1) and techniques to automatically identify and mitigate effects of them from the analysis are being developed. Even short artifact incidences impose significant edge effects on power spectrum estimation, particularly in lower frequency bands (low: 0.04 – 0.15 Hz and very low: 0.003 – 0.04 Hz frequency bands on RR tachogram power spectrum). Signal quality metrics can be applied to identify segments affected by noise and artifacts and then excluding, or adjusting the analysis appropriately. In beat-to-beat signal quality assessment, where individual beats with poor quality are excluded based on waveform detection features, variability analysis may still benefit from techniques such as interpolation. However, a continuous index of signal quality is required to identify prolonged or repeated artifacts. In this case, excluding affected data points from the original signal will leave large gaps on time series which can challenge the interpretation of relatively slow rhythms in variability analysis. Simulating physiological signals using credible models is an effective approach to evaluate signal processing techniques [2]. In the context of signal quality assessment simulations become even more beneficial becuase signals can be synthesized with specified characteristics to provide a
Variability Analysis for Noisy Physiological Signals: A Simulation Study
Farid Yaghouby*, Member, IEEE-EMBS, Chathuri Daluwatte and Christopher G. Scully, Member, IEEE-EMBS
Figure 1. Examples of electrocardiogram (in black on left column) and arterial blood pressure (in blue on right column) signals recorded from adult sheep in presence of artifacts. Artifacts have various morphologies and occur at random time incidences.
known ground truth for better assessment of noise cancellation algorithms. In addition, artifacts can be modeled and injected to the signal in a controlled and quantifiable way to simulate a variety of desired noise insidences.
Here, we propose to assess physiological variability analysis algorithms that incorporate automated detection and correction of signal noise artifacts using simulated physiological waveforms corrupted with simulated artifacts. The set of simulated signals enables us to have a ground truth with known variability parameters and locations of artifacts. We then demonstrate the use of the simulated signals by applying a signal quality index (SQI) that compares ECG beats to a beat template as an automated artifact detection method. Heart rate variability results from the set of simulated signals are presented with and without use of the SQI.
II. FRAMEWORK
A. Signal and artifact models
A nonlinear dynamical model based on differential equations was used to generate realistic ECG signals [2]. A three dimensional state-space is constructed using three coupled ordinary differential equations and ECG dynamics are modeled as a trajectory in the 3D space. This model replicates important characteristics of a clinical ECG by specifying parameters including mean and standard deviation of heart rate, noise level, morphology of PQRST cycle and power spectrum of RR tachogram. Hence, it provides a completely known ECG signal for assessment of different biomedical signal processing algorithms [3]. Although this model is capable of producing other waveforms such as blood pressure and respiration signals, we focused on ECG simulations.
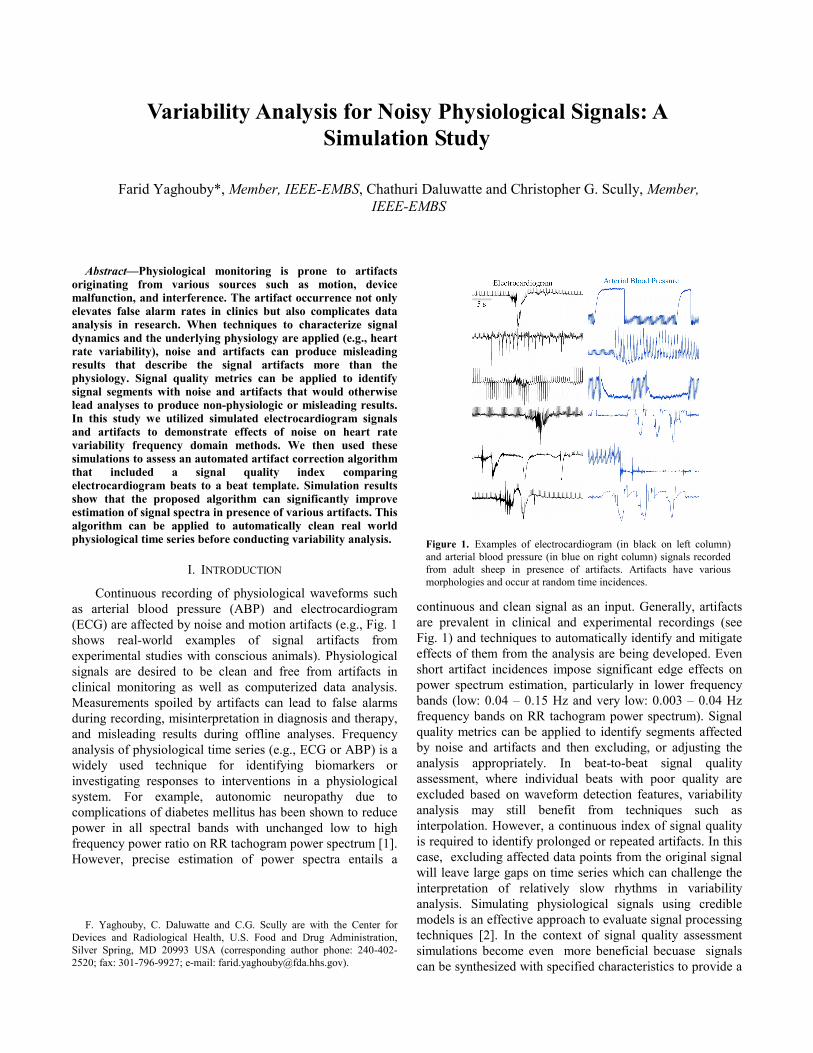
Once an artificial ECG with indicated clinical relevance is produced, artifacts can be added in a quantifiable and customized way to imitate realistic scenarios. Fig. 1 shows example artifacts from experimental recordings in sheep. As shown, artifacts are random and nonstationary and can significantly affect the estimation of features from the underlying signal. In this paper, standard models of ABP artifacts proposed and implemented elsewhere [3] were used with slight modifications to create generic types of artifacts for ECGs. These artifacts were first identified after extensive investigation through a multi-parameter physiological signal database and then modeled mathematically so that the physiological relevance and similarity are preserved [3]. Although these models were developed for ABP, most were also applicable to ECG with minimal modification on mathematical parameters. For example, high-frequency and transient low-frequency ECG noises (Fig. 2 d and f) could be due to motion artifacts and are simulated and added to the original signal using altered (gain adjusted for ECG physiologic range) brown noise and sinc functions, respectively. The artifact models can also be merged with each other to generate new artifacts. These artifacts were
injected into the simulated ECG signal at random time instances with variable durations (5% to 70%). Fig. 2
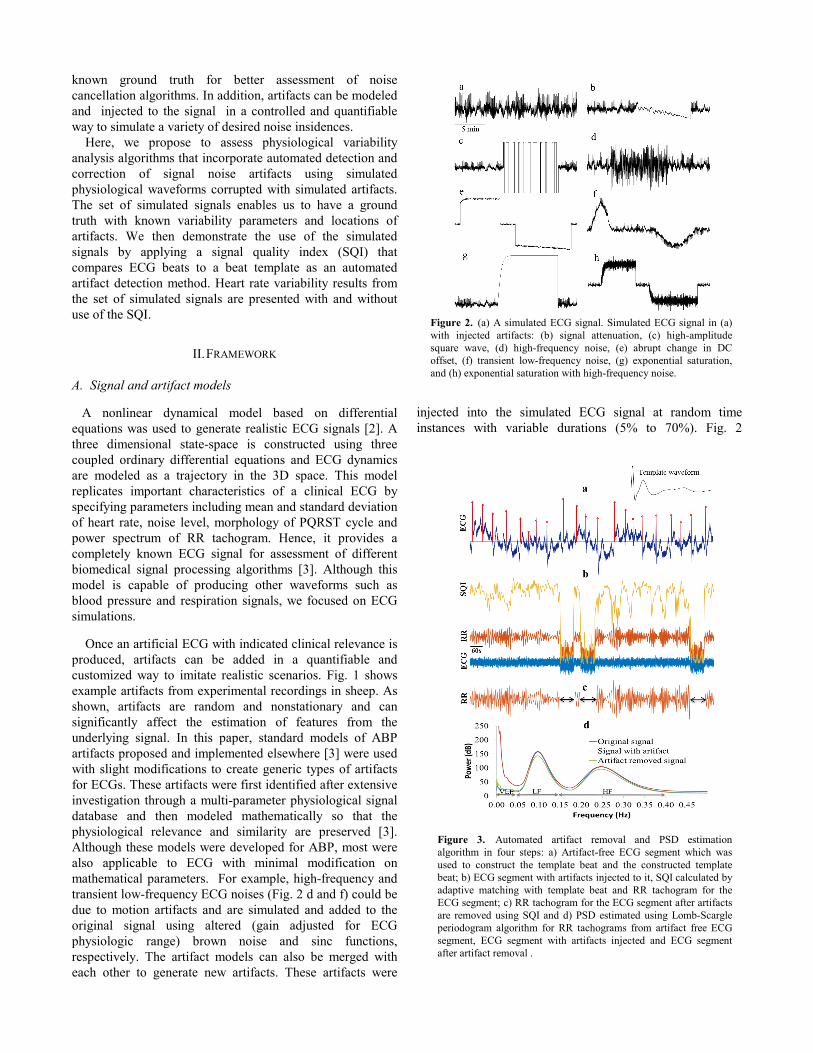
Figure 3. Automated artifact removal and PSD estimation algorithm in four steps: a) Artifact-free ECG segment which was used to construct the template beat and the constructed template beat; b) ECG segment with artifacts injected to it, SQI calculated by adaptive matching with template beat and RR tachogram for the ECG segment; c) RR tachogram for the ECG segment after artifacts are removed using SQI and d) PSD estimated using Lomb-Scargle periodogram algorithm for RR tachograms from artifact free ECG segment, ECG segment with artifacts injected and ECG segment after artifact removal .
Figure 2. (a) A simulated ECG signal. Simulated ECG signal in (a) with injected artifacts: (b) signal attenuation, (c) high-amplitude square wave, (d) high-frequency noise, (e) abrupt change in DC offset, (f) transient low-frequency noise, (g) exponential saturation, and (h) exponential saturation with high-frequency noise.
illustrates a simulated ECG signal along with seven types of artificial noise mathematically modeled and added to the original signal. Simulated artifacts include signal attenuation, high-amplitude square wave, high frequency noise, abrupt change in DC offset, transient low frequency noise, exponential saturation and exponential saturation with high frequency noise (Fig. 2 b-h). B. Artifact correction and spectral estimation algorithm
Direct estimation of heart rate (HR) from corrupted ECGs will result in unwanted noise in HRV, particularly for spectral features. Hence, it deems necessary to automatically remove such artifacts and estimate spectra from the corrected signal. We propose a stepwise framework for artifact correction and PSD estimation of RR tachograms. As the first step, a relatively short segment of artifact free ECG signal is chosen by visual inspection. R wave locations are then identified in the selected segment using an automated QRS detection algorithm [4]. A template beat is constructed by taking the median of all the beats in the segment (Fig. 3a). Next, we apply the same QRS detection algorithm to a simulated ECG signal with injected artifacts to generate the RR tachogram. With the help of the template waveform generated in the previous step, a signal quality assessment based on a matched filter strategy is applied. The correlation coefficient between each detected beat on ECG with artifacts and the template beat is calculated and used as a signal quality index (SQI) [5]. The computed SQI is passed through a signal conditioning step including a sequence of median and moving average filters to remove abrupt changes and provide a smooth indicator of signal quality. As can be seen from Fig. 3b, SQI has a bimodal distribution and falls sharply when artifacts are present in the ECG waveform. As the third step, we have empirically set a threshold on SQI by qualitative review of waveforms. The threshold was chosen conservatively low (here 0.4) to identify and remove majority (if not all) of corrupted data points from RR tachogram (Fig. 3c). Applying the artifact removal algorithm produces discontinuities in the signal. Estimation of PSD based on Fourier analysis techniques suffers from periodic noise in gapped signals. However, a modified version of periodogram named Lomb-Scargle alleviates such limitations. Lomb-Scargle algorithm estimates sine and cosine functions from unevenly sampled time series in each desired frequency and makes them orthogonal by time shifting before computing power [6]. As the last step of our algorithm, we compute PSD from artifact removed RR tachogram using this technique (Fig. 3d) and compute the area under the power spectrum to estimate power in different frequency bands: very low frequency (VLF, <0.04 Hz), low frequency (LF, 0.04 – 0.15 Hz), and high frequency (HF, 0.15 to 0.4 Hz).
III. SIMULATION
Three simulation trials were performed to generate ECG signals with predefined constant (duration = 60 mins, HR =
70±10 beats per minute [bpm]) and variable (LF/HF power ratio = 0.5,1 and 2) parameters from the dynamical model [2]. Different types of artifacts shown in Fig. 2 were then simulated with random durations (to occupy 5-70% of the ECG signal) and added to each original ECG at random locations. Produced signals were passed through different stages of the artifact correction algorithm and normalized power in each frequency band was estimated from original, with artifacts and artifact removed ECG signals (Fig. 4).
IV. RESULTS
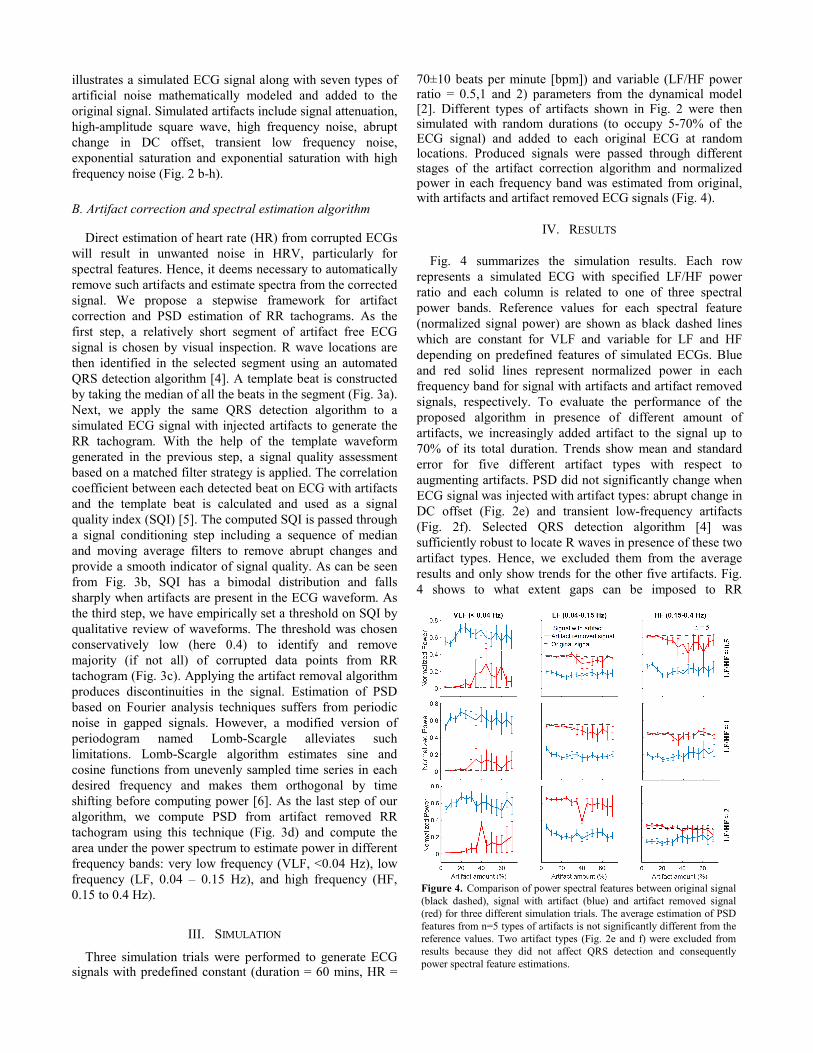
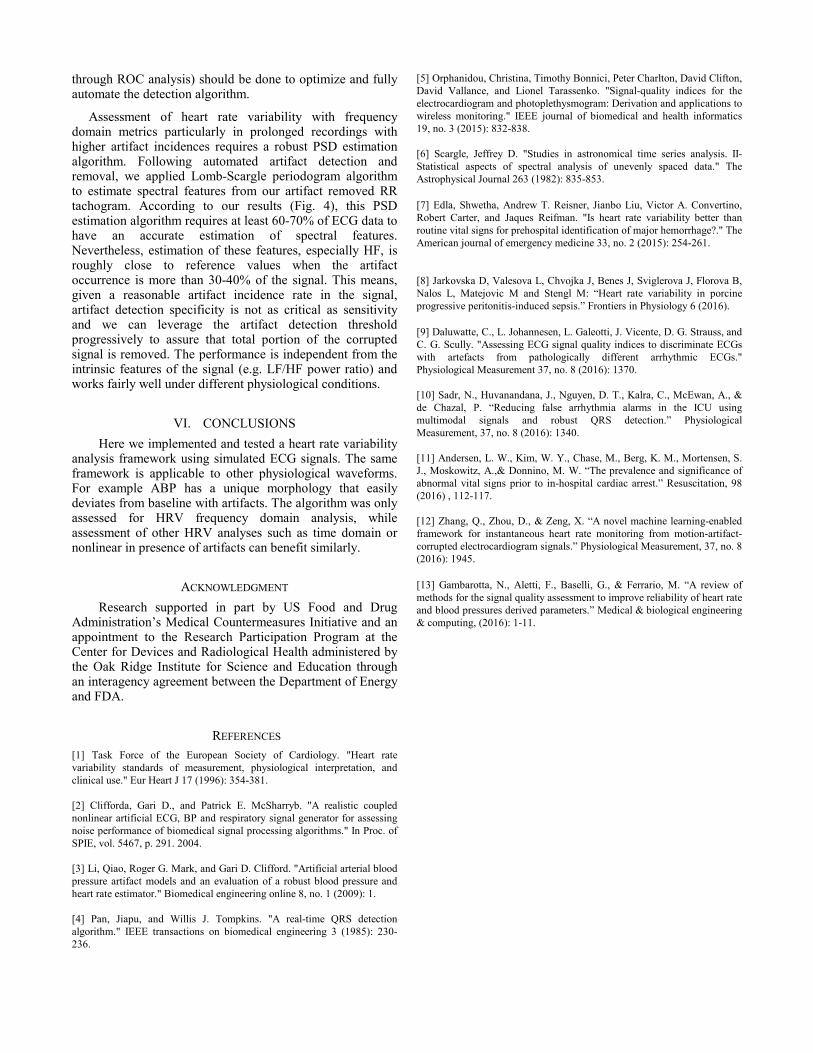
Fig. 4 summarizes the simulation results. Each row represents a simulated ECG with specified LF/HF power ratio and each column is related to one of three spectral power bands. Reference values for each spectral feature (normalized signal power) are shown as black dashed lines which are constant for VLF and variable for LF and HF depending on predefined features of simulated ECGs. Blue and red solid lines represent normalized power in each frequency band for signal with artifacts and artifact removed signals, respectively. To evaluate the performance of the proposed algorithm in presence of different amount of artifacts, we increasingly added artifact to the signal up to 70% of its total duration. Trends show mean and standard error for five different artifact types with respect to augmenting artifacts. PSD did not significantly change when ECG signal was injected with artifact types: abrupt change in DC offset (Fig. 2e) and transient low-frequency artifacts (Fig. 2f). Selected QRS detection algorithm [4] was sufficiently robust to locate R waves in presence of these two artifact types. Hence, we excluded them from the average results and only show trends for the other five artifacts. Fig. 4 shows to what extent gaps can be imposed to RR
Figure 4. Comparison of power spectral features between original signal (black dashed), signal with artifact (blue) and artifact removed signal (red) for three different simulation trials. The average estimation of PSD features from n=5 types of artifacts is not significantly different from the reference values. Two artifact types (Fig. 2e and f) were excluded from results because they did not affect QRS detection and consequently power spectral feature estimations.
tachogram and still obtain reasonably accurate estimation of PSD. Average trends are similar for three simulation trials (LF/HF power ratio = 0.5, 1 and 2). In general, there is significant overestimation of VLF power in noisy ECG (blue), while we observe an underestimation in LF and HF power. This error is large for all amounts of artifacts in three of the simulated trials. However, the error has been reasonably alleviated after applying the SQI algorithm in most cases. For artifact removed signals, spectral features become similar to the ones from original signal when the artifact duration is less than 30-40% of the total signal duration. Although the performance is not acceptable when the artifact duration is more than 30-40% of total signal duration, we still observe better estimations after applying the SQI algorithm than from the original signal corrupted with artifact.
V. DISCUSSION
Electrocardiogram and arterial blood pressure waveforms are two essential physiological measurements in patient hemodynamic monitoring. Variability analysis (e.g. heart rate variability or pulse pressure variability) can be performed along with vital signs (e.g. heart rate and blood pressure) to assess the physiological status of the patient or response to a given therapy [7]. Heart rate variability is a noninvasive index of autonomic nervous function in cardiovascular system unveiling vagal-sympathetic balance under different physiological and pathophysiological circumstances [1]. For example, it has been shown to be altered during the progression of sepsis in a porcine model [8]. Spectral analysis of RR tachogram to assess heart rate variability requires artifact free ECG signals.
Signal quality assessment becomes more critical in multi-parameter physiological monitoring in which multiple waveforms from different modalities are being combined and analyzed together for identifying better biomarkers of physiological status. In experimental monitoring using large and conscious animal models, the reduced signal quality could affect research findings if not appropriately accounted for. It is not only difficult to restrain animal and suppress activity, but also challenging to simultaneously record from several sensors connected to a freely moving animal. While Fig. 1 demonstrates example artifacts during physiological
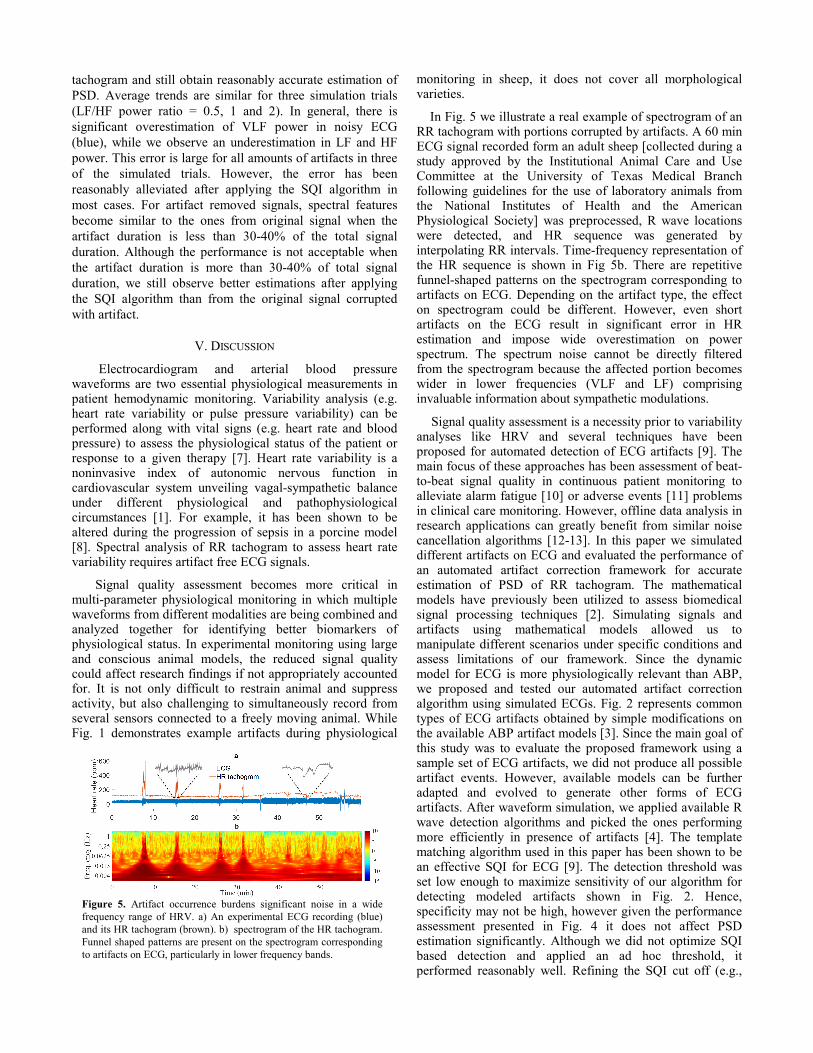
monitoring in sheep, it does not cover all morphological varieties.
In Fig. 5 we illustrate a real example of spectrogram of an RR tachogram with portions corrupted by artifacts. A 60 min ECG signal recorded form an adult sheep [collected during a study approved by the Institutional Animal Care and Use Committee at the University of Texas Medical Branch following guidelines for the use of laboratory animals from the National Institutes of Health and the American Physiological Society] was preprocessed, R wave locations were detected, and HR sequence was generated by interpolating RR intervals. Time-frequency representation of the HR sequence is shown in Fig 5b. There are repetitive funnel-shaped patterns on the spectrogram corresponding to artifacts on ECG. Depending on the artifact type, the effect on spectrogram could be different. However, even short artifacts on the ECG result in significant error in HR estimation and impose wide overestimation on power spectrum. The spectrum noise cannot be directly filtered from the spectrogram because the affected portion becomes wider in lower frequencies (VLF and LF) comprising invaluable information about sympathetic modulations.
Signal quality assessment is a necessity prior to variability analyses like HRV and several techniques have been proposed for automated detection of ECG artifacts [9]. The main focus of these approaches has been assessment of beat-to-beat signal quality in continuous patient monitoring to alleviate alarm fatigue [10] or adverse events [11] problems in clinical care monitoring. However, offline data analysis in research applications can greatly benefit from similar noise cancellation algorithms [12-13]. In this paper we simulated different artifacts on ECG and evaluated the performance of an automated artifact correction framework for accurate estimation of PSD of RR tachogram. The mathematical models have previously been utilized to assess biomedical signal processing techniques [2]. Simulating signals and artifacts using mathematical models allowed us to manipulate different scenarios under specific conditions and assess limitations of our framework. Since the dynamic model for ECG is more physiologically relevant than ABP, we proposed and tested our automated artifact correction algorithm using simulated ECGs. Fig. 2 represents common types of ECG artifacts obtained by simple modifications on the available ABP artifact models [3]. Since the main goal of this study was to evaluate the proposed framework using a sample set of ECG artifacts, we did not produce all possible artifact events. However, available models can be further adapted and evolved to generate other forms of ECG artifacts. After waveform simulation, we applied available R wave detection algorithms and picked the ones performing more efficiently in presence of artifacts [4]. The template matching algorithm used in this paper has been shown to be an effective SQI for ECG [9]. The detection threshold was set low enough to maximize sensitivity of our algorithm for detecting modeled artifacts shown in Fig. 2. Hence, specificity may not be high, however given the performance assessment presented in Fig. 4 it does not affect PSD estimation significantly. Although we did not optimize SQI based detection and applied an ad hoc threshold, it performed reasonably well. Refining the SQI cut off (e.g.,
Figure 5. Artifact occurrence burdens significant noise in a wide frequency range of HRV. a) An experimental ECG recording (blue) and its HR tachogram (brown). b) spectrogram of the HR tachogram. Funnel shaped patterns are present on the spectrogram corresponding to artifacts on ECG, particularly in lower frequency bands.
through ROC analysis) should be done to optimize and fully automate the detection algorithm.
Assessment of heart rate variability with frequency domain metrics particularly in prolonged recordings with higher artifact incidences requires a robust PSD estimation algorithm. Following automated artifact detection and removal, we applied Lomb-Scargle periodogram algorithm to estimate spectral features from our artifact removed RR tachogram. According to our results (Fig. 4), this PSD estimation algorithm requires at least 60-70% of ECG data to have an accurate estimation of spectral features. Nevertheless, estimation of these features, especially HF, is roughly close to reference values when the artifact occurrence is more than 30-40% of the signal. This means, given a reasonable artifact incidence rate in the signal, artifact detection specificity is not as critical as sensitivity and we can leverage the artifact detection threshold progressively to assure that total portion of the corrupted signal is removed. The performance is independent from the intrinsic features of the signal (e.g. LF/HF power ratio) and works fairly well under different physiological conditions.
VI. CONCLUSIONS Here we implemented and tested a heart rate variability analysis framework using simulated ECG signals. The same framework is applicable to other physiological waveforms. For example ABP has a unique morphology that easily deviates from baseline with artifacts. The algorithm was only assessed for HRV frequency domain analysis, while assessment of other HRV analyses such as time domain or nonlinear in presence of artifacts can benefit similarly.
ACKNOWLEDGMENT Research supported in part by US Food and Drug Administration’s Medical Countermeasures Initiative and an appointment to the Research Participation Program at the Center for Devices and Radiological Health administered by the Oak Ridge Institute for Science and Education through an interagency agreement between the Department of Energy and FDA.
REFERENCES [1] Task Force of the European Society of Cardiology. "Heart rate variability standards of measurement, physiological interpretation, and clinical use." Eur Heart J 17 (1996): 354-381. [2] Clifforda, Gari D., and Patrick E. McSharryb. "A realistic coupled nonlinear artificial ECG, BP and respiratory signal generator for assessing noise performance of biomedical signal processing algorithms." In Proc. of SPIE, vol. 5467, p. 291. 2004. [3] Li, Qiao, Roger G. Mark, and Gari D. Clifford. "Artificial arterial blood pressure artifact models and an evaluation of a robust blood pressure and heart rate estimator." Biomedical engineering online 8, no. 1 (2009): 1. [4] Pan, Jiapu, and Willis J. Tompkins. "A real-time QRS detection algorithm." IEEE transactions on biomedical engineering 3 (1985): 230-236.
[5] Orphanidou, Christina, Timothy Bonnici, Peter Charlton, David Clifton, David Vallance, and Lionel Tarassenko. "Signal-quality indices for the electrocardiogram and photoplethysmogram: Derivation and applications to wireless monitoring." IEEE journal of biomedical and health informatics 19, no. 3 (2015): 832-838. [6] Scargle, Jeffrey D. "Studies in astronomical time series analysis. II-Statistical aspects of spectral analysis of unevenly spaced data." The Astrophysical Journal 263 (1982): 835-853. [7] Edla, Shwetha, Andrew T. Reisner, Jianbo Liu, Victor A. Convertino, Robert Carter, and Jaques Reifman. "Is heart rate variability better than routine vital signs for prehospital identification of major hemorrhage?." The American journal of emergency medicine 33, no. 2 (2015): 254-261. [8] Jarkovska D, Valesova L, Chvojka J, Benes J, Sviglerova J, Florova B, Nalos L, Matejovic M and Stengl M: “Heart rate variability in porcine progressive peritonitis-induced sepsis.” Frontiers in Physiology 6 (2016). [9] Daluwatte, C., L. Johannesen, L. Galeotti, J. Vicente, D. G. Strauss, and C. G. Scully. "Assessing ECG signal quality indices to discriminate ECGs with artefacts from pathologically different arrhythmic ECGs." Physiological Measurement 37, no. 8 (2016): 1370. [10] Sadr, N., Huvanandana, J., Nguyen, D. T., Kalra, C., McEwan, A., & de Chazal, P. “Reducing false arrhythmia alarms in the ICU using multimodal signals and robust QRS detection.” Physiological Measurement, 37, no. 8 (2016): 1340. [11] Andersen, L. W., Kim, W. Y., Chase, M., Berg, K. M., Mortensen, S. J., Moskowitz, A.,& Donnino, M. W. “The prevalence and significance of abnormal vital signs prior to in-hospital cardiac arrest.” Resuscitation, 98 (2016) , 112-117. [12] Zhang, Q., Zhou, D., & Zeng, X. “A novel machine learning-enabled framework for instantaneous heart rate monitoring from motion-artifact-corrupted electrocardiogram signals.” Physiological Measurement, 37, no. 8 (2016): 1945. [13] Gambarotta, N., Aletti, F., Baselli, G., & Ferrario, M. “A review of methods for the signal quality assessment to improve reliability of heart rate and blood pressures derived parameters.” Medical & biological engineering & computing, (2016): 1-11.