Embed Size (px)
Citation preview

Vapor Deposition Process for Engineering of Dispersed PEMFC ORR Pt/NbOx/C Catalysts
P.I. – Jim WaldeckerFord Motor Company
June 7, 2017FC162
This presentation does not contain any proprietary, confidential, or otherwise restricted information

OverviewTimeline
• Project Start Date: 1/1/2017• Project End Date: 3/31/2020• Percent complete: 0%
Budget• Total project budget: $2,594,412
– Total recipient share: $518,883– Total federal share: $2,075,529– Total DOE funds spent*: $18,489
* As of 3/31/2017
BarriersA. DurabilityB. CostC. Performance
Partners• Oak Ridge National Laboratory
– Small batch catalyst production
• Exothermics, Inc.– Large batch catalyst production
• University of Michigan– TEM, XPS, other characterization
• Northeastern University– X-ray absorption spectroscopy
• EWII Fuel Cells LLC– CCM fabrication, fuel cell testing
2

Relevance
• Develop a New Cathode Catalyst Powder– Pt/NbOx/C for high durability, power density, mass activity
• Improve the Catalyst Powder Manufacturing Process– PVD with superior reproducibility over solution based methods
• Demonstrate the PVD Process is Scalable in a Cost Effective Manner– Scale up from small batch (~ 1-2 g) to large batch (20-40 g)
• Show Ease of Integration– Powders amenable to already established CCM/MEA
manufacturing processes (ink processes)
OBJECTIVE: Develop, integrate, and validate a new cathode catalyst material by developing and optimizing a vacuum powder coating physical vapor deposition (PVD) process
This project focuses not just on a higher performing and more durable novel catalyst, but also on making the catalyst with a reproducible, scalable process.
3
Relevant Targets
MYRDD Table 3.4.7 Technical Targets: Electrocatalysts for Transportation Applications
Characteristic Units 2020 Target
PGM content at rated power gPGM/kWgross at 150 kPa (abs) 0.125
PGM loading mgPGM/cm2 total 0.125
Mass activity A/mgPGM at 900 mViR-free 0.44
Electrocatalyst stability (0.6 ↔ 0.95 V) % mass activity loss after 30K cycles <40
Loss at 0.8 A/cm2 (0.6 ↔ 0.95 V) mV loss after 30K cycles <30
Support stability (1.0 ↔ 1.5 V) % mass activity loss after 5K cycles <40
Loss at 1.5 A/cm2 (1.0 ↔ 1.5 V) mV after 5K cycles <30
MYRDD Table 3.4.5 Technical Targets: MEAs for Transportation Applications
Characteristic Units 2020 Target
Performance at rated power mW/cm2 at 150 kPa (abs) 1000
The targets below are specified as part of quarterly milestones or go/no-go decisions:
In addition to activity, this project will also focus on high current density. 4

Approach: Advantages of PVD• Physical vapor deposition (PVD) for the production of
an oxygen reduction catalyst has many advantages:– Elimination of a large number of production variables for
solution prepared materials • Eliminated variables include humidity, mixing time and
speed, and competitive adsorption of solubilized species • Should significantly improve reproducibility and lower costs
– With nearly pure metal targets, reagent costs are lower and there are no impurities from precursors or solvents• Reduced material costs• Better performance
– In principle, no drying or post-synthesis annealing is needed• Reduction of manufacturing steps
– PVD process eliminates the need to treat aqueous or solvent waste (environmental benefit)
• Despite the use of PVD, a powder catalyst is still desired
– Powder catalyst can be directly fabricated into inks and cast using conventional MEA fabrication technology
DC magnetron sputtering chamber at Oak Ridge National Laboratory (small batch)
Sputter system at ExothermicsCan PVD be used to generate a powder catalyst for oxygen reduction?
5

Approach: PVD on Powders• PVD can be done on powders:
– Arc plasma deposition (350°C) downwards into a rotating chamber
– Magnetron sputtering onto powder agitated by tumbling (similar to a front-loaded clothes dryer)
• PVD processing onto powders provides this project a unique position in the DOE catalyst portfolio
• Exothermics can perform magnetron sputtering onto powders at scales equivalent to 100K fuel cell systems per year with existing capacity
• Labor and energy costs do not exceed 1.5% of precious metal costs• Reclaim costs per run need to be minimized
– Target efficiency and utilization can be enhanced with novel geometries
• PVD processing on powders to be pursued with magnetron sputtering• Reclaim costs will be important to quantify and can be reduced with novel targets• Labor and energy costs are small compared to precious metals
Schematic of ORNL system (batch size: 1-2 grams)
6
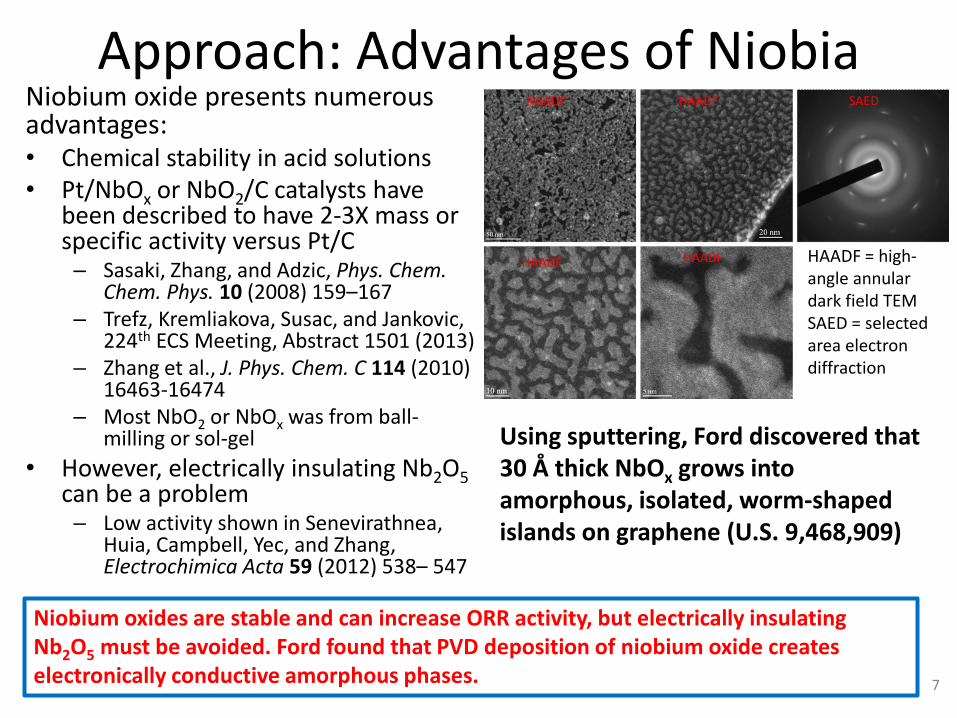
Approach: Advantages of Niobia Niobium oxide presents numerous advantages:• Chemical stability in acid solutions• Pt/NbOx or NbO2/C catalysts have
been described to have 2-3X mass or specific activity versus Pt/C– Sasaki, Zhang, and Adzic, Phys. Chem.
Chem. Phys. 10 (2008) 159–167– Trefz, Kremliakova, Susac, and Jankovic,
224th ECS Meeting, Abstract 1501 (2013)– Zhang et al., J. Phys. Chem. C 114 (2010)
16463-16474– Most NbO2 or NbOx was from ball-
milling or sol-gel• However, electrically insulating Nb2O5
can be a problem– Low activity shown in Senevirathnea,
Huia, Campbell, Yec, and Zhang, Electrochimica Acta 59 (2012) 538– 547
Niobium oxides are stable and can increase ORR activity, but electrically insulating Nb2O5 must be avoided. Ford found that PVD deposition of niobium oxide creates electronically conductive amorphous phases.
Using sputtering, Ford discovered that 30 Å thick NbOx grows into amorphous, isolated, worm-shaped islands on graphene (U.S. 9,468,909)
HAADF = high-angle annular dark field TEMSAED = selected area electron diffraction
7

Approach: Proof of Principle Experiments
Catalyst Pt wt%
Nbwt%
BMA (A/gPGM)
BSA (uA/cm2)
BESCA (m2/g)
RMA (%)
Pt/HSAC (commercial) 52 - 172 276 62 88
Pt/graphene (APD) 10 - 164 762 22 64
Pt/NbOx/graphene (APD) 10 2 309 800 39 85
Pt/NbOx/graphitized carbon (APD) 8 9 400 531 76 100
Pt/NbOx/graphitized carbon (APD) 23 20 224 409 55 72
Pt/NbOx/graphitized carbon (wet chem) 8 4 512 575 89 85
Pt/NbOx/HSAC (wet chem) 12 3 630 528 119 76
Pt/NbOx/HSAC (wet chem) 35 9 321 374 86 85
Cycle used in RDE: square wave, 0.1 ↔ 1.05 V, 25K cycles, O2 bubbled
HSAC = high surface area carbon; BMA= beginning of life mass activity; RMA = retention of mass activity; BSA = beginning of life specific activity; BESCA = beginning of life ECSA; APD = arc plasma deposition
Ford testing on small batch Pt/NbOx/C samples from APD or wet chemistry confirmed that high activity is shown with incorporation of NbOx. NbOx helps to maintain activity during cycling with graphitized supports. Increasing Pt wt% with PVD is a challenge, and often coincides with decreased mass activity.
8

Approach:AddressingMTResistances,Durability Wire-woundbarmethodused
formakingcathode;Fordhassincedevelopedanultrasonicspraymethod
Projectplanstoaddresslowpowerdensityby1)diagnosingmasstransportresistanceswithalimitingcurrentprotocol,2)iteratingwithelectrodefabricationparameterstoeliminateMTresistances
Limitingcurrentprotocolis>80“mini-polarizations”usingvaryingO2 concentration,T,PtorevealP-dependent,andnon-Fickian (Knudsen,ionomerfilm)MTresistances
Evenwithlessadvancedelectrodefabricatingprocessesthatledtopoorperformance,cyclingofthecatalystdidnotsignificantlyreduceperformance
Pt/NbOx/CfromAPDoncathodeFuelCellTechnologies5cm2 cellCathodeloading:0.087mgPt/cm2
Cycle:30Ktrianglewaves,0.1↔1.0V
Despitelowmassactivitymeasuredinthecell(andlowperformance),performancewasretainedaftercycling
9

Approach:TasksandSchedule• Projectwillbeginwithsmall
batch(1g)Pt/NbOx/CproductionatORNL– ControlfactorsinTasks1.1-
1.2includecarbons, chamberdosing,P,T
– Characterization(UM,NEU-Tasks1.3,1.6)andtestinginRDE(Ford- Task1.3)andfuelcells(EWII– Task2)
– WetchemistryPt/NbOx/Cforbaselinecomparison(Task1.4)
ProjectwillprogressfromunderstandingnewPVDmethodologyatsmallscale,establishingpreferredprocessingparameters,andthenapplyingthelearningonlargerscaleatExothermics
- Preferreddepositionparameterswillbedeterminedandusedinscaleup atExothermics (20-40grams)
• Tasks1.5and1.7refertochamberpreparationatExothermics,andcatalystprocessingrespectively
10

Approach: Experienced Partners• ORNL and Exothermics have already deposited Pt/NbOx/C powders (a few batches
in 1Q 2016)• UM has been able to distinguish Pt, Nb, O in TEM images for Pt/NbOx/C samples• NEU has worked extensively on arc plasma deposited samples in XAS
Catalyst synthesis and characterization partners are already familiar with Pt/NbOx/C system from prior work. Experience processing Pt/NbOx/C into MEAs at Ford will be used to help EWII get started.
Niobium Oxygen Platinum
TEM characterization showing that Pt, Nb, and O are well-dispersed through samples:
11
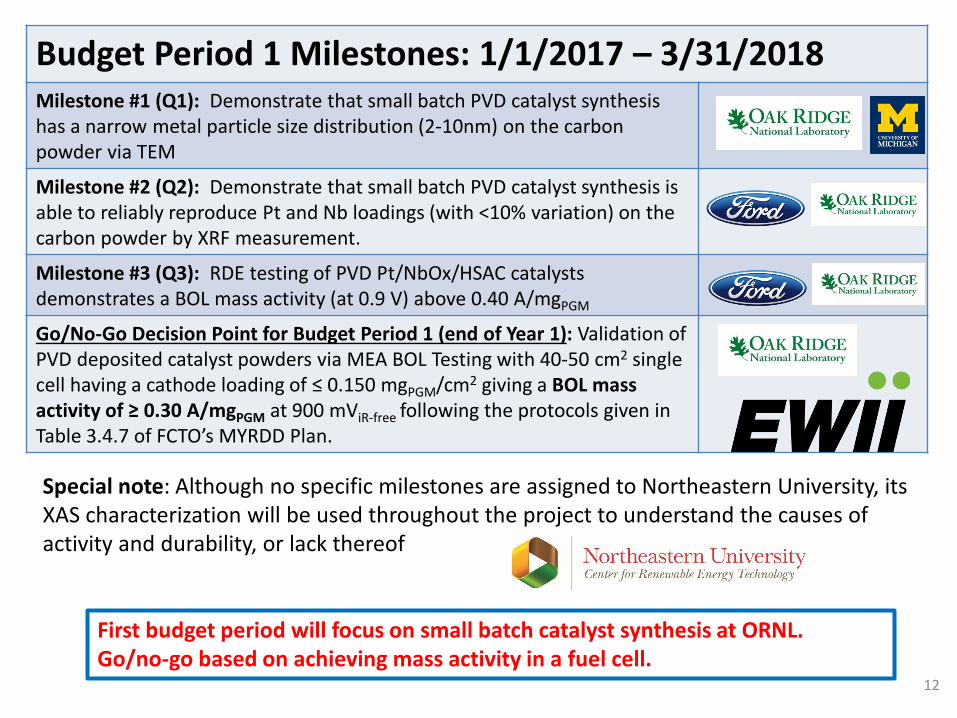
Budget Period 1 Milestones: 1/1/2017 – 3/31/2018Milestone #1 (Q1): Demonstrate that small batch PVD catalyst synthesis has a narrow metal particle size distribution (2-10nm) on the carbon powder via TEM
Milestone #2 (Q2): Demonstrate that small batch PVD catalyst synthesis is able to reliably reproduce Pt and Nb loadings (with <10% variation) on the carbon powder by XRF measurement.
Milestone #3 (Q3): RDE testing of PVD Pt/NbOx/HSAC catalysts demonstrates a BOL mass activity (at 0.9 V) above 0.40 A/mgPGM
Go/No-Go Decision Point for Budget Period 1 (end of Year 1): Validation of PVD deposited catalyst powders via MEA BOL Testing with 40-50 cm2 single cell having a cathode loading of ≤ 0.150 mgPGM/cm2 giving a BOL mass activity of ≥ 0.30 A/mgPGM at 900 mViR-free following the protocols given in Table 3.4.7 of FCTO’s MYRDD Plan.
First budget period will focus on small batch catalyst synthesis at ORNL. Go/no-go based on achieving mass activity in a fuel cell.
Special note: Although no specific milestones are assigned to Northeastern University, its XAS characterization will be used throughout the project to understand the causes of activity and durability, or lack thereof
12

Budget Period 2 Milestones: 4/1/2018 – 3/31/2019Milestone #4 (Q5): Large batch PVD catalyst - Pt, Nb loadings at <10% variation (XRF)
Milestone #5 (Q6): Large batch PVD catalyst - 2-10 nm Pt particle sizes (TEM)
Milestone #6 (Q7): Large batch PVD catalyst - mass activity @ 0.9 V > 0.4 A/mgPGM (RDE)
Milestones #7-9 (Q8): Large batch PVD catalyst - > 500 mW/cm2 at Q/∆Ti < 1.45 kW/˚C, 0.125 mgPGM/cm2, Pair,in < 150 kPa; < 40% mass activity loss and < 100 mV loss at 0.8 A/cm2 in electrocatalyst cycle (0.6-0.95 V); < 40% mass activity loss and < 200 mV loss at 1.5 A/cm2 in support corrosion cycle (1-1.5 V)
Go/No-go Decision Point for Budget Period 2 (end of Year 2): Large batch PVD catalyst, total loading of ≤ 0.125 mgPGM/cm2: BOL mass activity of ≥ 0.35 A/mgPGM. Mass activity following electrocatalyst and support cycling > 0.21 A/mgPGM (60% of 0.35 A/mgPGM).
Budget Period 3 Milestones: 4/1/2019 – 3/31/2020Milestone #10 (Q9): Large batch PVD catalyst - 1) mass activity > 0.40 A/mgPGM and 2) electrocatalyst AST (30K cycles) with < 40% loss in mass activity (RDE)
Milestone #11 (Q10): Large batch PVD catalyst, ≤ 0.125 mgPGM/cm2 – BOL mass activity of ≥ 0.44 A/mgPGM
Milestone #12-14 (Q11): Large batch PVD catalyst - > 1,000 mW/cm2 at Q/∆Ti < 1.45 kW/˚C, for 0.125 mgPGM/cm2, Pair,in < 150 kPa; < 40% mass activity loss and < 30 mV loss at 0.8 A/cm2 in electrocatalyst cycle (0.6-0.95 V); < 40% mass activity loss and < 30 mV loss at 1.5 A/cm2 in support corrosion cycle (1-1.5 V)
Milestone #15 (Q12): A set of MEAs (6 or more, each with active area ≥ 50 cm2) is made available for independent testing at a DOE-approved location.
Second and third budget periods will focus on Exothermics catalyst scaleup, as well as showing high power density and durability.
13

CollaborationsPartner Project Roles
Prime, Industry. Responsible for project management (Task 3), XRF measurements for Pt, Nb wt%, RDE testing (Task 1). Support role for MEA fabrication and fuel cell testing (Task 2).
FFRDC partner. Responsible for production of small batch Pt/NbOx/C and for transferring lessons learned small batch catalyst optimization to Exothermics for large batch production. Support role for XRF measurements. (Task 1)
Sub-contractor, Industry. Responsible for production of large batch Pt/NbOx/C. Can support with BET, PSD characterization. (Task 1)
Sub-contractor, University. Responsible for TEM and particle size measurements. Can also support with SEM, XPS, and other characterization techniques. (Task 1)
Sub-contractor, University. Role is to help understand by XAS whether coordination numbers, interatomic distances, and the presence of adsorbates (e.g. –OH) influence performance and durability (Task 1).
Sub-contractor, Industry. Responsible for MEA fabrication using Pt/NbOx/C catalysts on the cathode, and for fuel testing (Task 2).
All collaborations are within the DOE Hydrogen and Fuel Cells Program 14

• Identifying carbon source• Mixing protocols• Deposition conditions (pressure, rates,
O2/Ar ratio, time, etc.)
Accomplishments and Progress: Small Batch Sputtering
Preliminary work focused on optimizing deposition conditions to obtain optimized Pt/NbOx dispersion.
These variables will control catalyst particle size, weight loading and uniformity which will determine performance
Goal is to maximize Pt in “egg-shell” configuration before getting to mass transport limitation in fuel cell.
Research is focusing on ways to defeat funicular bonding from water, which keeps the support carbon aggregated together and prevents uniform coating
15

Accomplishments and Progress: Large Batch Sputtering System Upgrades
•Upgrading from one (25mm or 75mm) cathode to two 50mm cathodes
•Metallic or reactive deposition (oxides, nitrides, etc.,) possible via bipolar pulsed DC sputtering.
•Radiant heat and RF etch added for substrate de-gassing and functionalization.
•Improved deposition efficiency via use of new cathode and bowl positioning.
16

Accomplishments and ProgressTasks 1.1-1.3 have begun with deposition of Pt/C through PVD at ORNL. XRF, RDE performed at Ford. TEM, XPS at U Michigan.Sample: gmv-080 gmv-081 gmv-082 gmv-084 gmv-085
Carbon XC-72 XC-72 XC-72 acetylene black
acetylene black
Deposition temperature room room room room roomDeposition time (h:mm) 1:00 2:16 2:55 3:00 2:28Deposition pressure (mtorr) 10 20 10 10 10Use of stir bar? No Yes Yes No YesPt wt% (XRF) 11.4 3.9 5.9 15.1 23.3Pt0 percent (XPS, 4f region) 33 13 20 22 28Pt2+ percent (XPS, 4f region) 37 39 42 47 33Pt4+ percent (XPS, 4f region) 30 48 38 31 39Pt0 + Pt2+ percent (XPS, 4f region) 70 52 62 69 61Average mass activity (A/gPt, RDE) 492 520 462 372 405Average specific activity (uA/cm2, RDE) 2418 1079 1325 1473 726Average surface area (m2/g, RDE) 21 48 35 25 58TEM image
PVD Pt/C from ORNL yields very small Pt particle size, yet very high mass and specific activities. Stir bar linked to higher surface area. 17
0
100
200
300
400
500
600
0 5 10 15 20 25
Mas
s Act
ivity
(A/g
Pt)
Platinum Weight Percent
Accomplishments and Progress
XC-72
Acetylene black
RDE data
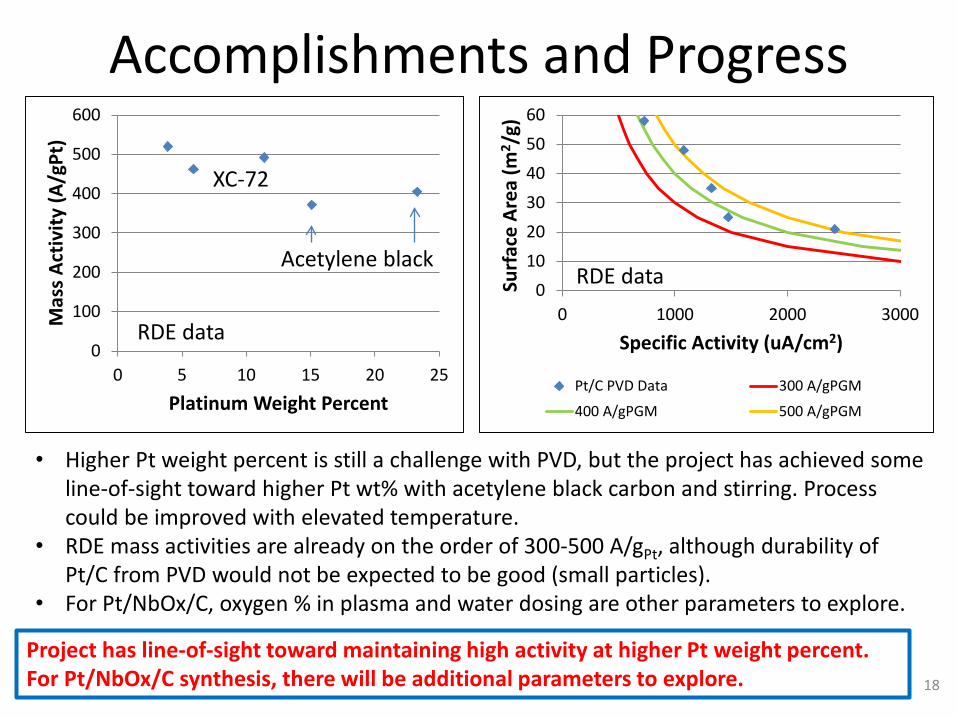
• Higher Pt weight percent is still a challenge with PVD, but the project has achieved some line-of-sight toward higher Pt wt% with acetylene black carbon and stirring. Process could be improved with elevated temperature.
• RDE mass activities are already on the order of 300-500 A/gPt, although durability of Pt/C from PVD would not be expected to be good (small particles).
• For Pt/NbOx/C, oxygen % in plasma and water dosing are other parameters to explore.
Project has line-of-sight toward maintaining high activity at higher Pt weight percent. For Pt/NbOx/C synthesis, there will be additional parameters to explore.
0102030405060
0 1000 2000 3000
Surf
ace
Area
(m2 /
g)
Specific Activity (uA/cm2)
Pt/C PVD Data 300 A/gPGM
400 A/gPGM 500 A/gPGM
RDE data
18

Future Work• Almost all of project still to come• Catalyst synthesis
– Selection of processing parameters, carbon – Small batch experimental designs at ORNL– Transfer of small batch understanding to Exothermics– Preparation of Exothermics chamber– Large batch experimental design at Exothermics– Refined cost analysis based on large batch sample parameters
• Catalyst characterization– TEM, XPS characterization at UM: particle size, compositional analysis,
oxidation states– XAS characterization through Northeastern U.– XRF and RDE characterization at Ford: Pt, Nb wt%, mass activity
• Fuel cell testing– Selection of balance-of-MEA components and cell formats for testing– Polarizations to determine power density– Electrocatalyst cycling– Support corrosion cycling– Limiting current measurements to diagnose MT resistances– EIS characterization (HFR, proton conductivity) to diagnose ohmic losses
Any proposed future work is subject to change based on funding levels. 19
Summary• Project motivated by reproducibility and processing simplifications
offered by PVD, as well as by activity and durability opportunities offered by use of niobium oxide as a secondary support
• Amorphous niobium oxide is electrically conductive and appears to remain stable during both RDE and fuel cell cycling
• Project will focus on small batch (1 g) processing in the first budget period and then scale up to larger batches (20-40 grams) in the 2nd
and 3rd budget periods. • Project has milestones that address mass activity, durability, and
power density. Go/no-go decisions are all premised on fuel cell performance.
• Most project partners have prior experience processing or characterizing Pt/NbOx/C catalysts.
• Pt/NbOx/C catalysts have shown higher activity and durability versus commercial Pt/C. However, increasing Pt wt% while maintaining activity will be a challenge.
• Recent work with Pt/C PVD samples show interestingly high mass activity and line-of-sight toward higher Pt wt%
20

TECHNICAL BACKUP SLIDES
FC-162

Acknowledgments
• Ford– Jun Yang– Chunmei Wang– Owen Lu– Chunchuan Xu
• Exothermics– Stephen DiPietro
• Oak Ridge National Lab– Gabriel Veith
• University of Michigan– Kai Sun
• Northeastern University– Sanjeev Mukerjee– Qingying Jia– Serge Pann
• EWII– Madeleine Odgaard– Debbie Schlueter
22

IsNb2O5 FormedDuringCycling?XPSof 13wt.%Pt/10.wt%a-NbOx /graphitizedcarbonasmadeandafter25K0.1↔1.0Vcyclesinoxygen(RDE)
Solidlineshowstheas-madesample,whilethedottedlineshowsthesampleafter25Kcycles
Thepeakat203.7eVmarked3d-5/2Scorrespondsto+2,thepeakat206.6eVmarkedas3d-5/2correspondsto+4
Whiletherewassomepeakshifttoahigherbindingenergy,agreaterpercentageofsurfaceNbwasatlowerbindingenergy(growthoflowbindingenergypeaks)
23

BudgetTask
Budget Period 1(1/1/17-3/31/18)
Budget Period 2(4/1/18-3/31/19)
Budget Period 3(4/1/19-3/31/20)
TOTAL
1 - Development, Characterization, and Validation of Catalyst Material and Development and Implementation of PVD process parameters
$580,278 $570,318 $535,717 $1,686,313(65%)
Exothermics $190,062 $170,638 $194,570 $555,270
Oak Ridge NL $89,000 $85,000 $54,000 $228,000
Northeastern U. $147,700 $156,100 $156,100 $459,900
U. Michigan $49,973 $54,349 $55,678 $160,000
Ford $103,543 $104,231 $75,369 $283,143
2 - Catalyst Layer Development and MEA Validation
$217,429 $299,660 $286,058 $803,147(31%)
EWII $137,219 $239,540 $232,223 $608,982
Ford $80,210 $60,120 $53,835 $194,165
3 – Project Management and Reporting (Ford) $20,188 $41,696 $43,068 $104,952
(4%)TOTAL $817,895 $911,674 $864,843 $2,594,41224