Embed Size (px)
Citation preview
IFC, World Bank Group (2015)
December, 2015
Vanuatu Agri-Tourism Linkages: A Baseline Study of Agri Demand from Port Vila’s Hospitality Sector
1
Table of Contents
Summary of Findings ...................................................................................................................................................... 2
Introduction .................................................................................................................................................................... 3
Next Steps ....................................................................................................................................................................... 5
Key Findings by Product ................................................................................................................................................. 7
Vegetables Segment ................................................................................................................................................... 8
Fruits Segment .......................................................................................................................................................... 11
Meats and Dairy Segment ........................................................................................................................................ 13
Herbs Segment ......................................................................................................................................................... 16
Major Fresh Food Suppliers and other Stakeholders .................................................................................................. 18
Scope and Methodology .............................................................................................................................................. 20
Challenges related to Data Aggregation ...................................................................................................................... 22
Annexes ........................................................................................................................................................................ 23
Annex 1A – Aggregate data by product for ‘Vegetables’ .......................................................................................... 23
Annex 1B – Aggregate data by product for ‘Fruits’ ................................................................................................... 24
Annex 1C – Aggregate data by product for ‘Meats and Dairy’ ................................................................................. 25
Annex 1D – Aggregate data by product for ‘Herbs’ .................................................................................................. 26
Annex 2A: List of Hotels/Resorts used as the Total Hotels market (Source: Tripadvisor) ........................................ 27
Annex 2B: List of Restaurants used as the Total Restaurants market (Source: Tripadvisor) .................................... 28
Annex 3: List of Suppliers/Stakeholders interviewed ............................................................................................... 29
Annex 4: Farm Support Association Port Vila Market House Survey Summary – 2014 ........................................... 30
2
Summary of Findings This study aims to analyze the purchasing patterns of Vanuatu’s tourism sector, in order to better understand
existing linkages between the tourism and agricultural sectors, and to identify opportunities to improve these
linkages. The study has been conducted by the International Finance Corporation (IFC), a member of the World
Bank Group.
The research conducted for this report quantifies two issues. First, this report estimates the demand for
vegetables, fruits, herbs, meats and dairy products across the hospitality sector in Port Vila. Secondly, based on
this demand estimate, as well as on feedback from specialists working in the sector, the report identifies particular
items that present opportunities for local agricultural producers: ‘gaps in the market’ which could be filled by
import replacement.
The data in this report can be used by the Government of Vanuatu, its donor partners, and the agricultural industry
to develop, fund and implement the policies and practices required to increase economic linkages between
tourism operators and agricultural producers, thus helping to spread the benefits of Vanuatu’s growing tourism
sector to a greater share of the country’s population. Increasing local food production can improve Vanuatu’s
trade balance, increase food security, and help to more evenly share the benefits of a growing tourism sector
across Vanuatu’s population, which remains chiefly employed in small-scale agricultural production.
In 2014, the tourism sector in Port Vila (hotels and restaurants) spent 1.5 billion Vatu (USD 15.6 million) on
procurement of fresh produce items. Of this amount, 54%, or more than 800 million Vatu (USD 8.5 million), is
spent on imported items. Specifically:
- Total demand for vegetables is 190 million Vatu (USD 2 million), of which 108 million Vatu (USD 1.1 million)
is spent on imports;
- Total demand for fruits is 155 million Vatu (USD 1.6 million), of which 60 million Vatu (USD 0.6 million) is
spent on imports;
- Total demand for meats and diary is 1.1 billion Vatu (USD 11.7 million), of which 632 million Vatu (USD
6.7 million) is spent on imports;
o Total seafood1 demand is 234 million Vatu (USD 2.5 million), of which 108.7 million Vatu (USD 1.2
million)
- Total demand for herbs is 19.9 million Vatu (USD 0.2 million), of which 3.6 million Vatu (USD 0.04 million)
is spent on imports;
This report shows that there are specific items within the import bill that can be produced locally but are either
not being produced, or not being produced in sufficient quantities. While meats (including seafood and poultry)
and dairy account for 79% of the estimated import bill, Vanuatu also imports significant volumes of staple
vegetables and fruits including potato, onion, carrot, capsicum, cauliflower/broccoli, cabbage, tomato, cantaloupe
and orange – all of which can be grown in Vanuatu.
The below list accounts for imports in excess of 400 million Vatu (USD 4.2 million), or over 50% of fresh food
imports by hotels and restaurants in Port Vila:
- Vegetables, in particular potatoes, onions, carrots and capsicums;
- Fruits, in particular tomatoes, oranges and cantaloupes;
- Seafood items, in particular prawns and fish;
1 Seafood is distinguished for purposes of cost breakdown. For remainder of the report, seafood is included cumulatively under ‘Meats and Diary’ segmentation
3
- Meats, in particular pork, lamb, bacon, beef and chicken.
This study therefore identifies meaningful impact that can be delivered by focusing on a particular subset of items.
We recommend a further product-by-product review of high-potential items identified by this report, focusing
specifically on the technical feasibility of local production (including impact of seasonal fluctuations in tourism
demand), as well as on the supply chain challenges for each item (including review of existing out-grower models
being applied in subsectors such as horticulture, coffee, cacao).
Introduction Tourism and agriculture are key drivers of economic growth in Vanuatu. Tourism is a significant contributor to the
country’s GDP, with tourism expenditure as a percentage of GDP increasing from 26% in 2002 to 33% in 20102.
Most tourism revenue is generated in the peak holiday travel months between March and August. Tourism
remains concentrated in Vanuatu’s capital, Port Vila, which hosts 97% of the tourists travelling to the country. In
2014, Vanuatu saw 108,808 tourists arriving by air.
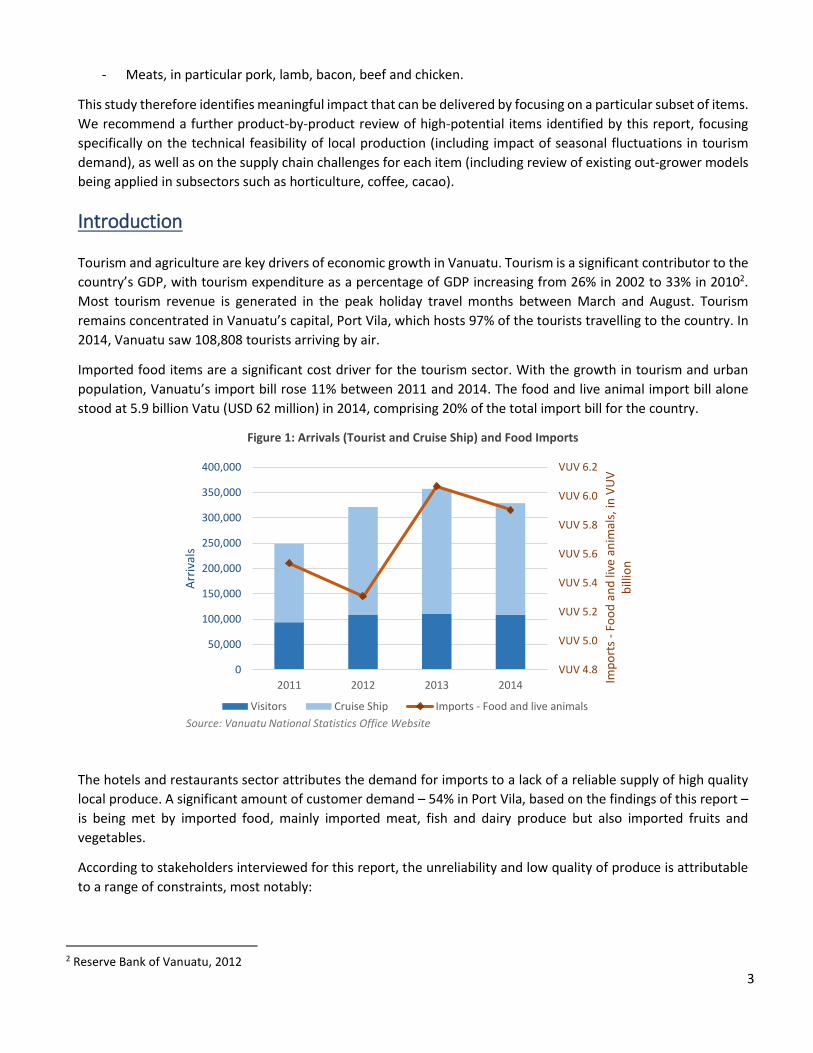
Imported food items are a significant cost driver for the tourism sector. With the growth in tourism and urban
population, Vanuatu’s import bill rose 11% between 2011 and 2014. The food and live animal import bill alone
stood at 5.9 billion Vatu (USD 62 million) in 2014, comprising 20% of the total import bill for the country.
Figure 1: Arrivals (Tourist and Cruise Ship) and Food Imports
The hotels and restaurants sector attributes the demand for imports to a lack of a reliable supply of high quality
local produce. A significant amount of customer demand – 54% in Port Vila, based on the findings of this report –
is being met by imported food, mainly imported meat, fish and dairy produce but also imported fruits and
vegetables.
According to stakeholders interviewed for this report, the unreliability and low quality of produce is attributable
to a range of constraints, most notably:
2 Reserve Bank of Vanuatu, 2012
VUV 4.8
VUV 5.0
VUV 5.2
VUV 5.4
VUV 5.6
VUV 5.8
VUV 6.0
VUV 6.2
0
50,000
100,000
150,000
200,000
250,000
300,000
350,000
400,000
2011 2012 2013 2014 Imp
ort
s -
Foo
d a
nd
live
an
imal
s, in
VU
V
bill
ion
Arr
ival
s
Visitors Cruise Ship Imports - Food and live animals
Source: Vanuatu National Statistics Office Website
4
o Lack of linkages between the buyers (hotels and restaurants) and the farmers via an aggregator or
wholesaler, leading to a gap in information exchange and effective marketing of the produce;
o Lack of modern infrastructure and farming tools and techniques, including irrigation;
o Inefficiencies of inter-island shipping, with associated high costs and post production food mishandling;
o Competition from lower quality and lower priced imports, especially from South East Asian countries;
o Inadequate access to high-quality training and sources of affordable capital, limiting semi-subsistence
farmers’ ability to scale up, along with an absence of a mainstream farmers association leaving farmers with
insufficient bargaining power.
Around 80% of Vanuatu’s population is dependent in some way on the agriculture sector, which contributes 28%
to GDP3. The majority of producers are small-holder farmers living in rural areas, with the sector contributing 71%
to total rural household income4. Given the potential benefit to the local farmers and economy by transfer of
gains, the Government of Vanuatu is focused on reducing the import bill and recognizes the need to strengthen
the domestic supply chain to maximize local benefits in the expansion of the tourism sector.
Based on findings in this study and engagement with varied stakeholders, IFC proposes the below key
recommendations are implemented in both the short and long term to increase positive changes in the sector.
3 The Vanuatu Agriculture Census 2007 recorded 38,879 households engaged in agriculture activities, resulting in around 175,000 household members (about 80% of the population); Source for contribution to GDP: The World Bank data for 2013 4 According to the 2010 Household Income Expenditure Survey.
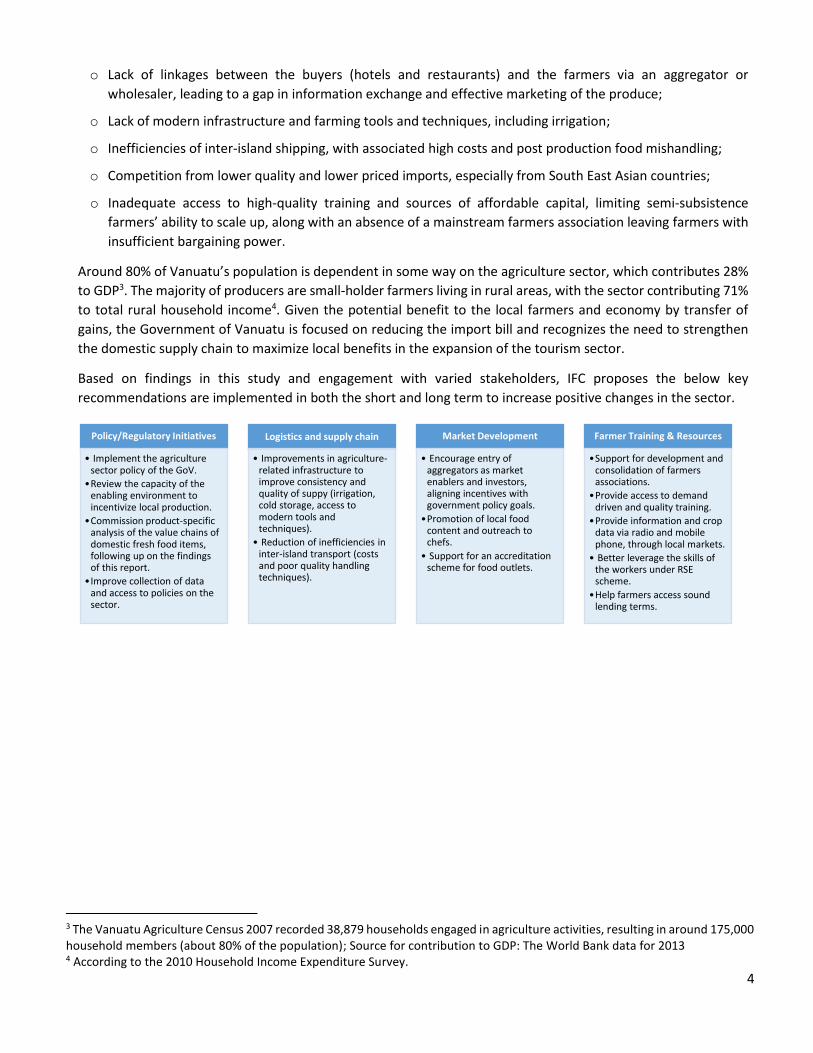
Policy/Regulatory Initiatives
• Implement the agriculture sector policy of the GoV.
•Review the capacity of the enabling environment to incentivize local production.
•Commission product-specific analysis of the value chains of domestic fresh food items, following up on the findings of this report.
•Improve collection of data and access to policies on the sector.
Logistics and supply chain
• Improvements in agriculture-related infrastructure to improve consistency and quality of suppy (irrigation, cold storage, access to modern tools and techniques).
• Reduction of inefficiencies in inter-island transport (costs and poor quality handling techniques).
Market Development
• Encourage entry of aggregators as market enablers and investors, aligning incentives with government policy goals.
•Promotion of local food content and outreach to chefs.
• Support for an accreditation scheme for food outlets.
Farmer Training & Resources
•Support for development and consolidation of farmers associations.
•Provide access to demand driven and quality training.
•Provide information and crop data via radio and mobile phone, through local markets.
• Better leverage the skills of the workers under RSE scheme.
•Help farmers access sound lending terms.
5
Next Steps Tourism and its related industries account for more than 20% of direct economic output in Vanuatu. However, the
structure of a tourism industry determines how tourism revenue is spread throughout the economy, and who
benefits from growth in the tourism sector. Generally speaking, the breadth of participation in tourism is driven by
levels of local content and by the structure of the tax system.
Local content in tourism typically includes local employment opportunities and provision of local products,
including food items, to tourists through the supply chain. Looking at this issue from another angle, hotel operating
costs in the Pacific Islands are driven by energy, food purchasing and provision, labor, and facilities maintenance
and upgrades. These are the segments of the supply chain where local content can be increased.
The below recommendations for moving forward in improving linkages between the tourism and agriculture
sectors in Vanuatu are based on discussions with government, producers, and the tourism industry during the
process of gathering data for this report. These recommendations closely follow the recommendations and findings
of the recent Vanuatu Fruit and Vegetable Sector Value Chain Analysis conducted by the Food and Agriculture
Organization.
Policy/Regulatory Initiatives
o Implement the agriculture sector policy5 finalized in 2015 and the upcoming subsector policies, to lay a strong
foundation for the sector into the future.
o Review the current enabling environment to see whether it can be optimized to incentivize the government’s
policy goals of increasing local food content, rather than meeting demand through imports. Such a review
should be conducted product-by-product, in close coordination with producers, to ensure that local
production can gradually ramp up to meet demand.
o Commission further product-specific analysis of the value chain of key products identified as high priority
through this study. These include pork, lamb, bacon, beef and chicken; seafood items including prawns and
fish; vegetables including potatoes, onion, carrots and capsicums; and fruits including tomatoes, oranges and
cantaloupes. These products account for more than half of the value of fresh produce imports identified.
Under the proposed European Development Fund 11 Rural Development Program, value chains of some of
these products may be analyzed further.
o Improve access to agriculture sector data, including regular dissemination of agricultural policy and research
via the policy bank to help to reduce the knowledge gap.
Logistics and supply chain
o Agriculture-related infrastructure needs to be improved. Hydroponic techniques and improved irrigation
facilities where applicable, cold storage facilities along the supply chain and modern tools and equipment for
farmers are needed to support further growth.
o Inter-island transportation inefficiencies need to be addressed, along with improving transport of fresh
perishable produce to minimize bruising and post-harvest spoilage.
Market Development
5 http://www.malffb.gov.vu/doc/Vanuatu_Agriculture_Sector_Policy.pdf
6
o An aggregator, whether a commercial wholesaler or a cooperative, could play a key role in organizing market
supply, investing in improved post-harvest technology such as cold storage for consistency of supply, and
providing a coordinated point of contact for hotel procurement teams for weekly product and price lists.
o Increase promotion of local food content and proactively reach out to Chefs and procurement teams of
hotels/restaurants, to encourage the use of local produce in menus via ongoing communication channels.
o Consider the establishment of an accreditation program for food hospitality outlets to help ensure better
standards, higher customer loyalty and producer accountability. A program that could provide participants
with improved market access (similar to the Ambassador’s program in tourism) would likely see higher uptake.
Support to Farmers
o Support the development and potential consolidation of farmers’ associations to create a more even playing
field for small-holder farmers. In addition to improving the bargaining power of farmers at marketing,
associations can provide centralized access to crop data, good-quality inputs, information and training on
better growing and harvesting techniques, as well as finance models for upgrading equipment and investing
in production.
o Training and outreach to farmers should be based on a demand-driven approach. Some training areas
identified during discussions for this study are modern farming techniques, disease management, product
packaging and post-harvest handling. Financial management training including cost management and pricing
– currently, most farmers’ price based on the next farmers’ pricing instead of their own cost structure, thus
inhibiting competitiveness and efficiencies. The Vanuatu Cooperative Federation is producing training
manuals which is a positive step in this direction.
o Provide data and information to farmers via channels such as radio (as has been traditionally used), mobile
phone apps, text messaging and road shows/camps near the markets for information related to key
agricultural variables, such as weather forecasts, crop data, information on improved quality
seeds/techniques.
o Consider leveraging seasonal workers returning from Australia and New Zealand, who often have saved up
capital and have learnt basic techniques (usually harvesting) from overseas employment under the Regional
Seasonal Employment scheme. This group may be good candidates for additional training to strengthen the
local supply side/farms.
o Access to finance continues to be a key challenge for local farmers. The high associated cost of capital to
counter the risk of lending to a small farmer leads to farmers either not borrowing from formal channels or
not being able to generate enough return to make the business sustainable. Accessible loans at an affordable
rate remain a key component of future sector development.
7
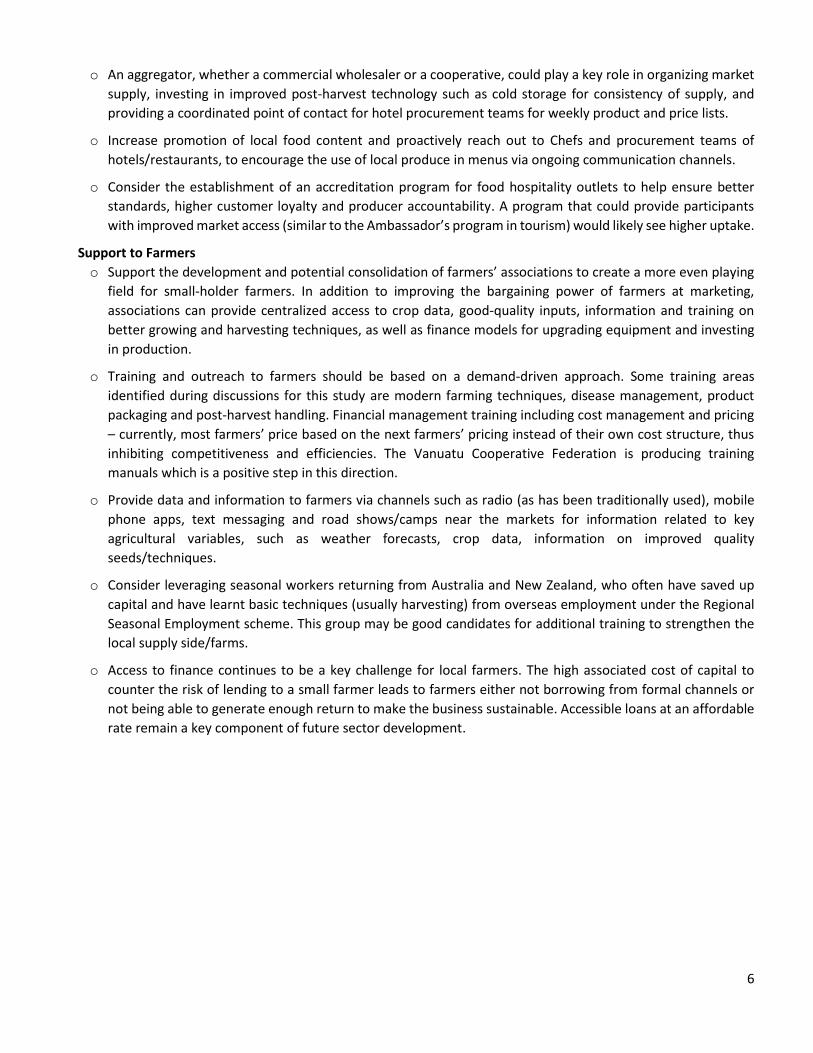
Key Findings by Product Based on the survey findings and extrapolating it to the market in Port Vila, it is estimated that:
o 1.5 billion Vatu (USD 15.6 million) is spent annually by hotels and restaurants on fresh food items, including
meats and dairy.
o 54% is imported, amounting to a total of more than 800 million Vatu (USD 8.5 million). 46% is procured locally,
amounting to 675 million Vatu (USD 7.1 million).
o These imports accounted for approximately 14% of total food and live animal imports in FY14.
o 79% of imports are attributable to demand for meats (including poultry and seafood) and dairy.
Figure 2: Total Demand, in Vatu million and Imports by Category (%)
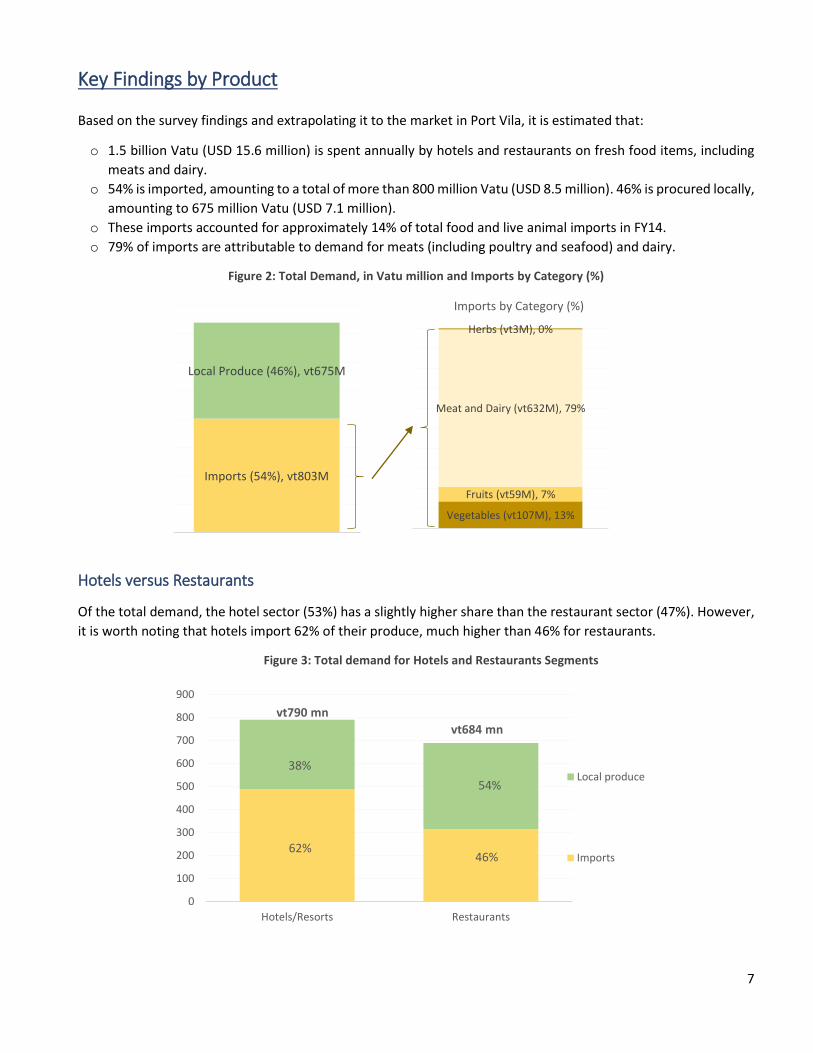
Hotels versus Restaurants
Of the total demand, the hotel sector (53%) has a slightly higher share than the restaurant sector (47%). However,
it is worth noting that hotels import 62% of their produce, much higher than 46% for restaurants.
Figure 3: Total demand for Hotels and Restaurants Segments
Imports (54%), vt803M
Local Produce (46%), vt675M
1
Vegetables (vt107M), 13%
Fruits (vt59M), 7%
Meat and Dairy (vt632M), 79%
Herbs (vt3M), 0%
Imports by Category (%)
0
100
200
300
400
500
600
700
800
900
Hotels/Resorts Restaurants
Local produce
Imports
38%
vt790 mn
46%
54%
62%
vt684 mn
8
The procurement approach followed by hotels and restaurants seems to vary meaningfully. Some key differences
identified are;
o Assessment of daily needs: Restaurant needs can be assessed on a daily basis and can be met in a more
flexible manner by sourcing replenishments easily from the market or shop. Most restaurants purchase on a
daily/weekly basis and additionally as needed. Hotel demand is more clustered.
o Certainty about future orders: Hotels have projections of food demand through advanced booking numbers,
which enables them to pre-order food products to a better extent versus the restaurants, where demand is
more erratic and on a day to day basis.
o Procurement procedures: Receipts are generally unavailable from the central market, making it difficult for
large hotels to purchase fruit and vegetables due to their need for documentation for internal accounting
systems. Smaller businesses, however, may be able to accommodate ad-hoc purchases more flexibly. Also,
hotels often have long term contracts for imports to get better prices and consistent supply.
o Quality of the produce: Some restaurateurs were more accepting of the variance in quality and quantity of
market produce and therefore more willing to buy local produce.
o Network with the local producers: Restaurants tend to have better local networks and information channels
with growers and market vendors. Many restaurants are using local growers directly and have local touch
points for regular supply of fresh fish. Growers are possibly more comfortable approaching restaurants with
smaller volumes than hotels, who have stricter requirements in terms of quality, quantity and need for
consistent supply.
While hotels catered to mainly air travelers, restaurants indicated a mixed customer base between residents, air
tourists and cruise visitors, with some catering towards one over the other. Almost all restaurants reported an
increased number of customers on cruise ship days.
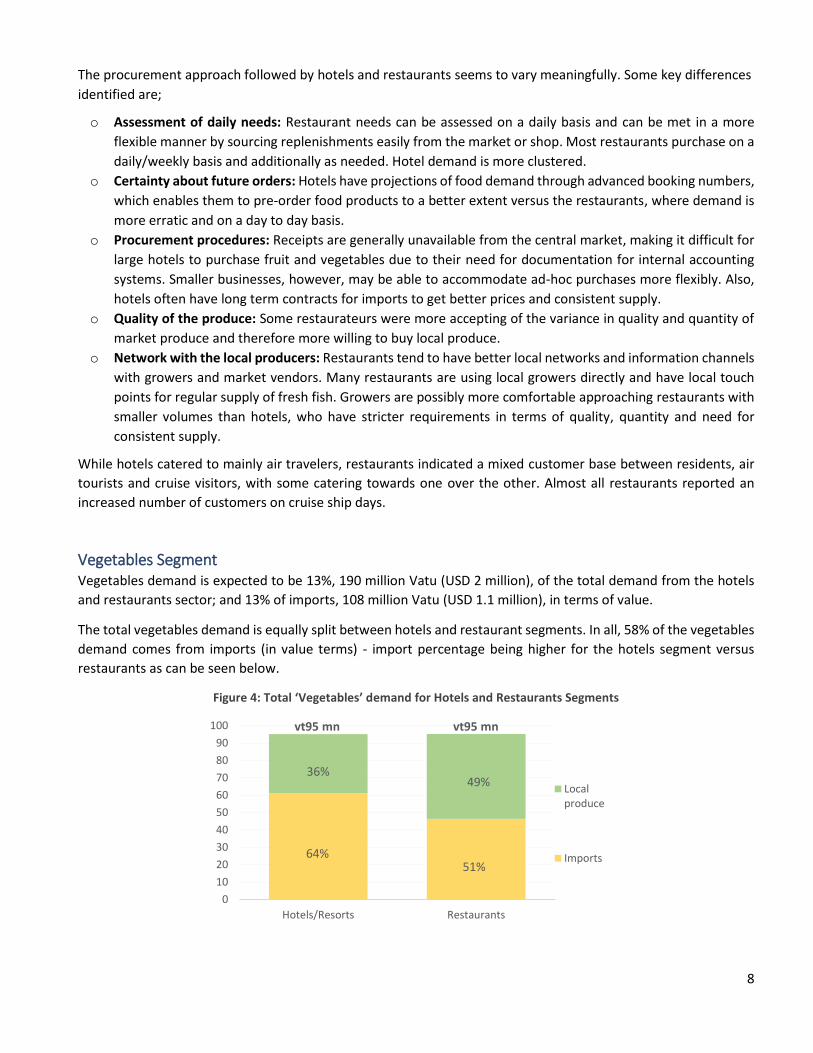
Vegetables Segment Vegetables demand is expected to be 13%, 190 million Vatu (USD 2 million), of the total demand from the hotels
and restaurants sector; and 13% of imports, 108 million Vatu (USD 1.1 million), in terms of value.
The total vegetables demand is equally split between hotels and restaurant segments. In all, 58% of the vegetables
demand comes from imports (in value terms) - import percentage being higher for the hotels segment versus
restaurants as can be seen below.
Figure 4: Total ‘Vegetables’ demand for Hotels and Restaurants Segments
0
10
20
30
40
50
60
70
80
90
100
Hotels/Resorts Restaurants
Localproduce
Imports
36%
vt95 mn
51%
49%
64%
vt95 mn
9
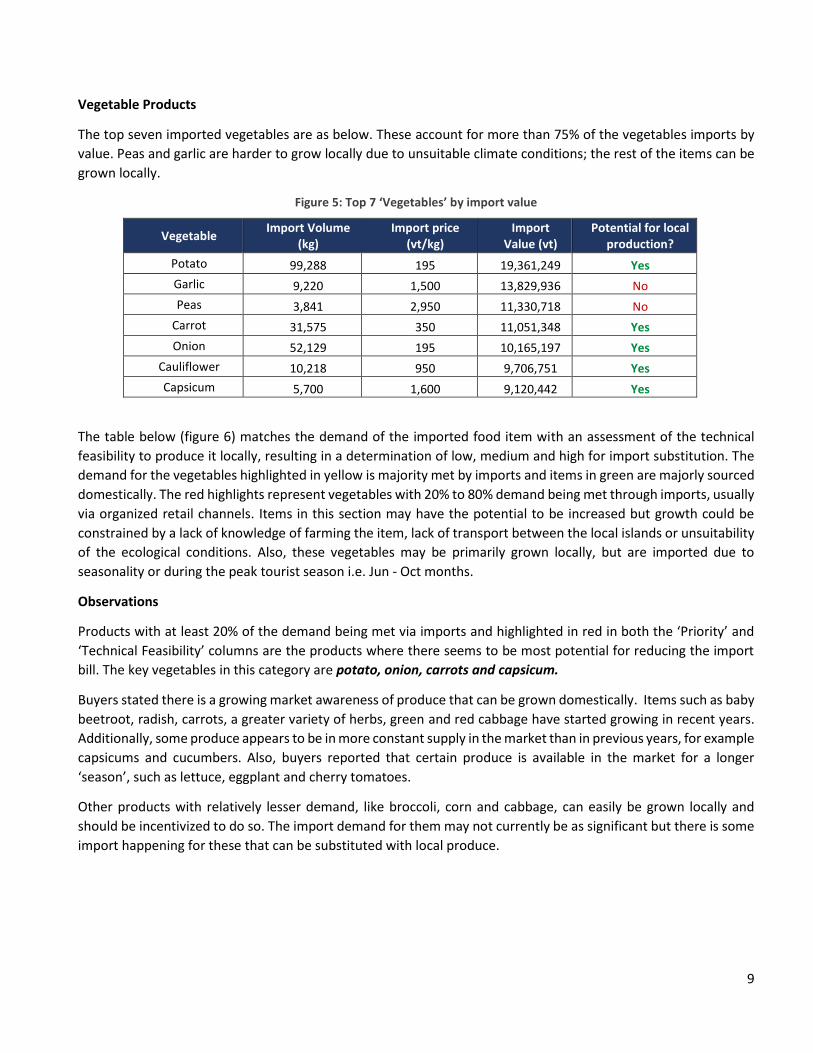
Vegetable Products
The top seven imported vegetables are as below. These account for more than 75% of the vegetables imports by
value. Peas and garlic are harder to grow locally due to unsuitable climate conditions; the rest of the items can be
grown locally.
Figure 5: Top 7 ‘Vegetables’ by import value
Vegetable Import Volume
(kg) Import price
(vt/kg) Import
Value (vt) Potential for local
production?
Potato 99,288 195 19,361,249 Yes
Garlic 9,220 1,500 13,829,936 No
Peas 3,841 2,950 11,330,718 No
Carrot 31,575 350 11,051,348 Yes
Onion 52,129 195 10,165,197 Yes
Cauliflower 10,218 950 9,706,751 Yes
Capsicum 5,700 1,600 9,120,442 Yes
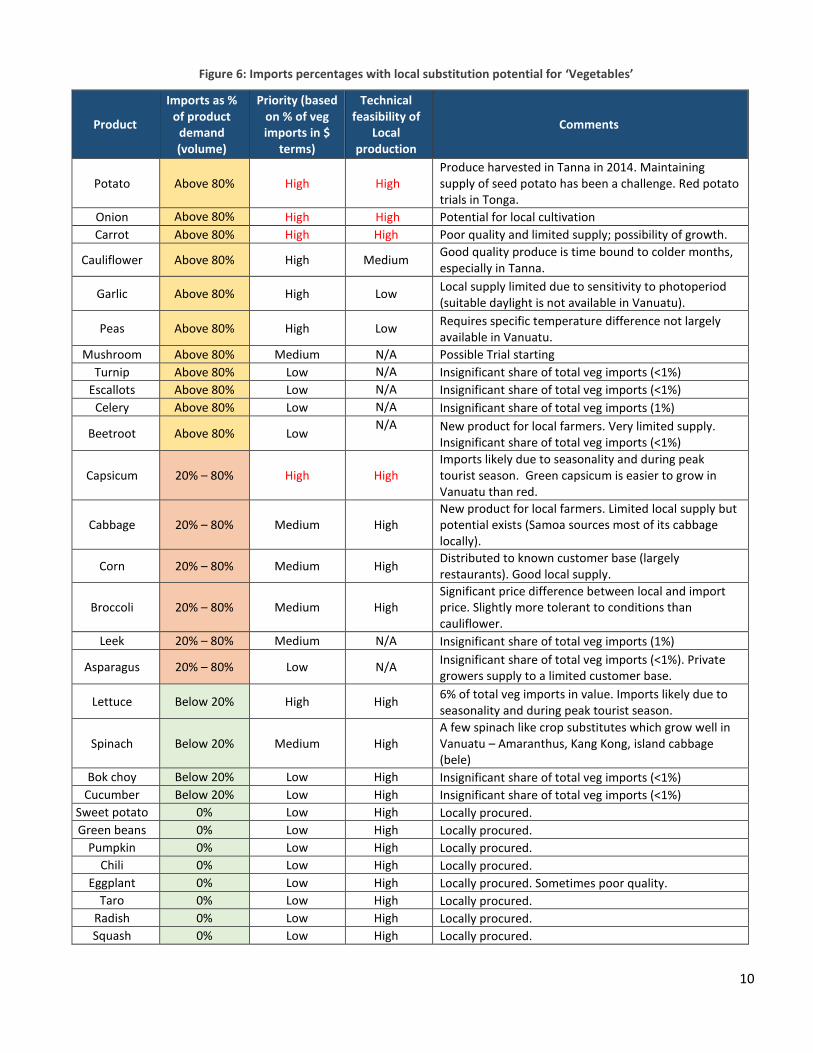
The table below (figure 6) matches the demand of the imported food item with an assessment of the technical
feasibility to produce it locally, resulting in a determination of low, medium and high for import substitution. The
demand for the vegetables highlighted in yellow is majority met by imports and items in green are majorly sourced
domestically. The red highlights represent vegetables with 20% to 80% demand being met through imports, usually
via organized retail channels. Items in this section may have the potential to be increased but growth could be
constrained by a lack of knowledge of farming the item, lack of transport between the local islands or unsuitability
of the ecological conditions. Also, these vegetables may be primarily grown locally, but are imported due to
seasonality or during the peak tourist season i.e. Jun - Oct months.
Observations
Products with at least 20% of the demand being met via imports and highlighted in red in both the ‘Priority’ and
‘Technical Feasibility’ columns are the products where there seems to be most potential for reducing the import
bill. The key vegetables in this category are potato, onion, carrots and capsicum.
Buyers stated there is a growing market awareness of produce that can be grown domestically. Items such as baby
beetroot, radish, carrots, a greater variety of herbs, green and red cabbage have started growing in recent years.
Additionally, some produce appears to be in more constant supply in the market than in previous years, for example
capsicums and cucumbers. Also, buyers reported that certain produce is available in the market for a longer
‘season’, such as lettuce, eggplant and cherry tomatoes.
Other products with relatively lesser demand, like broccoli, corn and cabbage, can easily be grown locally and
should be incentivized to do so. The import demand for them may not currently be as significant but there is some
import happening for these that can be substituted with local produce.
10
Figure 6: Imports percentages with local substitution potential for ‘Vegetables’
Product
Imports as % of product
demand (volume)
Priority (based on % of veg imports in $
terms)
Technical feasibility of
Local production
Comments
Potato Above 80% High High Produce harvested in Tanna in 2014. Maintaining supply of seed potato has been a challenge. Red potato trials in Tonga.
Onion Above 80% High High Potential for local cultivation
Carrot Above 80% High High Poor quality and limited supply; possibility of growth.
Cauliflower Above 80% High Medium Good quality produce is time bound to colder months, especially in Tanna.
Garlic Above 80% High Low Local supply limited due to sensitivity to photoperiod (suitable daylight is not available in Vanuatu).
Peas Above 80% High Low Requires specific temperature difference not largely available in Vanuatu.
Mushroom Above 80% Medium N/A Possible Trial starting
Turnip Above 80% Low N/A Insignificant share of total veg imports (<1%)
Escallots Above 80% Low N/A Insignificant share of total veg imports (<1%)
Celery Above 80% Low N/A Insignificant share of total veg imports (1%)
Beetroot Above 80% Low N/A New product for local farmers. Very limited supply.
Insignificant share of total veg imports (<1%)
Capsicum 20% – 80% High High Imports likely due to seasonality and during peak tourist season. Green capsicum is easier to grow in Vanuatu than red.
Cabbage 20% – 80% Medium High New product for local farmers. Limited local supply but potential exists (Samoa sources most of its cabbage locally).
Corn 20% – 80% Medium High Distributed to known customer base (largely restaurants). Good local supply.
Broccoli 20% – 80% Medium High Significant price difference between local and import price. Slightly more tolerant to conditions than cauliflower.
Leek 20% – 80% Medium N/A Insignificant share of total veg imports (1%)
Asparagus 20% – 80% Low N/A Insignificant share of total veg imports (<1%). Private growers supply to a limited customer base.
Lettuce Below 20% High High 6% of total veg imports in value. Imports likely due to seasonality and during peak tourist season.
Spinach Below 20% Medium High A few spinach like crop substitutes which grow well in Vanuatu – Amaranthus, Kang Kong, island cabbage (bele)
Bok choy Below 20% Low High Insignificant share of total veg imports (<1%)
Cucumber Below 20% Low High Insignificant share of total veg imports (<1%)
Sweet potato 0% Low High Locally procured.
Green beans 0% Low High Locally procured.
Pumpkin 0% Low High Locally procured.
Chili 0% Low High Locally procured.
Eggplant 0% Low High Locally procured. Sometimes poor quality.
Taro 0% Low High Locally procured.
Radish 0% Low High Locally procured.
Squash 0% Low High Locally procured.
11
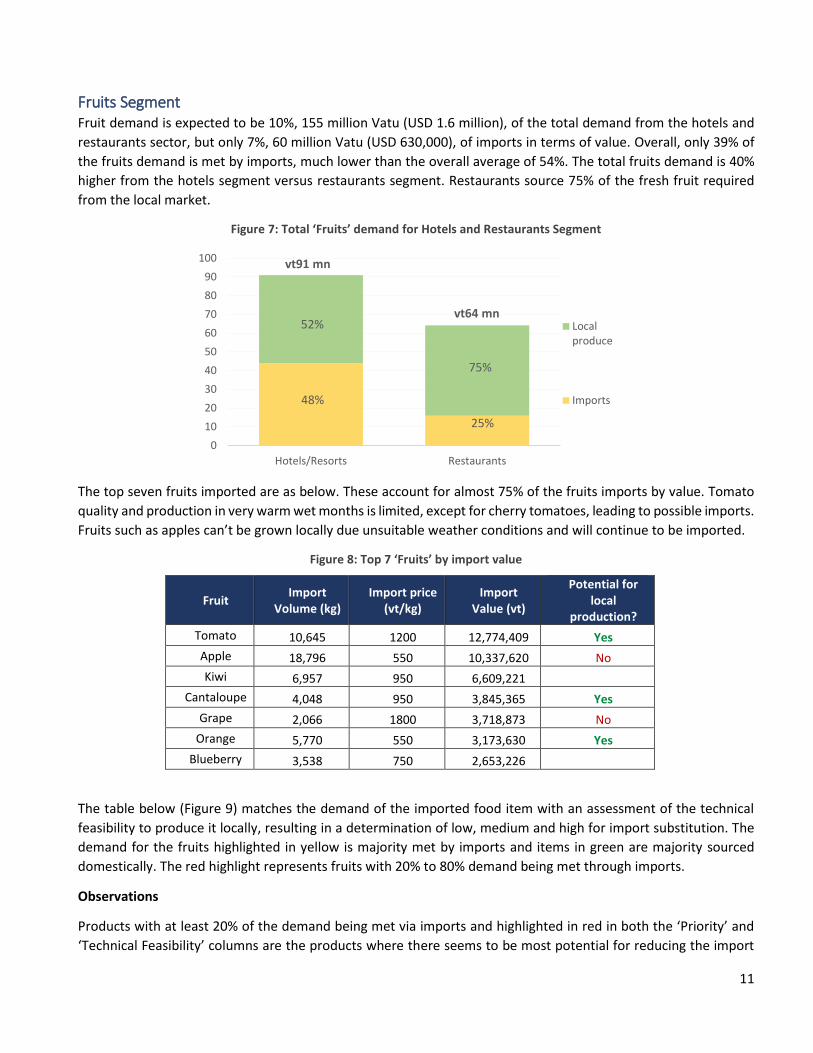
Fruits Segment Fruit demand is expected to be 10%, 155 million Vatu (USD 1.6 million), of the total demand from the hotels and
restaurants sector, but only 7%, 60 million Vatu (USD 630,000), of imports in terms of value. Overall, only 39% of
the fruits demand is met by imports, much lower than the overall average of 54%. The total fruits demand is 40%
higher from the hotels segment versus restaurants segment. Restaurants source 75% of the fresh fruit required
from the local market.
Figure 7: Total ‘Fruits’ demand for Hotels and Restaurants Segment
The top seven fruits imported are as below. These account for almost 75% of the fruits imports by value. Tomato
quality and production in very warm wet months is limited, except for cherry tomatoes, leading to possible imports.
Fruits such as apples can’t be grown locally due unsuitable weather conditions and will continue to be imported.
Figure 8: Top 7 ‘Fruits’ by import value
Fruit Import
Volume (kg) Import price
(vt/kg) Import
Value (vt)
Potential for local
production?
Tomato 10,645 1200 12,774,409 Yes
Apple 18,796 550 10,337,620 No
Kiwi 6,957 950 6,609,221
Cantaloupe 4,048 950 3,845,365 Yes
Grape 2,066 1800 3,718,873 No
Orange 5,770 550 3,173,630 Yes
Blueberry 3,538 750 2,653,226
The table below (Figure 9) matches the demand of the imported food item with an assessment of the technical
feasibility to produce it locally, resulting in a determination of low, medium and high for import substitution. The
demand for the fruits highlighted in yellow is majority met by imports and items in green are majority sourced
domestically. The red highlight represents fruits with 20% to 80% demand being met through imports.
Observations
Products with at least 20% of the demand being met via imports and highlighted in red in both the ‘Priority’ and
‘Technical Feasibility’ columns are the products where there seems to be most potential for reducing the import
0
10
20
30
40
50
60
70
80
90
100
Hotels/Resorts Restaurants
Localproduce
Imports
52%
vt91 mn
25%
75%
48%
vt64 mn
12
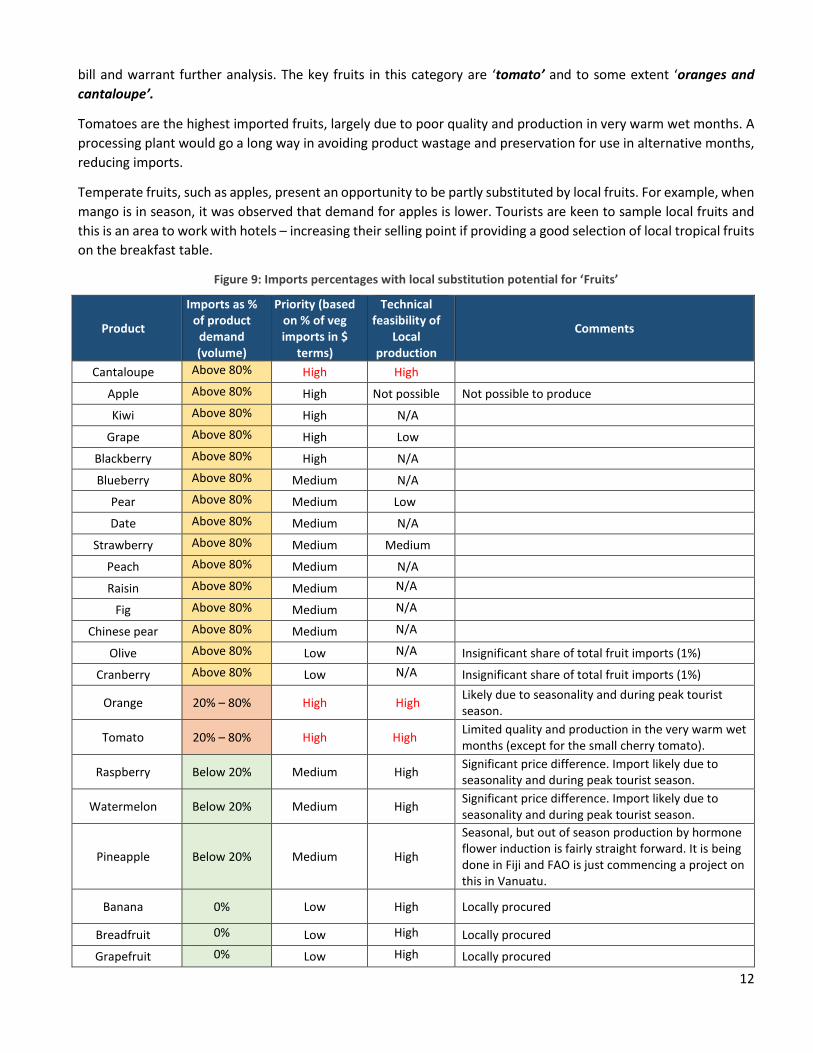
bill and warrant further analysis. The key fruits in this category are ‘tomato’ and to some extent ‘oranges and
cantaloupe’.
Tomatoes are the highest imported fruits, largely due to poor quality and production in very warm wet months. A
processing plant would go a long way in avoiding product wastage and preservation for use in alternative months,
reducing imports.
Temperate fruits, such as apples, present an opportunity to be partly substituted by local fruits. For example, when
mango is in season, it was observed that demand for apples is lower. Tourists are keen to sample local fruits and
this is an area to work with hotels – increasing their selling point if providing a good selection of local tropical fruits
on the breakfast table.
Figure 9: Imports percentages with local substitution potential for ‘Fruits’
Product
Imports as % of product
demand (volume)
Priority (based on % of veg imports in $
terms)
Technical feasibility of
Local production
Comments
Cantaloupe Above 80% High High
Apple Above 80% High Not possible Not possible to produce
Kiwi Above 80% High N/A
Grape Above 80% High Low
Blackberry Above 80% High N/A
Blueberry Above 80% Medium N/A
Pear Above 80% Medium Low
Date Above 80% Medium N/A
Strawberry Above 80% Medium Medium
Peach Above 80% Medium N/A
Raisin Above 80% Medium N/A
Fig Above 80% Medium N/A
Chinese pear Above 80% Medium N/A
Olive Above 80% Low N/A Insignificant share of total fruit imports (1%)
Cranberry Above 80% Low N/A Insignificant share of total fruit imports (1%)
Orange 20% – 80% High High Likely due to seasonality and during peak tourist season.
Tomato 20% – 80% High High Limited quality and production in the very warm wet months (except for the small cherry tomato).
Raspberry Below 20% Medium High Significant price difference. Import likely due to seasonality and during peak tourist season.
Watermelon Below 20% Medium High Significant price difference. Import likely due to seasonality and during peak tourist season.
Pineapple Below 20% Medium High
Seasonal, but out of season production by hormone flower induction is fairly straight forward. It is being done in Fiji and FAO is just commencing a project on this in Vanuatu.
Banana 0% Low High Locally procured
Breadfruit 0% Low High Locally procured
Grapefruit 0% Low High Locally procured
13
Product
Imports as % of product
demand (volume)
Priority (based on % of veg imports in $
terms)
Technical feasibility of
Local production
Comments
Guava 0% Low High Locally procured
Lemon 0% Low High Locally procured
Lime 0% Low High Locally procured
Mango 0% Low High Locally procured
Papaya/PawPaw 0% Low High Locally procured
Star fruit 0% Low High Locally procured
Coconut 0% Low High Locally procured
Avocado 0% Low High Locally procured
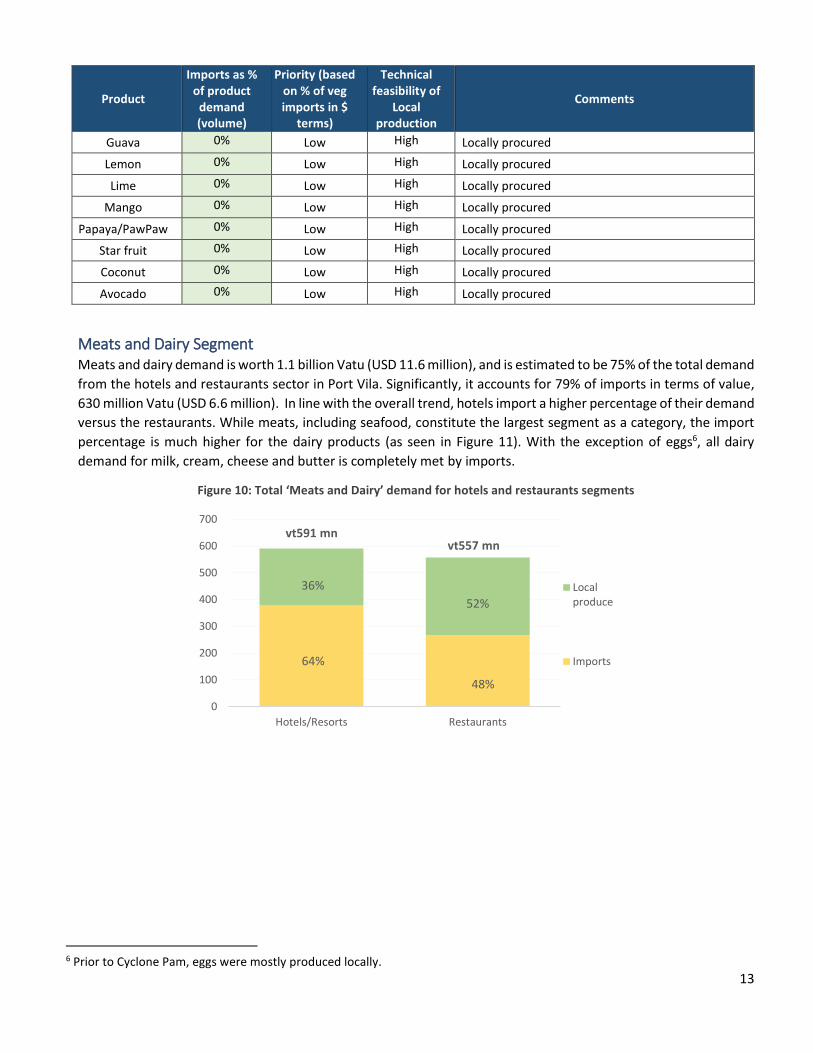
Meats and Dairy Segment Meats and dairy demand is worth 1.1 billion Vatu (USD 11.6 million), and is estimated to be 75% of the total demand
from the hotels and restaurants sector in Port Vila. Significantly, it accounts for 79% of imports in terms of value,
630 million Vatu (USD 6.6 million). In line with the overall trend, hotels import a higher percentage of their demand
versus the restaurants. While meats, including seafood, constitute the largest segment as a category, the import
percentage is much higher for the dairy products (as seen in Figure 11). With the exception of eggs6, all dairy
demand for milk, cream, cheese and butter is completely met by imports.
Figure 10: Total ‘Meats and Dairy’ demand for hotels and restaurants segments
6 Prior to Cyclone Pam, eggs were mostly produced locally.
0
100
200
300
400
500
600
700
Hotels/Resorts Restaurants
Localproduce
Imports
36%
vt591 mn
48%
52%
64%
vt557 mn
14
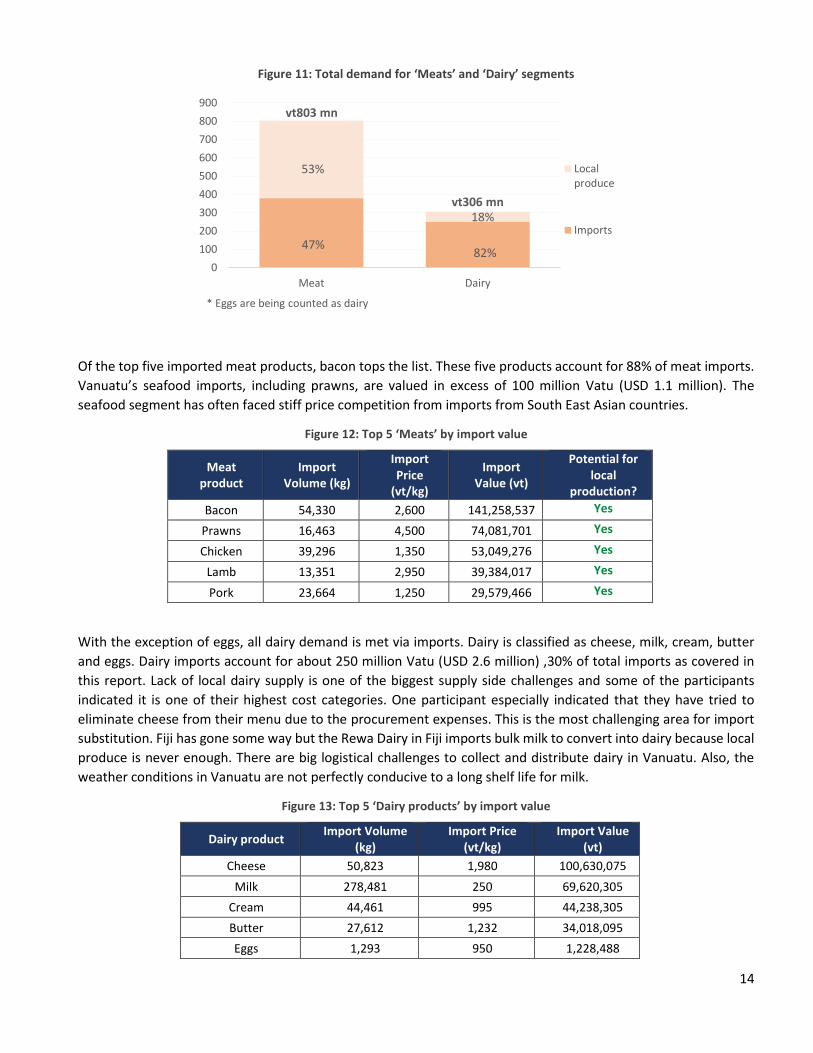
Figure 11: Total demand for ‘Meats’ and ‘Dairy’ segments
Of the top five imported meat products, bacon tops the list. These five products account for 88% of meat imports.
Vanuatu’s seafood imports, including prawns, are valued in excess of 100 million Vatu (USD 1.1 million). The
seafood segment has often faced stiff price competition from imports from South East Asian countries.
Figure 12: Top 5 ‘Meats’ by import value
Meat product
Import Volume (kg)
Import Price
(vt/kg)
Import Value (vt)
Potential for local
production?
Bacon 54,330 2,600 141,258,537 Yes
Prawns 16,463 4,500 74,081,701 Yes
Chicken 39,296 1,350 53,049,276 Yes
Lamb 13,351 2,950 39,384,017 Yes
Pork 23,664 1,250 29,579,466 Yes
With the exception of eggs, all dairy demand is met via imports. Dairy is classified as cheese, milk, cream, butter
and eggs. Dairy imports account for about 250 million Vatu (USD 2.6 million) ,30% of total imports as covered in
this report. Lack of local dairy supply is one of the biggest supply side challenges and some of the participants
indicated it is one of their highest cost categories. One participant especially indicated that they have tried to
eliminate cheese from their menu due to the procurement expenses. This is the most challenging area for import
substitution. Fiji has gone some way but the Rewa Dairy in Fiji imports bulk milk to convert into dairy because local
produce is never enough. There are big logistical challenges to collect and distribute dairy in Vanuatu. Also, the
weather conditions in Vanuatu are not perfectly conducive to a long shelf life for milk.
Figure 13: Top 5 ‘Dairy products’ by import value
Dairy product Import Volume
(kg) Import Price
(vt/kg) Import Value
(vt)
Cheese 50,823 1,980 100,630,075
Milk 278,481 250 69,620,305
Cream 44,461 995 44,238,305
Butter 27,612 1,232 34,018,095
Eggs 1,293 950 1,228,488
0
100
200
300
400
500
600
700
800
900
Meat Dairy
Localproduce
Imports
53%
vt803 mn
82%
18%
47%
vt306 mn
* Eggs are being counted as dairy
15
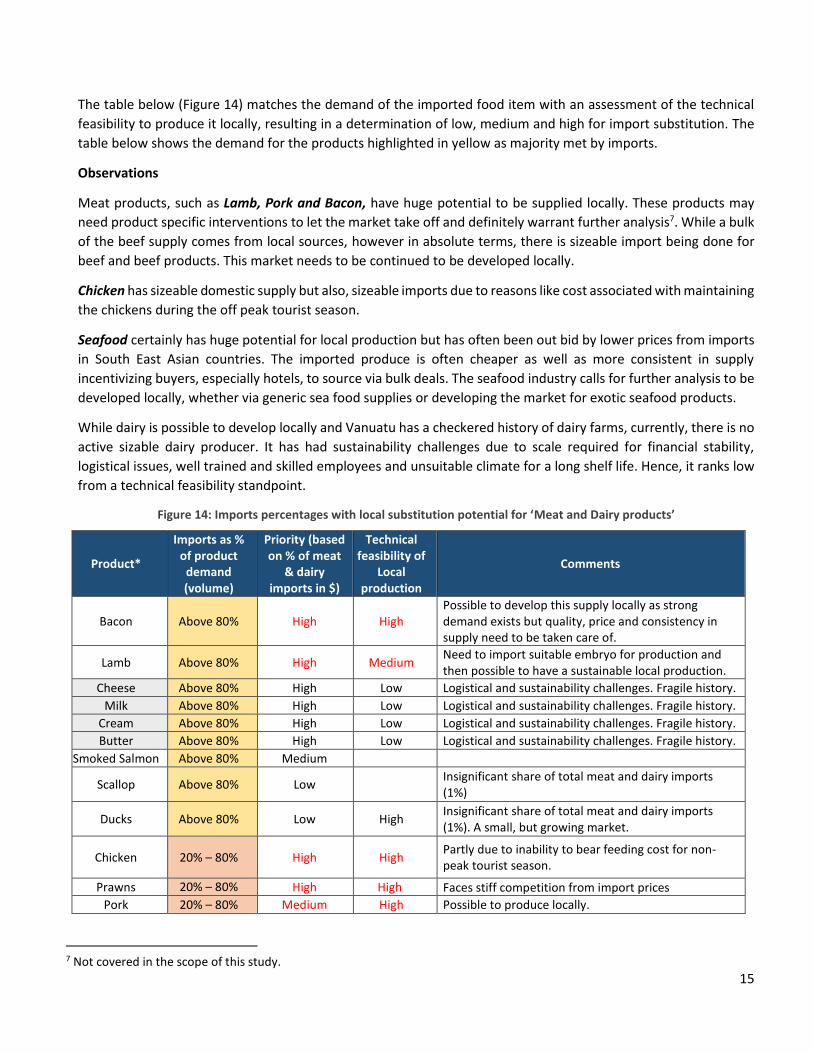
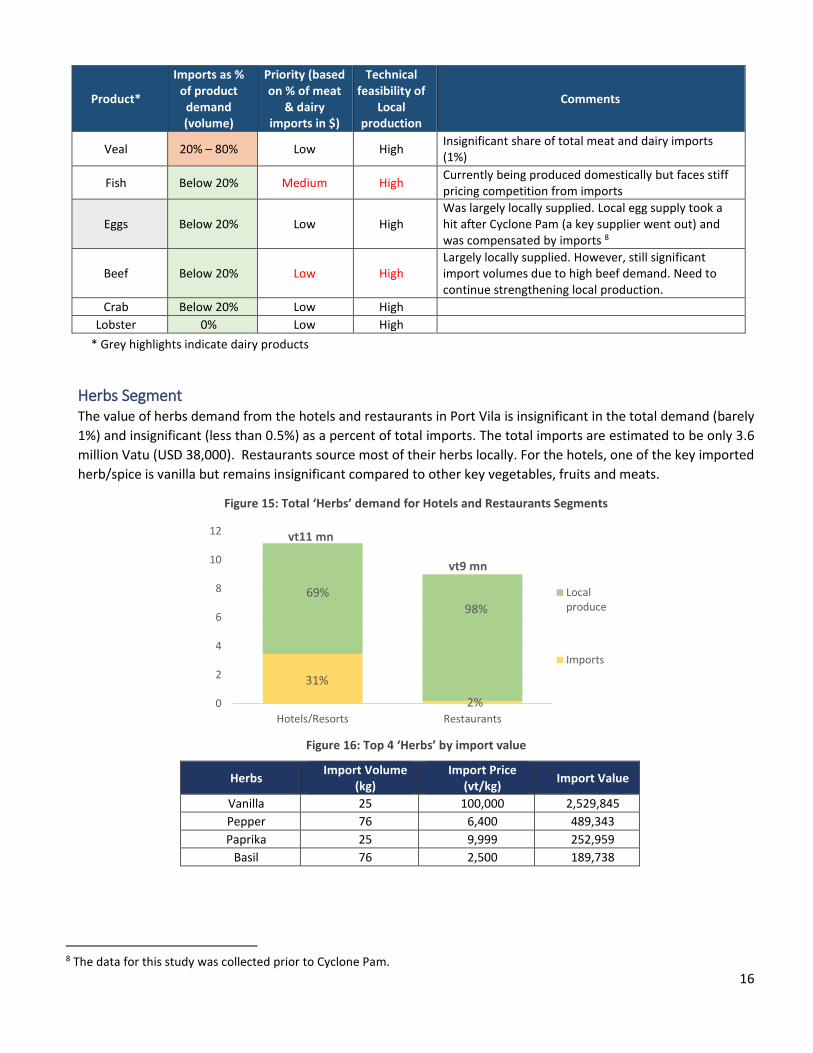
The table below (Figure 14) matches the demand of the imported food item with an assessment of the technical
feasibility to produce it locally, resulting in a determination of low, medium and high for import substitution. The
table below shows the demand for the products highlighted in yellow as majority met by imports.
Observations
Meat products, such as Lamb, Pork and Bacon, have huge potential to be supplied locally. These products may
need product specific interventions to let the market take off and definitely warrant further analysis7. While a bulk
of the beef supply comes from local sources, however in absolute terms, there is sizeable import being done for
beef and beef products. This market needs to be continued to be developed locally.
Chicken has sizeable domestic supply but also, sizeable imports due to reasons like cost associated with maintaining
the chickens during the off peak tourist season.
Seafood certainly has huge potential for local production but has often been out bid by lower prices from imports
in South East Asian countries. The imported produce is often cheaper as well as more consistent in supply
incentivizing buyers, especially hotels, to source via bulk deals. The seafood industry calls for further analysis to be
developed locally, whether via generic sea food supplies or developing the market for exotic seafood products.
While dairy is possible to develop locally and Vanuatu has a checkered history of dairy farms, currently, there is no
active sizable dairy producer. It has had sustainability challenges due to scale required for financial stability,
logistical issues, well trained and skilled employees and unsuitable climate for a long shelf life. Hence, it ranks low
from a technical feasibility standpoint.
Figure 14: Imports percentages with local substitution potential for ‘Meat and Dairy products’
Product*
Imports as % of product
demand (volume)
Priority (based on % of meat
& dairy imports in $)
Technical feasibility of
Local production
Comments
Bacon Above 80% High High Possible to develop this supply locally as strong demand exists but quality, price and consistency in supply need to be taken care of.
Lamb Above 80% High Medium Need to import suitable embryo for production and then possible to have a sustainable local production.
Cheese Above 80% High Low Logistical and sustainability challenges. Fragile history.
Milk Above 80% High Low Logistical and sustainability challenges. Fragile history.
Cream Above 80% High Low Logistical and sustainability challenges. Fragile history.
Butter Above 80% High Low Logistical and sustainability challenges. Fragile history.
Smoked Salmon Above 80% Medium
Scallop Above 80% Low Insignificant share of total meat and dairy imports (1%)
Ducks Above 80% Low High Insignificant share of total meat and dairy imports (1%). A small, but growing market.
Chicken 20% – 80% High High Partly due to inability to bear feeding cost for non-peak tourist season.
Prawns 20% – 80% High High Faces stiff competition from import prices
Pork 20% – 80% Medium High Possible to produce locally.
7 Not covered in the scope of this study.
16
Product*
Imports as % of product
demand (volume)
Priority (based on % of meat
& dairy imports in $)
Technical feasibility of
Local production
Comments
Veal 20% – 80% Low High Insignificant share of total meat and dairy imports (1%)
Fish Below 20% Medium High Currently being produced domestically but faces stiff pricing competition from imports
Eggs Below 20% Low High Was largely locally supplied. Local egg supply took a hit after Cyclone Pam (a key supplier went out) and was compensated by imports 8
Beef Below 20% Low High Largely locally supplied. However, still significant import volumes due to high beef demand. Need to continue strengthening local production.
Crab Below 20% Low High
Lobster 0% Low High
* Grey highlights indicate dairy products
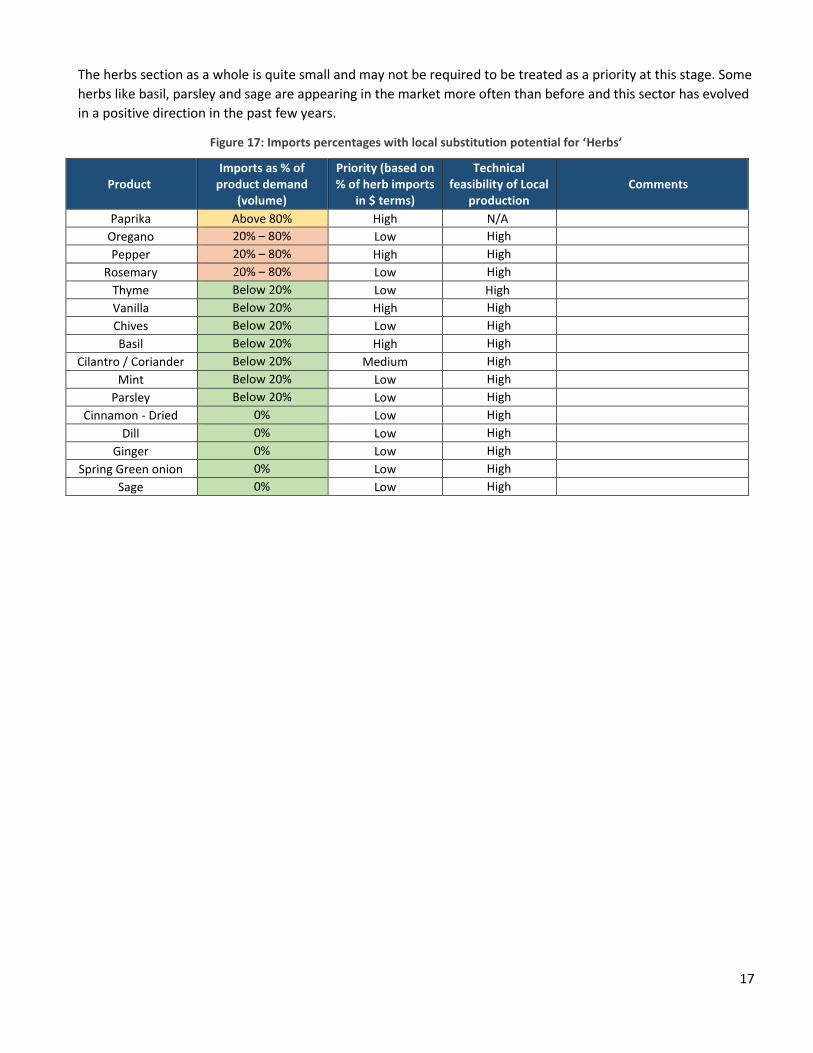
Herbs Segment The value of herbs demand from the hotels and restaurants in Port Vila is insignificant in the total demand (barely
1%) and insignificant (less than 0.5%) as a percent of total imports. The total imports are estimated to be only 3.6
million Vatu (USD 38,000). Restaurants source most of their herbs locally. For the hotels, one of the key imported
herb/spice is vanilla but remains insignificant compared to other key vegetables, fruits and meats.
Figure 15: Total ‘Herbs’ demand for Hotels and Restaurants Segments
Figure 16: Top 4 ‘Herbs’ by import value
Herbs Import Volume
(kg) Import Price
(vt/kg) Import Value
Vanilla 25 100,000 2,529,845
Pepper 76 6,400 489,343
Paprika 25 9,999 252,959
Basil 76 2,500 189,738
8 The data for this study was collected prior to Cyclone Pam.
0
2
4
6
8
10
12
Hotels/Resorts Restaurants
Localproduce
Imports
69%
vt11 mn
2%
98%
31%
vt9 mn
17
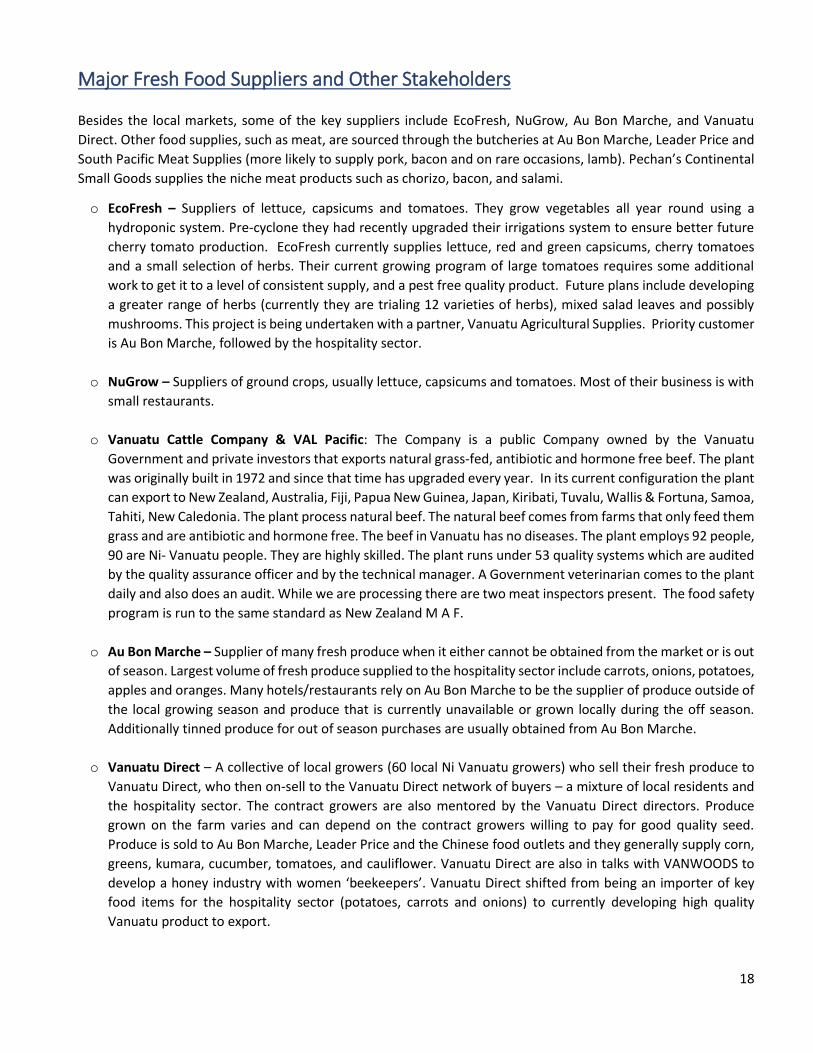
The herbs section as a whole is quite small and may not be required to be treated as a priority at this stage. Some
herbs like basil, parsley and sage are appearing in the market more often than before and this sector has evolved
in a positive direction in the past few years.
Figure 17: Imports percentages with local substitution potential for ‘Herbs’
Product Imports as % of
product demand (volume)
Priority (based on % of herb imports
in $ terms)
Technical feasibility of Local
production Comments
Paprika Above 80% High N/A
Oregano 20% – 80% Low High
Pepper 20% – 80% High High
Rosemary 20% – 80% Low High
Thyme Below 20% Low High
Vanilla Below 20% High High
Chives Below 20% Low High
Basil Below 20% High High
Cilantro / Coriander Below 20% Medium High
Mint Below 20% Low High
Parsley Below 20% Low High
Cinnamon - Dried 0% Low High
Dill 0% Low High
Ginger 0% Low High
Spring Green onion 0% Low High
Sage 0% Low High
18
Major Fresh Food Suppliers and Other Stakeholders
Besides the local markets, some of the key suppliers include EcoFresh, NuGrow, Au Bon Marche, and Vanuatu
Direct. Other food supplies, such as meat, are sourced through the butcheries at Au Bon Marche, Leader Price and
South Pacific Meat Supplies (more likely to supply pork, bacon and on rare occasions, lamb). Pechan’s Continental
Small Goods supplies the niche meat products such as chorizo, bacon, and salami.
o EcoFresh – Suppliers of lettuce, capsicums and tomatoes. They grow vegetables all year round using a
hydroponic system. Pre-cyclone they had recently upgraded their irrigations system to ensure better future
cherry tomato production. EcoFresh currently supplies lettuce, red and green capsicums, cherry tomatoes
and a small selection of herbs. Their current growing program of large tomatoes requires some additional
work to get it to a level of consistent supply, and a pest free quality product. Future plans include developing
a greater range of herbs (currently they are trialing 12 varieties of herbs), mixed salad leaves and possibly
mushrooms. This project is being undertaken with a partner, Vanuatu Agricultural Supplies. Priority customer
is Au Bon Marche, followed by the hospitality sector.
o NuGrow – Suppliers of ground crops, usually lettuce, capsicums and tomatoes. Most of their business is with
small restaurants.
o Vanuatu Cattle Company & VAL Pacific: The Company is a public Company owned by the Vanuatu
Government and private investors that exports natural grass-fed, antibiotic and hormone free beef. The plant
was originally built in 1972 and since that time has upgraded every year. In its current configuration the plant
can export to New Zealand, Australia, Fiji, Papua New Guinea, Japan, Kiribati, Tuvalu, Wallis & Fortuna, Samoa,
Tahiti, New Caledonia. The plant process natural beef. The natural beef comes from farms that only feed them
grass and are antibiotic and hormone free. The beef in Vanuatu has no diseases. The plant employs 92 people,
90 are Ni- Vanuatu people. They are highly skilled. The plant runs under 53 quality systems which are audited
by the quality assurance officer and by the technical manager. A Government veterinarian comes to the plant
daily and also does an audit. While we are processing there are two meat inspectors present. The food safety
program is run to the same standard as New Zealand M A F.
o Au Bon Marche – Supplier of many fresh produce when it either cannot be obtained from the market or is out
of season. Largest volume of fresh produce supplied to the hospitality sector include carrots, onions, potatoes,
apples and oranges. Many hotels/restaurants rely on Au Bon Marche to be the supplier of produce outside of
the local growing season and produce that is currently unavailable or grown locally during the off season.
Additionally tinned produce for out of season purchases are usually obtained from Au Bon Marche.
o Vanuatu Direct – A collective of local growers (60 local Ni Vanuatu growers) who sell their fresh produce to
Vanuatu Direct, who then on-sell to the Vanuatu Direct network of buyers – a mixture of local residents and
the hospitality sector. The contract growers are also mentored by the Vanuatu Direct directors. Produce
grown on the farm varies and can depend on the contract growers willing to pay for good quality seed.
Produce is sold to Au Bon Marche, Leader Price and the Chinese food outlets and they generally supply corn,
greens, kumara, cucumber, tomatoes, and cauliflower. Vanuatu Direct are also in talks with VANWOODS to
develop a honey industry with women ‘beekeepers’. Vanuatu Direct shifted from being an importer of key
food items for the hospitality sector (potatoes, carrots and onions) to currently developing high quality
Vanuatu product to export.
19
o Traverso – Supplier of fresh produce from Ecofresh and local growers and some imported foods (i.e. onions,
carrots, bacon, and processed meats). Traverso does not have any regular orders to supply the hospitality
sector, though, they supply regular food (meat) to the Chinese food outlets. Meat and specialty meats are
their principal product line. Usually, Traverso is a last resort source of supply due to the small quantities held
by the supermarket and they recognize the same. Traverso limits what it can import due to restrictions on
storage, consequently they are not importing directly for any particular hotel or restaurant. The core business
used to be the hospitality sector but that has changed due to a business decision not to allow a credit account
system for the sector.
o Vate Ocean Gardens - Vate Ocean Gardens was developed in collaboration with Vate Copravi Prawns Ltd
based upon diversification and competition issues. This company originally started as a prawn farm to supply
the domestic market, however with competition issues, they diversified into fish farming. Currently, they are
breeding barramundi (4 species), Red Talapia and Basa fish. Presently, all fish is harvested for the Fiji market
due to importation competition in Vanuatu.
Few respondents import directly (depending on whether they have their own storage for meats and other products
or whether they require specialty products like sauces). It has been reported that a ‘wholesale price’ in Vanuatu is
practically the same as a ‘retail price’ for goods, contrary to what generally happens in overseas wholesale market
distribution.
Some other key stakeholders in the market are:
o Vanuatu Agricultural Supplies (VAS) – Some of their key focus of work include: (1) Ground grown herbs and
a nursery for hydroponic salad leaves that can be harvested 3-4 times per week. While they acknowledge that
in the beginning the volume will vary, they expect to pick 20-30 cartons a day. (2) On the project with EcoFresh
described above, the key challenges as per VAS is the requirement for blemish free quality product for the
supermarket and restaurants and consistent supply. This consequently requires a large investment of capital
to ensure year-round supply. (3) VAS also assists Ni Vanuatu growers with crop husbandry advice and
managing crop disease. They are seeing a growing trend in local growers developing non-traditional crops
such as watermelon, and this may be because of better financial returns on the crop.
o Farm Support Association (FSA) - The Farm Support Association (FSA) provides extension support to assist
small-holders to establish farming systems (chicken, goats and pigs) and vegetables, fruit and root crop
gardens. In terms of fresh produce, the FSA works with local Ni Vanuatu growers to run trials of fruit and
vegetables crops and providing advice in aspects of nursery techniques, disease and pest prevention and
provision of seeds. Most of their work in this area is in Malekula and Pamma and about 10 farmers on Efate.
The FSA is developing a work program to increase the numbers of farmers they are working with on Efate.
Currently they are working with farmers to grow a range of fresh produce and are currently surveying them
to see what produce they are currently growing. In Tanna, the FSA have an additional scope of work with
about 50 farmers mostly growing potatoes. The work program is due to harvest their second crop of potatoes
from a ½ hectare field in October 2015. The FSA is also trying to raise awareness of growers around quality
issues, extension of the growing season, as well as management and packaging of the produce during
transport to market.
20
Scope and Methodology Sample Set: The survey targeted hotels/resorts with restaurants and stand-alone restaurants in Port Vila, Efate.
Efate receives 97% of all visitors to Vanuatu9. IFC compiled a list of 40 hotels/resorts with restaurants and 44
independent restaurants in Port Vila from TripAdvisor listings. A sample of these organizations were surveyed,
including 15 hotels and 10 restaurants10 in 2013 and 2014.
Extrapolation to represent the market: Analysis in this report is based on the inputs received from surveyed hotels
and restaurants and extrapolated to represent the whole market. As per scope of the report, any reference to total
demand or imports that may be mentioned in this report refers to the demand or imports by the hotels and
restaurants in Port Vila unless specifically mentioned otherwise. Extrapolation is based on the principles below:
o Hotels: 15 hotels with an estimated room capacity of 841 were surveyed out of a total of 40 hotels/restaurants
with a total room capacity of 118211. This represents a coverage of 71% of the market as a part of the survey.
Assuming survey responses reflected 71% of the hotels demand by product and in aggregate, we extrapolated
it on a pro-rata basis to represent 100% of the market in the hotels segment.
o Restaurants: The total of 44 restaurants were segregated into a list of ‘Top 30’ restaurants and ‘the rest’ based
on TripAdvisor review ratings. Based on the average customers served by restaurants per day, the ‘Top 30’
restaurants averaged 54 customer servings per day with the rest averaging 37 customer servings per day.
Multiplying the number of restaurants by the number of customers served results in a total of 2,138 customers
served per day by the market in Port Vila. Nine restaurants from the Top 30 and one from the rest of the
restaurants category were surveyed, resulting in a total of 496 customers served per day by the surveyed
restaurants. This represents a coverage of 23% of the market as a part of the survey. Assuming survey
responses reflected 23% of the restaurants demand by product and in aggregate, we extrapolated it on a pro-
rata basis to represent 100% of the market in the restaurants segment.
Quantity Demanded: Businesses provided information on the quantity procured locally and imported from
overseas by product across a range of vegetables (30 varieties), fruits (38 varieties), meat and dairy products (18
varieties) and herbs (18 varieties) during the high and low tourist seasons. We have presented a volume based
analysis at individual product level since aggregation is impossible due to the variance of volume units across
products.
Prices: A standard price set collected around February/March, 2014 was used across the data set.
Aggregation: The quantity demanded and the price data has been multiplied to arrive at the dollar value for each
product. The figures have been aggregated and extrapolated to represent the whole market on the basis of
principles explained above. Analysis has been presented at an aggregate and at a product level as well.
Product Level analysis: The report includes a product level analysis that results in recommendations for import substitution. For this analysis, two key metrics are used:
(1) Priority – This metric represents impact on imports and the importance of local substitution in the product category. This is based on specific product imports as a percentage of total imports in the product’s category (in value terms). High refers to products with more than 5% share, Medium refers to 1%-5% share and Low refers to 0% - 1% share.
9 Any reference to hotels in this report includes resorts segment. 10 An additional 9 restaurants gave on average plates per day and plate costs only. 11 Based on information from TripAdvisor.

21
(2) Technical Feasibility of Local Production – This represents the possibility of producing the product locally in Vanuatu and is based on inputs from the agricultural experts and stakeholders.
The products with a ‘High’ rating on both measures could be further assessed for import substitution opportunities. Exchange Rate: The report presents the impact/market size in both Vanuatu Vatu US dollar terms. The exchange
rate used is the average exchange rate for USD and Vatu in 2014, being 1 USD = 94.95 Vatu (Source:
www.oanda.com)
22
Challenges related to data aggregation
o Timing of the survey for the hotels and restaurants: The hotels survey (2013) and restaurants survey (2014)
were completed with a gap of about one year and any differences in the patterns during this year in demand
have not been accounted. The price set used is standard across both categories of survey to avoid
discrepancies due to price fluctuations.
o Setting time with the relevant person: The relevant person varied from business to business – in some cases,
it was the restaurant owner, while sometimes it was a junior delegate. Sometimes the quality of the
discussions and responses varied by organization.
o Subjective interpretation of the survey questions and inconsistent data: At times, the respondents required
that the survey be left with them or sent it via email, rather than collecting the data in an interview. In these
cases, the responses were sometimes inconsistent with discussions, incomplete and subject to respondents
interpretation of the survey questions. Manual adjustments to the data have been made in some cases. In
cases where the low season data has not been provided by the respondent, a 25% reduction has been
assumed in purchasing/demand based on overall discussions with the stakeholders.
o Definitions of the high/low seasons: While it was clearly communicated to the respondents that the ‘high’
and ‘low’ season responses must be based on tourist season, some respondents may have misinterpreted
these to be the produce growing season. No amends have been made in this case.
o Price data: The price data was collected in early 2014, in pre cyclone Vanuatu. This may be slightly dated and
have meaningfully changed after the cyclone. Also, this data may be impacted by the month/season of price
collection depending on which products were out of season at that time and may have been more expensive.
o Supplier side interviews: The interviews have focused on the suppliers of fresh goods being generally green
vegetables, rather than suppliers of all goods such as meat and dairy produce. This is due to the value of
understanding this aspect better in the short time frame.
23
Annexes
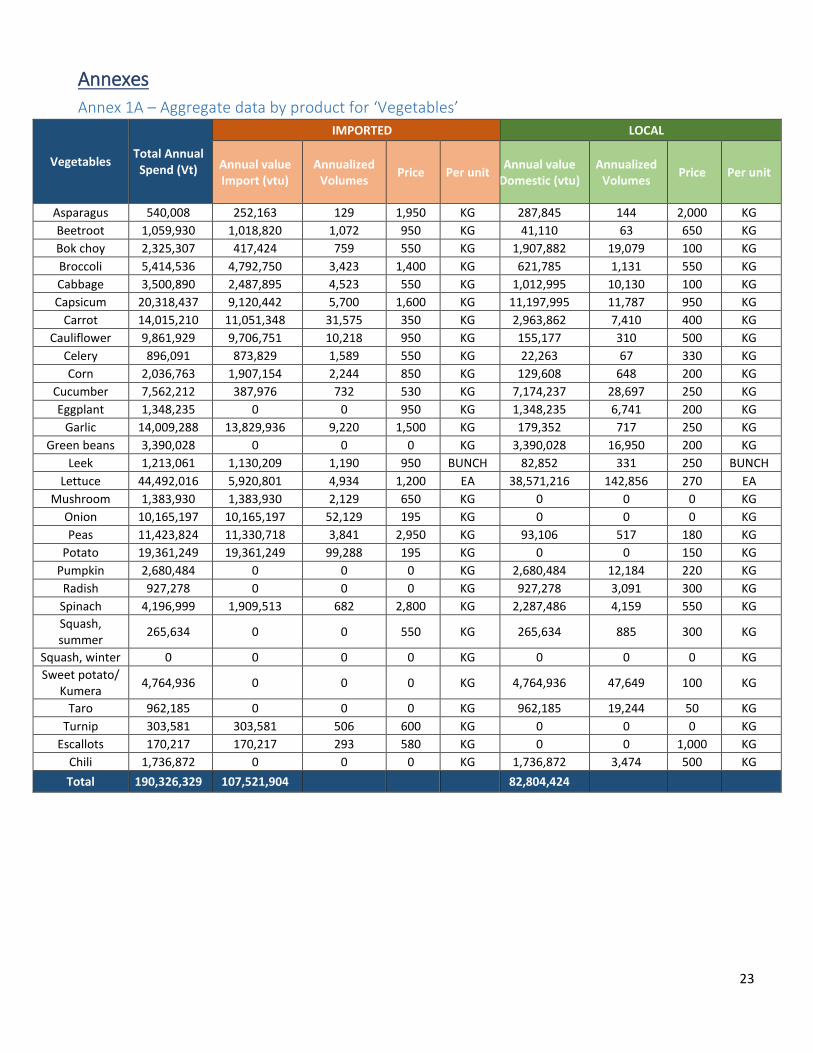
Annex 1A – Aggregate data by product for ‘Vegetables’
Vegetables Total Annual
Spend (Vt)
IMPORTED LOCAL
Annual value Import (vtu)
Annualized Volumes
Price Per unit Annual value
Domestic (vtu) Annualized
Volumes Price Per unit
Asparagus 540,008 252,163 129 1,950 KG 287,845 144 2,000 KG
Beetroot 1,059,930 1,018,820 1,072 950 KG 41,110 63 650 KG
Bok choy 2,325,307 417,424 759 550 KG 1,907,882 19,079 100 KG
Broccoli 5,414,536 4,792,750 3,423 1,400 KG 621,785 1,131 550 KG
Cabbage 3,500,890 2,487,895 4,523 550 KG 1,012,995 10,130 100 KG
Capsicum 20,318,437 9,120,442 5,700 1,600 KG 11,197,995 11,787 950 KG
Carrot 14,015,210 11,051,348 31,575 350 KG 2,963,862 7,410 400 KG
Cauliflower 9,861,929 9,706,751 10,218 950 KG 155,177 310 500 KG
Celery 896,091 873,829 1,589 550 KG 22,263 67 330 KG
Corn 2,036,763 1,907,154 2,244 850 KG 129,608 648 200 KG
Cucumber 7,562,212 387,976 732 530 KG 7,174,237 28,697 250 KG
Eggplant 1,348,235 0 0 950 KG 1,348,235 6,741 200 KG
Garlic 14,009,288 13,829,936 9,220 1,500 KG 179,352 717 250 KG
Green beans 3,390,028 0 0 0 KG 3,390,028 16,950 200 KG
Leek 1,213,061 1,130,209 1,190 950 BUNCH 82,852 331 250 BUNCH
Lettuce 44,492,016 5,920,801 4,934 1,200 EA 38,571,216 142,856 270 EA
Mushroom 1,383,930 1,383,930 2,129 650 KG 0 0 0 KG
Onion 10,165,197 10,165,197 52,129 195 KG 0 0 0 KG
Peas 11,423,824 11,330,718 3,841 2,950 KG 93,106 517 180 KG
Potato 19,361,249 19,361,249 99,288 195 KG 0 0 150 KG
Pumpkin 2,680,484 0 0 0 KG 2,680,484 12,184 220 KG
Radish 927,278 0 0 0 KG 927,278 3,091 300 KG
Spinach 4,196,999 1,909,513 682 2,800 KG 2,287,486 4,159 550 KG
Squash, summer
265,634 0 0 550 KG 265,634 885 300 KG
Squash, winter 0 0 0 0 KG 0 0 0 KG
Sweet potato/ Kumera
4,764,936 0 0 0 KG 4,764,936 47,649 100 KG
Taro 962,185 0 0 0 KG 962,185 19,244 50 KG
Turnip 303,581 303,581 506 600 KG 0 0 0 KG
Escallots 170,217 170,217 293 580 KG 0 0 1,000 KG
Chili 1,736,872 0 0 0 KG 1,736,872 3,474 500 KG
Total 190,326,329 107,521,904 82,804,424
24
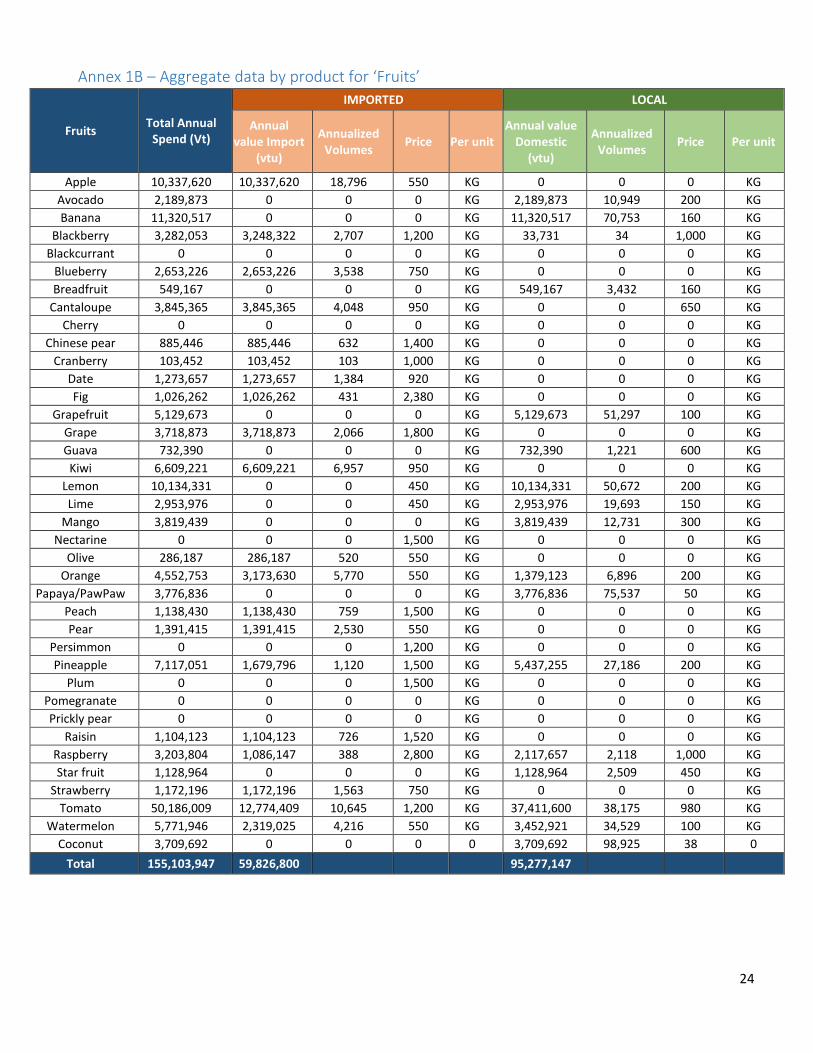
Annex 1B – Aggregate data by product for ‘Fruits’
Fruits Total Annual
Spend (Vt)
IMPORTED LOCAL
Annual value Import
(vtu)
Annualized Volumes
Price Per unit Annual value
Domestic (vtu)
Annualized Volumes
Price Per unit
Apple 10,337,620 10,337,620 18,796 550 KG 0 0 0 KG
Avocado 2,189,873 0 0 0 KG 2,189,873 10,949 200 KG
Banana 11,320,517 0 0 0 KG 11,320,517 70,753 160 KG
Blackberry 3,282,053 3,248,322 2,707 1,200 KG 33,731 34 1,000 KG
Blackcurrant 0 0 0 0 KG 0 0 0 KG
Blueberry 2,653,226 2,653,226 3,538 750 KG 0 0 0 KG
Breadfruit 549,167 0 0 0 KG 549,167 3,432 160 KG
Cantaloupe 3,845,365 3,845,365 4,048 950 KG 0 0 650 KG
Cherry 0 0 0 0 KG 0 0 0 KG
Chinese pear 885,446 885,446 632 1,400 KG 0 0 0 KG
Cranberry 103,452 103,452 103 1,000 KG 0 0 0 KG
Date 1,273,657 1,273,657 1,384 920 KG 0 0 0 KG
Fig 1,026,262 1,026,262 431 2,380 KG 0 0 0 KG
Grapefruit 5,129,673 0 0 0 KG 5,129,673 51,297 100 KG
Grape 3,718,873 3,718,873 2,066 1,800 KG 0 0 0 KG
Guava 732,390 0 0 0 KG 732,390 1,221 600 KG
Kiwi 6,609,221 6,609,221 6,957 950 KG 0 0 0 KG
Lemon 10,134,331 0 0 450 KG 10,134,331 50,672 200 KG
Lime 2,953,976 0 0 450 KG 2,953,976 19,693 150 KG
Mango 3,819,439 0 0 0 KG 3,819,439 12,731 300 KG
Nectarine 0 0 0 1,500 KG 0 0 0 KG
Olive 286,187 286,187 520 550 KG 0 0 0 KG
Orange 4,552,753 3,173,630 5,770 550 KG 1,379,123 6,896 200 KG
Papaya/PawPaw 3,776,836 0 0 0 KG 3,776,836 75,537 50 KG
Peach 1,138,430 1,138,430 759 1,500 KG 0 0 0 KG
Pear 1,391,415 1,391,415 2,530 550 KG 0 0 0 KG
Persimmon 0 0 0 1,200 KG 0 0 0 KG
Pineapple 7,117,051 1,679,796 1,120 1,500 KG 5,437,255 27,186 200 KG
Plum 0 0 0 1,500 KG 0 0 0 KG
Pomegranate 0 0 0 0 KG 0 0 0 KG
Prickly pear 0 0 0 0 KG 0 0 0 KG
Raisin 1,104,123 1,104,123 726 1,520 KG 0 0 0 KG
Raspberry 3,203,804 1,086,147 388 2,800 KG 2,117,657 2,118 1,000 KG
Star fruit 1,128,964 0 0 0 KG 1,128,964 2,509 450 KG
Strawberry 1,172,196 1,172,196 1,563 750 KG 0 0 0 KG
Tomato 50,186,009 12,774,409 10,645 1,200 KG 37,411,600 38,175 980 KG
Watermelon 5,771,946 2,319,025 4,216 550 KG 3,452,921 34,529 100 KG
Coconut 3,709,692 0 0 0 0 3,709,692 98,925 38 0
Total 155,103,947 59,826,800 95,277,147
25
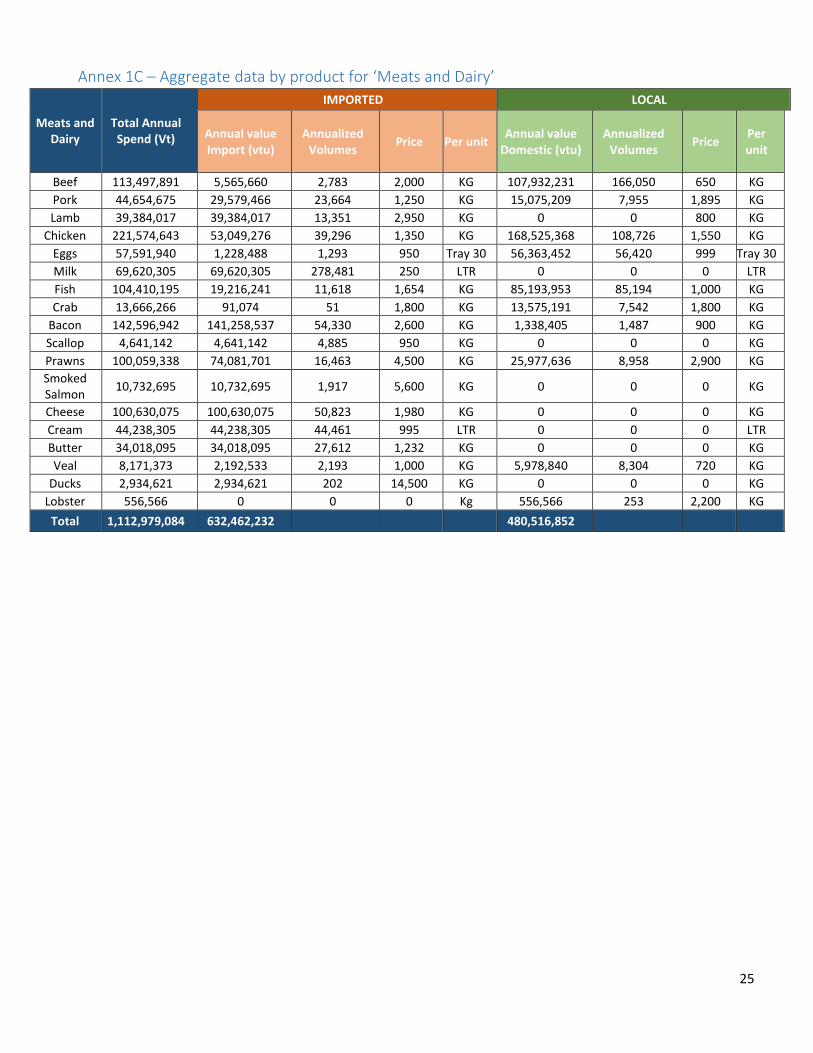
Annex 1C – Aggregate data by product for ‘Meats and Dairy’
Meats and Dairy
Total Annual Spend (Vt)
IMPORTED LOCAL
Annual value Import (vtu)
Annualized Volumes
Price Per unit Annual value
Domestic (vtu) Annualized
Volumes Price
Per unit
Beef 113,497,891 5,565,660 2,783 2,000 KG 107,932,231 166,050 650 KG
Pork 44,654,675 29,579,466 23,664 1,250 KG 15,075,209 7,955 1,895 KG
Lamb 39,384,017 39,384,017 13,351 2,950 KG 0 0 800 KG
Chicken 221,574,643 53,049,276 39,296 1,350 KG 168,525,368 108,726 1,550 KG
Eggs 57,591,940 1,228,488 1,293 950 Tray 30 56,363,452 56,420 999 Tray 30
Milk 69,620,305 69,620,305 278,481 250 LTR 0 0 0 LTR
Fish 104,410,195 19,216,241 11,618 1,654 KG 85,193,953 85,194 1,000 KG
Crab 13,666,266 91,074 51 1,800 KG 13,575,191 7,542 1,800 KG
Bacon 142,596,942 141,258,537 54,330 2,600 KG 1,338,405 1,487 900 KG
Scallop 4,641,142 4,641,142 4,885 950 KG 0 0 0 KG
Prawns 100,059,338 74,081,701 16,463 4,500 KG 25,977,636 8,958 2,900 KG
Smoked Salmon
10,732,695 10,732,695 1,917 5,600 KG 0 0 0 KG
Cheese 100,630,075 100,630,075 50,823 1,980 KG 0 0 0 KG
Cream 44,238,305 44,238,305 44,461 995 LTR 0 0 0 LTR
Butter 34,018,095 34,018,095 27,612 1,232 KG 0 0 0 KG
Veal 8,171,373 2,192,533 2,193 1,000 KG 5,978,840 8,304 720 KG
Ducks 2,934,621 2,934,621 202 14,500 KG 0 0 0 KG
Lobster 556,566 0 0 0 Kg 556,566 253 2,200 KG
Total 1,112,979,084 632,462,232 480,516,852
26
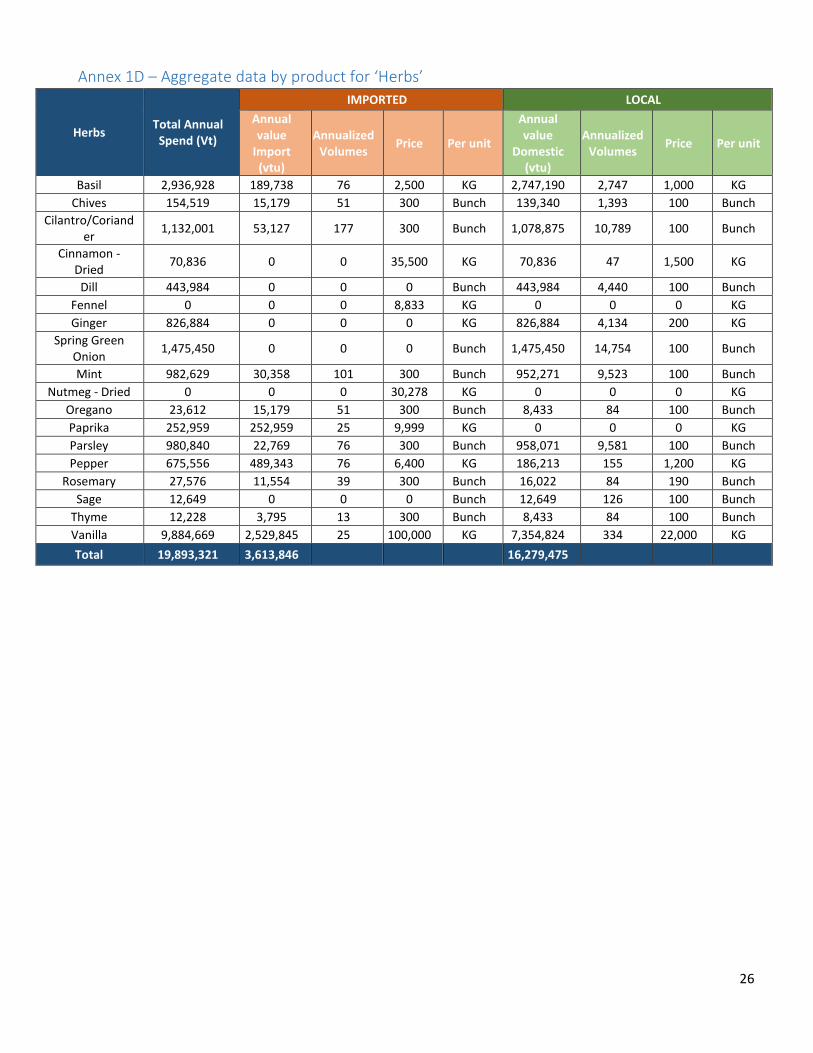
Annex 1D – Aggregate data by product for ‘Herbs’
Herbs Total Annual
Spend (Vt)
IMPORTED LOCAL
Annual value
Import (vtu)
Annualized Volumes
Price Per unit
Annual value
Domestic (vtu)
Annualized Volumes
Price Per unit
Basil 2,936,928 189,738 76 2,500 KG 2,747,190 2,747 1,000 KG
Chives 154,519 15,179 51 300 Bunch 139,340 1,393 100 Bunch
Cilantro/Coriander
1,132,001 53,127 177 300 Bunch 1,078,875 10,789 100 Bunch
Cinnamon - Dried
70,836 0 0 35,500 KG 70,836 47 1,500 KG
Dill 443,984 0 0 0 Bunch 443,984 4,440 100 Bunch
Fennel 0 0 0 8,833 KG 0 0 0 KG
Ginger 826,884 0 0 0 KG 826,884 4,134 200 KG
Spring Green Onion
1,475,450 0 0 0 Bunch 1,475,450 14,754 100 Bunch
Mint 982,629 30,358 101 300 Bunch 952,271 9,523 100 Bunch
Nutmeg - Dried 0 0 0 30,278 KG 0 0 0 KG
Oregano 23,612 15,179 51 300 Bunch 8,433 84 100 Bunch
Paprika 252,959 252,959 25 9,999 KG 0 0 0 KG
Parsley 980,840 22,769 76 300 Bunch 958,071 9,581 100 Bunch
Pepper 675,556 489,343 76 6,400 KG 186,213 155 1,200 KG
Rosemary 27,576 11,554 39 300 Bunch 16,022 84 190 Bunch
Sage 12,649 0 0 0 Bunch 12,649 126 100 Bunch
Thyme 12,228 3,795 13 300 Bunch 8,433 84 100 Bunch
Vanilla 9,884,669 2,529,845 25 100,000 KG 7,354,824 334 22,000 KG
Total 19,893,321 3,613,846 16,279,475
27
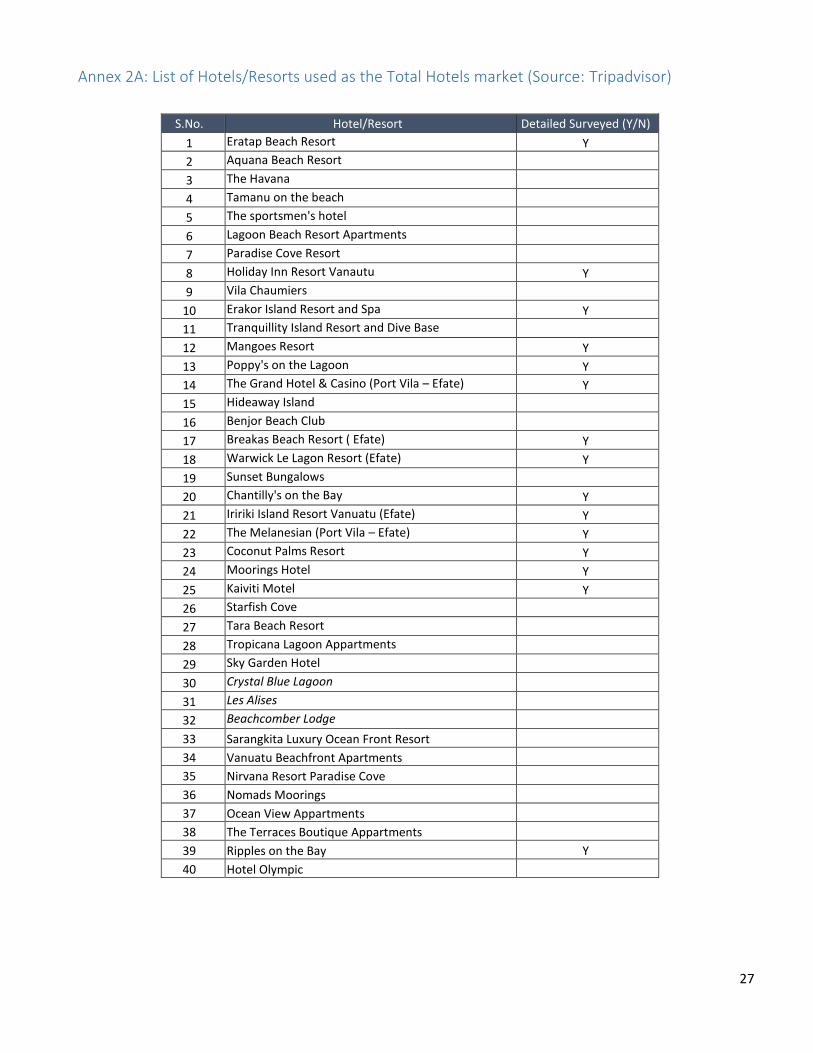
Annex 2A: List of Hotels/Resorts used as the Total Hotels market (Source: Tripadvisor)
S.No. Hotel/Resort Detailed Surveyed (Y/N)
1 Eratap Beach Resort Y
2 Aquana Beach Resort
3 The Havana
4 Tamanu on the beach
5 The sportsmen's hotel
6 Lagoon Beach Resort Apartments
7 Paradise Cove Resort
8 Holiday Inn Resort Vanautu Y
9 Vila Chaumiers
10 Erakor Island Resort and Spa Y
11 Tranquillity Island Resort and Dive Base
12 Mangoes Resort Y
13 Poppy's on the Lagoon Y
14 The Grand Hotel & Casino (Port Vila – Efate) Y
15 Hideaway Island
16 Benjor Beach Club
17 Breakas Beach Resort ( Efate) Y
18 Warwick Le Lagon Resort (Efate) Y
19 Sunset Bungalows
20 Chantilly's on the Bay Y
21 Iririki Island Resort Vanuatu (Efate) Y
22 The Melanesian (Port Vila – Efate) Y
23 Coconut Palms Resort Y
24 Moorings Hotel Y
25 Kaiviti Motel Y
26 Starfish Cove
27 Tara Beach Resort
28 Tropicana Lagoon Appartments
29 Sky Garden Hotel
30 Crystal Blue Lagoon
31 Les Alises
32 Beachcomber Lodge
33 Sarangkita Luxury Ocean Front Resort
34 Vanuatu Beachfront Apartments
35 Nirvana Resort Paradise Cove
36 Nomads Moorings
37 Ocean View Appartments
38 The Terraces Boutique Appartments
39 Ripples on the Bay Y
40 Hotel Olympic
28
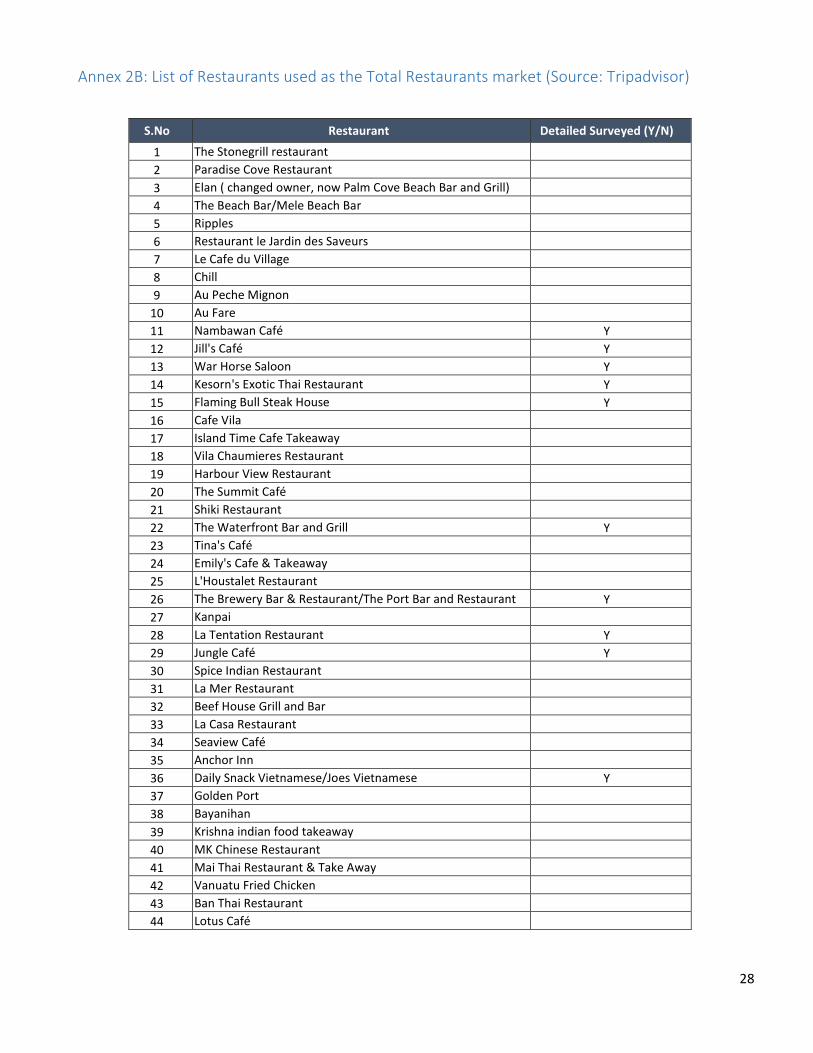
Annex 2B: List of Restaurants used as the Total Restaurants market (Source: Tripadvisor)
S.No Restaurant Detailed Surveyed (Y/N)
1 The Stonegrill restaurant
2 Paradise Cove Restaurant
3 Elan ( changed owner, now Palm Cove Beach Bar and Grill)
4 The Beach Bar/Mele Beach Bar
5 Ripples
6 Restaurant le Jardin des Saveurs
7 Le Cafe du Village
8 Chill
9 Au Peche Mignon
10 Au Fare
11 Nambawan Café Y
12 Jill's Café Y
13 War Horse Saloon Y
14 Kesorn's Exotic Thai Restaurant Y
15 Flaming Bull Steak House Y
16 Cafe Vila
17 Island Time Cafe Takeaway
18 Vila Chaumieres Restaurant
19 Harbour View Restaurant
20 The Summit Café
21 Shiki Restaurant
22 The Waterfront Bar and Grill Y
23 Tina's Café
24 Emily's Cafe & Takeaway
25 L'Houstalet Restaurant
26 The Brewery Bar & Restaurant/The Port Bar and Restaurant Y
27 Kanpai
28 La Tentation Restaurant Y
29 Jungle Café Y
30 Spice Indian Restaurant
31 La Mer Restaurant
32 Beef House Grill and Bar
33 La Casa Restaurant
34 Seaview Café
35 Anchor Inn
36 Daily Snack Vietnamese/Joes Vietnamese Y
37 Golden Port
38 Bayanihan
39 Krishna indian food takeaway
40 MK Chinese Restaurant
41 Mai Thai Restaurant & Take Away
42 Vanuatu Fried Chicken
43 Ban Thai Restaurant
44 Lotus Café
29
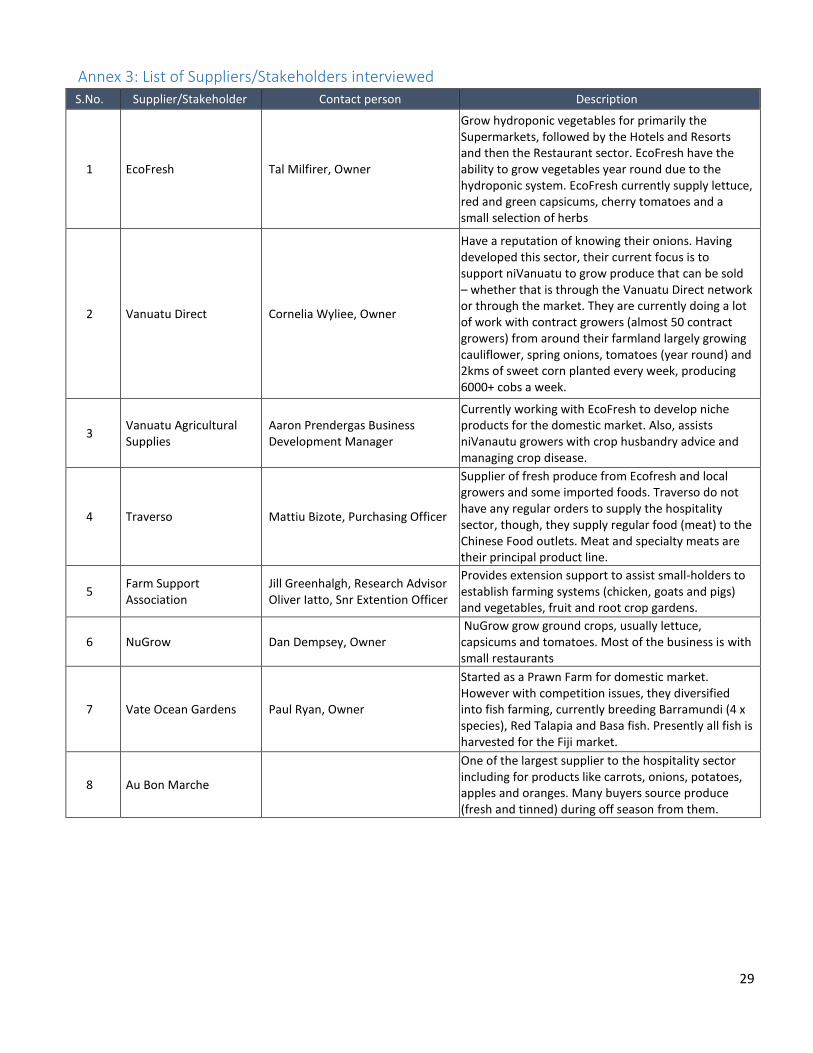
Annex 3: List of Suppliers/Stakeholders interviewed S.No. Supplier/Stakeholder Contact person Description
1 EcoFresh Tal Milfirer, Owner
Grow hydroponic vegetables for primarily the Supermarkets, followed by the Hotels and Resorts and then the Restaurant sector. EcoFresh have the ability to grow vegetables year round due to the hydroponic system. EcoFresh currently supply lettuce, red and green capsicums, cherry tomatoes and a small selection of herbs
2 Vanuatu Direct Cornelia Wyliee, Owner
Have a reputation of knowing their onions. Having developed this sector, their current focus is to support niVanuatu to grow produce that can be sold – whether that is through the Vanuatu Direct network or through the market. They are currently doing a lot of work with contract growers (almost 50 contract growers) from around their farmland largely growing cauliflower, spring onions, tomatoes (year round) and 2kms of sweet corn planted every week, producing 6000+ cobs a week.
3 Vanuatu Agricultural Supplies
Aaron Prendergas Business Development Manager
Currently working with EcoFresh to develop niche products for the domestic market. Also, assists niVanautu growers with crop husbandry advice and managing crop disease.
4 Traverso Mattiu Bizote, Purchasing Officer
Supplier of fresh produce from Ecofresh and local growers and some imported foods. Traverso do not have any regular orders to supply the hospitality sector, though, they supply regular food (meat) to the Chinese Food outlets. Meat and specialty meats are their principal product line.
5 Farm Support Association
Jill Greenhalgh, Research Advisor Oliver Iatto, Snr Extention Officer
Provides extension support to assist small-holders to establish farming systems (chicken, goats and pigs) and vegetables, fruit and root crop gardens.
6 NuGrow Dan Dempsey, Owner NuGrow grow ground crops, usually lettuce, capsicums and tomatoes. Most of the business is with small restaurants
7 Vate Ocean Gardens Paul Ryan, Owner
Started as a Prawn Farm for domestic market. However with competition issues, they diversified into fish farming, currently breeding Barramundi (4 x species), Red Talapia and Basa fish. Presently all fish is harvested for the Fiji market.
8 Au Bon Marche
One of the largest supplier to the hospitality sector including for products like carrots, onions, potatoes, apples and oranges. Many buyers source produce (fresh and tinned) during off season from them.
30
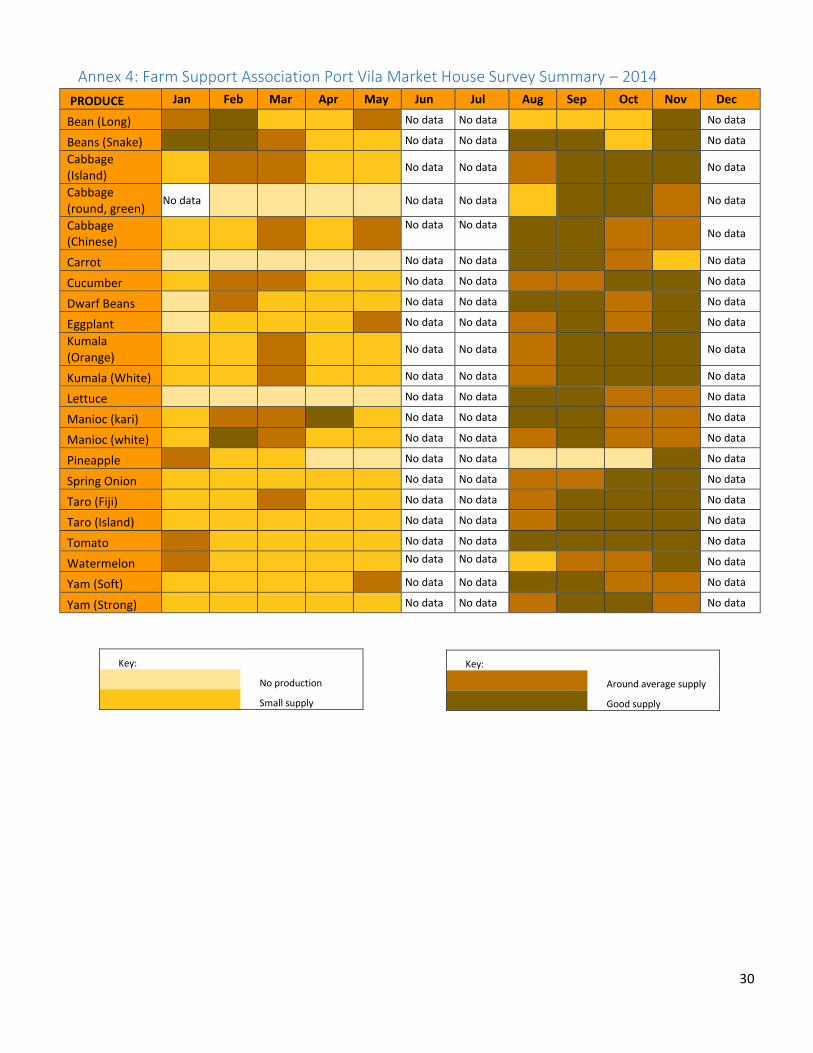
Annex 4: Farm Support Association Port Vila Market House Survey Summary – 2014
PRODUCE Jan Feb Mar Apr May Jun Jul Aug Sep Oct Nov Dec
Bean (Long) No data No data No data
Beans (Snake) No data No data No data
Cabbage (Island)
No data No data No data
Cabbage (round, green)
No data No data No data No data
Cabbage (Chinese)
No data No data
No data
Carrot No data No data No data
Cucumber No data No data No data
Dwarf Beans No data No data No data
Eggplant No data No data No data
Kumala (Orange)
No data No data No data
Kumala (White) No data No data No data
Lettuce No data No data No data
Manioc (kari) No data No data No data
Manioc (white) No data No data No data
Pineapple No data No data No data
Spring Onion No data No data No data
Taro (Fiji) No data No data No data
Taro (Island) No data No data No data
Tomato No data No data No data
Watermelon No data No data No data
Yam (Soft) No data No data No data
Yam (Strong) No data No data No data
Key:
No production
Small supply
Key:
Around average supply
Good supply