Embed Size (px)
Citation preview
Vanguard International Growth Fund
Semiannual Report | February 28, 2018
Contents
Please note: The opinions expressed in this report are just that—informed opinions. They should not be considered promisesor advice. Also, please keep in mind that the information and opinions cover the period through the date on the front of thisreport. Of course, the risks of investing in your fund are spelled out in the prospectus.
See the Glossary for definitions of investment terms used in this report.About the cover: Nautical images have been part of Vanguard’s rich heritage since its start in 1975. For anincoming ship, a lighthouse offers a beacon and safe path to shore. You can similarly depend on Vanguard to putyou first––and light the way––as you strive to meet your financial goals. Our client focus and low costs,stemming from our unique ownership structure, assure that your interests are paramount.
Vanguard’s Principles for Investing Success
We want to give you the best chance of investment success. Theseprinciples, grounded in Vanguard’s research and experience, can put you onthe right path.
Goals. Create clear, appropriate investment goals.
Balance. Develop a suitable asset allocation using broadly diversified funds.
Cost. Minimize cost.
Discipline. Maintain perspective and long-term discipline.
A single theme unites these principles: Focus on the things you can control.We believe there is no wiser course for any investor.
Your Fund’s Performance at a Glance. . . . . . . . . . . . . . . . . . 1
CEO’s Perspective. . . . . . . . . . . . . . . . . . . . . . . . . . . . . . . . . 2
Advisors’ Report. . . . . . . . . . . . . . . . . . . . . . . . . . . . . . . . . . . 5
Results of Proxy Voting. . . . . . . . . . . . . . . . . . . . . . . . . . . . . 9
Fund Profile. . . . . . . . . . . . . . . . . . . . . . . . . . . . . . . . . . . . . .11
Performance Summary. . . . . . . . . . . . . . . . . . . . . . . . . . . . .13
Financial Statements. . . . . . . . . . . . . . . . . . . . . . . . . . . . . . 14
About Your Fund’s Expenses. . . . . . . . . . . . . . . . . . . . . . . . 34
Trustees Approve Advisory Arrangements. . . . . . . . . . . . . .36
Glossary. . . . . . . . . . . . . . . . . . . . . . . . . . . . . . . . . . . . . . . . 38
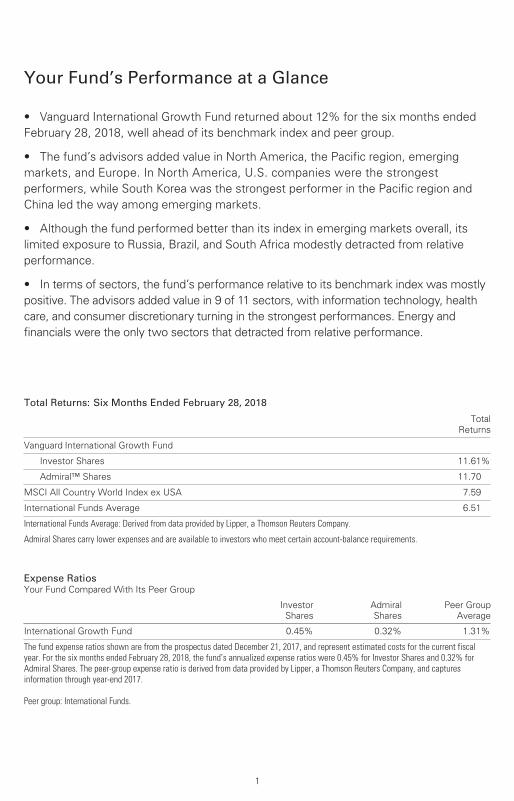
Your Fund’s Performance at a Glance
1
Total Returns: Six Months Ended February 28, 2018
TotalReturns
Vanguard International Growth Fund
Investor Shares 11.61%
Admiral™ Shares 11.70
MSCI All Country World Index ex USA 7.59
International Funds Average 6.51
International Funds Average: Derived from data provided by Lipper, a Thomson Reuters Company.
Admiral Shares carry lower expenses and are available to investors who meet certain account-balance requirements.
Expense RatiosYour Fund Compared With Its Peer Group
Investor
Shares
Admiral
Shares
Peer Group
Average
International Growth Fund 0.45% 0.32% 1.31%
The fund expense ratios shown are from the prospectus dated December 21, 2017, and represent estimated costs for the current fiscalyear. For the six months ended February 28, 2018, the fund’s annualized expense ratios were 0.45% for Investor Shares and 0.32% forAdmiral Shares. The peer-group expense ratio is derived from data provided by Lipper, a Thomson Reuters Company, and capturesinformation through year-end 2017.
Peer group: International Funds.
• Vanguard International Growth Fund returned about 12% for the six months ended
February 28, 2018, well ahead of its benchmark index and peer group.
• The fund’s advisors added value in North America, the Pacific region, emerging
markets, and Europe. In North America, U.S. companies were the strongest
performers, while South Korea was the strongest performer in the Pacific region and
China led the way among emerging markets.
• Although the fund performed better than its index in emerging markets overall, its
limited exposure to Russia, Brazil, and South Africa modestly detracted from relative
performance.
• In terms of sectors, the fund’s performance relative to its benchmark index was mostly
positive. The advisors added value in 9 of 11 sectors, with information technology, health
care, and consumer discretionary turning in the strongest performances. Energy and
financials were the only two sectors that detracted from relative performance.
Dear Shareholder,
As I begin my tenure as Vanguard’s
fourth chief executive, I’ve been reflecting
on both the past and the future of the
company where I have spent my entire
professional career.
I feel extremely fortunate to have the
chance to lead a company filled with
people who come to work every day
passionate about Vanguard’s core
purpose: to take a stand for all investors,
to treat them fairly, and to give them the
best chance for investment success.
Making a real difference
When I joined Vanguard in 1991, I found a
mission-driven team focused on improving
lives—helping people retire more com-
fortably, put their children through college,
and achieve financial security. I found a
company with purpose in an industry ripe
for improvement.
It was clear, even early in my career,
that the cards were stacked against most
investors. Hidden fees, performance-
chasing, and poor advice were relentlessly
eroding investors’ dreams.
We knew Vanguard could be different
and, as a result, could make a real
difference. Over the past 25 years, for
example, Vanguard has lowered our funds’
asset-weighted average expense ratio
CEO’s Perspective
Tim Buckley
President and Chief Executive Officer
2
from 0.31% to 0.12%. And over the past
decade, 94% of our funds have beaten the
average annual return of their peers.1
Focused on your success
Vanguard is built for Vanguard investors—
as a client-owned company, we focus
solely on you, our fund shareholders.
Everything we do is designed to give our
clients the best chance for investment
success. In my role as CEO, I intend to
keep this priority front and center. We’re
proud of what we’ve achieved, but we’re
even more excited about what’s to come.
As I write this, we’ve experienced a
period of pronounced market volatility.
Strong economic growth and budding
signs of inflation have raised concerns
about a more aggressive Federal Reserve.
Although volatility can test investors’
nerves, we sometimes think of this as
“Vanguard weather”—a time when having
a disciplined, low-cost, and long-term
approach to investment management
serves investors well.
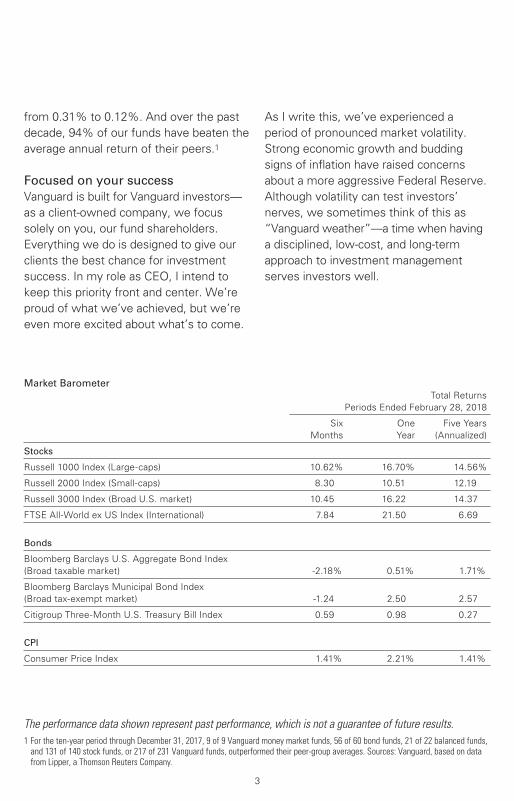
Market Barometer
Total Returns
Periods Ended February 28, 2018
Six One Five Years
Months Year (Annualized)
Stocks
Russell 1000 Index (Large-caps) 10.62% 16.70% 14.56%
Russell 2000 Index (Small-caps) 8.30 10.51 12.19
Russell 3000 Index (Broad U.S. market) 10.45 16.22 14.37
FTSE All-World ex US Index (International) 7.84 21.50 6.69
Bonds
Bloomberg Barclays U.S. Aggregate Bond Index
(Broad taxable market) -2.18% 0.51% 1.71%
Bloomberg Barclays Municipal Bond Index
(Broad tax-exempt market) -1.24 2.50 2.57
Citigroup Three-Month U.S. Treasury Bill Index 0.59 0.98 0.27
CPI
Consumer Price Index 1.41% 2.21% 1.41%
The performance data shown represent past performance, which is not a guarantee of future results.
1 For the ten-year period through December 31, 2017, 9 of 9 Vanguard money market funds, 56 of 60 bond funds, 21 of 22 balanced funds, and 131 of 140 stock funds, or 217 of 231 Vanguard funds, outperformed their peer-group averages. Sources: Vanguard, based on data from Lipper, a Thomson Reuters Company.
3

Steady, time-tested guidance
Our guidance for investors, as always, is
to stay the course, tune out the hyperbolic
headlines, and focus on your goals and
what you can control, such as costs and
how much you save. This time-tested
advice has served our clients well over
the decades.
Regardless of how the markets perform
in the short term, I’m incredibly optimistic
about the future for our investors. We have
a dedicated team serving you, and we will
never stop striving to make Vanguard the
best place for you to invest through our
high-quality funds and services, advice
and guidance to help you meet your
financial goals, and an experience that
makes you feel good about entrusting
us with your hard-earned savings.
Thank you for your continued loyalty.
Sincerely,
Mortimer J. Buckley
President and Chief Executive Officer
March 19, 2018
4
5
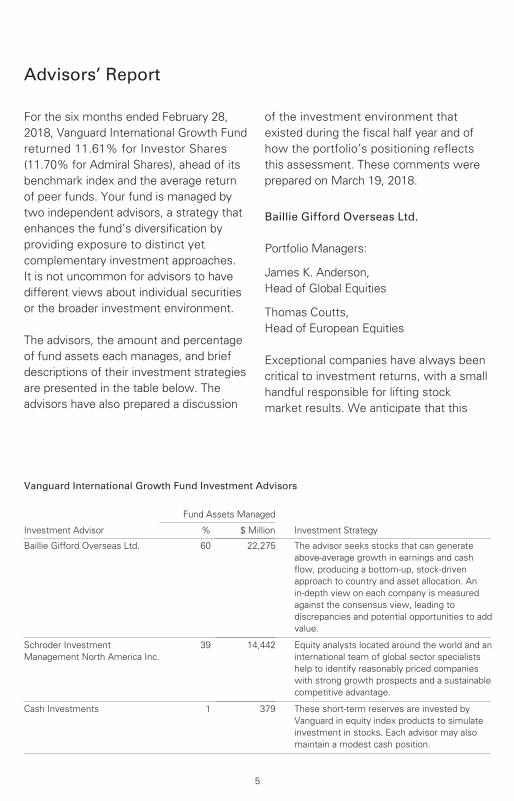
Advisors’ Report
Vanguard International Growth Fund Investment Advisors
Fund Assets Managed
Investment Advisor % $ Million Investment Strategy
Baillie Gifford Overseas Ltd. 60 22,275 The advisor seeks stocks that can generate
above-average growth in earnings and cash
flow, producing a bottom-up, stock-driven
approach to country and asset allocation. An
in-depth view on each company is measured
against the consensus view, leading to
discrepancies and potential opportunities to add
value.
Schroder Investment
Management North America Inc.
39 14,442 Equity analysts located around the world and an
international team of global sector specialists
help to identify reasonably priced companies
with strong growth prospects and a sustainable
competitive advantage.
Cash Investments 1 379 These short-term reserves are invested by
Vanguard in equity index products to simulate
investment in stocks. Each advisor may also
maintain a modest cash position.
For the six months ended February 28,
2018, Vanguard International Growth Fund
returned 11.61% for Investor Shares
(11.70% for Admiral Shares), ahead of its
benchmark index and the average return
of peer funds. Your fund is managed by
two independent advisors, a strategy that
enhances the fund’s diversification by
providing exposure to distinct yet
complementary investment approaches.
It is not uncommon for advisors to have
different views about individual securities
or the broader investment environment.
The advisors, the amount and percentage
of fund assets each manages, and brief
descriptions of their investment strategies
are presented in the table below. The
advisors have also prepared a discussion
of the investment environment that
existed during the fiscal half year and of
how the portfolio’s positioning reflects
this assessment. These comments were
prepared on March 19, 2018.
Baillie Gifford Overseas Ltd.
Portfolio Managers:
James K. Anderson,
Head of Global Equities
Thomas Coutts,
Head of European Equities
Exceptional companies have always been
critical to investment returns, with a small
handful responsible for lifting stock
market results. We anticipate that this

6
concentration of returns will persist and
may even intensify. As investors, we aim
to identify and own substantial positions
in enough of the winners to generate
attractive returns for our clients. To
benefit fully, we must also avoid the
pitfalls of taking profits and rebalancing
into inferior opportunities. While many of
our holdings have risen substantially over
the period, we believe the potential for
further growth is great, so we have made
few changes to the portfolio.
How large can a successful company
become in the modern era? It is
increasingly apparent that the scale
advantages of large technology platforms
are intensifying, and are transferable
to adjacent business areas. It is highly
unusual for companies as large as Alibaba,
Amazon, and Tencent to report rapid and
accelerating growth. Their success
reflects the dynamics of a digitized and
interconnected global economy, and an
increasing advantage for companies that
can take a long-term view.
ASML, the Dutch supplier of lithography
equipment for the semiconductor industry,
is a good example of a company that thinks
in terms of decades rather than quarters.
Advancing Moore’s Law of computing
power is one of the most important
engineering challenges of our generation.
ASML continues to drive the technology
forward with its industry-leading chip-
making machines. It has fought its way
through the challenges of extreme
ultraviolet lithography and now believes
it has a clear path to develop this
technology until around 2030. This will
enable continued development in big data,
machine learning, the internet of things,
and artificial intelligence. Very few areas
of the economy will be unaffected by this
transformation.
The detractors over the period included
two long-term holdings, Inditex, the
Spanish clothing retailer, and Genmab,
a Danish biotechnology company. Inditex,
the owner of the Zara retail chain, has
faced some currency headwinds. We still
believe that this is a remarkable company
with a substantial opportunity to expand
its “fast fashion” model globally, both
offline and online. Genmab is engaged
in the development of antibody therapies
for cancer. It has one successful product,
Darzalex, on the market and others in
various stages of clinical trials. After a few
strong years, its share price has been
weaker in the past six months, but we
remain enthusiastic about the long-term
prospects for the company. We added to
both holdings over the period.
The only new purchases over the last six
months were Delivery Hero and Umicore.
Delivery Hero is a German food delivery
company that operates online takeaway
marketplaces in 42 countries in Europe, the
Middle East, Asia, and North Africa.
Umicore is a Belgian materials and
recycling company. We have also added to
Swedish bank Svenska Handelsbanken and
German meal box provider HelloFresh,
following its initial public offering in
November. These additions were partly

7
funded by the sale of holdings in NAVER,
the South Korean internet search platform,
and EXOR, the Italian holding company.
Schroder Investment Management North America Inc.
Portfolio Manager:
Simon Webber, CFA
International markets posted solid gains
over the six-month period, led by
generally supportive economic data and
improving corporate earnings growth.
Expectations of higher interest rates hurt
defensive sectors, while more cyclical
sectors led the market higher. The
information technology sector was
among the strongest-performing sectors
as a number of the largest companies
continued to post better-than-expected
earnings, accompanied by healthy
guidance. The energy sector also
performed well as oil prices were
supported by geopolitical tensions
and OPEC’s renewed commitment
to cutting production.
Our positions in information technology
particularly helped performance, as did
our zero-weight exposure to the poorly
performing utilities sector. Our holdings
in the consumer discretionary and health
care sectors were relative detractors.
Check Point Software was a notable
detractor amid softer revenue growth.
While Check Point continues to generate
a lot of cash and has strong products,
growth has slowed despite what
should be a healthy environment for
cybersecurity spending amid several
high-profile corporate attacks. We
attribute this to a number of factors,
including the competitive environment,
which remains difficult; the emergence
of “private label” security offerings from
public cloud service providers AWS and
Google Cloud; and a disappointing sales
force reorganization in the United States.
While the sales execution issues should
improve, the public cloud competition
could intensify, and we have reduced
the position to reflect the increased risk.
Umicore, a leading supplier of cathode
components for electric vehicle batteries,
was one of our strongest performers and
has been making significant investments
in capacity to bolster its long-term growth
and leadership position. The scale of the
investment in its cathode business will
consume most of its free cash flow over
the next three years, but as demand for
cathode materials is expected to remain
high over the next decade, we expect
Umicore’s capacity ramp-up to deliver
strong results over the long term.
We are moving into a new phase of the
business cycle where strong economic
growth increases the upside risks to
inflation and central banks become less
accommodative. We are generally
cautious toward companies that have
high debt or limited pricing power to
offset higher inflation.

8
After years of spending restraint,
improved corporate confidence and
higher manufacturing utilization warrant
a positive view on the capital spending
cycle. We retain active exposure in
areas likely to benefit, such as factory
automation, construction-related
products, and electrical infrastructure.
This view also supports our materials
exposure, which is focused more on
materials benefiting from structural
trends such as electrification of
automotive powertrains than on
traditional “bulk” commodities.
Consumer discretionary stocks are
well-represented in our portfolio.
The competitive landscape in content
and media consumption is changing
rapidly and represents a rich source
of opportunity—particularly for social
media, music, and gaming.
We believe that a period of disruption is
unfolding across many industries, and this
will be a powerful source of investment
performance. It remains critical for
businesses and investors to ensure
that they are on the right side of the
disruption. We are focused on identifying
businesses that are willing to invest for
the long term, for change, and to create
sustainable growth business models.

Results of Proxy Voting
At a special meeting of shareholders on November 15, 2017, fund shareholders approved the
following proposals:
Proposal 1—Elect trustees for the fund.*The individuals listed in the table below were elected as trustees for the fund. All trustees with the
exception of Ms. Mulligan, Ms. Raskin, and Mr. Buckley (each of whom already serves as a director
of The Vanguard Group, Inc.) served as trustees to the funds prior to the shareholder meeting.
Percentage
Trustee For Withheld For
Mortimer J. Buckley 1,040,401,220 33,553,324 96.9%
Emerson U. Fullwood 1,039,160,376 34,794,169 96.8%
Amy Gutmann 1,040,321,884 33,632,661 96.9%
JoAnn Heffernan Heisen 1,041,268,182 32,686,363 97.0%
F. Joseph Loughrey 1,040,201,842 33,752,703 96.9%
Mark Loughridge 1,039,909,454 34,045,090 96.8%
Scott C. Malpass 1,039,175,722 34,778,823 96.8%
F. William McNabb III 1,038,914,560 35,039,985 96.7%
Deanna Mulligan 1,041,175,691 32,778,854 96.9%
André F. Perold 1,028,804,958 45,149,587 95.8%
Sarah Bloom Raskin 1,040,743,960 33,210,585 96.9%
Peter F. Volanakis 1,039,529,631 34,424,914 96.8%
* Results are for all funds within the same trust.
Proposal 3—Approve a manager-of-managers arrangement with wholly owned subsidiaries of Vanguard.This arrangement enables Vanguard or the fund to enter into and materially amend investment
advisory arrangements with wholly owned subsidiaries of Vanguard, subject to the approval of the
fund’s board of trustees and any conditions imposed by the Securities and Exchange Commission
(SEC), while avoiding the costs and delays associated with obtaining future shareholder approval.
The ability of the fund to operate in this manner is contingent upon the SEC’s approval of a pending
application for an order of exemption.
Broker Percentage
Vanguard Fund For Abstain Against Non-Votes For
International Growth Fund 337,037,649 16,443,457 15,798,577 34,671,694 83.4%
9
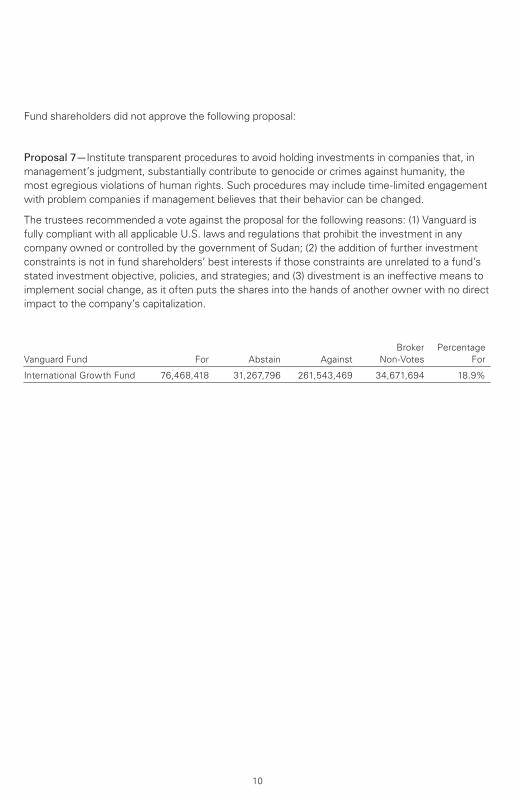
Fund shareholders did not approve the following proposal:
Proposal 7—Institute transparent procedures to avoid holding investments in companies that, in
management’s judgment, substantially contribute to genocide or crimes against humanity, the
most egregious violations of human rights. Such procedures may include time-limited engagement
with problem companies if management believes that their behavior can be changed.
The trustees recommended a vote against the proposal for the following reasons: (1) Vanguard is
fully compliant with all applicable U.S. laws and regulations that prohibit the investment in any
company owned or controlled by the government of Sudan; (2) the addition of further investment
constraints is not in fund shareholders’ best interests if those constraints are unrelated to a fund’s
stated investment objective, policies, and strategies; and (3) divestment is an ineffective means to
implement social change, as it often puts the shares into the hands of another owner with no direct
impact to the company’s capitalization.
Broker Percentage
Vanguard Fund For Abstain Against Non-Votes For
International Growth Fund 76,468,418 31,267,796 261,543,469 34,671,694 18.9%
10
International Growth Fund
Fund ProfileAs of February 28, 2018
1 The expense ratios shown are from the prospectus dated December 21, 2017, and represent estimated costs for the current fiscal year.For the six months ended February 28, 2018, the annualized expense ratios were 0.45% for Investor Shares and 0.32% for Admiral Shares.
11
Volatility Measures
MSCI AC
World
Index
ex USA
R-Squared 0.89
Beta 1.11
These measures show the degree and timing of the fund’s fluctuations compared with the indexes over 36 months.
Ten Largest Holdings (% of total net assets)
Alibaba Group Holding
Ltd.
Internet Software &
Services 5.2%
Tencent Holdings Ltd. Internet Software &
Services 4.8
ASML Holding NV Semiconductor
Equipment 3.6
Amazon.com Inc. Internet & Direct
Marketing Retail 3.3
Baidu Inc. Internet Software &
Services 3.3
AIA Group Ltd. Life & Health
Insurance 2.8
Industria de Diseno
Textil SA Apparel Retail 2.0
TAL Education Group Education Services 1.9
Celltrion Inc. Biotechnology 1.8
Illumina Inc. Life Sciences Tools
& Services 1.7
Top Ten 30.4%
The holdings listed exclude any temporary cash investments andequity index products.
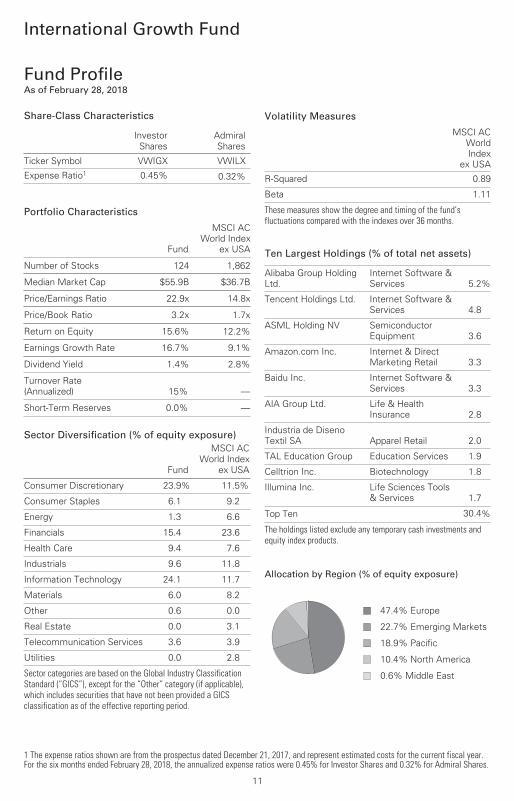
47.4% Europe
22.7% Emerging Markets
18.9% Pacific
10.4% North America
0.6% Middle East
Allocation by Region (% of equity exposure)
Portfolio Characteristics
Fund
MSCI AC
World Index
ex USA
Number of Stocks 124 1,862
Median Market Cap $55.9B $36.7B
Price/Earnings Ratio 22.9x 14.8x
Price/Book Ratio 3.2x 1.7x
Return on Equity 15.6% 12.2%
Earnings Growth Rate 16.7% 9.1%
Dividend Yield 1.4% 2.8%
Turnover Rate
(Annualized) 15% —
Short-Term Reserves 0.0% —
Share-Class Characteristics
InvestorShares
AdmiralShares
Ticker Symbol VWIGX VWILX
Expense Ratio1 0.45% 0.32%
Sector Diversification (% of equity exposure)
Fund
MSCI ACWorld Index
ex USA
Consumer Discretionary 23.9% 11.5%
Consumer Staples 6.1 9.2
Energy 1.3 6.6
Financials 15.4 23.6
Health Care 9.4 7.6
Industrials 9.6 11.8
Information Technology 24.1 11.7
Materials 6.0 8.2
Other 0.6 0.0
Real Estate 0.0 3.1
Telecommunication Services 3.6 3.9
Utilities 0.0 2.8
Sector categories are based on the Global Industry ClassificationStandard (“GICS”), except for the “Other” category (if applicable),which includes securities that have not been provided a GICSclassification as of the effective reporting period.

International Growth Fund
12
Market Diversification (% of equity exposure)
Fund
MSCI ACWorldIndex
ex USA
Europe
Germany 10.2% 6.6%
United Kingdom 7.3 11.6
France 6.5 7.4
Sweden 5.1 1.8
Spain 3.8 2.2
Netherlands 3.7 2.5
Switzerland 3.0 5.4
Italy 3.0 1.7
Denmark 2.5 1.3
Belgium 1.3 0.8
Other 1.0 1.9
Subtotal 47.4% 43.2%
Pacific
Japan 12.3% 16.9%
Hong Kong 3.8 2.5
South Korea 2.0 3.7
Other 0.8 5.7
Subtotal 18.9% 28.8%
Emerging Markets
China 18.0% 7.7%
India 2.1 2.1
Taiwan 1.2 2.9
Other 1.4 8.8
Subtotal 22.7% 21.5%
North America
United States 9.0% 0.0%
Canada 1.4 6.1
Subtotal 10.4% 6.1%
Middle East
Israel 0.6% 0.3%
All of the returns in this report represent past performance, which is not a guarantee of future results that may be achieved by the fund. (Current performance may be lower or higher thanthe performance data cited. For performance data current to the most recent month-end, visitour website at vanguard.com/performance.) Note, too, that both investment returns and principal value can fluctuate widely, so an investor’s shares, when sold, could be worth more or less than their original cost. The returns shown do not reflect taxes that a shareholder would pay
on fund distributions or on the sale of fund shares.
International Growth Fund
Performance Summary
See Financial Highlights for dividend and capital gains information.
13
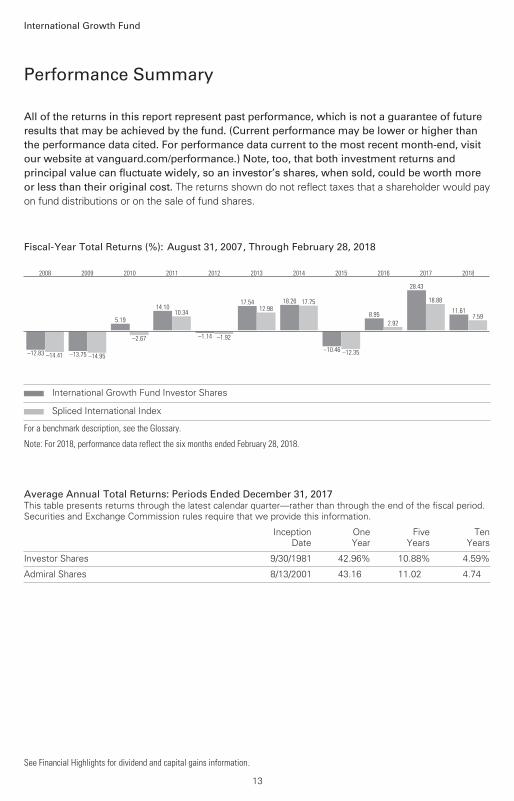
Fiscal-Year Total Returns (%): August 31, 2007, Through February 28, 2018
–12.83 –14.41
2008
–13.75 –14.95
2009
5.19
–2.67
2010
14.1010.34
2011
–1.14 –1.92
2012
17.5412.98
2013
18.26 17.75
2014
–10.46 –12.35
2015
8.95
2.92
2016
28.43
18.88
2017
11.617.59
2018
International Growth Fund Investor Shares
Spliced International Index
For a benchmark description, see the Glossary.
Note: For 2018, performance data reflect the six months ended February 28, 2018.
Average Annual Total Returns: Periods Ended December 31, 2017This table presents returns through the latest calendar quarter—rather than through the end of the fiscal period.Securities and Exchange Commission rules require that we provide this information.
InceptionDate
OneYear
FiveYears
TenYears
Investor Shares 9/30/1981 42.96% 10.88% 4.59%
Admiral Shares 8/13/2001 43.16 11.02 4.74

Market
Value•
Shares ($000)
Market
Value•
Shares ($000)
Common Stocks (98.2%)1
Australia (0.4%)
Brambles Ltd. 19,210,845 142,027
Belgium (1.3%) * Umicore SA 8,785,681 495,253
Brazil (0.6%)
Telefonica Brasil SA
Preference Shares 6,900,800 107,649
Raia Drogasil SA 4,326,949 103,599
211,248
Canada (1.4%)
Toronto-Dominion Bank 5,920,561 341,429* Nutrien Ltd. 3,573,661 175,592
517,021
China (17.6%) * Alibaba Group Holding
Ltd. ADR 10,430,571 1,941,546
Tencent Holdings Ltd. 32,265,800 1,765,214* Baidu Inc. ADR 4,801,703 1,211,662
TAL Education Group
ADR 18,485,132 697,999* Ctrip.com International
Ltd. ADR 9,001,376 413,883
New Oriental Education
& Technology Group
Inc. ADR 3,750,739 342,780
China Pacific Insurance
Group Co. Ltd. 31,290,000 152,214
6,525,298
Denmark (2.5%) * Genmab A/S 2,594,661 527,678
Novozymes A/S 2,821,811 145,025
Chr Hansen Holding A/S 1,658,818 137,783
Vestas Wind Systems
A/S 1,497,498 108,226
918,712
France (6.2%)
L’Oreal SA 2,749,942 591,294
Kering SA 1,108,608 520,237
Schneider Electric SE 4,831,845 418,771
Essilor International
Cie Generale
d’Optique SA 2,037,356 266,827
Vivendi SA 7,326,402 188,391
TOTAL SA 3,281,526 186,650
LVMH Moet Hennessy
Louis Vuitton SE 397,570 118,912
2,291,082
Germany (9.6%) *,2 Zalando SE 10,683,180 607,987
BASF SE 4,736,950 494,868
Bayerische Motoren
Werke AG 3,342,345 351,164
Bayer AG 2,386,501 278,496
SAP SE 2,355,195 245,788
Continental AG 776,572 212,196
Deutsche Telekom AG 12,368,193 198,716
HeidelbergCement AG 1,846,448 185,290*,2 Delivery Hero AG 3,461,555 151,100
adidas AG 647,010 143,355*,3 HelloFresh SE 8,076,894 131,946* Linde AG- Tender Line 560,638 124,405
Infineon Technologies
AG 4,380,041 118,536
GEA Group AG 1,804,242 85,288*,2 Rocket Internet SE 2,762,933 82,459* MorphoSys AG 664,989 66,185* AIXTRON SE 3,130,112 62,142* HelloFresh AG 2,476,051 36,567
3,576,488
Financial Statements (unaudited)
Statement of Net AssetsAs of February 28, 2018
The fund reports a complete list of its holdings in regulatory filings four times in each fiscal year, at
the quarter-ends. For the second and fourth fiscal quarters, the lists appear in the fund’s semiannual
and annual reports to shareholders. For the first and third fiscal quarters, the fund files the lists with
the Securities and Exchange Commission on Form N-Q. Shareholders can look up the fund’s Forms
N-Q on the SEC’s website at sec.gov. Forms N-Q may also be reviewed and copied at the SEC’s
Public Reference Room (see the back cover of this report for further information).
International Growth Fund
14
International Growth Fund
Market
Value•
Shares ($000)
Market
Value•
Shares ($000)
Hong Kong (3.8%)
AIA Group Ltd. 124,698,200 1,034,820
Jardine Matheson
Holdings Ltd. 3,108,325 202,508
Hong Kong Exchanges
& Clearing Ltd. 4,767,930 170,797
1,408,125
India (2.1%)
Housing Development
Finance Corp. Ltd. 11,680,736 322,501
HDFC Bank Ltd. 7,956,722 229,087
Zee Entertainment
Enterprises Ltd. 15,971,869 137,817* Idea Cellular Ltd. 45,357,324 57,966*,†,4,5 ANI Technologies 166,185 34,491
781,862
Indonesia (0.3%)
Bank Central Asia Tbk
PT 66,247,400 111,492
Israel (0.6%) * Check Point Software
Technologies Ltd. 2,122,720 220,529
Italy (3.0%)
Ferrari NV 4,824,304 597,837* Fiat Chrysler
Automobiles NV 13,737,294 289,968
Intesa Sanpaolo SPA
(Registered) 55,319,653 207,549
1,095,354
Japan (12.0%)
SMC Corp. 1,369,300 570,693
SoftBank Group Corp. 6,366,800 524,604
M3 Inc. 13,418,200 520,213
Nintendo Co. Ltd. 663,700 302,554
Nidec Corp. 1,569,800 250,682
Recruit Holdings Co.
Ltd. 9,699,600 234,560
Bridgestone Corp. 5,072,900 225,184
Kubota Corp. 11,587,900 209,692
Toyota Motor Corp. 2,810,700 189,394
Sekisui Chemical Co.
Ltd. 9,982,200 187,020
Shiseido Co. Ltd. 3,040,500 182,342
Keyence Corp. 291,600 176,593
ORIX Corp. 9,152,600 162,043
KDDI Corp. 6,190,900 152,032
Pigeon Corp. 3,300,800 133,277
Murata Manufacturing
Co. Ltd. 745,100 103,780
Suzuki Motor Corp. 1,795,300 102,415
SBI Holdings Inc. 4,470,400 102,156
Sumitomo Mitsui
Financial Group Inc. 1,710,600 73,935
Rakuten Inc. 4,621,300 42,019
4,445,188
Luxembourg (0.3%) *,†,4,5 Spotify Technology SA 26,474 127,075
Mexico (0.1%)
Grupo Financiero
Banorte SAB de CV 3,437,913 20,638
Netherlands (3.6%)
ASML Holding NV 6,909,881 1,347,594
Norway (0.8%)
Norsk Hydro ASA 22,115,159 148,592
DNB ASA 7,357,991 144,329
292,921
Other (0.2%) 6 Vanguard FTSE All-World
ex-US ETF 1,128,434 61,804
Portugal (0.2%)
Jeronimo Martins
SGPS SA 3,627,182 75,239
Singapore (0.3%)
Oversea-Chinese
Banking Corp. Ltd. 13,222,600 129,392
South Korea (2.0%) *,^ Celltrion Inc. 2,090,080 676,008
NAVER Corp. 110,437 81,786
757,794
Spain (3.8%)
Industria de Diseno
Textil SA 24,860,027 752,668
Banco Bilbao Vizcaya
Argentaria SA 71,553,514 595,302
Distribuidora
Internacional de
Alimentacion SA 12,745,795 60,691
1,408,661
Sweden (5.1%)
Svenska Handelsbanken
AB Class A 43,576,778 596,213
Atlas Copco AB
Class A 12,605,874 536,219
Kinnevik AB 10,340,628 377,399
Assa Abloy AB Class B 7,200,239 160,808
SKF AB 7,039,386 147,130^ Elekta AB Class B 6,427,670 58,615
1,876,384
15
International Growth Fund
Market
Value•
Shares ($000)
Market
Value•
Shares ($000)
Switzerland (3.0%)
Nestle SA 5,348,370 424,934
UBS Group AG 15,015,080 284,534
Lonza Group AG 673,697 170,687
Cie Financiere
Richemont SA 1,475,303 129,370
Roche Holding AG 414,493 95,740
1,105,265
Taiwan (1.2%)
Taiwan Semiconductor
Manufacturing Co.
Ltd. 54,222,000 450,237
Thailand (0.5%)
Kasikornbank PCL
(Foreign) 25,854,356 190,016
United Kingdom (7.0%)
Rolls-Royce Holdings
plc 38,179,418 439,158
Diageo plc 9,722,037 329,877
Vodafone Group plc 92,984,584 259,949
Royal Dutch Shell plc
Class A 8,156,158 258,770
Aviva plc 30,842,356 213,655
BHP Billiton plc 10,012,881 203,273
Burberry Group plc 9,613,354 201,736* Standard Chartered plc 16,490,296 182,829
AstraZeneca plc 2,631,669 172,250
Reckitt Benckiser
Group plc 2,052,151 162,893*,^ Ocado Group plc 12,833,540 97,325
Antofagasta plc 7,105,720 84,477
2,606,192
United States (8.7%) * Amazon.com Inc. 807,252 1,220,928* Illumina Inc. 2,734,956 623,625
MercadoLibre Inc. 1,574,407 610,823*,^ Tesla Inc. 1,518,380 520,895* Booking Holdings Inc. 69,082 140,516
Philip Morris
International Inc. 1,123,213 116,309
3,233,096
Total Common Stocks
(Cost $23,284,429) 36,421,987
Preferred Stocks (0.7%)
*,†,4,5 Internet Plus
Holdings Ltd.,
8.00% 18,638,108 102,510*,†,3,4,5 HOME 24AG 23,630 51,517*,†,3,4,5 You & Mr. Jones 44,800,000 39,514*,†,2,4,5 Flipkart G Series,
0.01% 284,847 34,113*,†,4,5 CureVac GmbH 12,600 32,817*,†,2,4,5 Flipkart H Series,
0.01% 114,190 16,242
Total Preferred Stocks
(Cost $264,821) 276,713
Temporary Cash Investments (2.5%)1
Money Market Fund (2.4%)7,8 Vanguard Market
Liquidity Fund,
1.601% 9,004,076 900,318
Face
Amount
($000)
U.S. Government and Agency Obligations (0.1%)
United States Treasury
Bill, 1.403%, 5/10/18 4,380 4,367
United States Treasury
Bill, 1.462%, 5/17/18 3,000 2,9909 United States Treasury
Bill, 1.602%, 5/24/18 5,000 4,9819 United States Treasury
Bill, 1.512%–1.541%,
6/28/18 11,200 11,138
23,476
Total Temporary Cash Investments
(Cost $923,874) 923,794
Total Investments (101.4%)
(Cost $24,473,124) 37,622,494
16
International Growth Fund
Amount
($000)
Amount
($000)
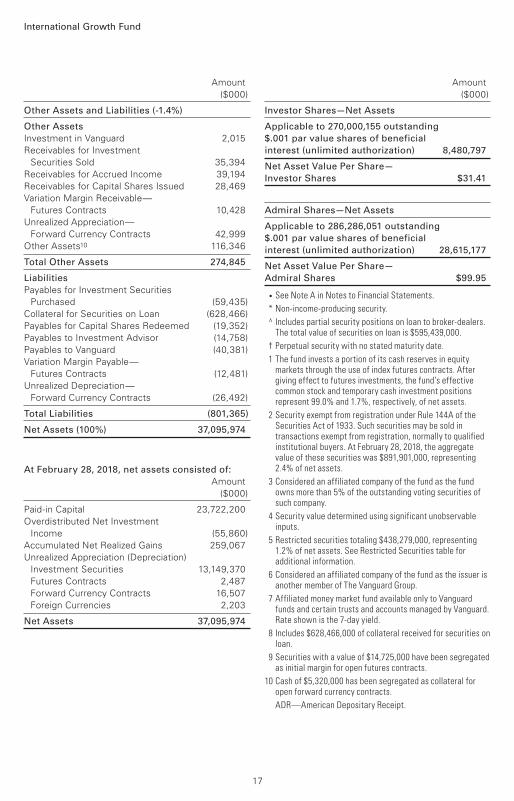
Other Assets and Liabilities (-1.4%)
Other Assets
Investment in Vanguard 2,015
Receivables for Investment
Securities Sold 35,394
Receivables for Accrued Income 39,194
Receivables for Capital Shares Issued 28,469
Variation Margin Receivable—
Futures Contracts 10,428
Unrealized Appreciation—
Forward Currency Contracts 42,999
Other Assets10 116,346
Total Other Assets 274,845
Liabilities
Payables for Investment Securities
Purchased (59,435)
Collateral for Securities on Loan (628,466)
Payables for Capital Shares Redeemed (19,352)
Payables to Investment Advisor (14,758)
Payables to Vanguard (40,381)
Variation Margin Payable—
Futures Contracts (12,481)
Unrealized Depreciation—
Forward Currency Contracts (26,492)
Total Liabilities (801,365)
Net Assets (100%) 37,095,974
At February 28, 2018, net assets consisted of:
Amount
($000)
Paid-in Capital 23,722,200
Overdistributed Net Investment
Income (55,860)
Accumulated Net Realized Gains 259,067
Unrealized Appreciation (Depreciation)
Investment Securities 13,149,370
Futures Contracts 2,487
Forward Currency Contracts 16,507
Foreign Currencies 2,203
Net Assets 37,095,974
Investor Shares—Net Assets
Applicable to 270,000,155 outstanding
$.001 par value shares of beneficial
interest (unlimited authorization) 8,480,797
Net Asset Value Per Share—
Investor Shares $31.41
Admiral Shares—Net Assets
Applicable to 286,286,051 outstanding
$.001 par value shares of beneficial
interest (unlimited authorization) 28,615,177
Net Asset Value Per Share—
Admiral Shares $99.95
• See Note A in Notes to Financial Statements.
* Non-income-producing security.
^ Includes partial security positions on loan to broker-dealers. The total value of securities on loan is $595,439,000.
† Perpetual security with no stated maturity date.
1 The fund invests a portion of its cash reserves in equity markets through the use of index futures contracts. After giving effect to futures investments, the fund’s effective common stock and temporary cash investment positions represent 99.0% and 1.7%, respectively, of net assets.
2 Security exempt from registration under Rule 144A of the Securities Act of 1933. Such securities may be sold in transactions exempt from registration, normally to qualified institutional buyers. At February 28, 2018, the aggregate value of these securities was $891,901,000, representing 2.4% of net assets.
3 Considered an affiliated company of the fund as the fund owns more than 5% of the outstanding voting securities of such company.
4 Security value determined using significant unobservable inputs.
5 Restricted securities totaling $438,279,000, representing 1.2% of net assets. See Restricted Securities table for additional information.
6 Considered an affiliated company of the fund as the issuer is another member of The Vanguard Group.
7 Affiliated money market fund available only to Vanguard funds and certain trusts and accounts managed by Vanguard. Rate shown is the 7-day yield.
8 Includes $628,466,000 of collateral received for securities on loan.
9 Securities with a value of $14,725,000 have been segregated as initial margin for open futures contracts.
10 Cash of $5,320,000 has been segregated as collateral for open forward currency contracts.
ADR—American Depositary Receipt.
17
International Growth Fund
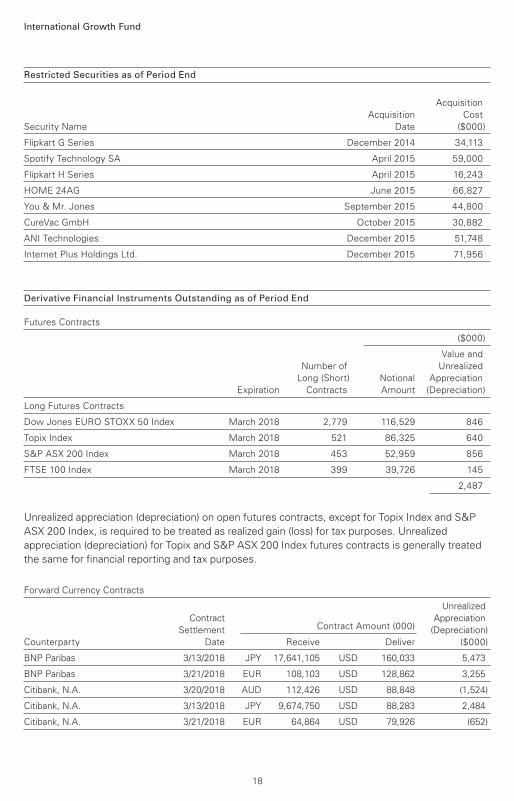
Restricted Securities as of Period End
Acquisition
Acquisition Cost
Security Name Date ($000)
Flipkart G Series December 2014 34,113
Spotify Technology SA April 2015 59,000
Flipkart H Series April 2015 16,243
HOME 24AG June 2015 66,827
You & Mr. Jones September 2015 44,800
CureVac GmbH October 2015 30,882
ANI Technologies December 2015 51,748
Internet Plus Holdings Ltd. December 2015 71,956
Derivative Financial Instruments Outstanding as of Period End
Futures Contracts
($000)
Value and
Number of Unrealized
Long (Short) Notional Appreciation
Expiration Contracts Amount (Depreciation)
Long Futures Contracts
Dow Jones EURO STOXX 50 Index March 2018 2,779 116,529 846
Topix Index March 2018 521 86,325 640
S&P ASX 200 Index March 2018 453 52,959 856
FTSE 100 Index March 2018 399 39,726 145
2,487
Unrealized appreciation (depreciation) on open futures contracts, except for Topix Index and S&P
ASX 200 Index, is required to be treated as realized gain (loss) for tax purposes. Unrealized
appreciation (depreciation) for Topix and S&P ASX 200 Index futures contracts is generally treated
the same for financial reporting and tax purposes.
Forward Currency Contracts
Unrealized
Contract Appreciation
Settlement Contract Amount (000) (Depreciation)
Counterparty Date Receive Deliver ($000)
BNP Paribas 3/13/2018 JPY 17,641,105 USD 160,033 5,473
BNP Paribas 3/21/2018 EUR 108,103 USD 128,862 3,255
Citibank, N.A. 3/20/2018 AUD 112,426 USD 88,848 (1,524)
Citibank, N.A. 3/13/2018 JPY 9,674,750 USD 88,283 2,484
Citibank, N.A. 3/21/2018 EUR 64,864 USD 79,926 (652)
18
International Growth Fund
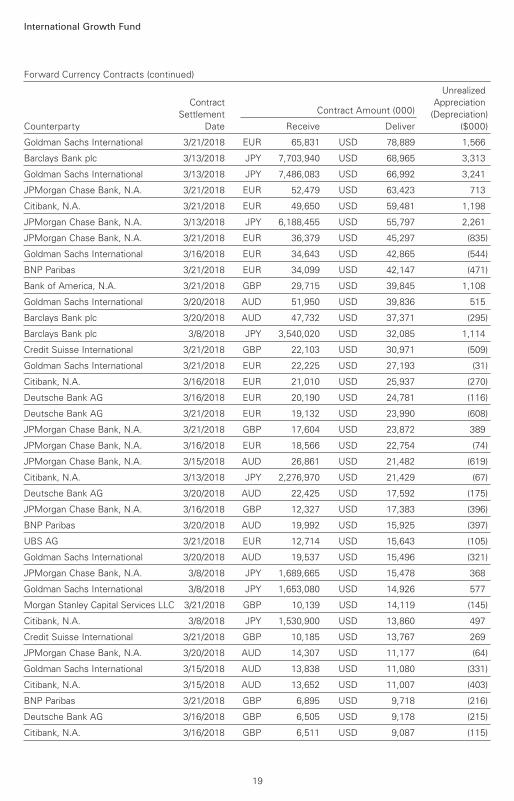
Forward Currency Contracts (continued)
Unrealized
Contract Appreciation
Settlement Contract Amount (000) (Depreciation)
Counterparty Date Receive Deliver ($000)
Goldman Sachs International 3/21/2018 EUR 65,831 USD 78,889 1,566
Barclays Bank plc 3/13/2018 JPY 7,703,940 USD 68,965 3,313
Goldman Sachs International 3/13/2018 JPY 7,486,083 USD 66,992 3,241
JPMorgan Chase Bank, N.A. 3/21/2018 EUR 52,479 USD 63,423 713
Citibank, N.A. 3/21/2018 EUR 49,650 USD 59,481 1,198
JPMorgan Chase Bank, N.A. 3/13/2018 JPY 6,188,455 USD 55,797 2,261
JPMorgan Chase Bank, N.A. 3/21/2018 EUR 36,379 USD 45,297 (835)
Goldman Sachs International 3/16/2018 EUR 34,643 USD 42,865 (544)
BNP Paribas 3/21/2018 EUR 34,099 USD 42,147 (471)
Bank of America, N.A. 3/21/2018 GBP 29,715 USD 39,845 1,108
Goldman Sachs International 3/20/2018 AUD 51,950 USD 39,836 515
Barclays Bank plc 3/20/2018 AUD 47,732 USD 37,371 (295)
Barclays Bank plc 3/8/2018 JPY 3,540,020 USD 32,085 1,114
Credit Suisse International 3/21/2018 GBP 22,103 USD 30,971 (509)
Goldman Sachs International 3/21/2018 EUR 22,225 USD 27,193 (31)
Citibank, N.A. 3/16/2018 EUR 21,010 USD 25,937 (270)
Deutsche Bank AG 3/16/2018 EUR 20,190 USD 24,781 (116)
Deutsche Bank AG 3/21/2018 EUR 19,132 USD 23,990 (608)
JPMorgan Chase Bank, N.A. 3/21/2018 GBP 17,604 USD 23,872 389
JPMorgan Chase Bank, N.A. 3/16/2018 EUR 18,566 USD 22,754 (74)
JPMorgan Chase Bank, N.A. 3/15/2018 AUD 26,861 USD 21,482 (619)
Citibank, N.A. 3/13/2018 JPY 2,276,970 USD 21,429 (67)
Deutsche Bank AG 3/20/2018 AUD 22,425 USD 17,592 (175)
JPMorgan Chase Bank, N.A. 3/16/2018 GBP 12,327 USD 17,383 (396)
BNP Paribas 3/20/2018 AUD 19,992 USD 15,925 (397)
UBS AG 3/21/2018 EUR 12,714 USD 15,643 (105)
Goldman Sachs International 3/20/2018 AUD 19,537 USD 15,496 (321)
JPMorgan Chase Bank, N.A. 3/8/2018 JPY 1,689,665 USD 15,478 368
Goldman Sachs International 3/8/2018 JPY 1,653,080 USD 14,926 577
Morgan Stanley Capital Services LLC 3/21/2018 GBP 10,139 USD 14,119 (145)
Citibank, N.A. 3/8/2018 JPY 1,530,900 USD 13,860 497
Credit Suisse International 3/21/2018 GBP 10,185 USD 13,767 269
JPMorgan Chase Bank, N.A. 3/20/2018 AUD 14,307 USD 11,177 (64)
Goldman Sachs International 3/15/2018 AUD 13,838 USD 11,080 (331)
Citibank, N.A. 3/15/2018 AUD 13,652 USD 11,007 (403)
BNP Paribas 3/21/2018 GBP 6,895 USD 9,718 (216)
Deutsche Bank AG 3/16/2018 GBP 6,505 USD 9,178 (215)
Citibank, N.A. 3/16/2018 GBP 6,511 USD 9,087 (115)
19
International Growth Fund
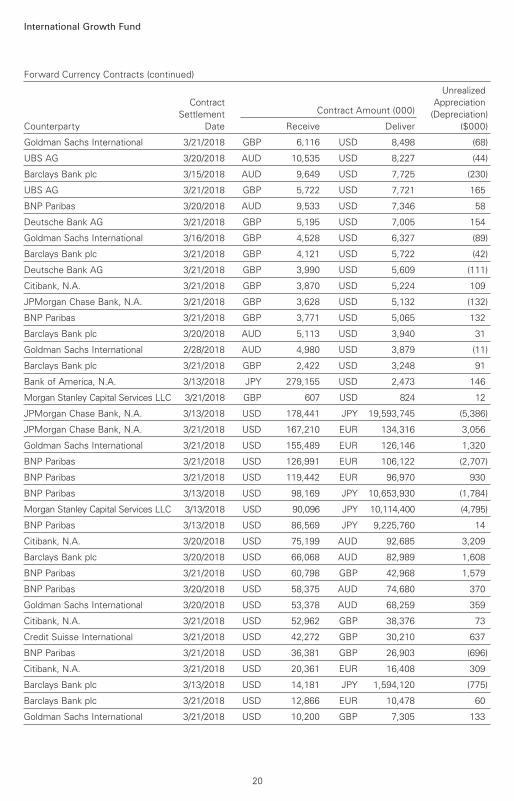
Forward Currency Contracts (continued)
Unrealized
Contract Appreciation
Settlement Contract Amount (000) (Depreciation)
Counterparty Date Receive Deliver ($000)
Goldman Sachs International 3/21/2018 GBP 6,116 USD 8,498 (68)
UBS AG 3/20/2018 AUD 10,535 USD 8,227 (44)
Barclays Bank plc 3/15/2018 AUD 9,649 USD 7,725 (230)
UBS AG 3/21/2018 GBP 5,722 USD 7,721 165
BNP Paribas 3/20/2018 AUD 9,533 USD 7,346 58
Deutsche Bank AG 3/21/2018 GBP 5,195 USD 7,005 154
Goldman Sachs International 3/16/2018 GBP 4,528 USD 6,327 (89)
Barclays Bank plc 3/21/2018 GBP 4,121 USD 5,722 (42)
Deutsche Bank AG 3/21/2018 GBP 3,990 USD 5,609 (111)
Citibank, N.A. 3/21/2018 GBP 3,870 USD 5,224 109
JPMorgan Chase Bank, N.A. 3/21/2018 GBP 3,628 USD 5,132 (132)
BNP Paribas 3/21/2018 GBP 3,771 USD 5,065 132
Barclays Bank plc 3/20/2018 AUD 5,113 USD 3,940 31
Goldman Sachs International 2/28/2018 AUD 4,980 USD 3,879 (11)
Barclays Bank plc 3/21/2018 GBP 2,422 USD 3,248 91
Bank of America, N.A. 3/13/2018 JPY 279,155 USD 2,473 146
Morgan Stanley Capital Services LLC 3/21/2018 GBP 607 USD 824 12
JPMorgan Chase Bank, N.A. 3/13/2018 USD 178,441 JPY 19,593,745 (5,386)
JPMorgan Chase Bank, N.A. 3/21/2018 USD 167,210 EUR 134,316 3,056
Goldman Sachs International 3/21/2018 USD 155,489 EUR 126,146 1,320
BNP Paribas 3/21/2018 USD 126,991 EUR 106,122 (2,707)
BNP Paribas 3/21/2018 USD 119,442 EUR 96,970 930
BNP Paribas 3/13/2018 USD 98,169 JPY 10,653,930 (1,784)
Morgan Stanley Capital Services LLC 3/13/2018 USD 90,096 JPY 10,114,400 (4,795)
BNP Paribas 3/13/2018 USD 86,569 JPY 9,225,760 14
Citibank, N.A. 3/20/2018 USD 75,199 AUD 92,685 3,209
Barclays Bank plc 3/20/2018 USD 66,068 AUD 82,989 1,608
BNP Paribas 3/21/2018 USD 60,798 GBP 42,968 1,579
BNP Paribas 3/20/2018 USD 58,375 AUD 74,680 370
Goldman Sachs International 3/20/2018 USD 53,378 AUD 68,259 359
Citibank, N.A. 3/21/2018 USD 52,962 GBP 38,376 73
Credit Suisse International 3/21/2018 USD 42,272 GBP 30,210 637
BNP Paribas 3/21/2018 USD 36,381 GBP 26,903 (696)
Citibank, N.A. 3/21/2018 USD 20,361 EUR 16,408 309
Barclays Bank plc 3/13/2018 USD 14,181 JPY 1,594,120 (775)
Barclays Bank plc 3/21/2018 USD 12,866 EUR 10,478 60
Goldman Sachs International 3/21/2018 USD 10,200 GBP 7,305 133
20
International Growth Fund
See accompanying Notes, which are an integral part of the Financial Statements.
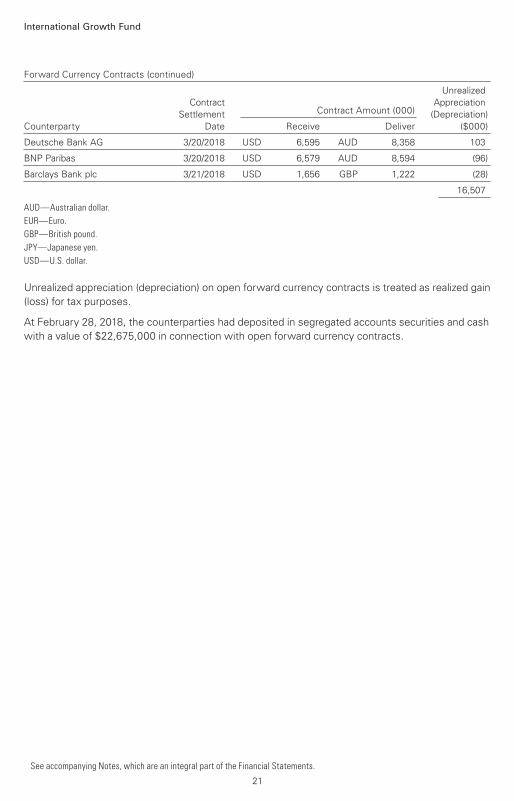
Forward Currency Contracts (continued)
Unrealized
Contract Appreciation
Settlement Contract Amount (000) (Depreciation)
Counterparty Date Receive Deliver ($000)
Deutsche Bank AG 3/20/2018 USD 6,595 AUD 8,358 103
BNP Paribas 3/20/2018 USD 6,579 AUD 8,594 (96)
Barclays Bank plc 3/21/2018 USD 1,656 GBP 1,222 (28)
16,507
AUD—Australian dollar.
EUR—Euro.
GBP—British pound.
JPY—Japanese yen.
USD—U.S. dollar.
Unrealized appreciation (depreciation) on open forward currency contracts is treated as realized gain
(loss) for tax purposes.
At February 28, 2018, the counterparties had deposited in segregated accounts securities and cash
with a value of $22,675,000 in connection with open forward currency contracts.
21
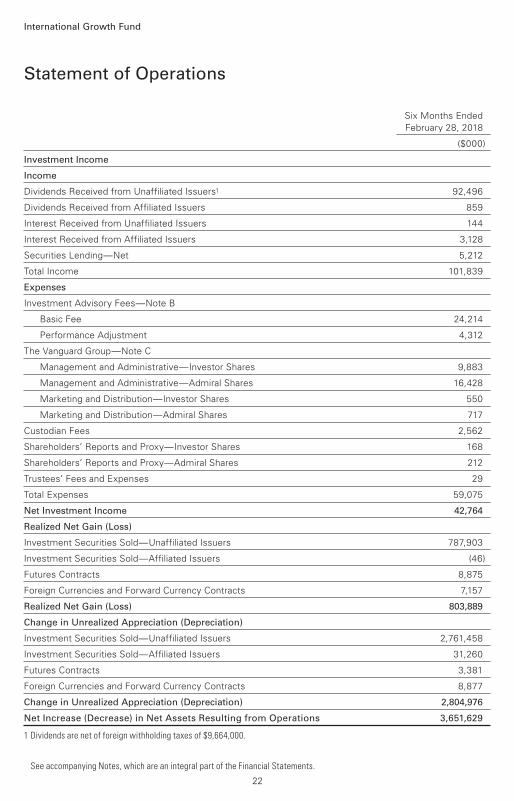
Six Months Ended
February 28, 2018
($000)
Investment Income
Income
Dividends Received from Unaffiliated Issuers1 92,496
Dividends Received from Affiliated Issuers 859
Interest Received from Unaffiliated Issuers 144
Interest Received from Affiliated Issuers 3,128
Securities Lending—Net 5,212
Total Income 101,839
Expenses
Investment Advisory Fees—Note B
Basic Fee 24,214
Performance Adjustment 4,312
The Vanguard Group—Note C
Management and Administrative—Investor Shares 9,883
Management and Administrative—Admiral Shares 16,428
Marketing and Distribution—Investor Shares 550
Marketing and Distribution—Admiral Shares 717
Custodian Fees 2,562
Shareholders’ Reports and Proxy—Investor Shares 168
Shareholders’ Reports and Proxy—Admiral Shares 212
Trustees’ Fees and Expenses 29
Total Expenses 59,075
Net Investment Income 42,764
Realized Net Gain (Loss)
Investment Securities Sold—Unaffiliated Issuers 787,903
Investment Securities Sold—Affiliated Issuers (46)
Futures Contracts 8,875
Foreign Currencies and Forward Currency Contracts 7,157
Realized Net Gain (Loss) 803,889
Change in Unrealized Appreciation (Depreciation)
Investment Securities Sold—Unaffiliated Issuers 2,761,458
Investment Securities Sold—Affiliated Issuers 31,260
Futures Contracts 3,381
Foreign Currencies and Forward Currency Contracts 8,877
Change in Unrealized Appreciation (Depreciation) 2,804,976
Net Increase (Decrease) in Net Assets Resulting from Operations 3,651,629
1 Dividends are net of foreign withholding taxes of $9,664,000.
Statement of Operations
International Growth Fund
See accompanying Notes, which are an integral part of the Financial Statements.
22
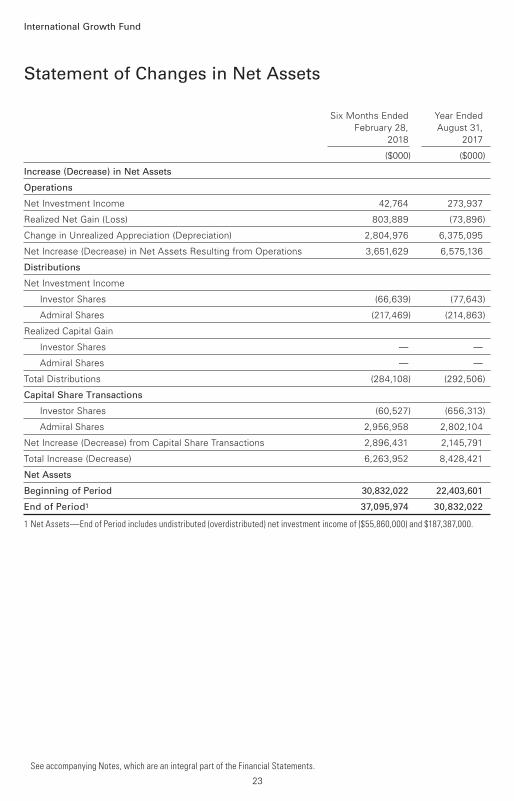
Statement of Changes in Net Assets
International Growth Fund
See accompanying Notes, which are an integral part of the Financial Statements.
Six Months Ended Year Ended
February 28, August 31,
2018 2017
($000) ($000)
Increase (Decrease) in Net Assets
Operations
Net Investment Income 42,764 273,937
Realized Net Gain (Loss) 803,889 (73,896)
Change in Unrealized Appreciation (Depreciation) 2,804,976 6,375,095
Net Increase (Decrease) in Net Assets Resulting from Operations 3,651,629 6,575,136
Distributions
Net Investment Income
Investor Shares (66,639) (77,643)
Admiral Shares (217,469) (214,863)
Realized Capital Gain
Investor Shares — —
Admiral Shares — —
Total Distributions (284,108) (292,506)
Capital Share Transactions
Investor Shares (60,527) (656,313)
Admiral Shares 2,956,958 2,802,104
Net Increase (Decrease) from Capital Share Transactions 2,896,431 2,145,791
Total Increase (Decrease) 6,263,952 8,428,421
Net Assets
Beginning of Period 30,832,022 22,403,601
End of Period1 37,095,974 30,832,022
1 Net Assets—End of Period includes undistributed (overdistributed) net investment income of ($55,860,000) and $187,387,000.
23
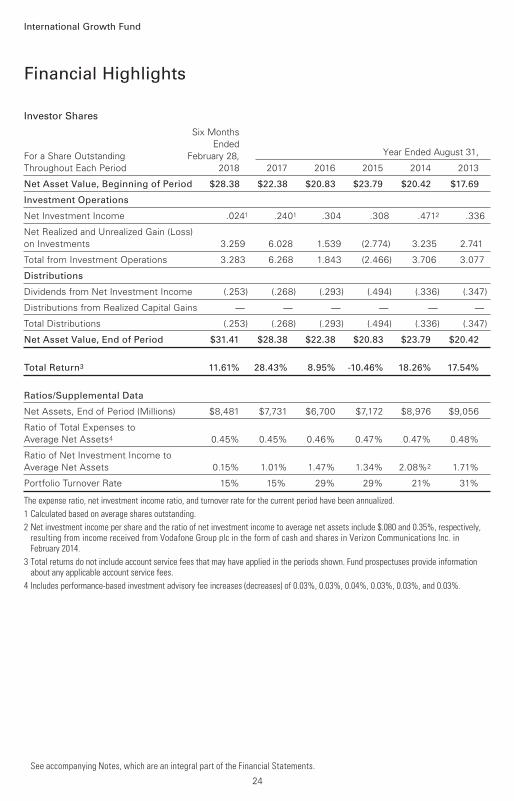
Investor Shares
Six Months
Ended
For a Share Outstanding February 28, Year Ended August 31,
Throughout Each Period 2018 2017 2016 2015 2014 2013
Net Asset Value, Beginning of Period $28.38 $22.38 $20.83 $23.79 $20.42 $17.69
Investment Operations
Net Investment Income .0241 .2401 .304 .308 .4712 .336
Net Realized and Unrealized Gain (Loss)
on Investments 3.259 6.028 1.539 (2.774) 3.235 2.741
Total from Investment Operations 3.283 6.268 1.843 (2.466) 3.706 3.077
Distributions
Dividends from Net Investment Income (.253) (.268) (.293) (.494) (.336) (.347)
Distributions from Realized Capital Gains — — — — — —
Total Distributions (.253) (.268) (.293) (.494) (.336) (.347)
Net Asset Value, End of Period $31.41 $28.38 $22.38 $20.83 $23.79 $20.42
Total Return3 11.61% 28.43% 8.95% -10.46% 18.26% 17.54%
Ratios/Supplemental Data
Net Assets, End of Period (Millions) $8,481 $7,731 $6,700 $7,172 $8,976 $9,056
Ratio of Total Expenses to
Average Net Assets4 0.45% 0.45% 0.46% 0.47% 0.47% 0.48%
Ratio of Net Investment Income to
Average Net Assets 0.15% 1.01% 1.47% 1.34% 2.08%2 1.71%
Portfolio Turnover Rate 15% 15% 29% 29% 21% 31%
The expense ratio, net investment income ratio, and turnover rate for the current period have been annualized.
1 Calculated based on average shares outstanding.
2 Net investment income per share and the ratio of net investment income to average net assets include $.080 and 0.35%, respectively, resulting from income received from Vodafone Group plc in the form of cash and shares in Verizon Communications Inc. in February 2014.
3 Total returns do not include account service fees that may have applied in the periods shown. Fund prospectuses provide information about any applicable account service fees.
4 Includes performance-based investment advisory fee increases (decreases) of 0.03%, 0.03%, 0.04%, 0.03%, 0.03%, and 0.03%.
Financial Highlights
See accompanying Notes, which are an integral part of the Financial Statements.
International Growth Fund
24
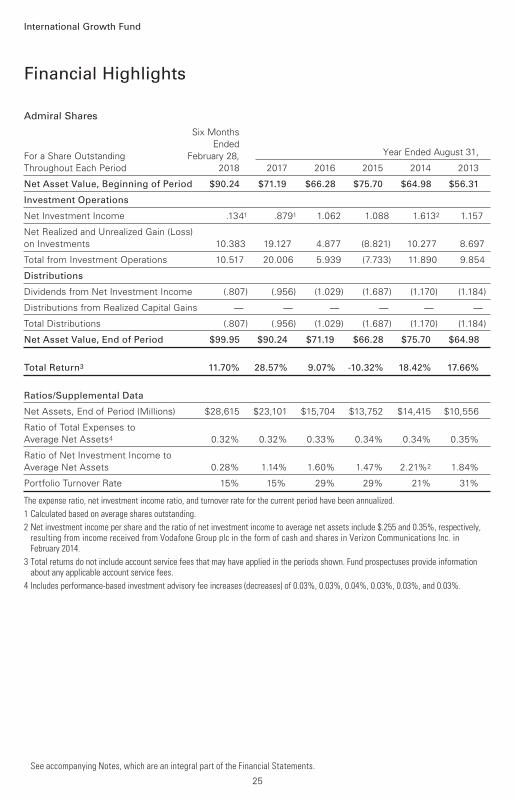
Admiral Shares
Six Months
Ended
For a Share Outstanding February 28, Year Ended August 31,
Throughout Each Period 2018 2017 2016 2015 2014 2013
Net Asset Value, Beginning of Period $90.24 $71.19 $66.28 $75.70 $64.98 $56.31
Investment Operations
Net Investment Income .1341 .8791 1.062 1.088 1.6132 1.157
Net Realized and Unrealized Gain (Loss)
on Investments 10.383 19.127 4.877 (8.821) 10.277 8.697
Total from Investment Operations 10.517 20.006 5.939 (7.733) 11.890 9.854
Distributions
Dividends from Net Investment Income (.807) (.956) (1.029) (1.687) (1.170) (1.184)
Distributions from Realized Capital Gains — — — — — —
Total Distributions (.807) (.956) (1.029) (1.687) (1.170) (1.184)
Net Asset Value, End of Period $99.95 $90.24 $71.19 $66.28 $75.70 $64.98
Total Return3 11.70% 28.57% 9.07% -10.32% 18.42% 17.66%
Ratios/Supplemental Data
Net Assets, End of Period (Millions) $28,615 $23,101 $15,704 $13,752 $14,415 $10,556
Ratio of Total Expenses to
Average Net Assets4 0.32% 0.32% 0.33% 0.34% 0.34% 0.35%
Ratio of Net Investment Income to
Average Net Assets 0.28% 1.14% 1.60% 1.47% 2.21%2 1.84%
Portfolio Turnover Rate 15% 15% 29% 29% 21% 31%
The expense ratio, net investment income ratio, and turnover rate for the current period have been annualized.
1 Calculated based on average shares outstanding.
2 Net investment income per share and the ratio of net investment income to average net assets include $.255 and 0.35%, respectively, resulting from income received from Vodafone Group plc in the form of cash and shares in Verizon Communications Inc. in February 2014.
3 Total returns do not include account service fees that may have applied in the periods shown. Fund prospectuses provide information about any applicable account service fees.
4 Includes performance-based investment advisory fee increases (decreases) of 0.03%, 0.03%, 0.04%, 0.03%, 0.03%, and 0.03%.
Financial Highlights
See accompanying Notes, which are an integral part of the Financial Statements.
International Growth Fund
25
Notes to Financial Statements
International Growth Fund
Vanguard International Growth Fund is registered under the Investment Company Act of 1940 as
an open-end investment company, or mutual fund. The fund invests in securities of foreign issuers,
which may subject it to investment risks not normally associated with investing in securities of U.S.
corporations. The fund offers two classes of shares: Investor Shares and Admiral Shares. Investor
Shares are available to any investor who meets the fund’s minimum purchase requirements.
Admiral Shares are designed for investors who meet certain administrative, service, and account-
size criteria.
A. The following significant accounting policies conform to generally accepted accounting
principles for U.S. investment companies. The fund consistently follows such policies in preparing
its financial statements.
1. Security Valuation: Securities are valued as of the close of trading on the New York Stock
Exchange (generally 4 p.m., Eastern time) on the valuation date. Equity securities are valued at
the latest quoted sales prices or official closing prices taken from the primary market in which each
security trades; such securities not traded on the valuation date are valued at the mean of the latest
quoted bid and asked prices. Securities for which market quotations are not readily available, or
whose values have been affected by events occurring before the fund’s pricing time but after the
close of the securities’ primary markets, are valued at their fair values calculated according to
procedures adopted by the board of trustees. These procedures include obtaining quotations from
an independent pricing service, monitoring news to identify significant market- or security-specific
events, and evaluating changes in the values of foreign market proxies (for example, ADRs, futures
contracts, or exchange-traded funds), between the time the foreign markets close and the fund’s
pricing time. When fair-value pricing is employed, the prices of securities used by a fund to
calculate its net asset value may differ from quoted or published prices for the same securities.
Investments in Vanguard Market Liquidity Fund are valued at that fund’s net asset value. Temporary
cash investments are valued using the latest bid prices or using valuations based on a matrix
system (which considers such factors as security prices, yields, maturities, and ratings), both as
furnished by independent pricing services.
2. Foreign Currency: Securities and other assets and liabilities denominated in foreign currencies
are translated into U.S. dollars using exchange rates obtained from an independent third party as
of the fund’s pricing time on the valuation date. Realized gains (losses) and unrealized appreciation
(depreciation) on investment securities include the effects of changes in exchange rates since the
securities were purchased, combined with the effects of changes in security prices. Fluctuations
in the value of other assets and liabilities resulting from changes in exchange rates are recorded as
unrealized foreign currency gains (losses) until the assets or liabilities are settled in cash, at which
time they are recorded as realized foreign currency gains (losses).
3. Futures and Forward Currency Contracts: The fund uses index futures contracts to a limited
extent, with the objective of maintaining full exposure to the stock market while maintaining
liquidity. The fund may purchase or sell futures contracts to achieve a desired level of investment,
whether to accommodate portfolio turnover or cash flows from capital share transactions. The
primary risks associated with the use of futures contracts are imperfect correlation between
changes in market values of stocks held by the fund and the prices of futures contracts, and the
possibility of an illiquid market. Counterparty risk involving futures is mitigated because a regulated
clearinghouse is the counterparty instead of the clearing broker. To further mitigate counterparty
risk, the fund trades futures contracts on an exchange, monitors the financial strength of its clearing
26

International Growth Fund
brokers and clearinghouse, and has entered into clearing agreements with its clearing brokers. The
clearinghouse imposes initial margin requirements to secure the fund’s performance and requires
daily settlement of variation margin representing changes in the market value of each contract.
The fund enters into forward currency contracts to provide the appropriate currency exposure
related to any open futures contracts or to protect the value of securities and related receivables
and payables against changes in foreign exchange rates. The fund’s risks in using these contracts
include movement in the values of the foreign currencies relative to the U.S. dollar and the ability
of the counterparties to fulfill their obligations under the contracts. The fund mitigates its
counterparty risk by entering into forward currency contracts only with a diverse group of
prequalified counterparties, monitoring their financial strength, entering into master netting
arrangements with its counterparties, and requiring its counterparties to transfer collateral as
security for their performance. In the absence of a default, the collateral pledged or received by
the fund cannot be repledged, resold, or rehypothecated. The master netting arrangements provide
that, in the event of a counterparty’s default (including bankruptcy), the fund may terminate the
forward currency contracts, determine the net amount owed by either party in accordance with its
master netting arrangements, and sell or retain any collateral held up to the net amount owed to
the fund under the master netting arrangements. The forward currency contracts contain provisions
whereby a counterparty may terminate open contracts if the fund’s net assets decline below
a certain level, triggering a payment by the fund if the fund is in a net liability position at the time
of the termination. The payment amount would be reduced by any collateral the fund has pledged.
Any assets pledged as collateral for open contracts are noted in the Statement of Net Assets.
The value of collateral received or pledged is compared daily to the value of the forward currency
contracts exposure with each counterparty, and any difference, if in excess of a specified minimum
transfer amount, is adjusted and settled within two business days.
Futures contracts are valued at their quoted daily settlement prices. Forward currency contracts are
valued at their quoted daily prices obtained from an independent third party, adjusted for currency
risk based on the expiration date of each contract. The notional amounts of the contracts are not
recorded in the Statement of Net Assets. Fluctuations in the value of the contracts are recorded in
the Statement of Net Assets as an asset (liability) and in the Statement of Operations as unrealized
appreciation (depreciation) until the contracts are closed, when they are recorded as realized gains
(losses) on futures or forward currency contracts.
During the six months ended February 28, 2018, the fund’s average investments in long and short
futures contracts represented less than 1% and 0% of net assets, respectively, based on the
average of the notional amounts at each quarter-end during the period. The fund’s average
investment in forward currency contracts represented 4% of net assets, based on the average
of the notional amounts at each quarter-end during the period.
4. Federal Income Taxes: The fund intends to continue to qualify as a regulated investment
company and distribute all of its taxable income. Management has analyzed the fund’s tax positions
taken for all open federal income tax years (August 31, 2014–2017), and for the period ended
February 28, 2018, and has concluded that no provision for federal income tax is required in the
fund’s financial statements.
5. Distributions: Distributions to shareholders are recorded on the ex-dividend date.
27
International Growth Fund
6. Securities Lending: To earn additional income, the fund lends its securities to qualified
institutional borrowers. Security loans are subject to termination by the fund at any time, and
are required to be secured at all times by collateral in an amount at least equal to the market
value of securities loaned. Daily market fluctuations could cause the value of loaned securities
to be more or less than the value of the collateral received. When this occurs, the collateral is
adjusted and settled on the next business day. The fund further mitigates its counterparty risk
by entering into securities lending transactions only with a diverse group of prequalified
counterparties, monitoring their financial strength, and entering into master securities lending
agreements with its counterparties. The master securities lending agreements provide that, in the
event of a counterparty’s default (including bankruptcy), the fund may terminate any loans with that
borrower, determine the net amount owed, and sell or retain the collateral up to the net amount
owed to the fund; however, such actions may be subject to legal proceedings. While collateral
mitigates counterparty risk, in the event of a default, the fund may experience delays and costs
in recovering the securities loaned. The fund invests cash collateral received in Vanguard Market
Liquidity Fund, and records a liability in the Statement of Net Assets for the return of the collateral,
during the period the securities are on loan. Securities lending income represents fees charged to
borrowers plus income earned on invested cash collateral, less expenses associated with the loan.
During the term of the loan, the fund is entitled to all distributions made on or in respect of the
loaned securities.
7. Credit Facility: The fund and certain other funds managed by The Vanguard Group (“Vanguard”)
participate in a $3.1 billion committed credit facility provided by a syndicate of lenders pursuant to
a credit agreement that may be renewed annually; each fund is individually liable for its borrowings,
if any, under the credit facility. Borrowings may be utilized for temporary and emergency purposes,
and are subject to the fund’s regulatory and contractual borrowing restrictions. The participating
funds are charged administrative fees and an annual commitment fee of 0.10% of the undrawn
amount of the facility; these fees are allocated to the funds based on a method approved by the
fund’s board of trustees and included in Management and Administrative expenses on the fund’s
Statement of Operations. Any borrowings under this facility bear interest at a rate based upon the
higher of the one-month London Interbank Offered Rate, federal funds effective rate, or overnight
bank funding rate plus an agreed-upon spread.
The fund had no borrowings outstanding at February 28, 2018, or at any time during the period
then ended.
8. Other: Dividend income is recorded on the ex-dividend date. Interest income includes income
distributions received from Vanguard Market Liquidity Fund and is accrued daily. Premiums and
discounts on debt securities purchased are amortized and accreted, respectively, to interest income
over the lives of the respective securities. Security transactions are accounted for on the date
securities are bought or sold. Costs used to determine realized gains (losses) on the sale of
investment securities are those of the specific securities sold.
Withholding taxes on foreign dividends and capital gains have been provided for in accordance with
the fund’s understanding of the applicable countries’ tax rules and rates. The fund has filed tax
reclaims for previously withheld taxes on dividends earned in certain European Union countries.
These filings are subject to various administrative and judicial proceedings within these countries.
Such tax reclaims received during the year, if any, are included in dividend income. No other
28
International Growth Fund
amounts for additional tax reclaims are reflected in the financial statements due to the uncertainty
as to the ultimate resolution of proceedings, the likelihood of receipt of these reclaims, and the
potential timing of payment.
Each class of shares has equal rights as to assets and earnings, except that each class separately
bears certain class-specific expenses related to maintenance of shareholder accounts (included in
Management and Administrative expenses), shareholder reporting, and the proxy. Marketing and
distribution expenses are allocated to each class of shares based on a method approved by the
board of trustees. Income, other non-class-specific expenses, and gains and losses on investments
are allocated to each class of shares based on its relative net assets.
B. The investment advisory firms Baillie Gifford Overseas Ltd. and Schroder Investment
Management North America Inc. each provide investment advisory services to a portion of the
fund for a fee calculated at an annual percentage rate of average net assets managed by the
advisor. The basic fee of Baillie Gifford Overseas Ltd. and Schroder Investment Management North
America Inc. are subject to quarterly adjustments based on performance relative to the MSCI All
Country World Index ex USA for the preceding three years.
Vanguard manages the cash reserves of the fund as described below.
For the six months ended February 28, 2018, the aggregate investment advisory fee represented
an effective annual basic rate of 0.14% of the fund’s average net assets, before an increase of
$4,312,000 (0.03%) based on performance.
C. In accordance with the terms of a Funds’ Service Agreement (the “FSA”) between Vanguard
and the fund, Vanguard furnishes to the fund corporate management, administrative, marketing,
distribution, and cash management services at Vanguard’s cost of operations (as defined by the
FSA). These costs of operations are allocated to the fund based on methods and guidelines
approved by the board of trustees. Vanguard does not require reimbursement in the current period
for certain costs of operations (such as deferred compensation/benefits and risk/insurance costs);
the fund’s liability for these costs of operations is included in Payables to Vanguard on the
Statement of Net Assets. All other costs of operations payable to Vanguard are generally settled
twice a month.
Upon the request of Vanguard, the fund may invest up to 0.40% of its net assets as capital in
Vanguard. At February 28, 2018, the fund had contributed to Vanguard capital in the amount of
$2,015,000, representing 0.01% of the fund’s net assets and 0.81% of Vanguard’s capitalization.
The fund’s trustees and officers are also directors and employees, respectively, of Vanguard.
D. Various inputs may be used to determine the value of the fund’s investments. These inputs are
summarized in three broad levels for financial statement purposes. The inputs or methodologies
used to value securities are not necessarily an indication of the risk associated with investing in
those securities.
Level 1—Quoted prices in active markets for identical securities.
Level 2—Other significant observable inputs (including quoted prices for similar securities, interest
rates, prepayment speeds, credit risk, etc.).
Level 3—Significant unobservable inputs (including the fund’s own assumptions used to determine
the fair value of investments). Any investments valued with significant unobservable inputs are
noted on the Statement of Net Assets.
29
International Growth Fund
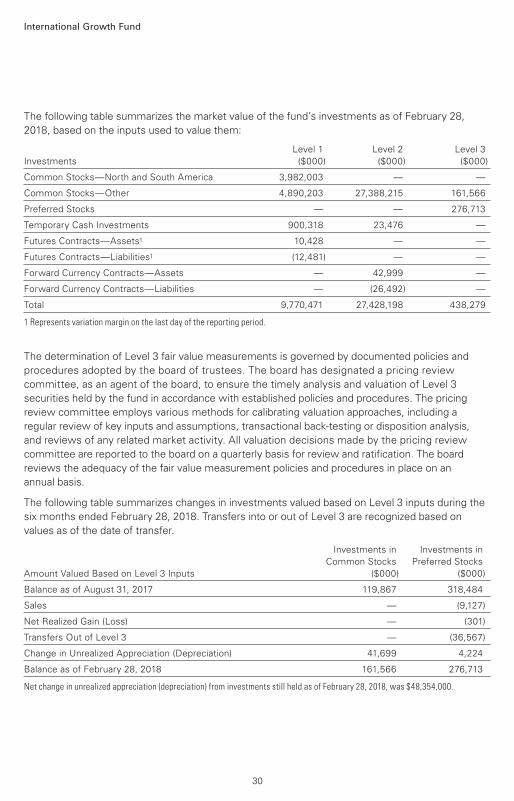
The following table summarizes the market value of the fund’s investments as of February 28,
2018, based on the inputs used to value them:
Level 1 Level 2 Level 3
Investments ($000) ($000) ($000)
Common Stocks—North and South America 3,982,003 — —
Common Stocks—Other 4,890,203 27,388,215 161,566
Preferred Stocks — — 276,713
Temporary Cash Investments 900,318 23,476 —
Futures Contracts—Assets1 10,428 — —
Futures Contracts—Liabilities1 (12,481) — —
Forward Currency Contracts—Assets — 42,999 —
Forward Currency Contracts—Liabilities — (26,492) —
Total 9,770,471 27,428,198 438,279
1 Represents variation margin on the last day of the reporting period.
The determination of Level 3 fair value measurements is governed by documented policies and
procedures adopted by the board of trustees. The board has designated a pricing review
committee, as an agent of the board, to ensure the timely analysis and valuation of Level 3
securities held by the fund in accordance with established policies and procedures. The pricing
review committee employs various methods for calibrating valuation approaches, including a
regular review of key inputs and assumptions, transactional back-testing or disposition analysis,
and reviews of any related market activity. All valuation decisions made by the pricing review
committee are reported to the board on a quarterly basis for review and ratification. The board
reviews the adequacy of the fair value measurement policies and procedures in place on an
annual basis.
The following table summarizes changes in investments valued based on Level 3 inputs during the
six months ended February 28, 2018. Transfers into or out of Level 3 are recognized based on
values as of the date of transfer.
Investments in Investments in
Common Stocks Preferred Stocks
Amount Valued Based on Level 3 Inputs ($000) ($000)
Balance as of August 31, 2017 119,867 318,484
Sales — (9,127)
Net Realized Gain (Loss) — (301)
Transfers Out of Level 3 — (36,567)
Change in Unrealized Appreciation (Depreciation) 41,699 4,224
Balance as of February 28, 2018 161,566 276,713
Net change in unrealized appreciation (depreciation) from investments still held as of February 28, 2018, was $48,354,000.
30
31
International Growth Fund
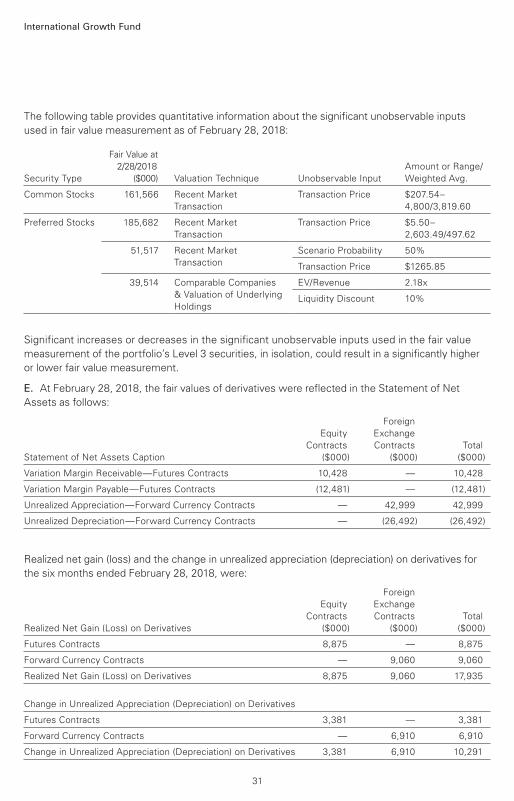
The following table provides quantitative information about the significant unobservable inputs
used in fair value measurement as of February 28, 2018:
Security Type
Fair Value at
2/28/2018
($000) Valuation Technique
Unobservable Input
Amount or Range/
Weighted Avg.
Common Stocks 161,566 Recent Market
Transaction
Transaction Price $207.54–
4,800/3,819.60
Preferred Stocks 185,682 Recent Market
Transaction
Transaction Price $5.50–
2,603.49/497.62
51,517 Recent Market
Transaction
Scenario Probability 50%
Transaction Price $1265.85
39,514 Comparable Companies
& Valuation of Underlying
Holdings
EV/Revenue 2.18x
Liquidity Discount 10%
Significant increases or decreases in the significant unobservable inputs used in the fair value
measurement of the portfolio’s Level 3 securities, in isolation, could result in a significantly higher
or lower fair value measurement.
E. At February 28, 2018, the fair values of derivatives were reflected in the Statement of Net
Assets as follows:
Foreign
Equity Exchange
Contracts Contracts Total
Statement of Net Assets Caption ($000) ($000) ($000)
Variation Margin Receivable—Futures Contracts 10,428 — 10,428
Variation Margin Payable—Futures Contracts (12,481) — (12,481)
Unrealized Appreciation—Forward Currency Contracts — 42,999 42,999
Unrealized Depreciation—Forward Currency Contracts — (26,492) (26,492)
Realized net gain (loss) and the change in unrealized appreciation (depreciation) on derivatives for
the six months ended February 28, 2018, were:
Foreign
Equity Exchange
Contracts Contracts Total
Realized Net Gain (Loss) on Derivatives ($000) ($000) ($000)
Futures Contracts 8,875 — 8,875
Forward Currency Contracts — 9,060 9,060
Realized Net Gain (Loss) on Derivatives 8,875 9,060 17,935
Change in Unrealized Appreciation (Depreciation) on Derivatives
Futures Contracts 3,381 — 3,381
Forward Currency Contracts — 6,910 6,910
Change in Unrealized Appreciation (Depreciation) on Derivatives 3,381 6,910 10,291
International Growth Fund
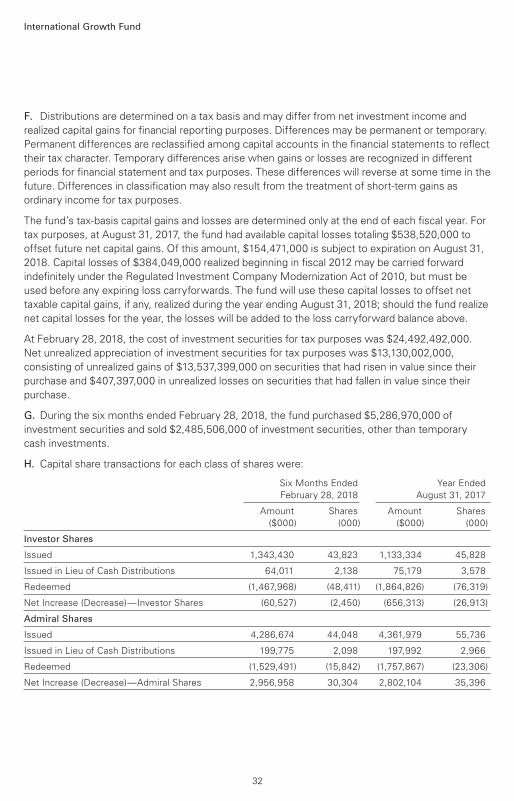
F. Distributions are determined on a tax basis and may differ from net investment income and
realized capital gains for financial reporting purposes. Differences may be permanent or temporary.
Permanent differences are reclassified among capital accounts in the financial statements to reflect
their tax character. Temporary differences arise when gains or losses are recognized in different
periods for financial statement and tax purposes. These differences will reverse at some time in the
future. Differences in classification may also result from the treatment of short-term gains as
ordinary income for tax purposes.
The fund’s tax-basis capital gains and losses are determined only at the end of each fiscal year. For
tax purposes, at August 31, 2017, the fund had available capital losses totaling $538,520,000 to
offset future net capital gains. Of this amount, $154,471,000 is subject to expiration on August 31,
2018. Capital losses of $384,049,000 realized beginning in fiscal 2012 may be carried forward
indefinitely under the Regulated Investment Company Modernization Act of 2010, but must be
used before any expiring loss carryforwards. The fund will use these capital losses to offset net
taxable capital gains, if any, realized during the year ending August 31, 2018; should the fund realize
net capital losses for the year, the losses will be added to the loss carryforward balance above.
At February 28, 2018, the cost of investment securities for tax purposes was $24,492,492,000.
Net unrealized appreciation of investment securities for tax purposes was $13,130,002,000,
consisting of unrealized gains of $13,537,399,000 on securities that had risen in value since their
purchase and $407,397,000 in unrealized losses on securities that had fallen in value since their
purchase.
G. During the six months ended February 28, 2018, the fund purchased $5,286,970,000 of
investment securities and sold $2,485,506,000 of investment securities, other than temporary
cash investments.
H. Capital share transactions for each class of shares were:
Six Months Ended Year Ended
February 28, 2018 August 31, 2017
Amount Shares Amount Shares
($000) (000) ($000) (000)
Investor Shares
Issued 1,343,430 43,823 1,133,334 45,828
Issued in Lieu of Cash Distributions 64,011 2,138 75,179 3,578
Redeemed (1,467,968) (48,411) (1,864,826) (76,319)
Net Increase (Decrease)—Investor Shares (60,527) (2,450) (656,313) (26,913)
Admiral Shares
Issued 4,286,674 44,048 4,361,979 55,736
Issued in Lieu of Cash Distributions 199,775 2,098 197,992 2,966
Redeemed (1,529,491) (15,842) (1,757,867) (23,306)
Net Increase (Decrease)—Admiral Shares 2,956,958 30,304 2,802,104 35,396
32
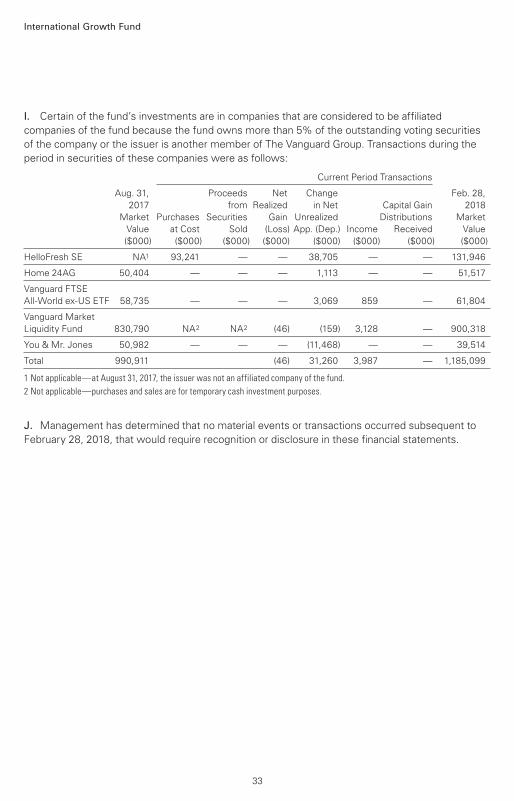
International Growth Fund
I. Certain of the fund’s investments are in companies that are considered to be affiliated
companies of the fund because the fund owns more than 5% of the outstanding voting securities
of the company or the issuer is another member of The Vanguard Group. Transactions during the
period in securities of these companies were as follows:
Current Period Transactions
Aug. 31, Proceeds Net Change Feb. 28,
2017 from Realized in Net Capital Gain 2018
Market Purchases Securities Gain Unrealized Distributions Market
Value at Cost Sold (Loss) App. (Dep.) Income Received Value
($000) ($000) ($000) ($000) ($000) ($000) ($000) ($000)
HelloFresh SE NA1 93,241 — — 38,705 — — 131,946
Home 24AG 50,404 — — — 1,113 — — 51,517
Vanguard FTSE
All-World ex-US ETF 58,735 — — — 3,069 859 — 61,804
Vanguard Market
Liquidity Fund 830,790 NA2 NA2 (46) (159) 3,128 — 900,318
You & Mr. Jones 50,982 — — — (11,468) — — 39,514
Total 990,911 (46) 31,260 3,987 — 1,185,099
1 Not applicable—at August 31, 2017, the issuer was not an affiliated company of the fund.
2 Not applicable—purchases and sales are for temporary cash investment purposes.
J. Management has determined that no material events or transactions occurred subsequent to
February 28, 2018, that would require recognition or disclosure in these financial statements.
33
About Your Fund’s Expenses
34
As a shareholder of the fund, you incur ongoing costs, which include costs for portfolio management,
administrative services, and shareholder reports (like this one), among others. Operating expenses,
which are deducted from a fund’s gross income, directly reduce the investment return of the fund.
A fund’s expenses are expressed as a percentage of its average net assets. This figure is known as
the expense ratio. The following examples are intended to help you understand the ongoing costs (in
dollars) of investing in your fund and to compare these costs with those of other mutual funds. The
examples are based on an investment of $1,000 made at the beginning of the period shown and held
for the entire period.
The accompanying table illustrates your fund’s costs in two ways:
• Based on actual fund return. This section helps you to estimate the actual expenses that you
paid over the period. The ”Ending Account Value“ shown is derived from the fund‘s actual return,
and the third column shows the dollar amount that would have been paid by an investor who started
with $1,000 in the fund. You may use the information here, together with the amount you invested,
to estimate the expenses that you paid over the period.
To do so, simply divide your account value by $1,000 (for example, an $8,600 account value divided
by $1,000 = 8.6), then multiply the result by the number given for your fund under the heading
”Expenses Paid During Period.“
• Based on hypothetical 5% yearly return. This section is intended to help you compare your
fund‘s costs with those of other mutual funds. It assumes that the fund had a yearly return of 5%
before expenses, but that the expense ratio is unchanged. In this case—because the return used is
not the fund’s actual return—the results do not apply to your investment. The example is useful in
making comparisons because the Securities and Exchange Commission requires all mutual funds to
calculate expenses based on a 5% return. You can assess your fund’s costs by comparing this
hypothetical example with the hypothetical examples that appear in shareholder reports of other
funds.
Note that the expenses shown in the table are meant to highlight and help you compare ongoingcosts only and do not reflect transaction costs incurred by the fund for buying and sellingsecurities. Further, the expenses do not include any purchase, redemption, or account servicefees described in the fund prospectus. If such fees were applied to your account, your costswould be higher. Your fund does not carry a “sales load.”
The calculations assume no shares were bought or sold during the period. Your actual costs may
have been higher or lower, depending on the amount of your investment and the timing of any
purchases or redemptions.
You can find more information about the fund’s expenses, including annual expense ratios, in the
Financial Statements section of this report. For additional information on operating expenses and
other shareholder costs, please refer to your fund’s current prospectus.
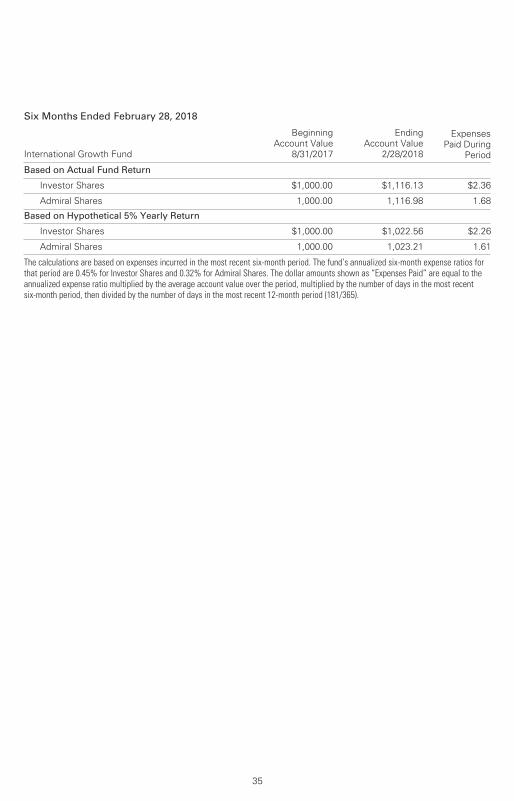
35
Six Months Ended February 28, 2018
International Growth Fund
Beginning
Account Value
8/31/2017
Ending
Account Value
2/28/2018
Expenses
Paid During
Period
Based on Actual Fund Return
Investor Shares $1,000.00 $1,116.13 $2.36
Admiral Shares 1,000.00 1,116.98 1.68
Based on Hypothetical 5% Yearly Return
Investor Shares $1,000.00 $1,022.56 $2.26
Admiral Shares 1,000.00 1,023.21 1.61
The calculations are based on expenses incurred in the most recent six-month period. The fund’s annualized six-month expense ratios forthat period are 0.45% for Investor Shares and 0.32% for Admiral Shares. The dollar amounts shown as “Expenses Paid” are equal to theannualized expense ratio multiplied by the average account value over the period, multiplied by the number of days in the most recentsix-month period, then divided by the number of days in the most recent 12-month period (181/365).

The board of trustees of Vanguard International Growth Fund has renewed the fund’s investment
advisory arrangements with Baillie Gifford Overseas Ltd. (Baillie Gifford) and Schroder Investment
Management North America Inc. (Schroder Inc.), as well as the sub-advisory agreement with
Schroder Investment Management North America Ltd. (Schroder Ltd.). The board determined that
renewing the fund’s advisory arrangements was in the best interests of the fund and its
shareholders.
The board based its decision upon an evaluation of each advisor’s investment staff, portfolio
management process, and performance. This evaluation included information provided to the board
by Vanguard’s Portfolio Review Department, which is responsible for fund and advisory oversight
and product management. The Portfolio Review Department met regularly with the advisors and
made monthly presentations to the board during the fiscal year that directed the board’s focus to
relevant information and topics.
The board, or an investment committee made up of board members, also received information
throughout the year during advisor presentations. For each advisor presentation, the board was
provided with letters and reports that included information about, among other things, the advisory
firm and the advisor’s assessment of the investment environment, portfolio performance, and
portfolio characteristics.
In addition, the board received monthly reports, which included a Market and Economic Report,
a Fund Dashboard Monthly Summary, and a Fund Performance Report.
Prior to their meeting, the trustees were provided with a memo and materials that summarized the
information they received over the course of the year. They also considered the factors discussed
below, among others. However, no single factor determined whether the board approved the
arrangements. Rather, it was the totality of the circumstances that drove the board’s decision.
Nature, extent, and quality of services
The board reviewed the quality of the fund’s investment management services over both the
short and long term, and took into account the organizational depth and stability of each advisor.
The board considered the following:
Baillie Gifford. Baillie Gifford—a unit of Baillie Gifford & Co., founded in 1908—is among the
largest independently owned investment management firms in the United Kingdom. Baillie Gifford
uses fundamental research to make long-term investments in companies that have above-average
growth potential resulting from sustainable competitive advantages, special cultures and
management, or competitive strength in underestimated technology shifts. Baillie Gifford believes
that equities’ asymmetrical return pattern means that alpha is generated by focusing on the upside
and the potential to earn exponential returns rather than being overly concerned with avoiding
losing investments. The advisor takes a bottom-up, stock-driven approach to sector and country
allocation. Baillie Gifford has advised a portion of the fund since 2003.
Schroder. Schroders plc, the parent company of Schroder Inc. and Schroder Ltd. (collectively,
Schroder), was founded in 1804 in London, England. Schroder specializes in global equity and fixed
income management and seeks to invest in securities of international companies where it has
identified a significant growth gap, which is defined as forward earnings growth that is not yet
recognized by the market. Schroder believes that market inefficiencies often drive material
differences between underlying company fundamentals and market estimates. The advisor also
Trustees Approve Advisory Arrangements
36

believes that in-depth fundamental research, incorporating a comprehensive macroeconomic
viewpoint and a robust framework of fundamental risk analysis, is the most reliable means of
finding those companies and identifying the growth gap. Schroder Inc. has advised the fund
since its inception in 1981, and its affiliate Schroder Ltd. has advised the fund since 2003.
The board concluded that each advisor’s experience, stability, depth, and performance, among
other factors, warranted continuation of the advisory arrangements.
Investment performance
The board considered the short- and long-term performance of the fund and each advisor, including
any periods of outperformance or underperformance compared with a relevant benchmark and
peer group. The board concluded that the performance was such that each advisory arrangement
should continue. Information about the fund’s most recent performance can be found in the
Performance Summary section of this report.
Cost
The board concluded that the fund’s expense ratio was well below the average expense ratio
charged by funds in its peer group and that the fund’s advisory fee rate was also well below the
peer-group average. Information about the fund’s expense ratio appears in the About Your Fund’s
Expenses section of this report as well as in the Financial Statements section, which also includes
information about the fund’s advisory fee rate.
The board did not consider the profitability of Baillie Gifford or Schroder in determining whether to
approve the advisory fees, because the firms are independent of Vanguard and the advisory fees
are the result of arm’s-length negotiations.
The benefit of economies of scale
The board concluded that the fund’s shareholders benefit from economies of scale because of
breakpoints in the advisory fee schedules for Baillie Gifford and Schroder. The breakpoints reduce
the effective rate of the fees as the fund’s assets managed by each advisor increase.
The board will consider whether to renew the advisory arrangements again after a one-year period.
37
Glossary
38
Beta. A measure of the magnitude of a fund’s past share-price fluctuations in relation to the ups
and downs of a given market index. The index is assigned a beta of 1.00. Compared with a given
index, a fund with a beta of 1.20 typically would have seen its share price rise or fall by 12%
when the index rose or fell by 10%. For this report, beta is based on returns over the past 36
months for both the fund and the index. Note that a fund’s beta should be reviewed in conjunction
with its R-squared (see definition). The lower the R-squared, the less correlation there is between
the fund and the index, and the less reliable beta is as an indicator of volatility.
Dividend Yield. Dividend income earned by stocks, expressed as a percentage of the aggregate
market value (or of net asset value, for a fund). The yield is determined by dividing the amount of
the annual dividends by the aggregate value (or net asset value) at the end of the period. For a
fund, the dividend yield is based solely on stock holdings and does not include any income
produced by other investments.
Earnings Growth Rate. The average annual rate of growth in earnings over the past five years for
the stocks now in a fund.
Equity Exposure. A measure that reflects a fund’s investments in stocks and stock futures. Any
holdings in short-term reserves are excluded.
Expense Ratio. A fund’s total annual operating expenses expressed as a percentage of the fund’s
average net assets. The expense ratio includes management and administrative expenses, but
does not include the transaction costs of buying and selling portfolio securities.
Inception Date. The date on which the assets of a fund (or one of its share classes) are first
invested in accordance with the fund’s investment objective. For funds with a subscription period,
the inception date is the day after that period ends. Investment performance is measured from
the inception date.
Median Market Cap. An indicator of the size of companies in which a fund invests; the midpoint
of market capitalization (market price x shares outstanding) of a fund’s stocks, weighted by the
proportion of the fund’s assets invested in each stock. Stocks representing half of the fund’s
assets have market capitalizations above the median, and the rest are below it.
Price/Book Ratio. The share price of a stock divided by its net worth, or book value, per share.
For a fund, the weighted average price/book ratio of the stocks it holds.
Price/Earnings Ratio. The ratio of a stock’s current price to its per-share earnings over the past
year. For a fund, the weighted average P/E of the stocks it holds. P/E is an indicator of market
expectations about corporate prospects; the higher the P/E, the greater the expectations for a
company’s future growth.
R-Squared. A measure of how much of a fund’s past returns can be explained by the returns
from the market in general, as measured by a given index. If a fund’s total returns were precisely
synchronized with an index’s returns, its R-squared would be 1.00. If the fund’s returns bore no
relationship to the index’s returns, its R-squared would be 0. For this report, R-squared is based
on returns over the past 36 months for both the fund and the index.
39
Return on Equity. The annual average rate of return generated by a company during the past five
years for each dollar of shareholder’s equity (net income divided by shareholder’s equity). For a
fund, the weighted average return on equity for the companies whose stocks it holds.
Short-Term Reserves. The percentage of a fund invested in highly liquid, short-term securities
that can be readily converted to cash.
Turnover Rate. An indication of the fund’s trading activity. Funds with high turnover rates incur
higher transaction costs and may be more likely to distribute capital gains (which may be taxable
to investors). The turnover rate excludes in-kind transactions, which have minimal impact on
costs.
Benchmark Information
Spliced International Index: MSCI EAFE Index through May 31, 2010; MSCI All Country World
Index ex USA thereafter.

The Global Industry Classification Standard (“GICS”) was developed by and is the exclusive property and a service mark
of MSCI Inc. (“MSCI”) and Standard and Poor’s, a division of McGraw-Hill Companies, Inc. (“S&P”), and is licensed for use
by Vanguard. Neither MSCI, S&P nor any third party involved in making or compiling the GICS or any GICS classification
makes any express or implied warranties or representations with respect to such standard or classification (or the results
to be obtained by the use thereof), and all such parties hereby expressly disclaim all warranties of originality, accuracy,
completeness, merchantability or fitness for a particular purpose with respect to any such standard or classification.
Without limiting any of the foregoing, in no event shall MSCI, S&P, any of its affiliates or any third party involved in
making or compiling the GICS or any GICS classification have any liability for any direct, indirect, special, punitive,
consequential or any other damages (including lost profits) even if notified of the possibility of such damages.
40
The People Who Govern Your Fund
The trustees of your mutual fund are there to see that the fund is operated and managed in your
best interests since, as a shareholder, you are a part owner of the fund. Your fund’s trustees also
serve on the board of directors of The Vanguard Group, Inc., which is owned by the Vanguard
funds and provides services to them on an at-cost basis.
A majority of Vanguard’s board members are independent, meaning that they have no affiliation
with Vanguard or the funds they oversee, apart from the sizable personal investments they have
made as private individuals. The independent board members have distinguished backgrounds
in business, academia, and public service. Each of the trustees and executive officers oversees
208 Vanguard funds.
Information for each trustee and executive officer of the fund appears below. The mailing address
of the trustees and officers is P.O. Box 876, Valley Forge, PA 19482. More information about the
trustees is in the Statement of Additional Information, which can be obtained, without charge,
by contacting Vanguard at 800-662-7447, or online at vanguard.com.
Interested Trustees1
F. William McNabb III
Born in 1957. Trustee since July 2009. Principal
occupation(s) during the past five years and
other experience: chairman of the board
(January 2010–present) of Vanguard and of each
of the investment companies served by Vanguard,
trustee (2009–present) of each of the investment
companies served by Vanguard, and director
(2008–present) of Vanguard. Chief executive officer
and president (2008–2017) of Vanguard and each
of the investment companies served by Vanguard,
managing director (1995–2008) of Vanguard,
and director (1997–2018) of Vanguard Marketing
Corporation. Director (2018–present) of
UnitedHealth Group.
Mortimer J. Buckley
Born in 1969. Trustee since January 2018. Principal
occupation(s) during the past five years and
other experience: chief executive officer
(January 2018–present) of Vanguard; chief executive
officer, president, and trustee (January 2018–present)
of each of the investment companies served by
Vanguard; president and director (2017–present) of
Vanguard; and president (February 2018–present) of
Vanguard Marketing Corporation. Chief investment
officer (2013–2017), managing director (2002–2017),
head of the Retail Investor Group (2006–2012), and
chief information officer (2001–2006) of Vanguard.
Chairman of the board (2011–2017) of the Children’s
Hospital of Philadelphia.
Independent Trustees
Emerson U. Fullwood
Born in 1948. Trustee since January 2008. Principal
occupation(s) during the past five years and other
experience: executive chief staff and marketing officer
for North America and corporate vice president (retired
2008) of Xerox Corporation (document management
products and services). Former president of the
Worldwide Channels Group, Latin America, and
Worldwide Customer Service and executive chief
staff officer of Developing Markets of Xerox. Executive
in residence and 2009–2010 Distinguished Minett
Professor at the Rochester Institute of Technology.
Lead director of SPX FLOW, Inc. (multi-industry
manufacturing). Director of the University of Rochester
Medical Center, the Monroe Community College
Foundation, the United Way of Rochester, North
Carolina A&T University, and Roberts Wesleyan
College. Trustee of the University of Rochester.
Amy Gutmann
Born in 1949. Trustee since June 2006. Principal
occupation(s) during the past five years and other
experience: president (2004–present) of the University
of Pennsylvania. Christopher H. Browne Distinguished
Professor of Political Science, School of Arts and
Sciences, and professor of communication, Annenberg
School for Communication, with secondary faculty
appointments in the Department of Philosophy, School
of Arts and Sciences, and at the Graduate School of
Education, University of Pennsylvania. Trustee of the
National Constitution Center.
1 Mr. McNabb and Mr. Buckley are considered “interested persons,” as defined in the Investment Company Act of 1940, because they are officers of the Vanguard funds.
JoAnn Heffernan Heisen
Born in 1950. Trustee since July 1998. Principal
occupation(s) during the past five years and other
experience: corporate vice president of Johnson &
Johnson (pharmaceuticals/medical devices/consumer
products) and member of its executive committee
(1997–2008). Chief global diversity officer (retired
2008), vice president and chief information officer
(1997–2006), controller (1995–1997), treasurer
(1991–1995), and assistant treasurer (1989–1991)
of Johnson & Johnson. Director of Skytop Lodge
Corporation (hotels) and the Robert Wood Johnson
Foundation. Member of the advisory board of the
Institute for Women’s Leadership at Rutgers University.
F. Joseph Loughrey
Born in 1949. Trustee since October 2009. Principal
occupation(s) during the past five years and other
experience: president and chief operating officer
(retired 2009) and vice chairman of the board
(2008–2009) of Cummins Inc. (industrial machinery).
Chairman of the board of Hillenbrand, Inc. (specialized
consumer services), Oxfam America, and the Lumina
Foundation for Education. Director of the V Foundation
for Cancer Research. Member of the advisory council
for the College of Arts and Letters and chair of the
advisory board to the Kellogg Institute for International
Studies, both at the University of Notre Dame.
Mark Loughridge
Born in 1953. Trustee since March 2012. Principal
occupation(s) during the past five years and other
experience: senior vice president and chief financial
officer (retired 2013) of IBM (information technology
services). Fiduciary member of IBM’s Retirement
Plan Committee (2004–2013), senior vice president
and general manager (2002–2004) of IBM Global
Financing, vice president and controller (1998–2002)
of IBM, and a variety of other prior management roles
at IBM. Member of the Council on Chicago Booth.
Scott C. Malpass
Born in 1962. Trustee since March 2012. Principal
occupation(s) during the past five years and other
experience: chief investment officer (1989–present)
and vice president (1996–present) of the University
of Notre Dame. Assistant professor of finance at the
Mendoza College of Business, University of Notre
Dame, and member of the Notre Dame 403(b)
Investment Committee. Chairman of the board of
TIFF Advisory Services, Inc. Member of the board
of Catholic Investment Services, Inc. (investment
advisors), the board of advisors for Spruceview
Capital Partners, and the board of superintendence
of the Institute for the Works of Religion.
Deanna Mulligan
Born in 1963. Trustee since January 2018. Principal
occupation(s) during the past five years and other
experience: president (2010–present) and chief
executive officer (2011–present) of The Guardian
Life Insurance Company of America. Chief operating
officer (2010–2011) and executive vice president
(2008–2010) of Individual Life and Disability of
The Guardian Life Insurance Company of America.
Member of the board of The Guardian Life Insurance
Company of America, the American Council of Life
Insurers, the Partnership for New York City (business
leadership), and the Committee Encouraging Corporate
Philanthropy. Trustee of the Economic Club of New
York and the Bruce Museum (arts and science).
Member of the Advisory Council for the Stanford
Graduate School of Business.
André F. Perold
Born in 1952. Trustee since December 2004. Principal
occupation(s) during the past five years and other
experience: George Gund Professor of Finance and
Banking, Emeritus at the Harvard Business School
(retired 2011). Chief investment officer and co-
managing partner of HighVista Strategies LLC
(private investment firm). Overseer of the Museum
of Fine Arts Boston.
Sarah Bloom Raskin
Born in 1961. Trustee since January 2018. Principal
occupation(s) during the past five years and other
experience: deputy secretary (2014–2017) of
the United States Department of the Treasury.
Governor (2010–2014) of the Federal Reserve Board.
Commissioner (2007–2010) of financial regulation
for the State of Maryland. Member of the board of
directors (2012–2014) of Neighborhood Reinvestment
Corporation. Director of i(x) Investments, LLC.
Peter F. Volanakis
Born in 1955. Trustee since July 2009. Principal
occupation(s) during the past five years and other
experience: president and chief operating officer
(retired 2010) of Corning Incorporated (communications
equipment) and director of Corning Incorporated
(2000–2010) and Dow Corning (2001–2010).
Director (2012) of SPX Corporation (multi-industry
manufacturing). Overseer of the Amos Tuck School
of Business Administration, Dartmouth College
(2001–2013). Chairman of the board of trustees of
Colby-Sawyer College. Member of the Board of
Hypertherm Inc. (industrial cutting systems, software,
and consumables).
Executive Officers
Glenn Booraem
Born in 1967. Principal occupation(s) during the past
five years and other experience: principal of Vanguard.
Investment stewardship officer (2017–present),
treasurer (2015–2017), controller (2010–2015),
and assistant controller (2001–2010) of each of
the investment companies served by Vanguard.
Christine M. Buchanan
Born in 1970. Principal occupation(s) during the past
five years and other experience: principal of Vanguard
and global head of Fund Administration at Vanguard.
Treasurer (2017–present) of each of the investment
companies served by Vanguard. Partner (2005–2017)
at KPMG LLP (audit, tax, and advisory services).
Brian Dvorak
Born in 1973. Principal occupation(s) during the past
five years and other experience: principal of Vanguard.
Chief compliance officer (2017–present) of Vanguard
and each of the investment companies served by
Vanguard. Assistant vice president (2017–present) of
Vanguard Marketing Corporation. Vice president and
director of Enterprise Risk Management (2011–2013)
at Oppenheimer Funds, Inc.
Thomas J. Higgins
Born in 1957. Principal occupation(s) during the past
five years and other experience: principal of Vanguard.
Chief financial officer (2008–present) and treasurer
(1998–2008) of each of the investment companies
served by Vanguard.
Peter Mahoney
Born in 1974. Principal occupation(s) during the past
five years and other experience: principal of Vanguard.
Controller (2015–present) of each of the investment
companies served by Vanguard. Head of International
Fund Services (2008–2014) at Vanguard.
Anne E. Robinson
Born in 1970. Principal occupation(s) during the
past five years and other experience: general
counsel (2016–present) of Vanguard. Secretary
(2016–present) of Vanguard and of each of the
investment companies served by Vanguard.
Managing director (2016–present) of Vanguard.
Director and senior vice president (2016–2018)
of Vanguard Marketing Corporation. Managing
director and general counsel of Global Cards and
Consumer Services (2014–2016) at Citigroup.
Counsel (2003–2014) at American Express.
Michael Rollings
Born in 1963. Principal occupation(s) during the
past five years and other experience: finance
director (2017–present) and treasurer (2017) of each
of the investment companies served by Vanguard.
Managing director (2016–present) of Vanguard. Chief
financial officer (2016–present) of Vanguard. Director
(2016–present) of Vanguard Marketing Corporation.
Executive vice president and chief financial officer
(2006–2016) of MassMutual Financial Group.
Vanguard Senior Management Team
Mortimer J. Buckley James M. Norris
Gregory Davis Thomas M. Rampulla
John James Karin A. Risi
Martha G. King Anne E. Robinson
John T. Marcante Michael Rollings
Chris D. McIsaac
Chairman Emeritus and Senior Advisor
John J. Brennan
Chairman, 1996–2009
Chief Executive Officer and President, 1996–2008
Founder
John C. Bogle
Chairman and Chief Executive Officer, 1974–1996
P.O. Box 2600
Valley Forge, PA 19482-2600
Connect with Vanguard® > vanguard.com
Fund Information > 800-662-7447
Direct Investor Account Services > 800-662-2739
Institutional Investor Services > 800-523-1036
Text Telephone for PeopleWho Are Deaf or Hard of Hearing > 800-749-7273
This material may be used in conjunctionwith the offering of shares of any Vanguardfund only if preceded or accompanied bythe fund’s current prospectus.
All comparative mutual fund data are from Lipper, aThomson Reuters Company, or Morningstar, Inc., unlessotherwise noted.
You can obtain a free copy of Vanguard’s proxy votingguidelines by visiting vanguard.com/proxyreporting or bycalling Vanguard at 800-662-2739. The guidelines arealso available from the SEC’s website, sec.gov. Inaddition, you may obtain a free report on how your fundvoted the proxies for securities it owned during the 12months ended June 30. To get the report, visit eithervanguard.com/proxyreporting or sec.gov.
You can review and copy information about your fund atthe SEC’s Public Reference Room in Washington, D.C. Tofind out more about this public service, call the SEC at202-551-8090. Information about your fund is alsoavailable on the SEC’s website, and you can receivecopies of this information, for a fee, by sending arequest in either of two ways: via email addressed [email protected] or via regular mail addressed to thePublic Reference Section, Securities and ExchangeCommission, Washington, DC 20549-1520.
Source for Bloomberg Barclays indexes: BloombergIndex Services Limited. Copyright 2018, Bloomberg. Allrights reserved.
CFA® is a registered trademark owned by CFA Institute.
© 2018 The Vanguard Group, Inc.All rights reserved.Vanguard Marketing Corporation, Distributor.
Q812 042018