Embed Size (px)
Citation preview
VANGUARD 2018 DEFINED CONTRIBUTION PLAN DATA

June 2019
At Vanguard, we have a duty to champion personal retirement outcomes. Through a transparent, collaborative approach with plan sponsors, we see the individual behind every financial decision and advocate for their long-term well-being as if it were our own.
Fundamental to fulfilling this responsibility is How America Saves, the industry’s definitive look at Americans’ retirement saving habits. Based on prior-year’s data from participants across our defined contribution (DC) recordkeeping business, How America Saves has become a bellwether not just for plan sponsors, but for financial services at large. Our latest findings on participant savings and investing behavior are presented here in the 2019 report, which is our 18th edition.
The total number of Americans covered by DC plan accounts now exceeds 100 million with assets in excess of $7.5 trillion.* Vanguard is among the leaders in the DC marketplace, with more than $1.4 trillion in DC assets under management as of March 31, 2019. Across the business, we observe sponsors’ emphasis on plan design is having a positive impact on employee retirement savings behavior. Additionally, plan participation rates continue to improve, as does participant portfolio construction.
Vanguard now serves more than 5 million participants across its DC recordkeeping business. We are honored and humbled that plan sponsors continue to place their confidence in us to guide their employees toward a sense of financial security, above and beyond any individual retirement goal.
There’s no denying the headwinds sponsors face as they seek to improve participation and contribution rates, as well as portfolio diversification. Vanguard has always been a steadfast partner to plan sponsors, but this year our relationships are taking on fresh vigor. Throughout the year, we will be announcing initiatives aimed not only at improving investors’ ability to create enduring financial security but also at reimagining retirement planning for a digital age.
We’re thrilled to have you on this journey, and we look forward to helping your participants build lasting financial security—this and every year.
Sincerely,
Martha King Managing DirectorInstitutional Investor Group
* U.S. Department of Labor, Private Pension Plan Bulletin Historical Tables and Graphs, December 2018; and Investment Company Institute, Quarterly Retirement Market Data, Fourth Quarter 2018, March 2019.

Executive summary 3
Highlights at a glance 11
Market overview 13
DC retirement plans 14
Accumulating plan assets 15
Managing participant accounts 53
Accessing plan assets 97
Methodology 118
Acknowledgements Inside back cover
C O N T E N T S
3
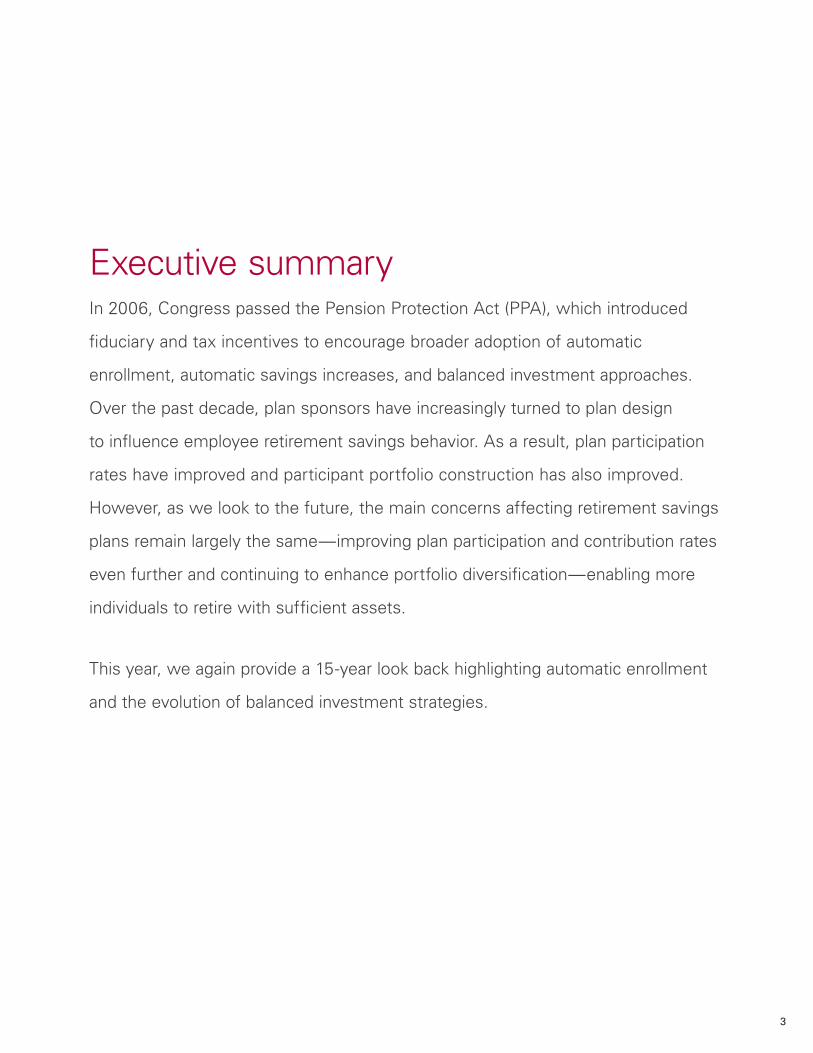
In 2006, Congress passed the Pension Protection Act (PPA), which introduced
fiduciary and tax incentives to encourage broader adoption of automatic
enrollment, automatic savings increases, and balanced investment approaches.
Over the past decade, plan sponsors have increasingly turned to plan design
to influence employee retirement savings behavior. As a result, plan participation
rates have improved and participant portfolio construction has also improved.
However, as we look to the future, the main concerns affecting retirement savings
plans remain largely the same—improving plan participation and contribution rates
even further and continuing to enhance portfolio diversification—enabling more
individuals to retire with sufficient assets.
This year, we again provide a 15-year look back highlighting automatic enrollment
and the evolution of balanced investment strategies.
Executive summary
4 > Executive summary
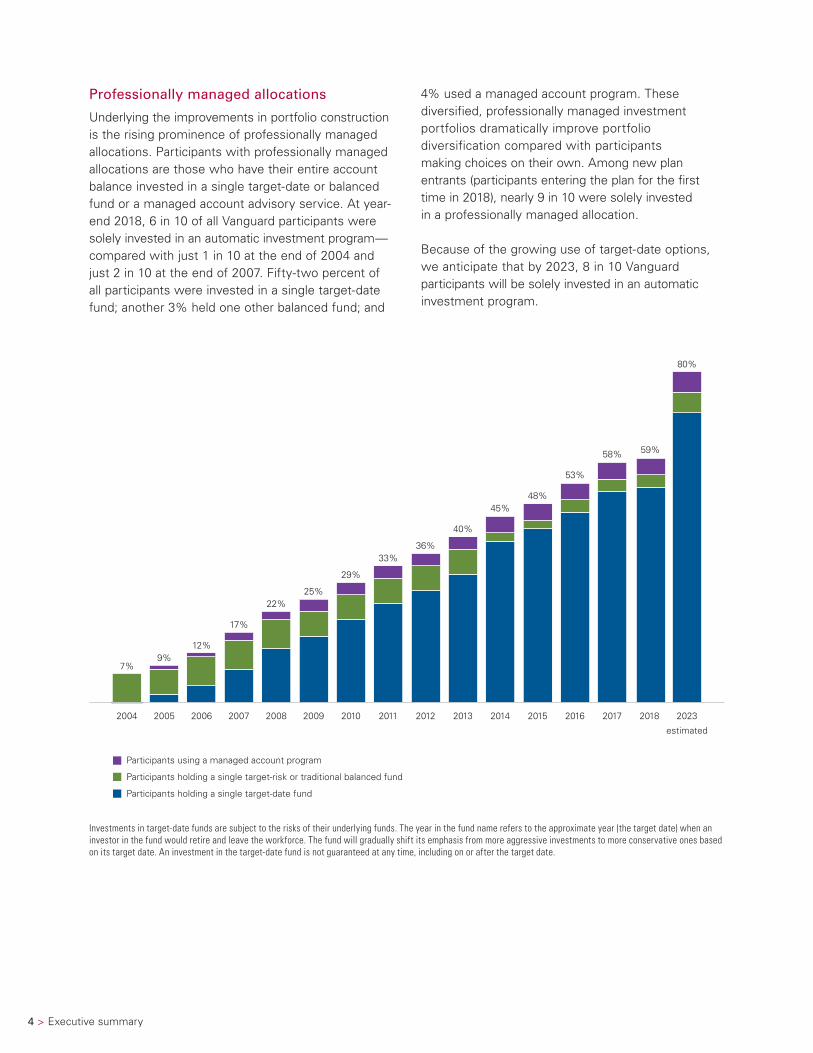
Professionally managed allocations
Underlying the improvements in portfolio construction is the rising prominence of professionally managed allocations. Participants with professionally managed allocations are those who have their entire account balance invested in a single target-date or balanced fund or a managed account advisory service. At year-end 2018, 6 in 10 of all Vanguard participants were solely invested in an automatic investment program—compared with just 1 in 10 at the end of 2004 and just 2 in 10 at the end of 2007. Fifty-two percent of all participants were invested in a single target-date fund; another 3% held one other balanced fund; and
4% used a managed account program. These diversified, professionally managed investment portfolios dramatically improve portfolio diversification compared with participants making choices on their own. Among new plan entrants (participants entering the plan for the first time in 2018), nearly 9 in 10 were solely invested in a professionally managed allocation.
Because of the growing use of target-date options, we anticipate that by 2023, 8 in 10 Vanguard participants will be solely invested in an automatic investment program.
59%
2004 2005 2006 2007 2008 2009 2010 2011 2012 2013 2014 2015 2016 2017 2023
estimated
7%9%
12%
17%
22%25%
29%
33%36%
40%
45%48%
53%
58%
80%
Participants using a managed account program
Participants holding a single target-risk or traditional balanced fund
Participants holding a single target-date fund
2018
Investments in target-date funds are subject to the risks of their underlying funds. The year in the fund name refers to the approximate year (the target date) when an investor in the fund would retire and leave the workforce. The fund will gradually shift its emphasis from more aggressive investments to more conservative ones based on its target date. An investment in the target-date fund is not guaranteed at any time, including on or after the target date.
Executive summary > 5
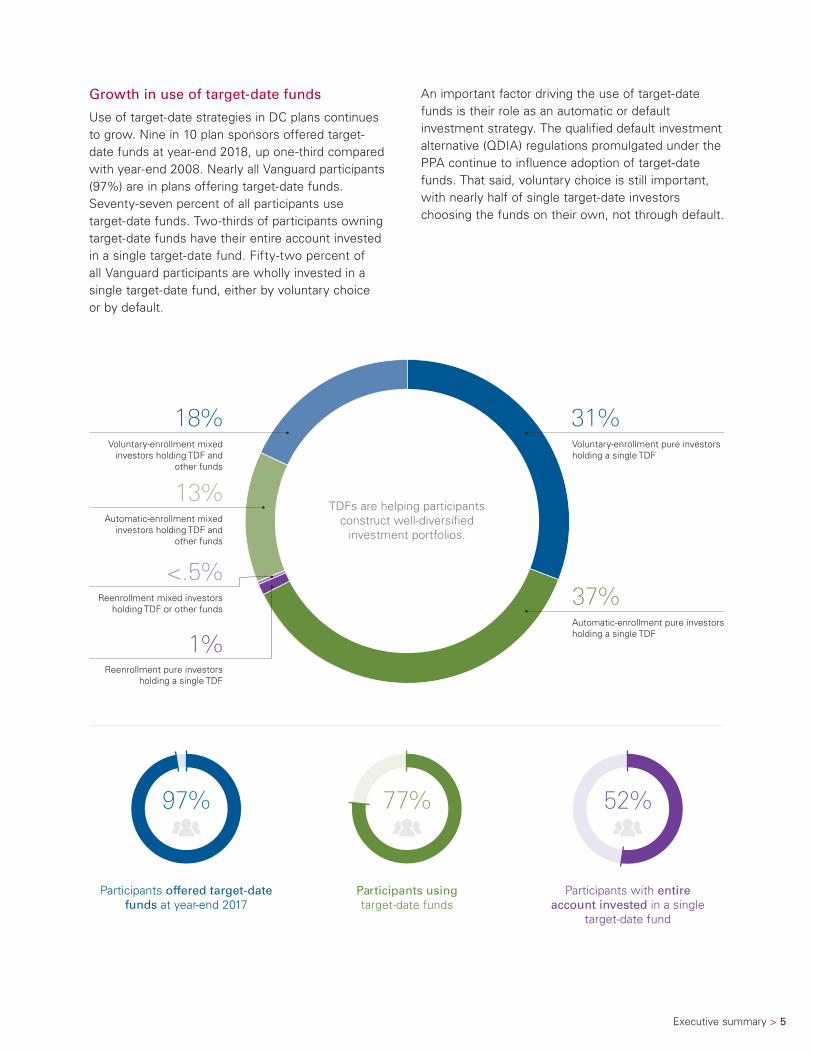
Growth in use of target-date funds
Use of target-date strategies in DC plans continues to grow. Nine in 10 plan sponsors offered target- date funds at year-end 2018, up one-third compared with year-end 2008. Nearly all Vanguard participants (97%) are in plans offering target-date funds. Seventy-seven percent of all participants use target-date funds. Two-thirds of participants owning target-date funds have their entire account invested in a single target-date fund. Fifty-two percent of all Vanguard participants are wholly invested in a single target-date fund, either by voluntary choice or by default.
An important factor driving the use of target-date funds is their role as an automatic or default investment strategy. The qualified default investment alternative (QDIA) regulations promulgated under the PPA continue to influence adoption of target-date funds. That said, voluntary choice is still important, with nearly half of single target-date investors choosing the funds on their own, not through default.
Participants offered target-date funds at year-end 2017
Participants usingtarget-date funds
Participants with entireaccount invested in a single
target-date fund
52%77%97%
Voluntary-enrollment pure investorsholding a single TDF
31%
Automatic-enrollment pure investorsholding a single TDF
37%
Voluntary-enrollment mixed investors holding TDF and
other funds
18%
Automatic-enrollment mixed investors holding TDF and
other funds
13%
Reenrollment mixed investors holding TDF or other funds
<.5%
Reenrollment pure investors holding a single TDF
1%
TDFs are helping participants construct well-diversi�ed
investment portfolios.
6 > Executive summary
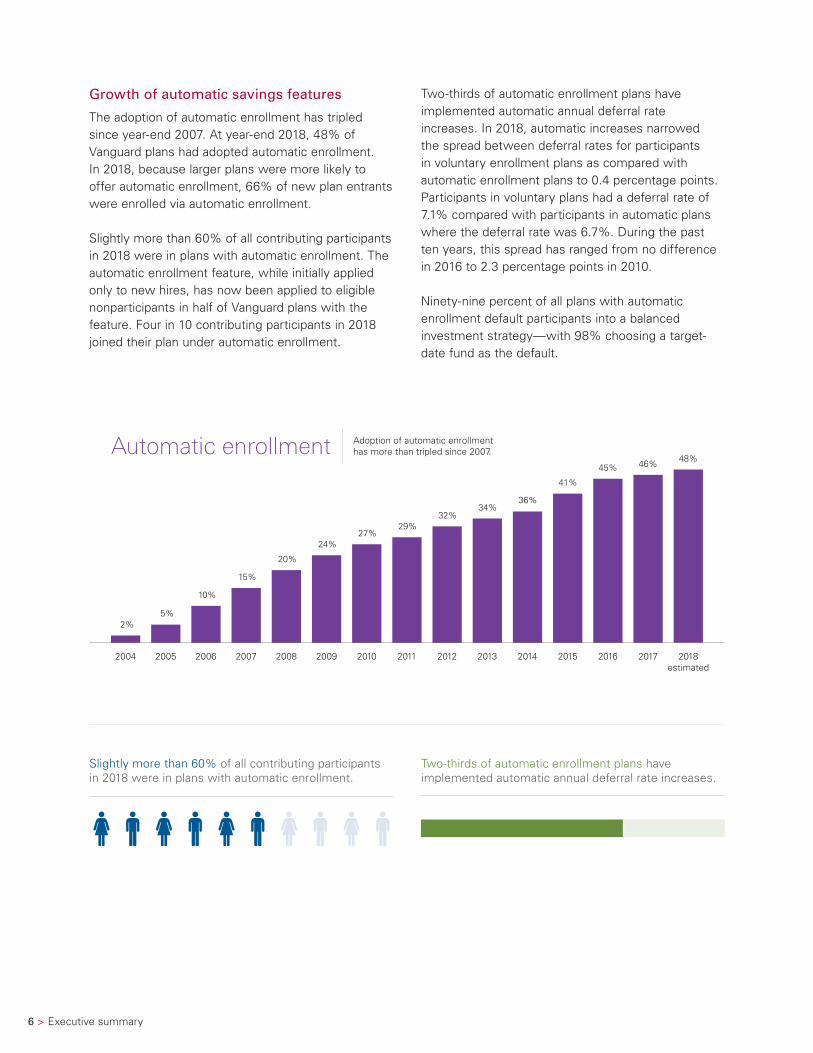
Growth of automatic savings features
The adoption of automatic enrollment has tripled since year-end 2007. At year-end 2018, 48% of Vanguard plans had adopted automatic enrollment. In 2018, because larger plans were more likely to offer automatic enrollment, 66% of new plan entrants were enrolled via automatic enrollment.
Slightly more than 60% of all contributing participants in 2018 were in plans with automatic enrollment. The automatic enrollment feature, while initially applied only to new hires, has now been applied to eligible nonparticipants in half of Vanguard plans with the feature. Four in 10 contributing participants in 2018 joined their plan under automatic enrollment.
Two-thirds of automatic enrollment plans have implemented automatic annual deferral rate increases. In 2018, automatic increases narrowed the spread between deferral rates for participants in voluntary enrollment plans as compared with automatic enrollment plans to 0.4 percentage points. Participants in voluntary plans had a deferral rate of 7.1% compared with participants in automatic plans where the deferral rate was 6.7%. During the past ten years, this spread has ranged from no difference in 2016 to 2.3 percentage points in 2010.
Ninety-nine percent of all plans with automatic enrollment default participants into a balanced investment strategy—with 98% choosing a target- date fund as the default.
2%5%
10%
15%
20%
24%27%
29%
34%32%
36%
41%
45% 46%
2004 2005 2006 2007 2008 2009 2010 2011 2012 2013 2014 2015 20172016
Adoption of automatic enrollmenthas more than tripled since 2007.Automatic enrollment
48%
2018estimated
Slightly more than 60% of all contributing participants in 2018 were in plans with automatic enrollment.
Two-thirds of automatic enrollment plans have implemented automatic annual deferral rate increases.
Executive summary > 7
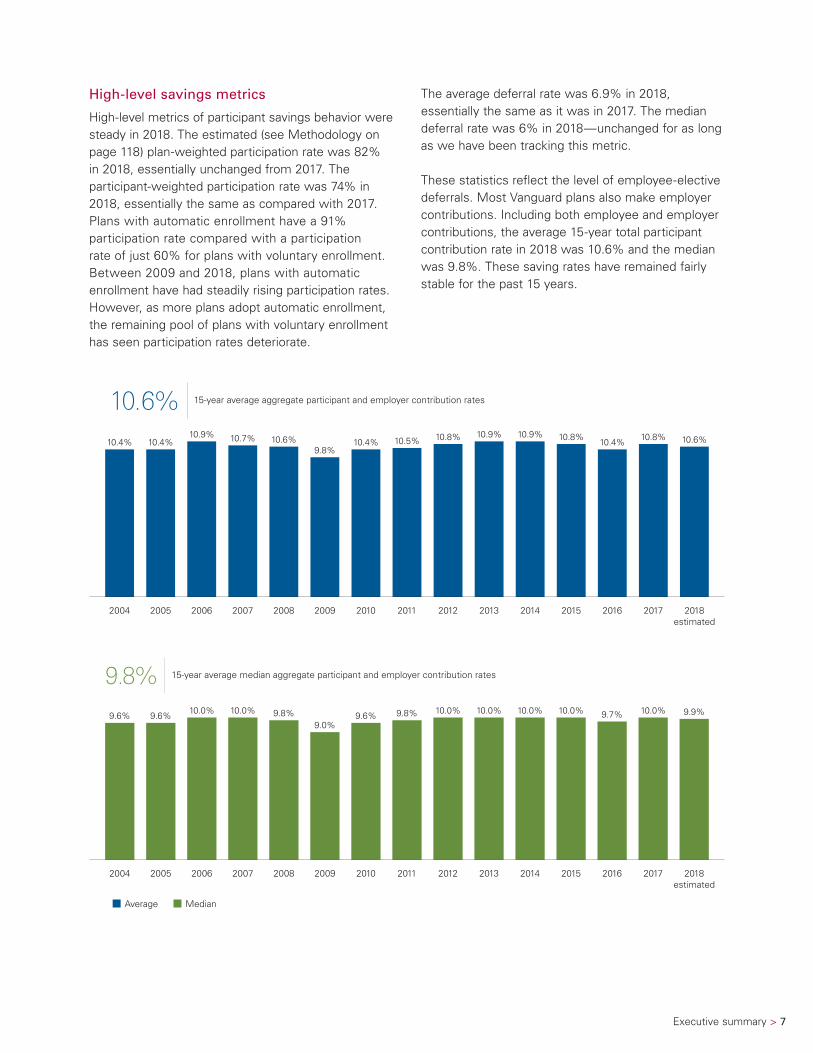
High-level savings metrics
High-level metrics of participant savings behavior were steady in 2018. The estimated (see Methodology on page 118) plan-weighted participation rate was 82% in 2018, essentially unchanged from 2017. The participant-weighted participation rate was 74% in 2018, essentially the same as compared with 2017. Plans with automatic enrollment have a 91% participation rate compared with a participation rate of just 60% for plans with voluntary enrollment. Between 2009 and 2018, plans with automatic enrollment have had steadily rising participation rates. However, as more plans adopt automatic enrollment, the remaining pool of plans with voluntary enrollment has seen participation rates deteriorate.
The average deferral rate was 6.9% in 2018, essentially the same as it was in 2017. The median deferral rate was 6% in 2018—unchanged for as long as we have been tracking this metric.
These statistics reflect the level of employee-elective deferrals. Most Vanguard plans also make employer contributions. Including both employee and employer contributions, the average 15-year total participant contribution rate in 2018 was 10.6% and the median was 9.8%. These saving rates have remained fairly stable for the past 15 years.
10.6%
9.9%
10.8%
10.0%
2018estimated
2018estimated
10.4% 10.4%10.9% 10.7% 10.6%
9.8%10.4% 10.5% 10.8% 10.9% 10.9% 10.8% 10.4%
9.6% 9.6% 10.0% 10.0% 9.8%9.0%
9.6% 9.8% 10.0% 10.0% 10.0% 10.0% 9.7%
2004 2005 2006 2007 2008 2009 2010 2011 2012 2013 2014 2015 2016 2017
2004 2005 2006 2007 2008 2009 2010 20172011 2012 2013 2014 2015 2016
Average Median
15-year average aggregate participant and employer contribution rates10.6%
15-year average median aggregate participant and employer contribution rates9.8%
8 > Executive summary
Roth 401(k) adoption
At year-end 2018, the Roth feature was adopted by 71% of Vanguard plans, and 11% of participants within these plans had elected the option. We anticipate steady growth in Roth adoption rates, given the feature’s tax diversification benefits. However, all plan sponsors with automatic enrollment default to traditional pre-tax savings.
Account balances and returns
In 2018, the average account balance for Vanguard participants was $92,148; the median balance was $22,217. In 2018, Vanguard participants’ average account balances declined by 11% compared with 2017 and median account balances declined by 16%. Three factors are driving the changes in participant account balances. The first is a changing business mix—new plans converting to Vanguard recently have had lower account balances. The second is the rising adoption of automatic enrollment, which results in more individuals saving, but also a growing number of smaller balances. As noted above, by the end of 2018, 4 in 10 participants had joined their plan under automatic enrollment. Finally, U.S. markets declined by 6% in 2018.
The median one-year participant total return was –6.5%. Five-year participant total returns averaged 5.2% per year. Among continuous participants—those with a balance at year-end 2013 and 2018— the median account balance rose by 78% over five years, reflecting both the effect of ongoing contributions and strong market returns during this period. More than 90% of continuous participants saw their account balances rise during the five-year period ended December 31, 2018.
Presence of index core options
Given the growing focus on plan fees, there is increased interest among plan sponsors in offering a wider range of low-cost passive or index funds. A “passive core” is a comprehensive set of low-cost index options that span the global capital markets. In 2018, 63% of Vanguard plans offered a set of options providing an index core. Over the past decade, the number of plans offering an index core has grown by two-thirds. Because large plans have adopted this approach more quickly, 73% of all Vanguard participants were offered an index core as part of the overall plan investment menu. Factoring in passive target-date funds, 8 in 10 participants hold index equity investments.
Shift in participant investment allocations
The percentage of plan assets invested in equities was 71% in 2018, essentially unchanged from 2017. Equity allocations continue to vary dramatically among participants. One in 10 participants have taken an extreme position, holding either 100% in equities (6% of participants) or no equities (3% of participants). These extreme allocations have fallen in recent years as a result of the rise of target-date funds and other professionally managed allocations.
Participant contributions to equities were unchanged in 2018 at 76%. In 2018, more than half (57%) of all new contributions to these plans were directed to target-date funds.
Executive summary > 9
Loan activity flat
2018 saw a modest decline in new loans issued. In 2018, 13% of participants had a loan outstanding compared with 17% of participants in 2014. The average loan balance was $9,900. Only about 1% of aggregate plan assets were borrowed by participants.
In-service withdrawals
During 2018, 3% of participants took an in-service withdrawal, withdrawing about one-third of their account balances. All in-service withdrawals during 2018 amounted to 1% of aggregate plan assets.
Assets largely preserved for retirement
Participants separating from service largely preserved their assets for retirement. During 2018, about one-third of all participants could have taken their account as a distribution because they had separated from service in the current year or prior years. The majority of these participants (81%) continued to preserve their plan assets for retirement by either remaining in their employer’s plan or rolling over their savings to an IRA or new employer plan. In terms of assets, 96% of all plan assets available for distribution were preserved and only 4% were taken in cash.
Estimated data
Some charts in this edition contain “2018 estimated” data. For an explanation, please see the Methodology section on page 118.
Participant trading muted
During 2018, only 8% of DC plan participants traded within their accounts, while 92% did not initiate any exchanges. On a net basis, there was a shift of 1.1% of assets to fixed income in 2018, with most traders making small changes to their portfolios. Only 1% of all participants abandoned equities during the year—that is, shifted from a portfolio with some equity exposure to a portfolio with no equity exposure.
Over the past decade, we have observed a decline in participant trading. The decline in participant trading is partially attributable to participants’ increased adoption of target-date funds. Only 2% of participants holding a single target-date fund traded in 2018.
Drop in company stock exposure
A shift away from company stock holdings first observed in 2006 continued into 2018. Among plans offering company stock, the number of participants holding a concentrated position of more than 20% of their account balance fell from 30% in 2009 to 19% in 2018. In addition, the number of plans actively offering company stock to participants declined to 8% in 2018 from 11% in 2009. As a result, only 4% of all Vanguard participants held concentrated company stock positions in 2018, compared with 11% at the end of 2009.
Defined contribution (DC) retirement plans are the centerpiece of the private-sector retirement system in the United States. More than 100 million Americans are covered by DC plan accounts, with assets now in excess of $7.5 trillion.
Highlights at a glance > 11
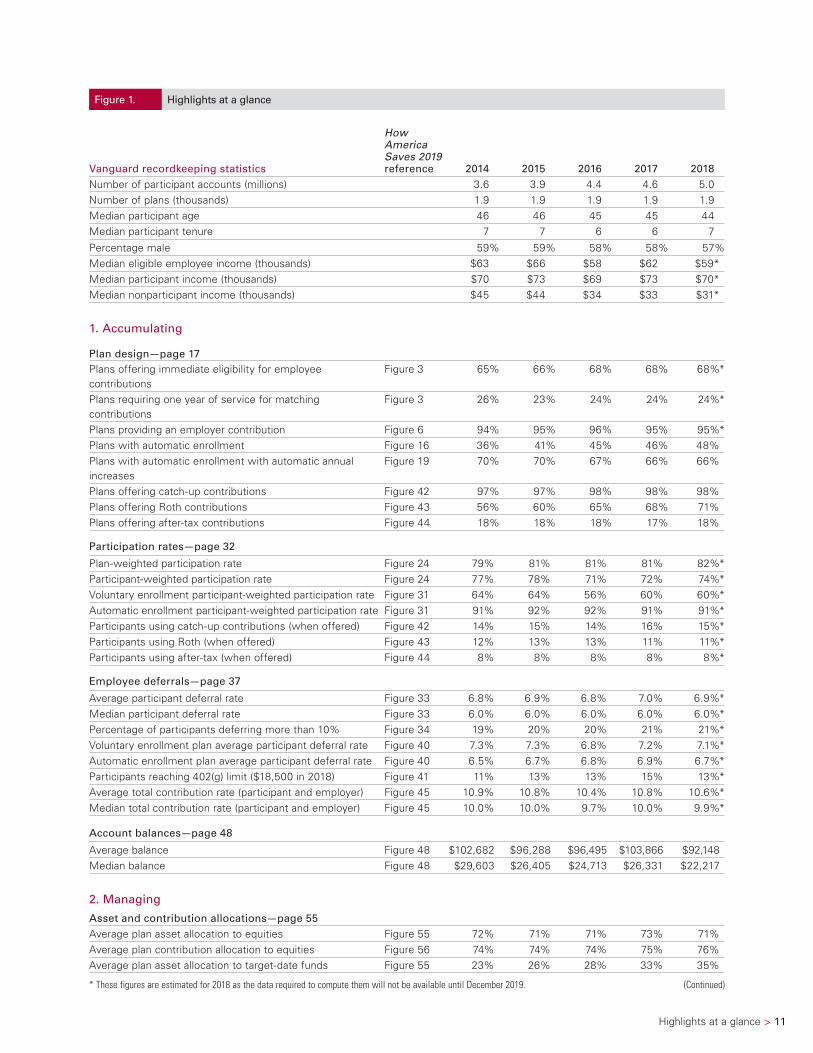
Figure 1. Highlights at a glance
Vanguard recordkeeping statistics
How America Saves 2019 reference 2014 2015 2016 2017 2018
Number of participant accounts (millions) 3.6 3.9 4.4 4.6 5.0Number of plans (thousands) 1.9 1.9 1.9 1.9 1.9Median participant age 46 46 45 45 44Median participant tenure 7 7 6 6 7
Percentage male 59% 59% 58% 58% 57%Median eligible employee income (thousands) $63 $66 $58 $62 $59*Median participant income (thousands) $70 $73 $69 $73 $70*Median nonparticipant income (thousands) $45 $44 $34 $33 $31*
1. Accumulating
Plan design—page 17Plans offering immediate eligibility for employee contributions
Figure 3 65% 66% 68% 68% 68%*
Plans requiring one year of service for matching contributions
Figure 3 26% 23% 24% 24% 24%*
Plans providing an employer contribution Figure 6 94% 95% 96% 95% 95%*Plans with automatic enrollment Figure 16 36% 41% 45% 46% 48%Plans with automatic enrollment with automatic annual increases
Figure 19 70% 70% 67% 66% 66%
Plans offering catch-up contributions Figure 42 97% 97% 98% 98% 98%Plans offering Roth contributions Figure 43 56% 60% 65% 68% 71%Plans offering after-tax contributions Figure 44 18% 18% 18% 17% 18%
Participation rates—page 32
Plan-weighted participation rate Figure 24 79% 81% 81% 81% 82%*Participant-weighted participation rate Figure 24 77% 78% 71% 72% 74%*Voluntary enrollment participant-weighted participation rate Figure 31 64% 64% 56% 60% 60%*Automatic enrollment participant-weighted participation rate Figure 31 91% 92% 92% 91% 91%*Participants using catch-up contributions (when offered) Figure 42 14% 15% 14% 16% 15%*Participants using Roth (when offered) Figure 43 12% 13% 13% 11% 11%*Participants using after-tax (when offered) Figure 44 8% 8% 8% 8% 8%*
Employee deferrals—page 37
Average participant deferral rate Figure 33 6.8% 6.9% 6.8% 7.0% 6.9%*Median participant deferral rate Figure 33 6.0% 6.0% 6.0% 6.0% 6.0%*Percentage of participants deferring more than 10% Figure 34 19% 20% 20% 21% 21%*Voluntary enrollment plan average participant deferral rate Figure 40 7.3% 7.3% 6.8% 7.2% 7.1%*Automatic enrollment plan average participant deferral rate Figure 40 6.5% 6.7% 6.8% 6.9% 6.7%*Participants reaching 402(g) limit ($18,500 in 2018) Figure 41 11% 13% 13% 15% 13%*Average total contribution rate (participant and employer) Figure 45 10.9% 10.8% 10.4% 10.8% 10.6%*Median total contribution rate (participant and employer) Figure 45 10.0% 10.0% 9.7% 10.0% 9.9%*
Account balances—page 48
Average balance Figure 48 $102,682 $96,288 $96,495 $103,866 $92,148 Median balance Figure 48 $29,603 $26,405 $24,713 $26,331 $22,217
2. Managing
Asset and contribution allocations—page 55Average plan asset allocation to equities Figure 55 72% 71% 71% 73% 71%Average plan contribution allocation to equities Figure 56 74% 74% 74% 75% 76%Average plan asset allocation to target-date funds Figure 55 23% 26% 28% 33% 35%
* These figures are estimated for 2018 as the data required to compute them will not be available until December 2019. (Continued)
12 > Highlights at a glance
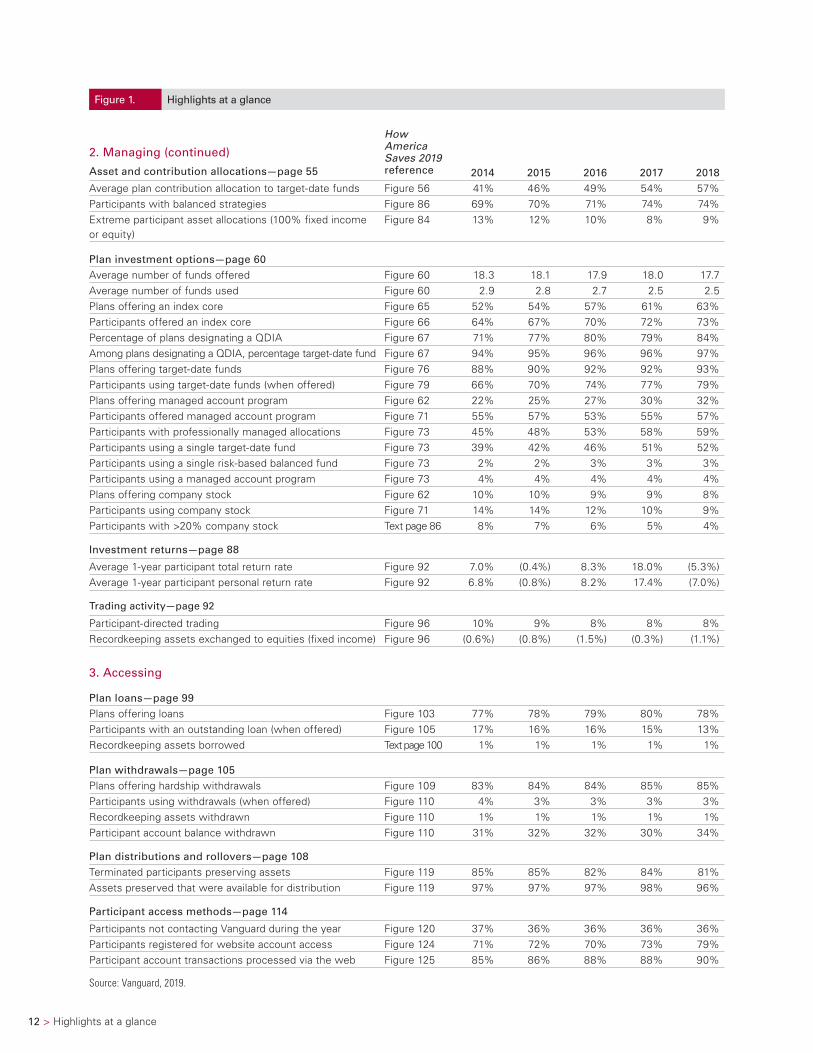
Figure 1. Highlights at a glance
2. Managing (continued)
Asset and contribution allocations—page 55
How America Saves 2019 reference 2014 2015 2016 2017 2018
Average plan contribution allocation to target-date funds Figure 56 41% 46% 49% 54% 57%Participants with balanced strategies Figure 86 69% 70% 71% 74% 74%Extreme participant asset allocations (100% fixed income or equity)
Figure 84 13% 12% 10% 8% 9%
Plan investment options—page 60Average number of funds offered Figure 60 18.3 18.1 17.9 18.0 17.7Average number of funds used Figure 60 2.9 2.8 2.7 2.5 2.5Plans offering an index core Figure 65 52% 54% 57% 61% 63%Participants offered an index core Figure 66 64% 67% 70% 72% 73%Percentage of plans designating a QDIA Figure 67 71% 77% 80% 79% 84%Among plans designating a QDIA, percentage target-date fund Figure 67 94% 95% 96% 96% 97%Plans offering target-date funds Figure 76 88% 90% 92% 92% 93%Participants using target-date funds (when offered) Figure 79 66% 70% 74% 77% 79%Plans offering managed account program Figure 62 22% 25% 27% 30% 32%Participants offered managed account program Figure 71 55% 57% 53% 55% 57%Participants with professionally managed allocations Figure 73 45% 48% 53% 58% 59%Participants using a single target-date fund Figure 73 39% 42% 46% 51% 52%Participants using a single risk-based balanced fund Figure 73 2% 2% 3% 3% 3%Participants using a managed account program Figure 73 4% 4% 4% 4% 4%Plans offering company stock Figure 62 10% 10% 9% 9% 8%Participants using company stock Figure 71 14% 14% 12% 10% 9%Participants with >20% company stock Text page 86 8% 7% 6% 5% 4%
Investment returns—page 88
Average 1-year participant total return rate Figure 92 7.0% (0.4%) 8.3% 18.0% (5.3%)Average 1-year participant personal return rate Figure 92 6.8% (0.8%) 8.2% 17.4% (7.0%)
Trading activity—page 92
Participant-directed trading Figure 96 10% 9% 8% 8% 8%Recordkeeping assets exchanged to equities (fixed income) Figure 96 (0.6%) (0.8%) (1.5%) (0.3%) (1.1%)
3. Accessing
Plan loans—page 99Plans offering loans Figure 103 77% 78% 79% 80% 78%Participants with an outstanding loan (when offered) Figure 105 17% 16% 16% 15% 13%Recordkeeping assets borrowed Text page 100 1% 1% 1% 1% 1%
Plan withdrawals—page 105Plans offering hardship withdrawals Figure 109 83% 84% 84% 85% 85%Participants using withdrawals (when offered) Figure 110 4% 3% 3% 3% 3%Recordkeeping assets withdrawn Figure 110 1% 1% 1% 1% 1%Participant account balance withdrawn Figure 110 31% 32% 32% 30% 34%
Plan distributions and rollovers—page 108Terminated participants preserving assets Figure 119 85% 85% 82% 84% 81%Assets preserved that were available for distribution Figure 119 97% 97% 97% 98% 96%
Participant access methods—page 114
Participants not contacting Vanguard during the year Figure 120 37% 36% 36% 36% 36%Participants registered for website account access Figure 124 71% 72% 70% 73% 79%Participant account transactions processed via the web Figure 125 85% 86% 88% 88% 90%
Source: Vanguard, 2019.
Market overview > 13
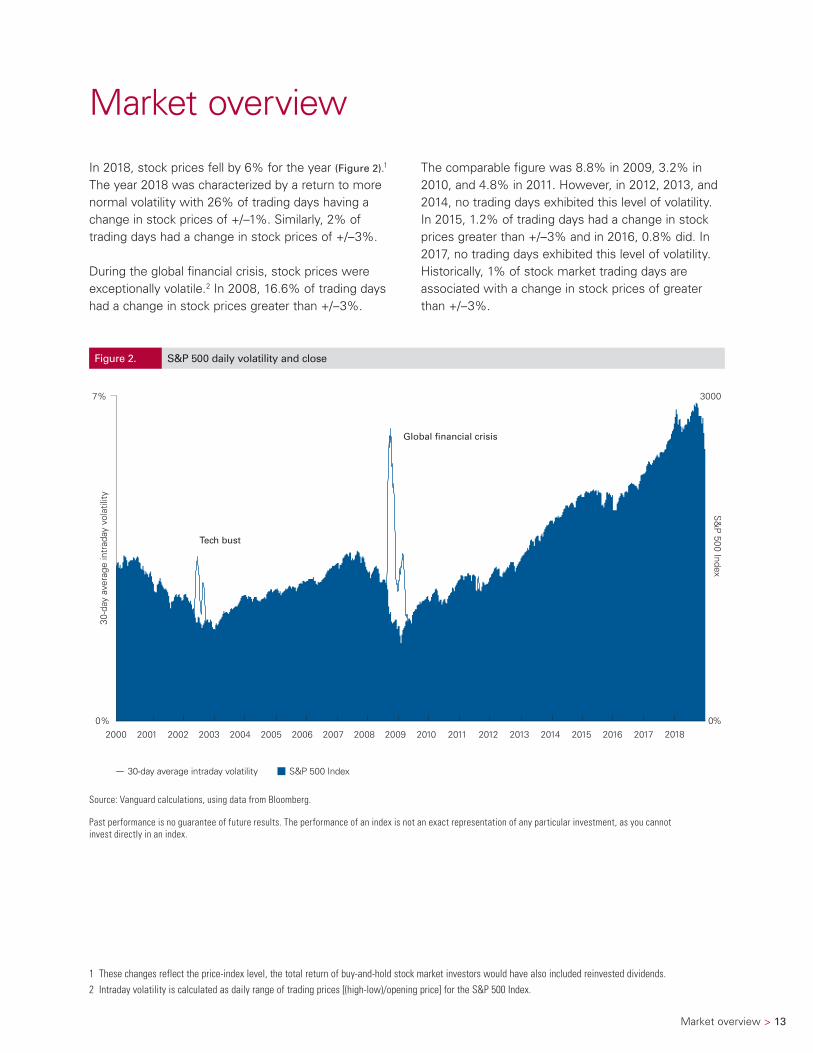
The comparable figure was 8.8% in 2009, 3.2% in 2010, and 4.8% in 2011. However, in 2012, 2013, and 2014, no trading days exhibited this level of volatility. In 2015, 1.2% of trading days had a change in stock prices greater than +/–3% and in 2016, 0.8% did. In 2017, no trading days exhibited this level of volatility. Historically, 1% of stock market trading days are associated with a change in stock prices of greater than +/–3%.
In 2018, stock prices fell by 6% for the year (Figure 2).1 The year 2018 was characterized by a return to more normal volatility with 26% of trading days having a change in stock prices of +/–1%. Similarly, 2% of trading days had a change in stock prices of +/–3%.
During the global financial crisis, stock prices were exceptionally volatile.2 In 2008, 16.6% of trading days had a change in stock prices greater than +/–3%.
1 These changes reflect the price-index level, the total return of buy-and-hold stock market investors would have also included reinvested dividends.2 Intraday volatility is calculated as daily range of trading prices [(high-low)/opening price] for the S&P 500 Index.
Market overview
Figure 2. S&P 500 daily volatility and close
30-day average intraday volatility S&P 500 Index
2000 2001 2002 2003 2004 2005 2006 2007 2008 2009 2010 2011 2012 2013 2014 2015 2016 2017 20180%
7%
0%
3000
30-d
ay a
vera
ge in
trad
ay v
olat
ility
Tech bust
Global �nancial crisis
S&
P 500 Index
Source: Vanguard calculations, using data from Bloomberg.
Past performance is no guarantee of future results. The performance of an index is not an exact representation of any particular investment, as you cannot invest directly in an index.
14 > DC retirement plans
DC plans are the dominant type of retirement plan sponsored by private-sector employers in the United States, covering nearly half of all private-sector workers. Although there is still a significant minority of individuals eligible for such plans who fail to participate in them, DC plans have nonetheless enabled millions of American workers to accumulate savings for retirement.
The performance of DC plans can be measured in several ways:
Accumulating plan assets. The level of plan contributions is fundamental to retirement savings adequacy. Plan contributions are affected by employee participation rates, participant deferral rates, and the value of employer contributions. Participant deferral behavior is increasingly influenced by employers’ automatic enrollment and automatic escalation default designations. Overall, retirement plan design varies substantially across employers—and variation in the level of employer contributions does impact the employee contributions needed to accumulate sufficient retirement savings.
Managing participant accounts. After deciding to contribute to a retirement savings plan, participants’ most important decision is how to allocate their holdings among the major asset classes.
As with deferral decisions, many such investment decisions are increasingly influenced by employer- established defaults, as well as the growing use of all-in-one portfolio strategies such as target-date funds and managed account programs. These investment decisions—including the types of investment options offered by the plan and the choices participants or employers make from among those options—have a direct impact on account performance over time. Thus, investment choices, in conjunction with the level of plan contributions, ultimately influence participants’ level of retirement readiness.
Accessing plan assets. Participants may be able to take a loan or in-service withdrawal to access their savings while working. When changing jobs or retiring, they typically have the option of remaining in the plan, rolling over to another plan or IRA, or taking a cash lump sum.
Our analysis shows that most Vanguard DC plan participants have seen their retirement savings grow over one- and five-year periods.
DC retirement plans

Historically, employees have had to decide whether to participate and at what rate to save. Increasingly, employers are making these decisions through automatic enrollment.
A C C U M U L A T I N G P L A N A S S E T S ON
E
ON
E
Historically, employees have had to decide whether to participate and at what rate to save. Increasingly, employers are making these decisions through automatic enrollment.
A C C U M U L A T I N G P L A N A S S E T S
Accumulating plan assets > 17
Plan design
Nine in 10 Vanguard-administered DC plans permit pre-tax elective deferrals by eligible employees. Employee deferral decisions are shaped by the design of the DC plan sponsored by their employer.
DC plans with employee-elective deferrals can be grouped into four categories based on the type of employer contributions made to the plan: (1) plans with matching contributions, (2) plans with nonmatching employer contributions, (3) plans with both matching and nonmatching contributions, and (4) plans with no employer contributions at all. Nonmatching contributions are typically structured as a variable or fixed profit-sharing contribution, or less frequently as an employee stock ownership plan (ESOP) contribution.
In employee-contributory DC plans, employer contributions are typically a secondary source of plan funding. Both the type and size of employer contributions vary substantially across plans.
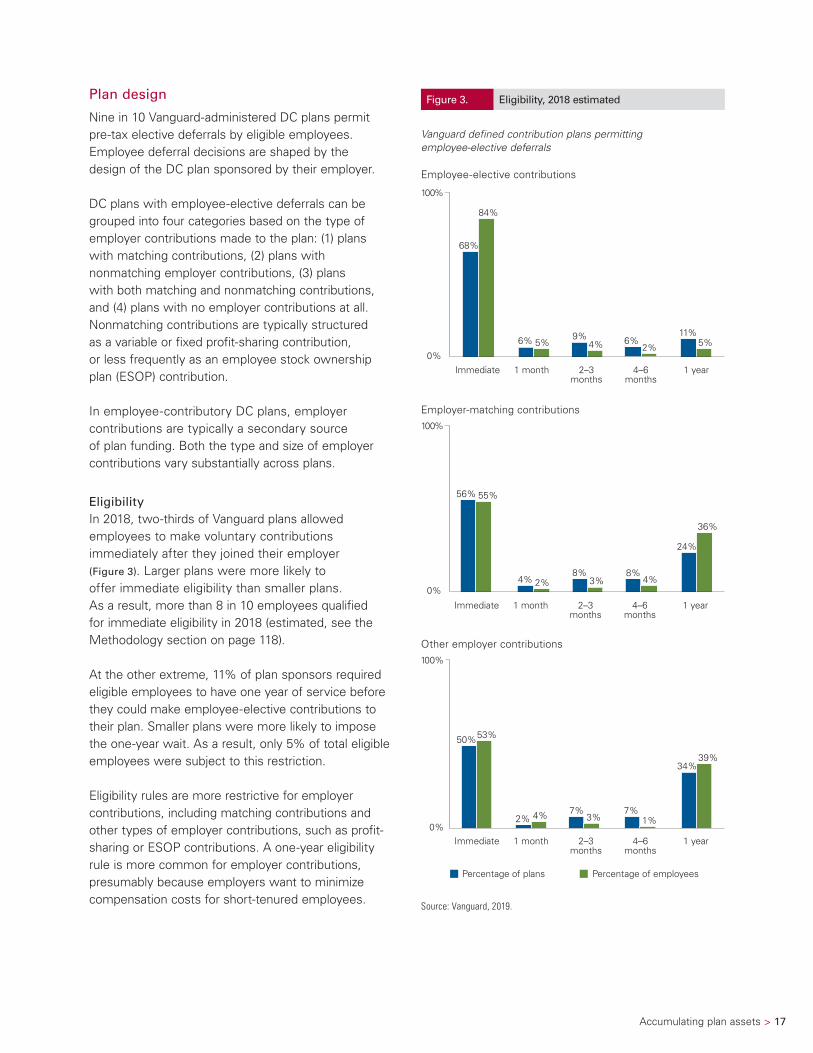
EligibilityIn 2018, two-thirds of Vanguard plans allowed employees to make voluntary contributions immediately after they joined their employer (Figure 3). Larger plans were more likely to offer immediate eligibility than smaller plans. As a result, more than 8 in 10 employees qualified for immediate eligibility in 2018 (estimated, see the Methodology section on page 118).
At the other extreme, 11% of plan sponsors required eligible employees to have one year of service before they could make employee-elective contributions to their plan. Smaller plans were more likely to impose the one-year wait. As a result, only 5% of total eligible employees were subject to this restriction.
Eligibility rules are more restrictive for employer contributions, including matching contributions and other types of employer contributions, such as profit-sharing or ESOP contributions. A one-year eligibility rule is more common for employer contributions, presumably because employers want to minimize compensation costs for short-tenured employees.
Figure 3. Eligibility, 2018 estimated
Vanguard defined contribution plans permitting employee-elective deferrals
Employee-elective contributions
11% 5% 2%
6% 9% 4% 5% 6%
Immediate 1 month 2–3months
4–6months
1 year
100%
0%
68%
84%
Employer-matching contributions
24%
36%
4%8%
3%8%
4% 2%
56% 55%
100%
0%
Immediate 1 month 2–3months
4–6months
1 year
Other employer contributions
50%
2%7% 7%
34%
53%
4% 3% 1%
39%
Percentage of plans Percentage of employees
100%
0% Immediate 1 month 2–3
months4–6
months1 year
Source: Vanguard, 2019.
18 > Accumulating plan assets
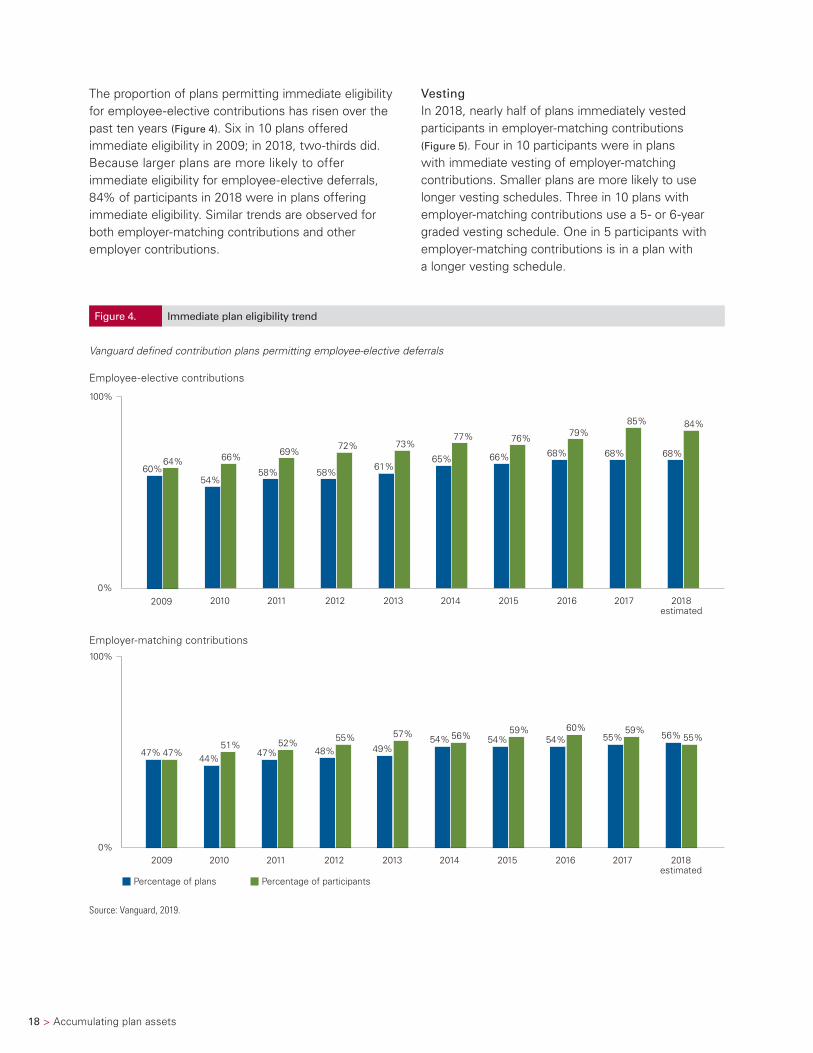
The proportion of plans permitting immediate eligibility for employee-elective contributions has risen over the past ten years (Figure 4). Six in 10 plans offered immediate eligibility in 2009; in 2018, two-thirds did. Because larger plans are more likely to offer immediate eligibility for employee-elective deferrals, 84% of participants in 2018 were in plans offering immediate eligibility. Similar trends are observed for both employer-matching contributions and other employer contributions.
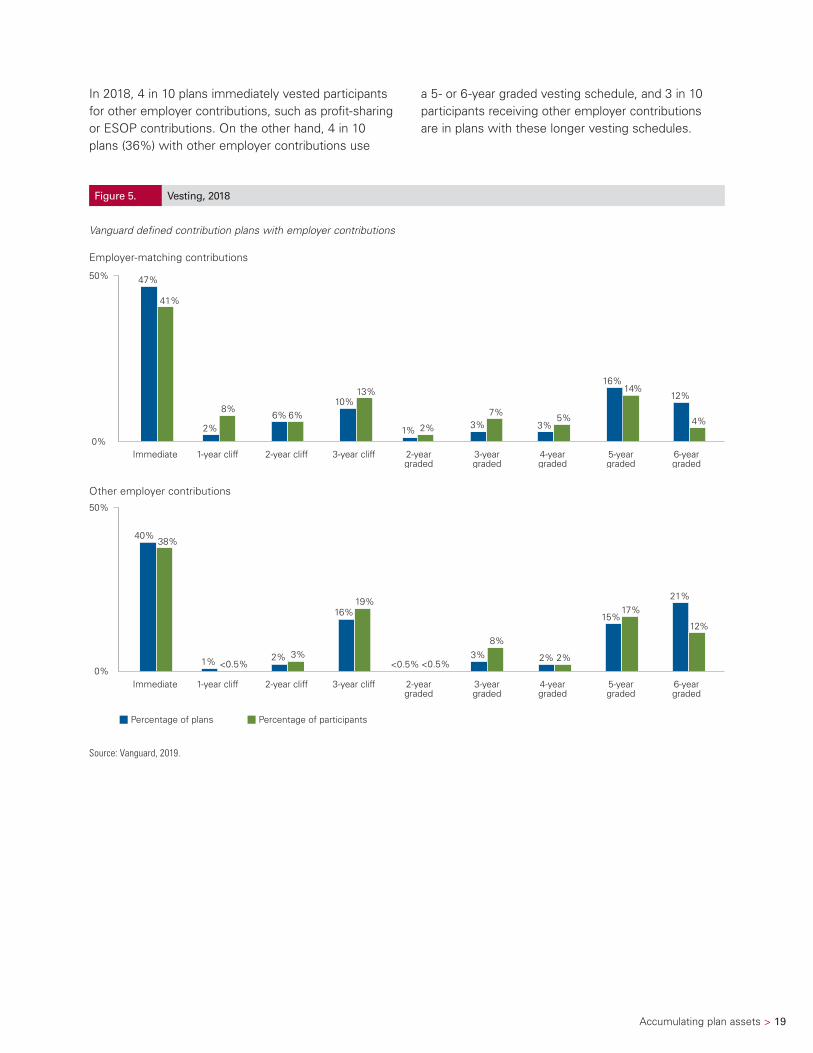
VestingIn 2018, nearly half of plans immediately vested participants in employer-matching contributions (Figure 5). Four in 10 participants were in plans with immediate vesting of employer-matching contributions. Smaller plans are more likely to use longer vesting schedules. Three in 10 plans with employer-matching contributions use a 5- or 6-year graded vesting schedule. One in 5 participants with employer-matching contributions is in a plan with a longer vesting schedule.
Figure 4. Immediate plan eligibility trend
Vanguard defined contribution plans permitting employee-elective deferrals
Employee-elective contributions
60% 64%
2009
P2 a
54% 58% 58%
61% 65% 66% 68% 68% 68% 66% 69%
72% 73% 77% 76% 79%
85% 84%
100%
0% 2010 2011 2012 2013 2014 2015 2016 2017 2018
estimated
Employer-matching contributions
47% 47%
2009
44% 47% 48% 49%
54% 54% 54% 55% 56% 51% 52% 55% 57% 56%
59% 60% 59% 55%
0% 2010 2011 2012 2013 2014 2015 2016 2017 2018
estimatedPercentage of plans Percentage of participants
100%
Source: Vanguard, 2019.
Accumulating plan assets > 19
In 2018, 4 in 10 plans immediately vested participants for other employer contributions, such as profit-sharing or ESOP contributions. On the other hand, 4 in 10 plans (36%) with other employer contributions use
a 5- or 6-year graded vesting schedule, and 3 in 10 participants receiving other employer contributions are in plans with these longer vesting schedules.
Figure 5. Vesting, 2018
Vanguard defined contribution plans with employer contributions
Employer-matching contributions
Immediate 1-year cliff 2-year cliff 3-year cliff 2-yeargraded
3-yeargraded
4-yeargraded
5-yeargraded
6-yeargraded
50%
0%
47%
2%6%
10%
1% 3% 3%
16%
12%
41%
8%6%
13%
2%
7%5%
14%
4%
Other employer contributions
Percentage of plans Percentage of participants
Immediate 1-year cliff 2-year cliff 3-year cliff 2-yeargraded
3-yeargraded
4-yeargraded
5-yeargraded
6-yeargraded
50%
0%
40%
1% <0.5%2%2%
16% 15%
<0.5%3%
8%
2%
38%
3%
19% 21%
<0.5%
17%
12%
Source: Vanguard, 2019.
20 > Accumulating plan assets
Employer contributions
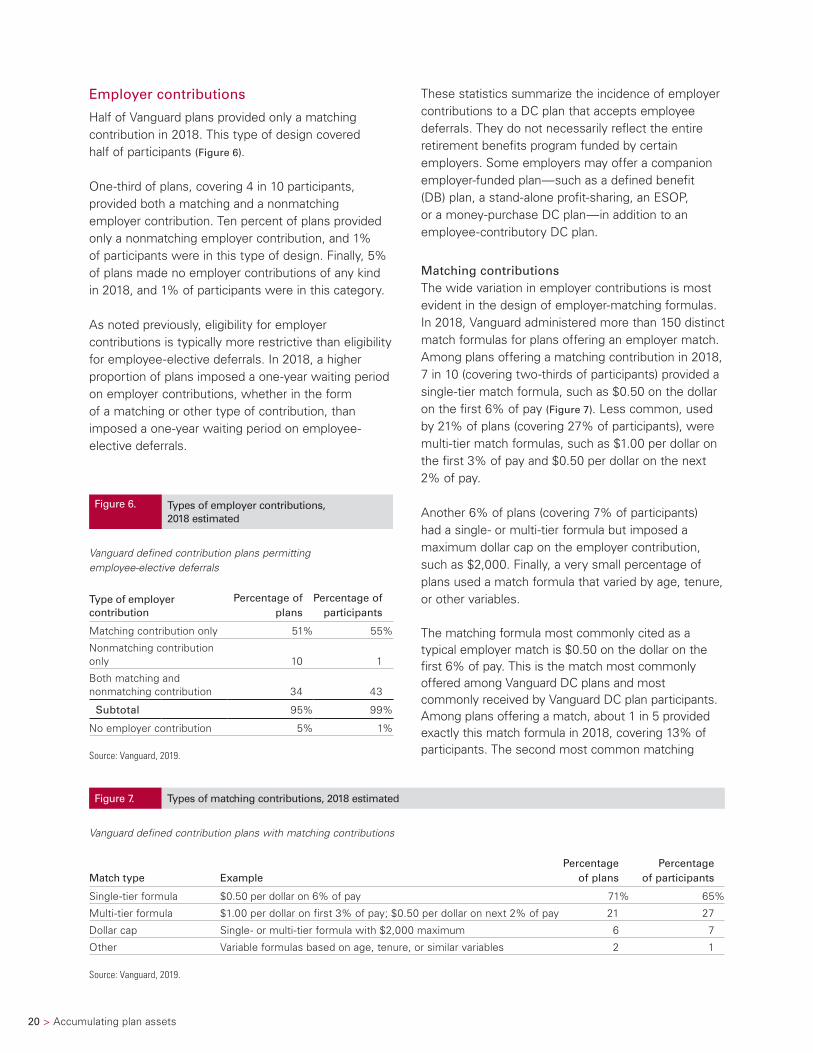
Half of Vanguard plans provided only a matching contribution in 2018. This type of design covered half of participants (Figure 6).
One-third of plans, covering 4 in 10 participants, provided both a matching and a nonmatching employer contribution. Ten percent of plans provided only a nonmatching employer contribution, and 1% of participants were in this type of design. Finally, 5% of plans made no employer contributions of any kind in 2018, and 1% of participants were in this category.
As noted previously, eligibility for employer contributions is typically more restrictive than eligibility for employee-elective deferrals. In 2018, a higher proportion of plans imposed a one-year waiting period on employer contributions, whether in the form of a matching or other type of contribution, than imposed a one-year waiting period on employee-elective deferrals.
These statistics summarize the incidence of employer contributions to a DC plan that accepts employee deferrals. They do not necessarily reflect the entire retirement benefits program funded by certain employers. Some employers may offer a companion employer-funded plan—such as a defined benefit (DB) plan, a stand-alone profit-sharing, an ESOP, or a money-purchase DC plan—in addition to an employee-contributory DC plan.
Matching contributionsThe wide variation in employer contributions is most evident in the design of employer-matching formulas. In 2018, Vanguard administered more than 150 distinct match formulas for plans offering an employer match. Among plans offering a matching contribution in 2018, 7 in 10 (covering two-thirds of participants) provided a single-tier match formula, such as $0.50 on the dollar on the first 6% of pay (Figure 7). Less common, used by 21% of plans (covering 27% of participants), were multi-tier match formulas, such as $1.00 per dollar on the first 3% of pay and $0.50 per dollar on the next 2% of pay.
Another 6% of plans (covering 7% of participants) had a single- or multi-tier formula but imposed a maximum dollar cap on the employer contribution, such as $2,000. Finally, a very small percentage of plans used a match formula that varied by age, tenure, or other variables.
The matching formula most commonly cited as a typical employer match is $0.50 on the dollar on the first 6% of pay. This is the match most commonly offered among Vanguard DC plans and most commonly received by Vanguard DC plan participants. Among plans offering a match, about 1 in 5 provided exactly this match formula in 2018, covering 13% of participants. The second most common matching
Figure 6. Types of employer contributions, 2018 estimated
Vanguard defined contribution plans permitting employee-elective deferrals
Type of employer contribution
Percentage of plans
Percentage of participants
Matching contribution only 51% 55%
Nonmatching contribution only 10 1
Both matching and nonmatching contribution 34 43
Subtotal 95% 99%
No employer contribution 5% 1%
Source: Vanguard, 2019.
Figure 7. Types of matching contributions, 2018 estimated
Vanguard defined contribution plans with matching contributions
Match type ExamplePercentage
of plansPercentage
of participants
Single-tier formula $0.50 per dollar on 6% of pay 71% 65%
Multi-tier formula $1.00 per dollar on first 3% of pay; $0.50 per dollar on next 2% of pay 21 27
Dollar cap Single- or multi-tier formula with $2,000 maximum 6 7
Other Variable formulas based on age, tenure, or similar variables 2 1
Source: Vanguard, 2019.
Accumulating plan assets > 21
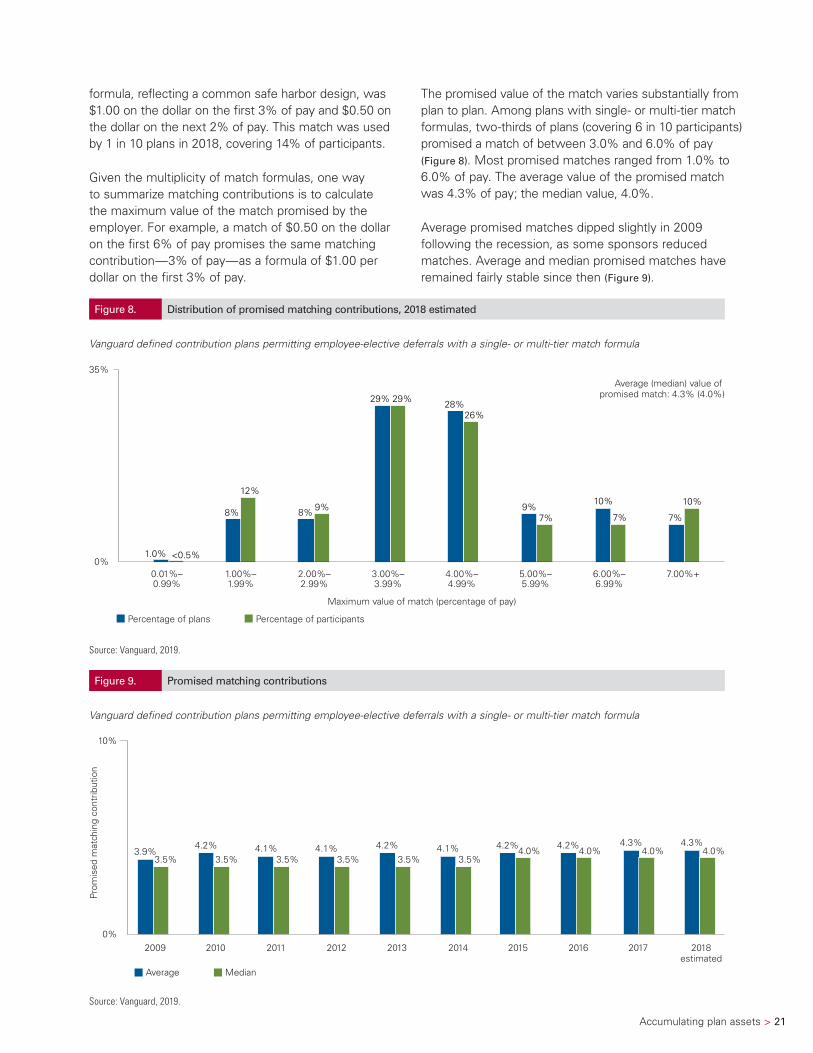
formula, reflecting a common safe harbor design, was $1.00 on the dollar on the first 3% of pay and $0.50 on the dollar on the next 2% of pay. This match was used by 1 in 10 plans in 2018, covering 14% of participants.
Given the multiplicity of match formulas, one way to summarize matching contributions is to calculate the maximum value of the match promised by the employer. For example, a match of $0.50 on the dollar on the first 6% of pay promises the same matching contribution—3% of pay—as a formula of $1.00 per dollar on the first 3% of pay.
The promised value of the match varies substantially from plan to plan. Among plans with single- or multi-tier match formulas, two-thirds of plans (covering 6 in 10 participants) promised a match of between 3.0% and 6.0% of pay (Figure 8). Most promised matches ranged from 1.0% to 6.0% of pay. The average value of the promised match was 4.3% of pay; the median value, 4.0%.
Average promised matches dipped slightly in 2009 following the recession, as some sponsors reduced matches. Average and median promised matches have remained fairly stable since then (Figure 9).
Figure 8. Distribution of promised matching contributions, 2018 estimated
Vanguard defined contribution plans permitting employee-elective deferrals with a single- or multi-tier match formula
1.0%
8%10%
8% 9%7%
29% 28%
9%10%
<0.5%
12%
29%
26%
7% 7%
Percentage of plans Percentage of participants
Maximum value of match (percentage of pay)
0.01%–0.99%
1.00%–1.99%
2.00%–2.99%
3.00%–3.99%
4.00%–4.99%
5.00%–5.99%
6.00%–6.99%
7.00%+
35%
0%
Average (median) value of promised match: 4.3% (4.0%)
Source: Vanguard, 2019.
Figure 9. Promised matching contributions
Vanguard defined contribution plans permitting employee-elective deferrals with a single- or multi-tier match formula
4.2%4.0%
Average Median
10%
0%
3.9% 4.1%4.2% 4.1% 4.2% 4.1% 4.2%3.5%
4.0%3.5% 3.5%3.5% 3.5%3.5%
2009 2010 2011 2012 2013 2014 2015 2016
Prom
ised
mat
chin
g co
ntrib
utio
n
2017
4.3%4.0%
2018estimated
4.3%4.0%
Source: Vanguard, 2019.
22 > Accumulating plan assets
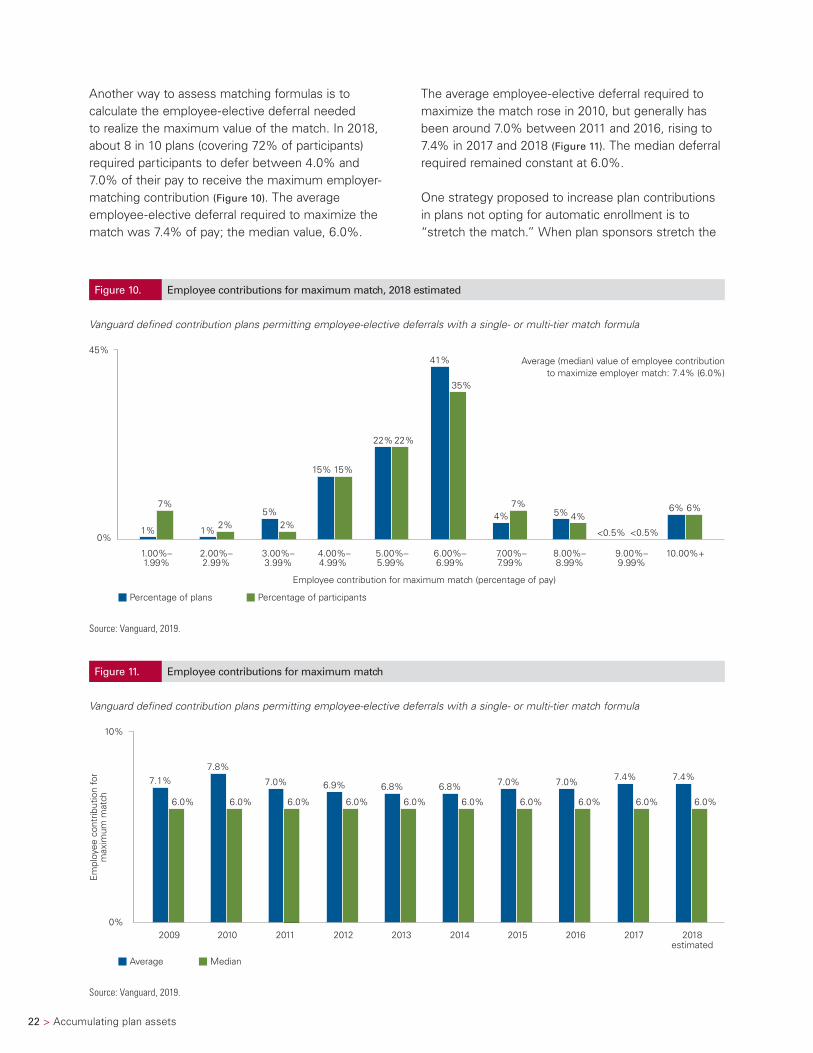
Another way to assess matching formulas is to calculate the employee-elective deferral needed to realize the maximum value of the match. In 2018, about 8 in 10 plans (covering 72% of participants) required participants to defer between 4.0% and 7.0% of their pay to receive the maximum employer-matching contribution (Figure 10). The average employee-elective deferral required to maximize the match was 7.4% of pay; the median value, 6.0%.
The average employee-elective deferral required to maximize the match rose in 2010, but generally has been around 7.0% between 2011 and 2016, rising to 7.4% in 2017 and 2018 (Figure 11). The median deferral required remained constant at 6.0%.
One strategy proposed to increase plan contributions in plans not opting for automatic enrollment is to “stretch the match.” When plan sponsors stretch the
Figure 10. Employee contributions for maximum match, 2018 estimated
Vanguard defined contribution plans permitting employee-elective deferrals with a single- or multi-tier match formula
Employee contribution for maximum match (percentage of pay)
Average (median) value of employee contribution to maximize employer match: 7.4% (6.0%)
Percentage of plans Percentage of participants
1.00%–1.99%
2.00%–2.99%
3.00%–3.99%
4.00%–4.99%
5.00%–5.99%
6.00%–6.99%
7.00%–7.99%
8.00%–8.99%
9.00%–9.99%
10.00%+
1% 2%2%5% 4%
1%
4%6%
15%
22%
41%
7%5%
15%
22%
35%
6%
45%
0% <0.5% <0.5%
7%
Source: Vanguard, 2019.
Figure 11. Employee contributions for maximum match
Vanguard defined contribution plans permitting employee-elective deferrals with a single- or multi-tier match formula
7.4%
6.0%
P9
Average Median
10%
0%
6.9%7.1%7.8%
7.0% 6.8% 6.8% 7.0%
6.0% 6.0% 6.0% 6.0% 6.0% 6.0% 6.0%
2009 2010 2011 2012 2013 2014 2015 2016
Em
ploy
ee c
ontr
ibut
ion
for
max
imum
mat
ch
7.0%
6.0%
2017
7.4%
6.0%
2018estimated
Source: Vanguard, 2019.
Accumulating plan assets > 23
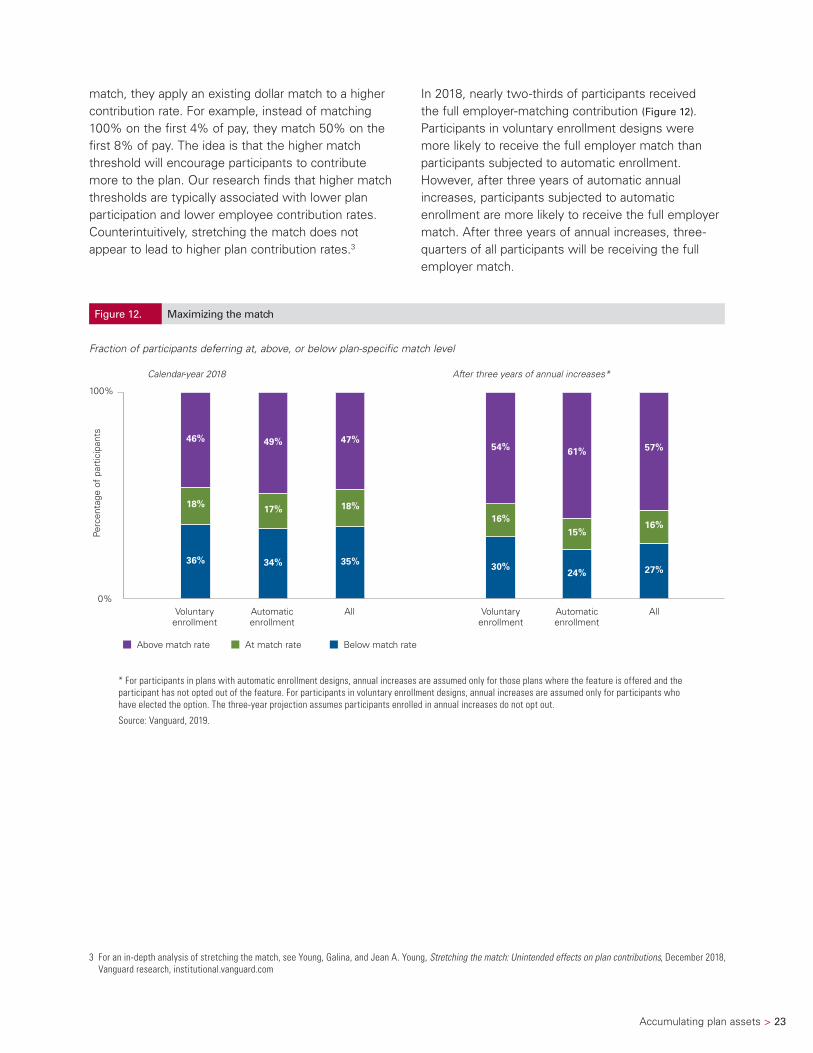
match, they apply an existing dollar match to a higher contribution rate. For example, instead of matching 100% on the first 4% of pay, they match 50% on the first 8% of pay. The idea is that the higher match threshold will encourage participants to contribute more to the plan. Our research finds that higher match thresholds are typically associated with lower plan participation and lower employee contribution rates. Counterintuitively, stretching the match does not appear to lead to higher plan contribution rates.3
In 2018, nearly two-thirds of participants received the full employer-matching contribution (Figure 12). Participants in voluntary enrollment designs were more likely to receive the full employer match than participants subjected to automatic enrollment. However, after three years of automatic annual increases, participants subjected to automatic enrollment are more likely to receive the full employer match. After three years of annual increases, three-quarters of all participants will be receiving the full employer match.
3 For an in-depth analysis of stretching the match, see Young, Galina, and Jean A. Young, Stretching the match: Unintended effects on plan contributions, December 2018, Vanguard research, institutional.vanguard.com
Figure 12. Maximizing the match
Fraction of participants deferring at, above, or below plan-specific match level
36%
18%
46%
34%
17%
49%
35%
18%
47%
30%
16%
54%
24%
15%
61%
27%
16%
57%
0%
100%
Voluntaryenrollment
Automaticenrollment
Calendar-year 2018 After three years of annual increases*
All Voluntaryenrollment
Automaticenrollment
All
Perc
enta
ge o
f pa
rtic
ipan
ts
Above match rate At match rate Below match rate
* For participants in plans with automatic enrollment designs, annual increases are assumed only for those plans where the feature is offered and the participant has not opted out of the feature. For participants in voluntary enrollment designs, annual increases are assumed only for participants who have elected the option. The three-year projection assumes participants enrolled in annual increases do not opt out.
Source: Vanguard, 2019.
24 > Accumulating plan assets
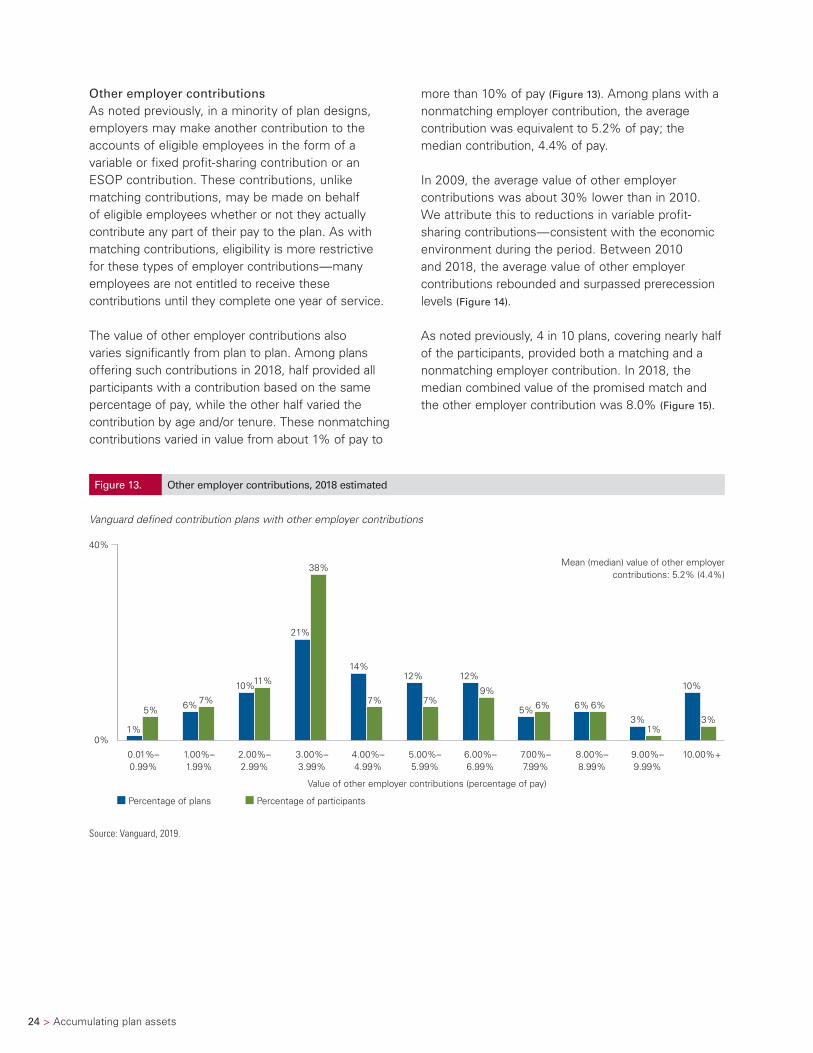
Other employer contributionsAs noted previously, in a minority of plan designs, employers may make another contribution to the accounts of eligible employees in the form of a variable or fixed profit-sharing contribution or an ESOP contribution. These contributions, unlike matching contributions, may be made on behalf of eligible employees whether or not they actually contribute any part of their pay to the plan. As with matching contributions, eligibility is more restrictive for these types of employer contributions—many employees are not entitled to receive these contributions until they complete one year of service.
The value of other employer contributions also varies significantly from plan to plan. Among plans offering such contributions in 2018, half provided all participants with a contribution based on the same percentage of pay, while the other half varied the contribution by age and/or tenure. These nonmatching contributions varied in value from about 1% of pay to
more than 10% of pay (Figure 13). Among plans with a nonmatching employer contribution, the average contribution was equivalent to 5.2% of pay; the median contribution, 4.4% of pay.
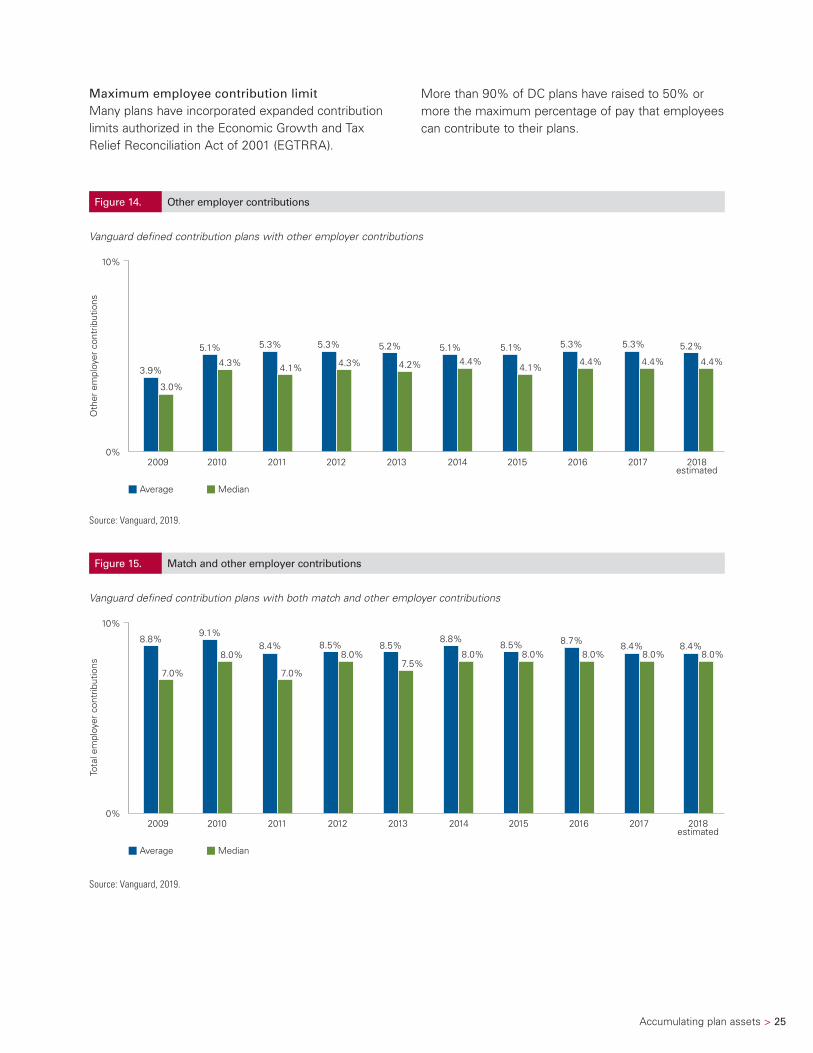
In 2009, the average value of other employer contributions was about 30% lower than in 2010. We attribute this to reductions in variable profit-sharing contributions—consistent with the economic environment during the period. Between 2010 and 2018, the average value of other employer contributions rebounded and surpassed prerecession levels (Figure 14).
As noted previously, 4 in 10 plans, covering nearly half of the participants, provided both a matching and a nonmatching employer contribution. In 2018, the median combined value of the promised match and the other employer contribution was 8.0% (Figure 15).
Figure 13. Other employer contributions, 2018 estimated
Vanguard defined contribution plans with other employer contributions
5%
Percentage of plans Percentage of participants
Value of other employer contributions (percentage of pay)
Mean (median) value of other employercontributions: 5.2% (4.4%)
0.01%–0.99%
1.00%–1.99%
2.00%–2.99%
3.00%–3.99%
4.00%–4.99%
5.00%–5.99%
6.00%–6.99%
7.00%–7.99%
8.00%–8.99%
9.00%–9.99%
10.00%+
40%
0%1%
6%
10%
21%
14%12%
6%
3% 3%
10%
7%
11%
38%
7% 7%9%
5% 6% 6%
1%
12%
Source: Vanguard, 2019.
Accumulating plan assets > 25
More than 90% of DC plans have raised to 50% or more the maximum percentage of pay that employees can contribute to their plans.
Maximum employee contribution limitMany plans have incorporated expanded contribution limits authorized in the Economic Growth and Tax Relief Reconciliation Act of 2001 (EGTRRA).
Figure 14. Other employer contributions
Vanguard defined contribution plans with other employer contributions
P11
4.4%
5.3%
4.4%
5.3%
Average Median
10%
0%
3.9%
5.3%
4.1%
5.1% 5.3% 5.2% 5.1% 5.1%
3.0%
4.3% 4.1% 4.3% 4.4%4.2%
Oth
er e
mpl
oyer
con
trib
utio
ns
2017 2018estimated
2009 2010 2011 2012 2013 2014 2015 2016
4.4%
5.2%
Source: Vanguard, 2019.
Figure 15. Match and other employer contributions
Vanguard defined contribution plans with both match and other employer contributions
8.0%8.7%
2017
8.0%8.4%
2018estimated
Average Median
10%
0%
8.8%8.4%
8.0%
9.1%8.5% 8.5%
8.8%8.5%
7.0%
8.0%
7.0%
8.0% 8.0%7.5%
2009 2010 2011 2012 2013 2014 2015 2016
Tota
l em
ploy
er c
ontr
ibut
ions
8.0%8.4%
Source: Vanguard, 2019.
26 > Accumulating plan assets
Automatic enrollment designs
In a typical 401(k) or 403(b) plan, employees must make an active choice to join the plan. The enrollment decision is framed as a positive election: “Decide if you’d like to join the plan.” Why do employees fail to take advantage of their employers’ plans? Research in the field of behavioral finance provides a number of explanations:
• Lack of planning skills. Some employees are not active, motivated decision-makers when it comes to retirement planning. They have weak planning skills and find it difficult to defer gratification.
• Default decisions. Faced with a complex choice and unsure what to do, many individuals often take the default or “no decision” choice. In the case of a voluntary savings plan, which requires that a participant take action to sign up, the “no decision” choice is a decision not to contribute to the plan.
• Inertia and procrastination. Many individuals deal with a difficult choice by deferring it to another day. Eligible nonparticipants, unsure of what to do, decide to postpone their decision. While many employees know they are not saving enough and express an interest in saving more, they simply never get around to joining the plan or, if they do join, to increasing their contribution rates over time.
Automatic enrollment or autopilot plan designs reframe the savings decision. With an autopilot design, individuals are automatically enrolled into the plan, their deferral rates are automatically increased each year, and their contributions are automatically invested in a balanced investment strategy. Under an autopilot plan, the decision to save is framed negatively: “Quit the plan if you like.” In such a design, “doing nothing” leads to participation in the plan and investment of assets in a long-term retirement portfolio.
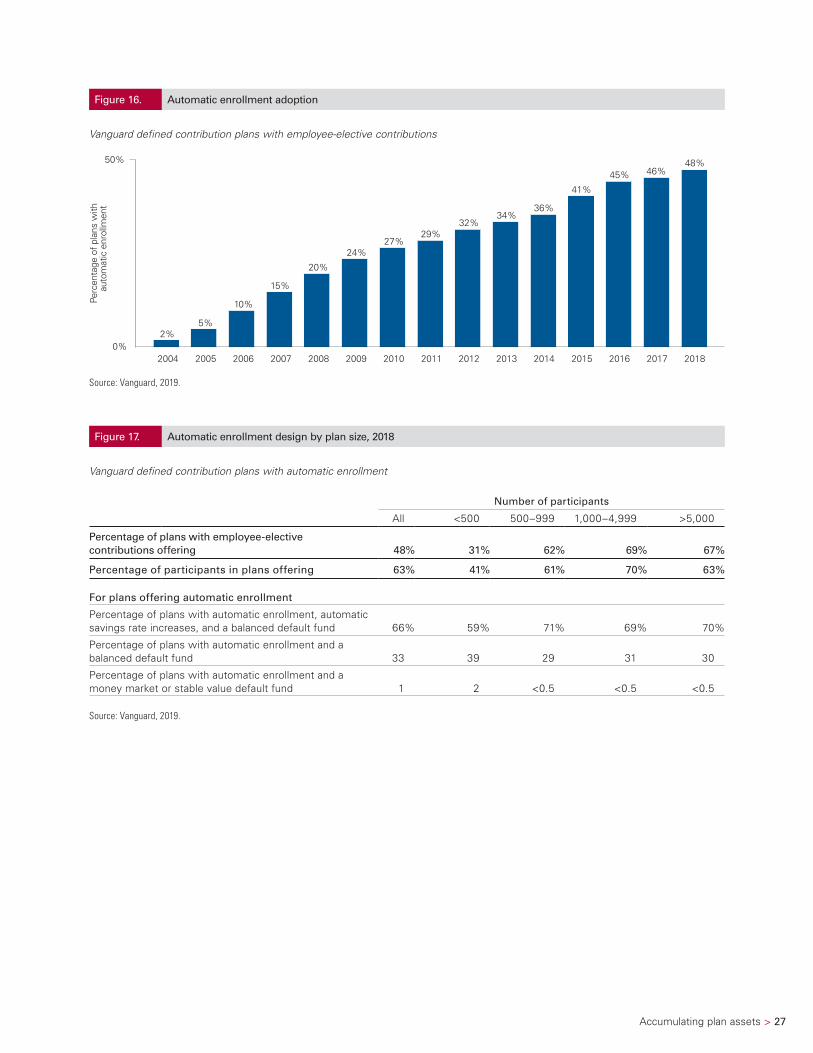
As of December 2018, 48% of Vanguard plans permitting employee-elective deferrals had adopted components of an autopilot design (Figure 16). Larger plans are more likely to implement automatic enrollment, with more than two-thirds of larger plans using the feature. As a result, nearly two-thirds of participants are now in plans with autopilot designs, although automatic enrollment itself may only apply to newly eligible participants (Figure 17).
Approximately half of these plans have now “swept” eligible nonparticipants—they implemented automatic enrollment for all nonparticipating employees. The remaining half have implemented automatic enrollment for new hires only. Adoption of automatic enrollment designs grew only modestly in 2018, and by the end of 2018, nearly two-thirds of plans with more than 500 participants had added the feature.
Accumulating plan assets > 27
Figure 16. Automatic enrollment adoption
Vanguard defined contribution plans with employee-elective contributions
50%
0%
Perc
enta
ge o
f pla
ns w
ithau
tom
atic
enr
ollm
ent
2004 2005 2006 2007 2008 2009 2010 2011 2012 2013 2014 2015 2016 2017 2018
2% 5%
10%
15%
20%
24% 27%
29% 32%
34% 36%
41%
45% 46% 48%
Source: Vanguard, 2019.
Figure 17. Automatic enrollment design by plan size, 2018
Vanguard defined contribution plans with automatic enrollment
Number of participants
All <500 500–999 1,000–4,999 >5,000
Percentage of plans with employee-elective contributions offering 48% 31% 62% 69% 67%
Percentage of participants in plans offering 63% 41% 61% 70% 63%
For plans offering automatic enrollment
Percentage of plans with automatic enrollment, automatic savings rate increases, and a balanced default fund 66% 59% 71% 69% 70%
Percentage of plans with automatic enrollment and a balanced default fund 33 39 29 31 30
Percentage of plans with automatic enrollment and a money market or stable value default fund 1 2 <0.5 <0.5 <0.5
Source: Vanguard, 2019.
28 > Accumulating plan assets
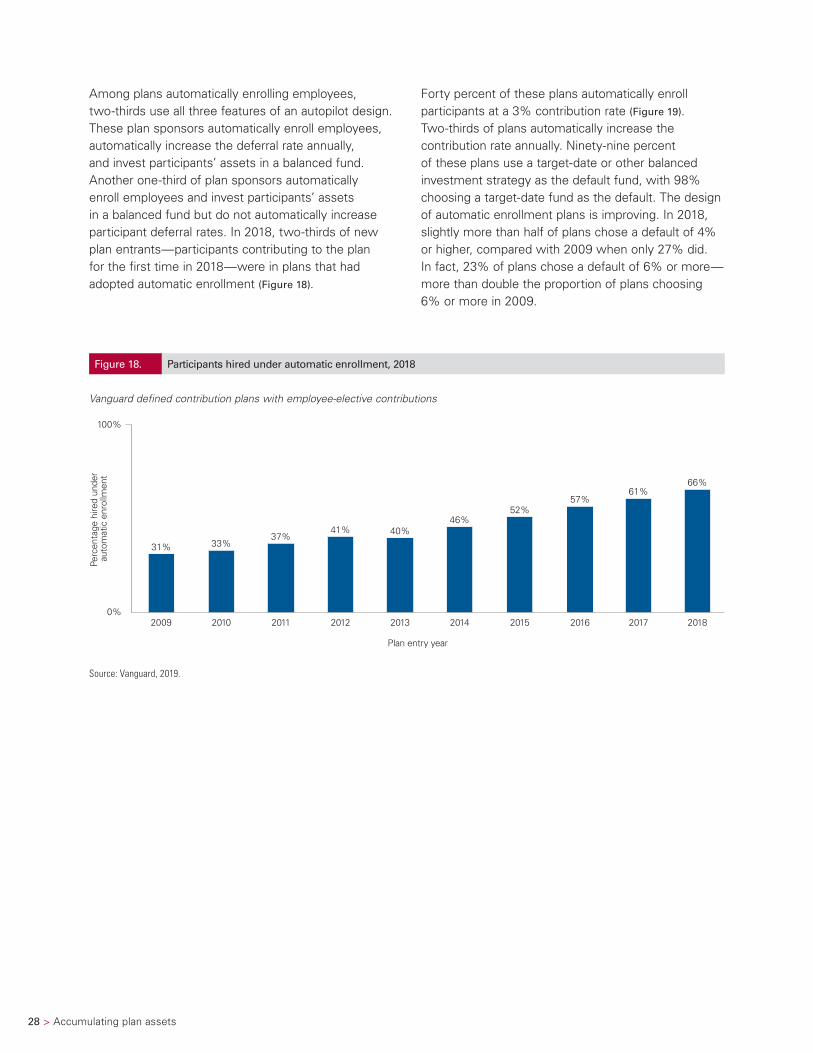
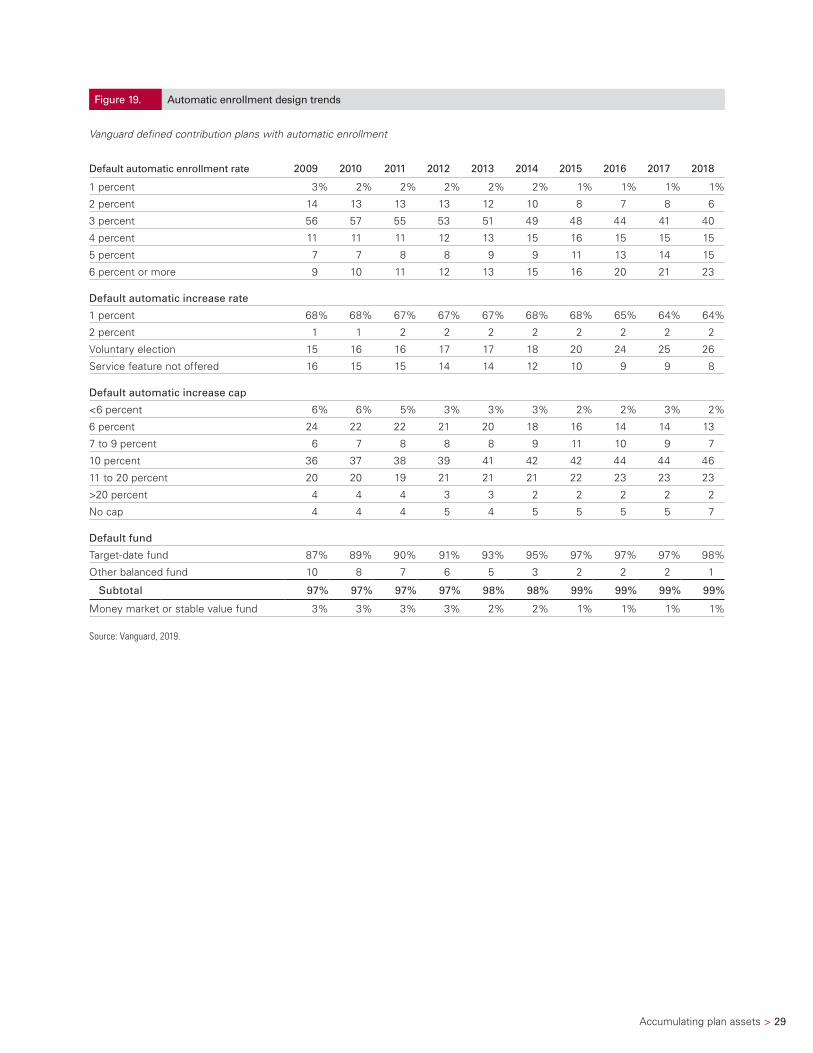
Forty percent of these plans automatically enroll participants at a 3% contribution rate (Figure 19). Two-thirds of plans automatically increase the contribution rate annually. Ninety-nine percent of these plans use a target-date or other balanced investment strategy as the default fund, with 98% choosing a target-date fund as the default. The design of automatic enrollment plans is improving. In 2018, slightly more than half of plans chose a default of 4% or higher, compared with 2009 when only 27% did. In fact, 23% of plans chose a default of 6% or more—more than double the proportion of plans choosing 6% or more in 2009.
Among plans automatically enrolling employees, two-thirds use all three features of an autopilot design. These plan sponsors automatically enroll employees, automatically increase the deferral rate annually, and invest participants’ assets in a balanced fund. Another one-third of plan sponsors automatically enroll employees and invest participants’ assets in a balanced fund but do not automatically increase participant deferral rates. In 2018, two-thirds of new plan entrants—participants contributing to the plan for the first time in 2018—were in plans that had adopted automatic enrollment (Figure 18).
Figure 18. Participants hired under automatic enrollment, 2018
Vanguard defined contribution plans with employee-elective contributions
Perc
enta
ge h
ired
unde
r au
tom
atic
enr
ollm
ent
31% 33%37%
41% 40%46%
52%
100%
0% 2009 2010 2011 2012 2013 2014 2015 2016
Plan entry year
57%61%
2017
66%
2018
Source: Vanguard, 2019.
Accumulating plan assets > 29
Figure 19. Automatic enrollment design trends
Vanguard defined contribution plans with automatic enrollment
Default automatic enrollment rate 2009 2010 2011 2012 2013 2014 2015 2016 2017 2018
1 percent 3% 2% 2% 2% 2% 2% 1% 1% 1% 1%
2 percent 14 13 13 13 12 10 8 7 8 6
3 percent 56 57 55 53 51 49 48 44 41 40
4 percent 11 11 11 12 13 15 16 15 15 15
5 percent 7 7 8 8 9 9 11 13 14 15
6 percent or more 9 10 11 12 13 15 16 20 21 23
Default automatic increase rate
1 percent 68% 68% 67% 67% 67% 68% 68% 65% 64% 64%
2 percent 1 1 2 2 2 2 2 2 2 2
Voluntary election 15 16 16 17 17 18 20 24 25 26
Service feature not offered 16 15 15 14 14 12 10 9 9 8
Default automatic increase cap
<6 percent 6% 6% 5% 3% 3% 3% 2% 2% 3% 2%
6 percent 24 22 22 21 20 18 16 14 14 13
7 to 9 percent 6 7 8 8 8 9 11 10 9 7
10 percent 36 37 38 39 41 42 42 44 44 46
11 to 20 percent 20 20 19 21 21 21 22 23 23 23
>20 percent 4 4 4 3 3 2 2 2 2 2
No cap 4 4 4 5 4 5 5 5 5 7
Default fund
Target-date fund 87% 89% 90% 91% 93% 95% 97% 97% 97% 98%
Other balanced fund 10 8 7 6 5 3 2 2 2 1
Subtotal 97% 97% 97% 97% 98% 98% 99% 99% 99% 99%
Money market or stable value fund 3% 3% 3% 3% 2% 2% 1% 1% 1% 1%
Source: Vanguard, 2019.
30 > Accumulating plan assets
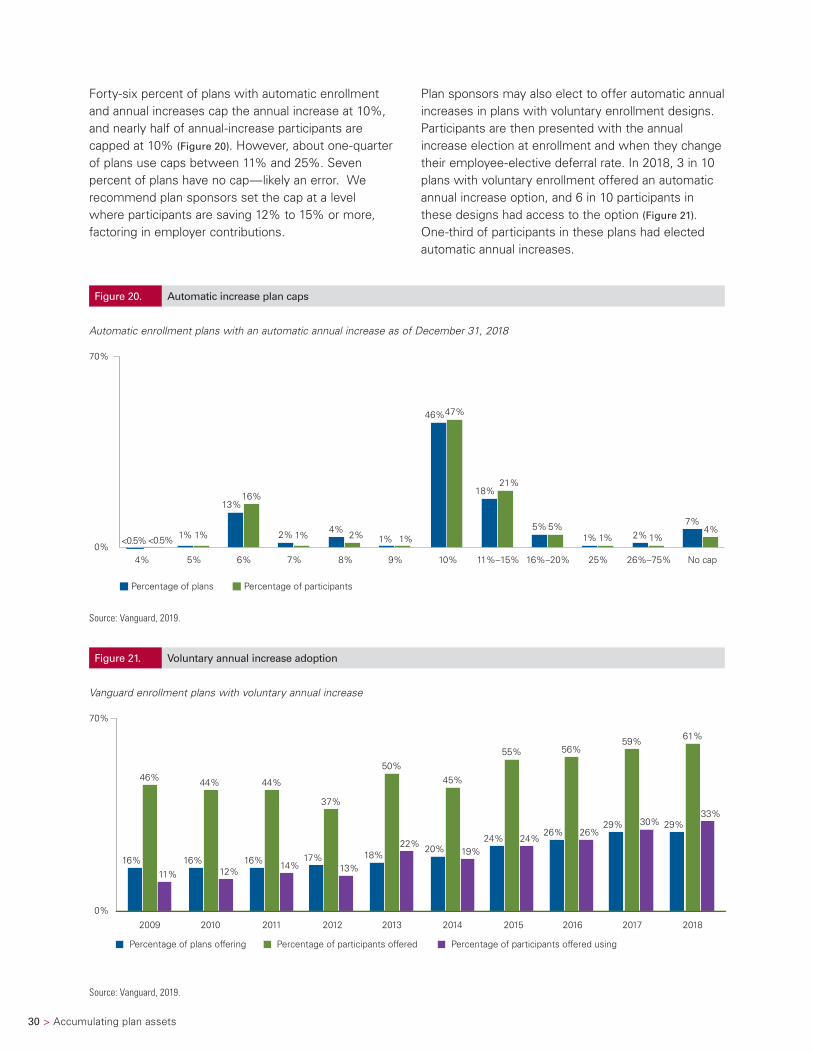
Forty-six percent of plans with automatic enrollment and annual increases cap the annual increase at 10%, and nearly half of annual-increase participants are capped at 10% (Figure 20). However, about one-quarter of plans use caps between 11% and 25%. Seven percent of plans have no cap—likely an error. We recommend plan sponsors set the cap at a level where participants are saving 12% to 15% or more, factoring in employer contributions.
Plan sponsors may also elect to offer automatic annual increases in plans with voluntary enrollment designs. Participants are then presented with the annual increase election at enrollment and when they change their employee-elective deferral rate. In 2018, 3 in 10 plans with voluntary enrollment offered an automatic annual increase option, and 6 in 10 participants in these designs had access to the option (Figure 21). One-third of participants in these plans had elected automatic annual increases.
Figure 21. Voluntary annual increase adoption
Vanguard enrollment plans with voluntary annual increase
Percentage of plans offering
Percentage of participants offered
Percentage of participants offered using
2009 2010 2011 2012 2013 2014 2015 2016 2017 2018
70%
0%
16% 16% 16% 17% 18%20%
46% 44% 44%
37%
50%45%
11% 12%14% 13%
22%19%
24%
55%
24%26%
56%
26%29%
59%
30% 29%
61%
33%
Source: Vanguard, 2019.
Figure 20. Automatic increase plan caps
Automatic enrollment plans with an automatic annual increase as of December 31, 2018
<0.5%<0.5%
4%
1% 1%
5%
13%16%
6%
2% 1%
7%
4%2%
8%
1% 1%
9%
46%47%
10%
18%21%
11%–15%
5% 5%
16%–20%
1% 1%4%
25%
2% 1%
26%–75%
7%
No cap
Percentage of plans Percentage of participants
70%
0%
Source: Vanguard, 2019.
Accumulating plan assets > 31
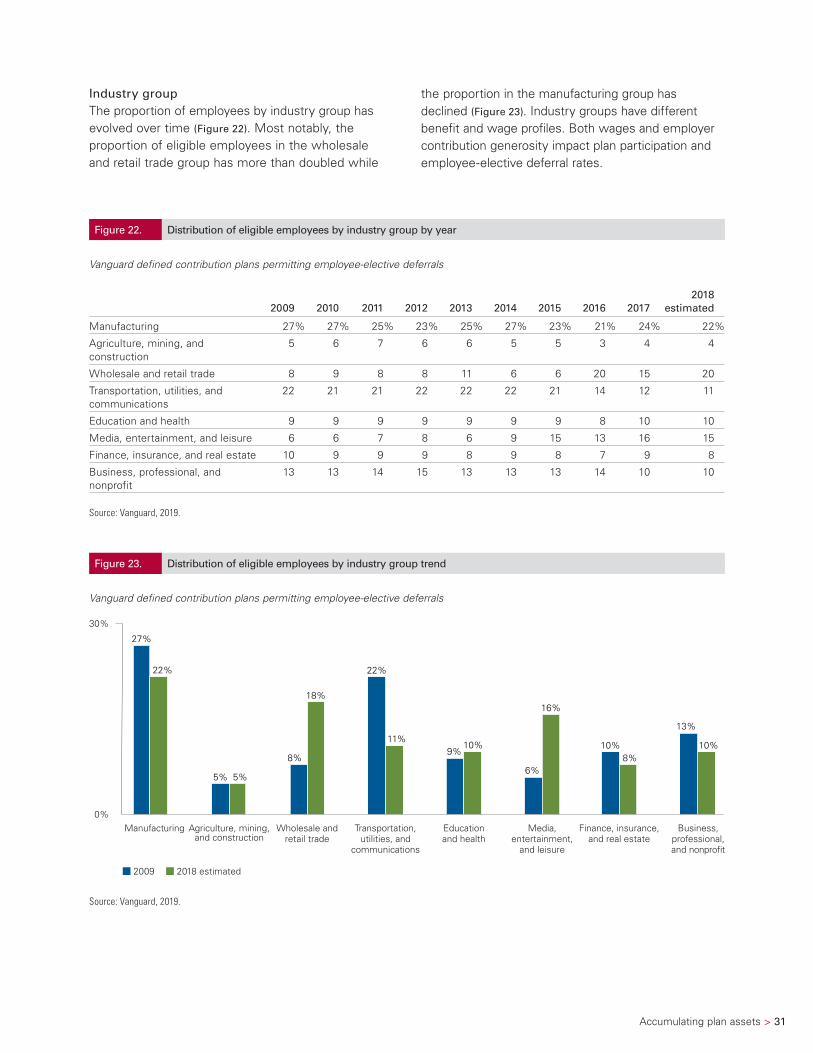
Industry groupThe proportion of employees by industry group has evolved over time (Figure 22). Most notably, the proportion of eligible employees in the wholesale and retail trade group has more than doubled while
the proportion in the manufacturing group has declined (Figure 23). Industry groups have different benefit and wage profiles. Both wages and employer contribution generosity impact plan participation and employee-elective deferral rates.
Figure 23. Distribution of eligible employees by industry group trend
Vanguard defined contribution plans permitting employee-elective deferrals
2009 2018 estimated
30%
0% Manufacturing Agriculture, mining,
and construction
27%
5%
22%
9%8%
6%
22%
5%
18%
11%10%
16%
10%8%
Business,professional,and nonpro�t
Finance, insurance,and real estate
Media,entertainment,
and leisure
Educationand health
Transportation,utilities, and
communications
Wholesale andretail trade
13%
10%
Source: Vanguard, 2019.
Figure 22. Distribution of eligible employees by industry group by year
Vanguard defined contribution plans permitting employee-elective deferrals
2009 2010 2011 2012 2013 2014 2015 2016 20172018
estimated
Manufacturing 27% 27% 25% 23% 25% 27% 23% 21% 24% 22%
Agriculture, mining, and construction
5 6 7 6 6 5 5 3 4 4
Wholesale and retail trade 8 9 8 8 11 6 6 20 15 20
Transportation, utilities, and communications
22 21 21 22 22 22 21 14 12 11
Education and health 9 9 9 9 9 9 9 8 10 10
Media, entertainment, and leisure 6 6 7 8 6 9 15 13 16 15
Finance, insurance, and real estate 10 9 9 9 8 9 8 7 9 8
Business, professional, and nonprofit
13 13 14 15 13 13 13 14 10 10
Source: Vanguard, 2019.
32 > Accumulating plan assets
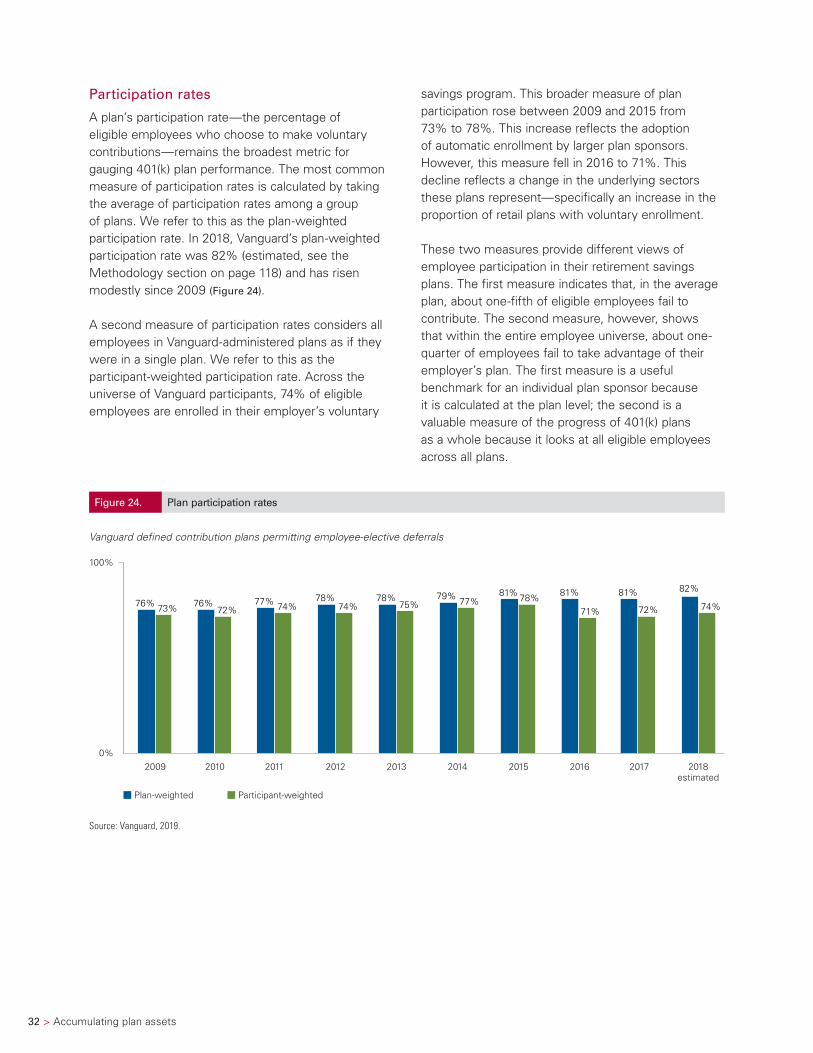
Participation rates
A plan’s participation rate—the percentage of eligible employees who choose to make voluntary contributions—remains the broadest metric for gauging 401(k) plan performance. The most common measure of participation rates is calculated by taking the average of participation rates among a group of plans. We refer to this as the plan-weighted participation rate. In 2018, Vanguard’s plan-weighted participation rate was 82% (estimated, see the Methodology section on page 118) and has risen modestly since 2009 (Figure 24).
A second measure of participation rates considers all employees in Vanguard-administered plans as if they were in a single plan. We refer to this as the participant-weighted participation rate. Across the universe of Vanguard participants, 74% of eligible employees are enrolled in their employer’s voluntary
savings program. This broader measure of plan participation rose between 2009 and 2015 from 73% to 78%. This increase reflects the adoption of automatic enrollment by larger plan sponsors. However, this measure fell in 2016 to 71%. This decline reflects a change in the underlying sectors these plans represent—specifically an increase in the proportion of retail plans with voluntary enrollment.
These two measures provide different views of employee participation in their retirement savings plans. The first measure indicates that, in the average plan, about one-fifth of eligible employees fail to contribute. The second measure, however, shows that within the entire employee universe, about one-quarter of employees fail to take advantage of their employer’s plan. The first measure is a useful benchmark for an individual plan sponsor because it is calculated at the plan level; the second is a valuable measure of the progress of 401(k) plans as a whole because it looks at all eligible employees across all plans.
Figure 24. Plan participation rates
Vanguard defined contribution plans permitting employee-elective deferrals
82%
74%
Plan-weighted Participant-weighted
100%
0% 2009 2010 2011 2012 2013 2014 2015 2016 2017
76% 77% 78% 81%76% 78% 79%
73% 72% 74% 74% 75% 77% 78% 81%
71%
2018estimated
81%
72%
Source: Vanguard, 2019.
Accumulating plan assets > 33
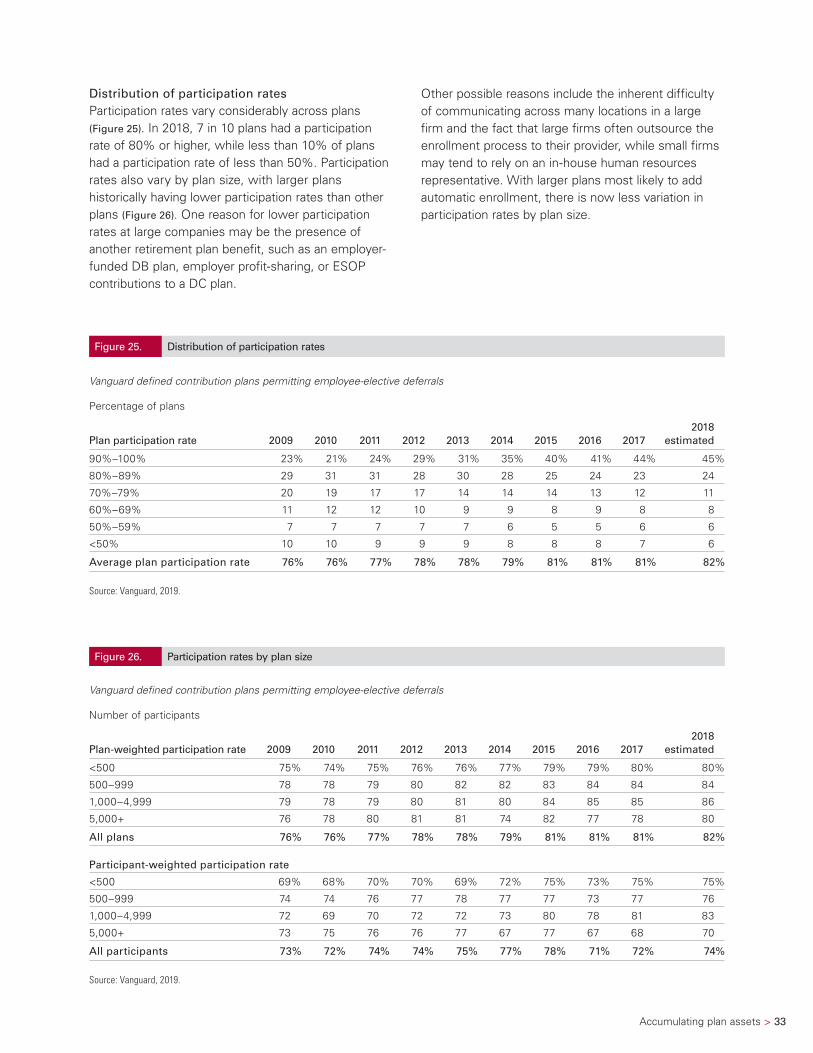
Distribution of participation ratesParticipation rates vary considerably across plans (Figure 25). In 2018, 7 in 10 plans had a participation rate of 80% or higher, while less than 10% of plans had a participation rate of less than 50%. Participation rates also vary by plan size, with larger plans historically having lower participation rates than other plans (Figure 26). One reason for lower participation rates at large companies may be the presence of another retirement plan benefit, such as an employer-funded DB plan, employer profit-sharing, or ESOP contributions to a DC plan.
Other possible reasons include the inherent difficulty of communicating across many locations in a large firm and the fact that large firms often outsource the enrollment process to their provider, while small firms may tend to rely on an in-house human resources representative. With larger plans most likely to add automatic enrollment, there is now less variation in participation rates by plan size.
Figure 25. Distribution of participation rates
Vanguard defined contribution plans permitting employee-elective deferrals
Percentage of plans
Plan participation rate 2009 2010 2011 2012 2013 2014 2015 2016 20172018
estimated
90%–100% 23% 21% 24% 29% 31% 35% 40% 41% 44% 45%
80%–89% 29 31 31 28 30 28 25 24 23 24
70%–79% 20 19 17 17 14 14 14 13 12 11
60%–69% 11 12 12 10 9 9 8 9 8 8
50%–59% 7 7 7 7 7 6 5 5 6 6
<50% 10 10 9 9 9 8 8 8 7 6
Average plan participation rate 76% 76% 77% 78% 78% 79% 81% 81% 81% 82%
Source: Vanguard, 2019.
Figure 26. Participation rates by plan size
Vanguard defined contribution plans permitting employee-elective deferrals
Number of participants
Plan-weighted participation rate 2009 2010 2011 2012 2013 2014 2015 2016 20172018
estimated
<500 75% 74% 75% 76% 76% 77% 79% 79% 80% 80%
500–999 78 78 79 80 82 82 83 84 84 84
1,000–4,999 79 78 79 80 81 80 84 85 85 86
5,000+ 76 78 80 81 81 74 82 77 78 80
All plans 76% 76% 77% 78% 78% 79% 81% 81% 81% 82%
Participant-weighted participation rate
<500 69% 68% 70% 70% 69% 72% 75% 73% 75% 75%
500–999 74 74 76 77 78 77 77 73 77 76
1,000–4,999 72 69 70 72 72 73 80 78 81 83
5,000+ 73 75 76 76 77 67 77 67 68 70
All participants 73% 72% 74% 74% 75% 77% 78% 71% 72% 74%
Source: Vanguard, 2019.
34 > Accumulating plan assets
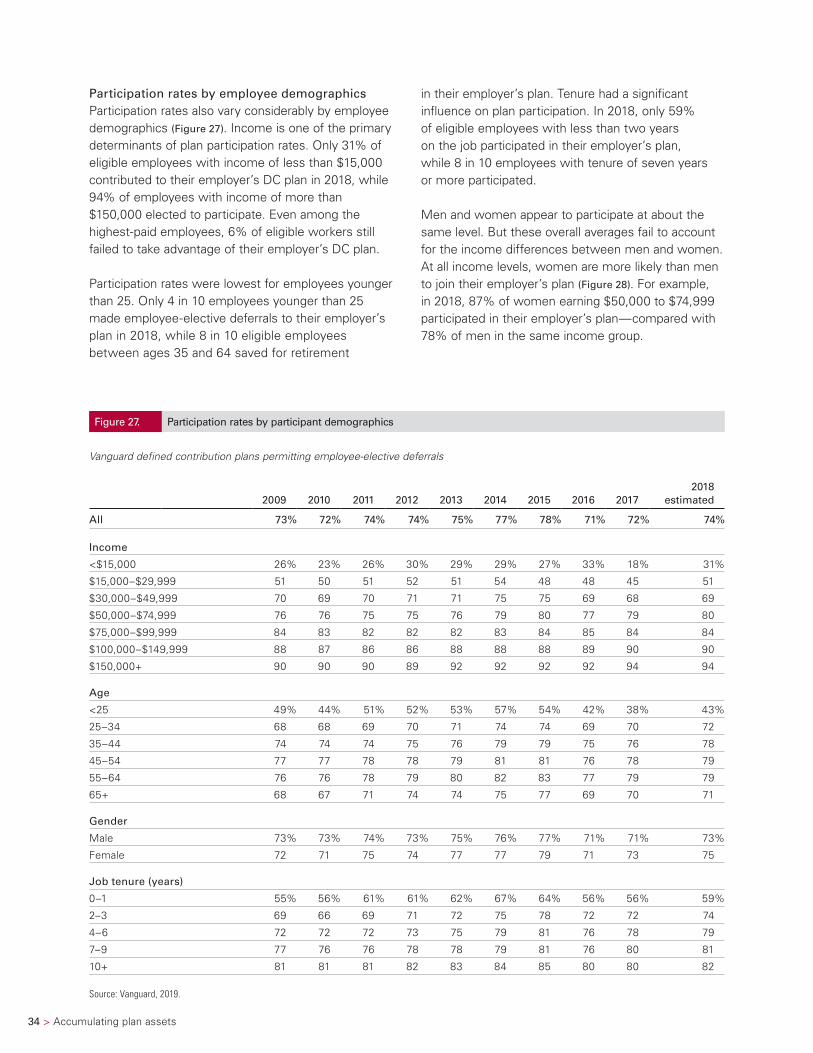
Participation rates by employee demographicsParticipation rates also vary considerably by employee demographics (Figure 27). Income is one of the primary determinants of plan participation rates. Only 31% of eligible employees with income of less than $15,000 contributed to their employer’s DC plan in 2018, while 94% of employees with income of more than $150,000 elected to participate. Even among the highest-paid employees, 6% of eligible workers still failed to take advantage of their employer’s DC plan.
Participation rates were lowest for employees younger than 25. Only 4 in 10 employees younger than 25 made employee-elective deferrals to their employer’s plan in 2018, while 8 in 10 eligible employees between ages 35 and 64 saved for retirement
in their employer’s plan. Tenure had a significant influence on plan participation. In 2018, only 59% of eligible employees with less than two years on the job participated in their employer’s plan, while 8 in 10 employees with tenure of seven years or more participated.
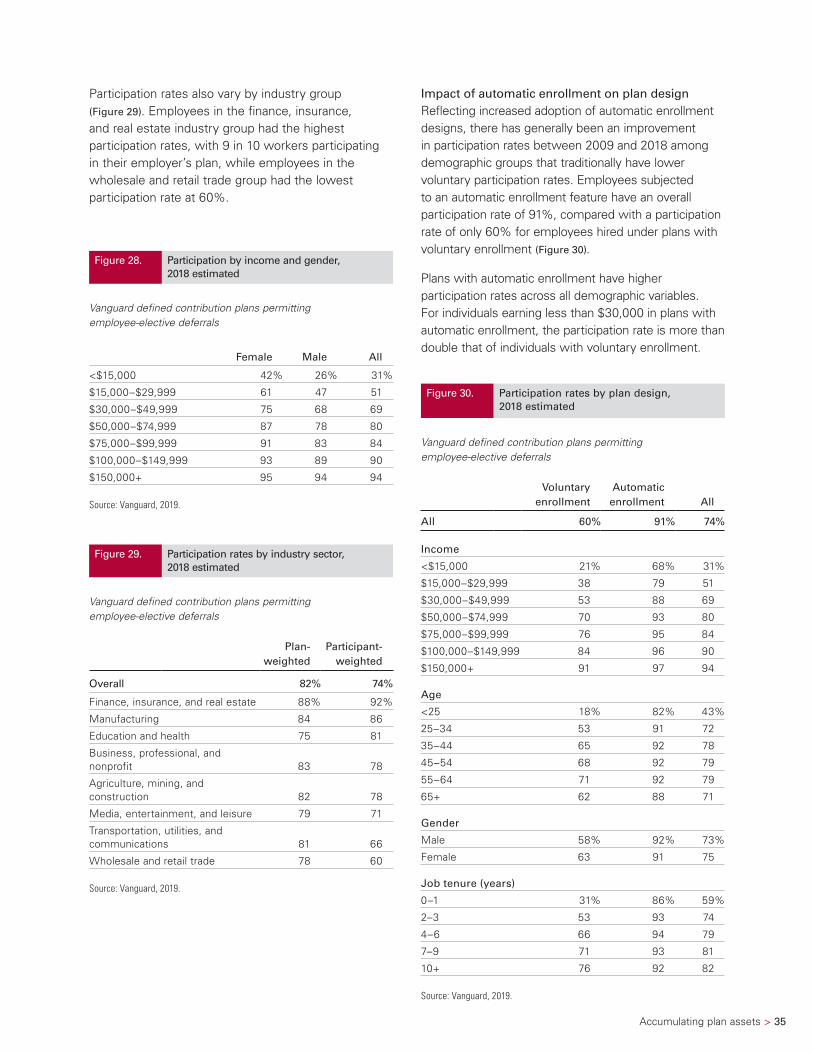
Men and women appear to participate at about the same level. But these overall averages fail to account for the income differences between men and women. At all income levels, women are more likely than men to join their employer’s plan (Figure 28). For example, in 2018, 87% of women earning $50,000 to $74,999 participated in their employer’s plan—compared with 78% of men in the same income group.
Figure 27. Participation rates by participant demographics
Vanguard defined contribution plans permitting employee-elective deferrals
2009 2010 2011 2012 2013 2014 2015 2016 20172018
estimated
All 73% 72% 74% 74% 75% 77% 78% 71% 72% 74%
Income
<$15,000 26% 23% 26% 30% 29% 29% 27% 33% 18% 31%
$15,000–$29,999 51 50 51 52 51 54 48 48 45 51
$30,000–$49,999 70 69 70 71 71 75 75 69 68 69
$50,000–$74,999 76 76 75 75 76 79 80 77 79 80
$75,000–$99,999 84 83 82 82 82 83 84 85 84 84
$100,000–$149,999 88 87 86 86 88 88 88 89 90 90
$150,000+ 90 90 90 89 92 92 92 92 94 94
Age
<25 49% 44% 51% 52% 53% 57% 54% 42% 38% 43%
25–34 68 68 69 70 71 74 74 69 70 72
35–44 74 74 74 75 76 79 79 75 76 78
45–54 77 77 78 78 79 81 81 76 78 79
55–64 76 76 78 79 80 82 83 77 79 79
65+ 68 67 71 74 74 75 77 69 70 71
Gender
Male 73% 73% 74% 73% 75% 76% 77% 71% 71% 73%
Female 72 71 75 74 77 77 79 71 73 75
Job tenure (years)
0–1 55% 56% 61% 61% 62% 67% 64% 56% 56% 59%
2–3 69 66 69 71 72 75 78 72 72 74
4–6 72 72 72 73 75 79 81 76 78 79
7–9 77 76 76 78 78 79 81 76 80 81
10+ 81 81 81 82 83 84 85 80 80 82
Source: Vanguard, 2019.
Accumulating plan assets > 35
Participation rates also vary by industry group (Figure 29). Employees in the finance, insurance, and real estate industry group had the highest participation rates, with 9 in 10 workers participating in their employer’s plan, while employees in the wholesale and retail trade group had the lowest participation rate at 60%.
Impact of automatic enrollment on plan designReflecting increased adoption of automatic enrollment designs, there has generally been an improvement in participation rates between 2009 and 2018 among demographic groups that traditionally have lower voluntary participation rates. Employees subjected to an automatic enrollment feature have an overall participation rate of 91%, compared with a participation rate of only 60% for employees hired under plans with voluntary enrollment (Figure 30).
Plans with automatic enrollment have higher participation rates across all demographic variables. For individuals earning less than $30,000 in plans with automatic enrollment, the participation rate is more than double that of individuals with voluntary enrollment.
Figure 30. Participation rates by plan design, 2018 estimated
Vanguard defined contribution plans permitting employee-elective deferrals
Voluntary enrollment
Automatic enrollment All
All 60% 91% 74%
Income
<$15,000 21% 68% 31%
$15,000–$29,999 38 79 51
$30,000–$49,999 53 88 69
$50,000–$74,999 70 93 80
$75,000–$99,999 76 95 84
$100,000–$149,999 84 96 90
$150,000+ 91 97 94
Age
<25 18% 82% 43%
25–34 53 91 72
35–44 65 92 78
45–54 68 92 79
55–64 71 92 79
65+ 62 88 71
Gender
Male 58% 92% 73%
Female 63 91 75
Job tenure (years)
0–1 31% 86% 59%
2–3 53 93 74
4–6 66 94 79
7–9 71 93 81
10+ 76 92 82
Source: Vanguard, 2019.
Figure 28. Participation by income and gender, 2018 estimated
Vanguard defined contribution plans permitting employee-elective deferrals
Female Male All
<$15,000 42% 26% 31%
$15,000–$29,999 61 47 51
$30,000–$49,999 75 68 69
$50,000–$74,999 87 78 80
$75,000–$99,999 91 83 84
$100,000–$149,999 93 89 90
$150,000+ 95 94 94
Source: Vanguard, 2019.
Figure 29. Participation rates by industry sector, 2018 estimated
Vanguard defined contribution plans permitting employee-elective deferrals
Plan- weighted
Participant- weighted
Overall 82% 74%
Finance, insurance, and real estate 88% 92%
Manufacturing 84 86
Education and health 75 81
Business, professional, and nonprofit 83 78
Agriculture, mining, and construction 82 78
Media, entertainment, and leisure 79 71
Transportation, utilities, and communications 81 66
Wholesale and retail trade 78 60
Source: Vanguard, 2019.
36 > Accumulating plan assets
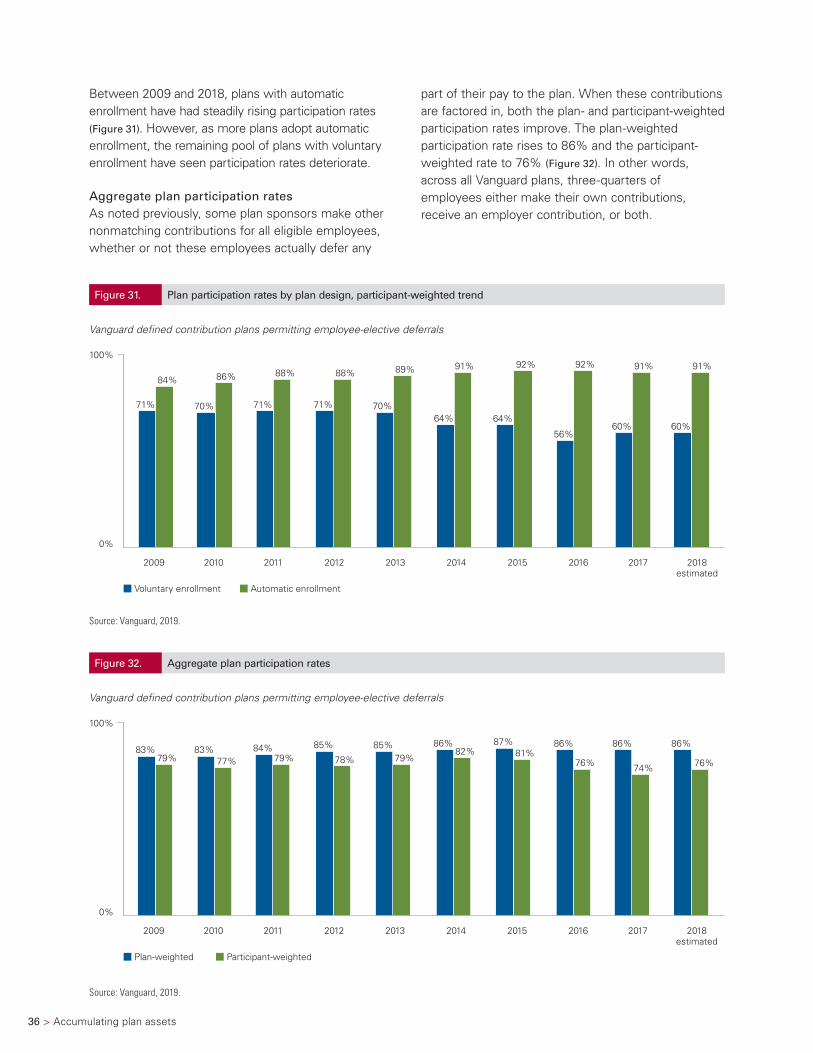
part of their pay to the plan. When these contributions are factored in, both the plan- and participant-weighted participation rates improve. The plan-weighted participation rate rises to 86% and the participant-weighted rate to 76% (Figure 32). In other words, across all Vanguard plans, three-quarters of employees either make their own contributions, receive an employer contribution, or both.
Between 2009 and 2018, plans with automatic enrollment have had steadily rising participation rates (Figure 31). However, as more plans adopt automatic enrollment, the remaining pool of plans with voluntary enrollment have seen participation rates deteriorate.
Aggregate plan participation ratesAs noted previously, some plan sponsors make other nonmatching contributions for all eligible employees, whether or not these employees actually defer any
Figure 32. Aggregate plan participation rates
Vanguard defined contribution plans permitting employee-elective deferrals
Plan-weighted Participant-weighted
100%
0%
83% 83%87%
84% 85% 85% 86%
79% 77% 79% 78% 79%82% 81%
86%
76%
86%
74%
2009 2010 2011 2012 2013 2014 2015 2016 2017 2018estimated
86%
76%
Source: Vanguard, 2019.
Figure 31. Plan participation rates by plan design, participant-weighted trend
Vanguard defined contribution plans permitting employee-elective deferrals
60%
91%
Voluntary enrollment Automatic enrollment
100%
0%
71% 70%64%
71% 71% 70%64%
84% 86% 88% 88% 89% 91% 92%
56%
92%
60%
91%
2009 2010 2011 2012 2013 2014 2015 2016 2017 2018estimated
Source: Vanguard, 2019.
Accumulating plan assets > 37
Employee deferrals
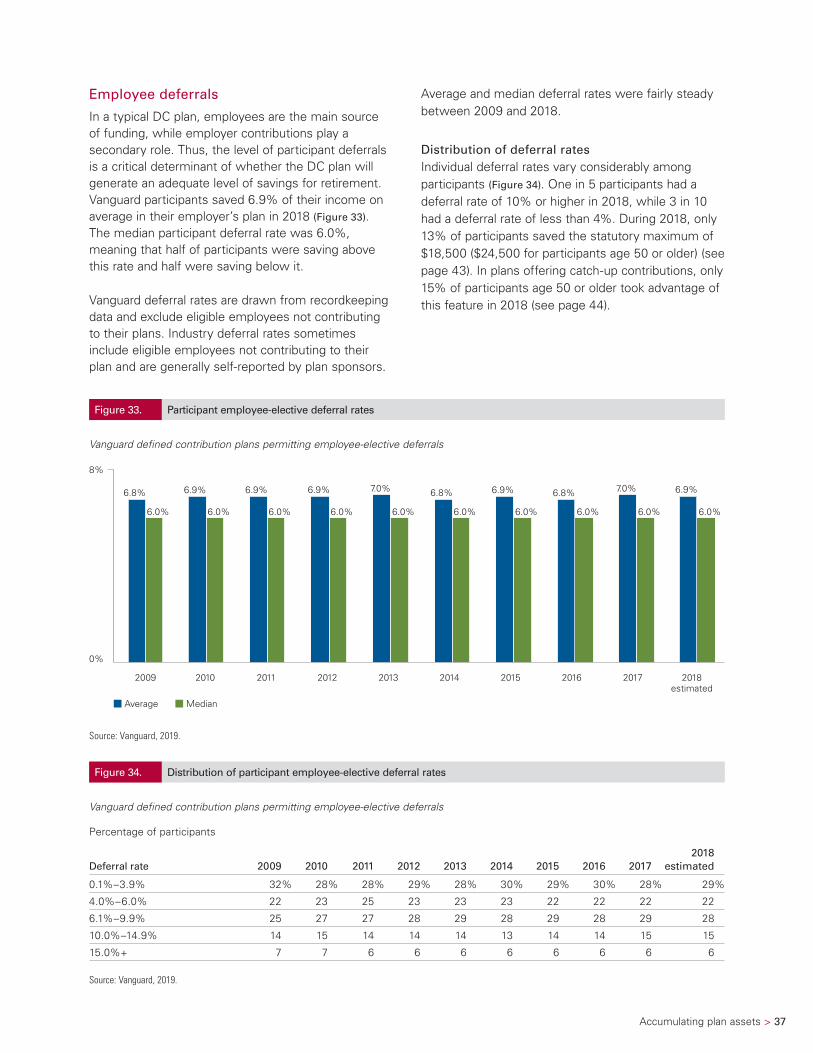
In a typical DC plan, employees are the main source of funding, while employer contributions play a secondary role. Thus, the level of participant deferrals is a critical determinant of whether the DC plan will generate an adequate level of savings for retirement. Vanguard participants saved 6.9% of their income on average in their employer’s plan in 2018 (Figure 33). The median participant deferral rate was 6.0%, meaning that half of participants were saving above this rate and half were saving below it.
Vanguard deferral rates are drawn from recordkeeping data and exclude eligible employees not contributing to their plans. Industry deferral rates sometimes include eligible employees not contributing to their plan and are generally self-reported by plan sponsors.
Average and median deferral rates were fairly steady between 2009 and 2018.
Distribution of deferral ratesIndividual deferral rates vary considerably among participants (Figure 34). One in 5 participants had a deferral rate of 10% or higher in 2018, while 3 in 10 had a deferral rate of less than 4%. During 2018, only 13% of participants saved the statutory maximum of $18,500 ($24,500 for participants age 50 or older) (see page 43). In plans offering catch-up contributions, only 15% of participants age 50 or older took advantage of this feature in 2018 (see page 44).
Figure 33. Participant employee-elective deferral rates
Vanguard defined contribution plans permitting employee-elective deferrals
6.9%
6.0%
Average Median
8%
0%
6.8% 6.9% 6.9%6.9% 6.9% 7.0% 6.8%
6.0% 6.0%
6.8% 7.0%
6.0%6.0% 6.0% 6.0% 6.0% 6.0% 6.0%
2009 2010 2011 2012 2013 2014 2015 2016 2017 2018estimated
Source: Vanguard, 2019.
Figure 34. Distribution of participant employee-elective deferral rates
Vanguard defined contribution plans permitting employee-elective deferrals
Percentage of participants
Deferral rate 2009 2010 2011 2012 2013 2014 2015 2016 20172018
estimated
0.1%–3.9% 32% 28% 28% 29% 28% 30% 29% 30% 28% 29%
4.0%–6.0% 22 23 25 23 23 23 22 22 22 22
6.1%–9.9% 25 27 27 28 29 28 29 28 29 28
10.0%–14.9% 14 15 14 14 14 13 14 14 15 15
15.0%+ 7 7 6 6 6 6 6 6 6 6
Source: Vanguard, 2019.
38 > Accumulating plan assets
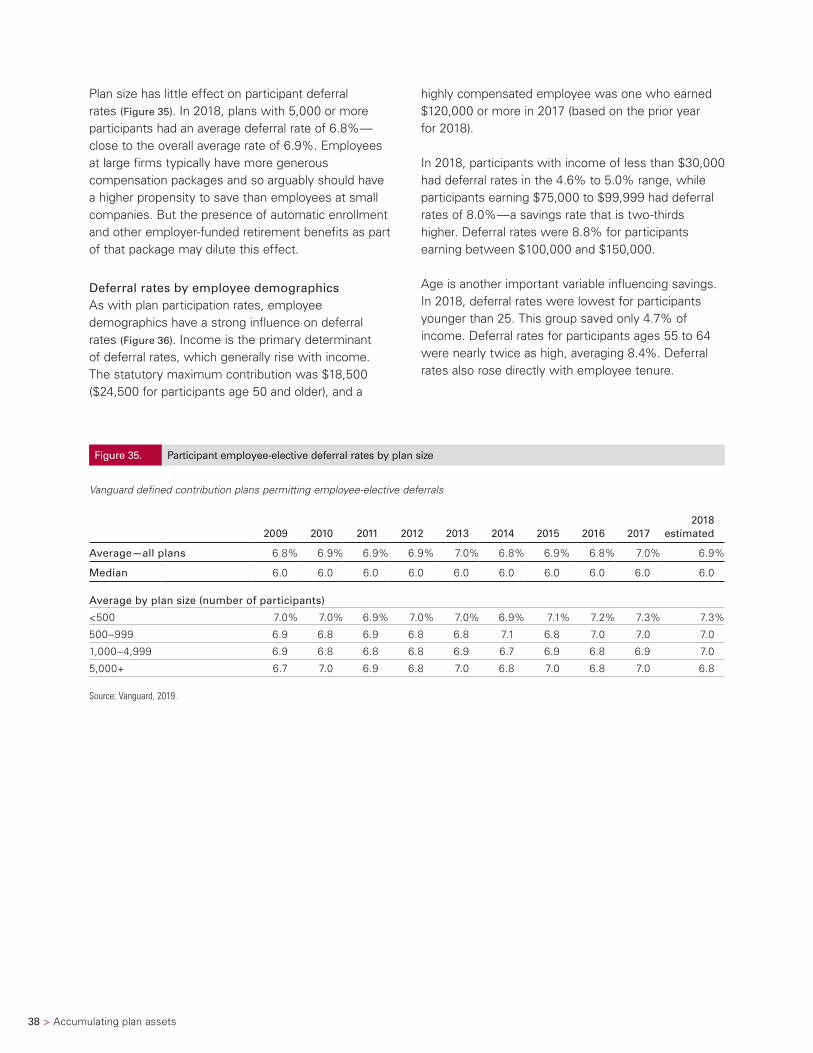
Plan size has little effect on participant deferral rates (Figure 35). In 2018, plans with 5,000 or more participants had an average deferral rate of 6.8%—close to the overall average rate of 6.9%. Employees at large firms typically have more generous compensation packages and so arguably should have a higher propensity to save than employees at small companies. But the presence of automatic enrollment and other employer-funded retirement benefits as part of that package may dilute this effect.
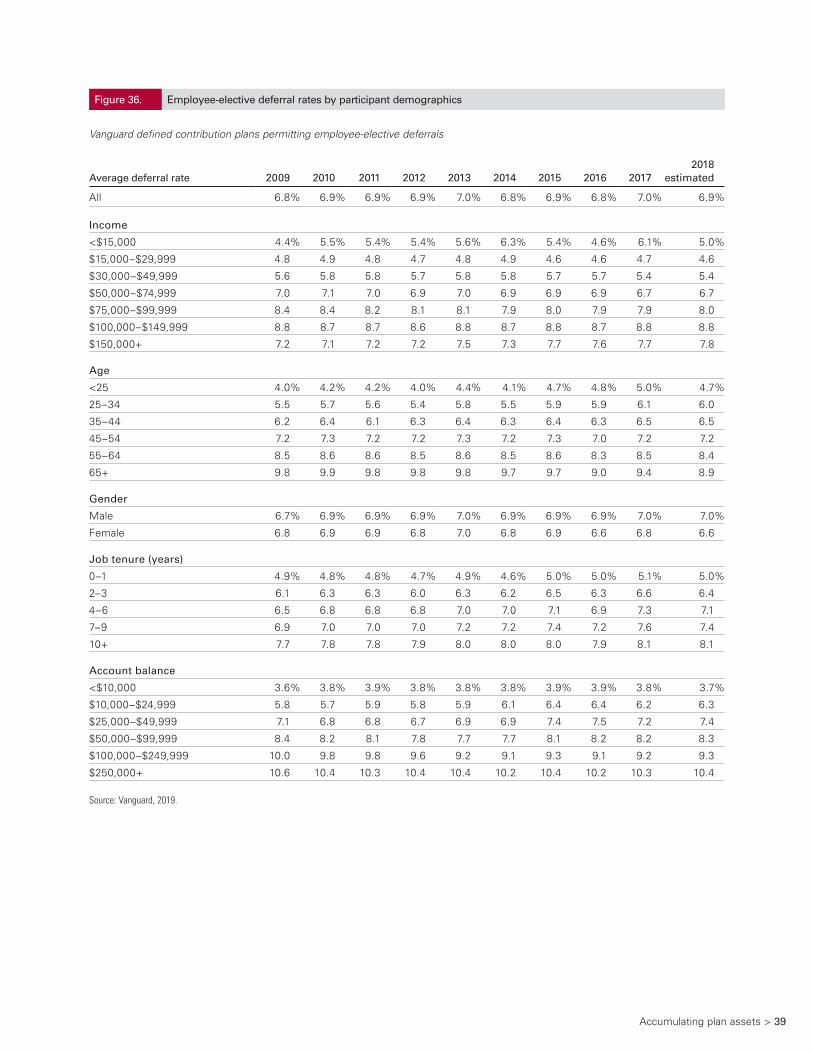
Deferral rates by employee demographicsAs with plan participation rates, employee demographics have a strong influence on deferral rates (Figure 36). Income is the primary determinant of deferral rates, which generally rise with income. The statutory maximum contribution was $18,500 ($24,500 for participants age 50 and older), and a
highly compensated employee was one who earned $120,000 or more in 2017 (based on the prior year for 2018).
In 2018, participants with income of less than $30,000 had deferral rates in the 4.6% to 5.0% range, while participants earning $75,000 to $99,999 had deferral rates of 8.0%—a savings rate that is two-thirds higher. Deferral rates were 8.8% for participants earning between $100,000 and $150,000.
Age is another important variable influencing savings. In 2018, deferral rates were lowest for participants younger than 25. This group saved only 4.7% of income. Deferral rates for participants ages 55 to 64 were nearly twice as high, averaging 8.4%. Deferral rates also rose directly with employee tenure.
Figure 35. Participant employee-elective deferral rates by plan size
Vanguard defined contribution plans permitting employee-elective deferrals
2009 2010 2011 2012 2013 2014 2015 2016 20172018
estimated
Average—all plans 6.8% 6.9% 6.9% 6.9% 7.0% 6.8% 6.9% 6.8% 7.0% 6.9%
Median 6.0 6.0 6.0 6.0 6.0 6.0 6.0 6.0 6.0 6.0
Average by plan size (number of participants)
<500 7.0% 7.0% 6.9% 7.0% 7.0% 6.9% 7.1% 7.2% 7.3% 7.3%
500–999 6.9 6.8 6.9 6.8 6.8 7.1 6.8 7.0 7.0 7.0
1,000–4,999 6.9 6.8 6.8 6.8 6.9 6.7 6.9 6.8 6.9 7.0
5,000+ 6.7 7.0 6.9 6.8 7.0 6.8 7.0 6.8 7.0 6.8
Source: Vanguard, 2019.
Accumulating plan assets > 39
Figure 36. Employee-elective deferral rates by participant demographics
Vanguard defined contribution plans permitting employee-elective deferrals
Average deferral rate 2009 2010 2011 2012 2013 2014 2015 2016 20172018
estimated
All 6.8% 6.9% 6.9% 6.9% 7.0% 6.8% 6.9% 6.8% 7.0% 6.9%
Income
<$15,000 4.4% 5.5% 5.4% 5.4% 5.6% 6.3% 5.4% 4.6% 6.1% 5.0%
$15,000–$29,999 4.8 4.9 4.8 4.7 4.8 4.9 4.6 4.6 4.7 4.6
$30,000–$49,999 5.6 5.8 5.8 5.7 5.8 5.8 5.7 5.7 5.4 5.4
$50,000–$74,999 7.0 7.1 7.0 6.9 7.0 6.9 6.9 6.9 6.7 6.7
$75,000–$99,999 8.4 8.4 8.2 8.1 8.1 7.9 8.0 7.9 7.9 8.0
$100,000–$149,999 8.8 8.7 8.7 8.6 8.8 8.7 8.8 8.7 8.8 8.8
$150,000+ 7.2 7.1 7.2 7.2 7.5 7.3 7.7 7.6 7.7 7.8
Age
<25 4.0% 4.2% 4.2% 4.0% 4.4% 4.1% 4.7% 4.8% 5.0% 4.7%
25–34 5.5 5.7 5.6 5.4 5.8 5.5 5.9 5.9 6.1 6.0
35–44 6.2 6.4 6.1 6.3 6.4 6.3 6.4 6.3 6.5 6.5
45–54 7.2 7.3 7.2 7.2 7.3 7.2 7.3 7.0 7.2 7.2
55–64 8.5 8.6 8.6 8.5 8.6 8.5 8.6 8.3 8.5 8.4
65+ 9.8 9.9 9.8 9.8 9.8 9.7 9.7 9.0 9.4 8.9
Gender
Male 6.7% 6.9% 6.9% 6.9% 7.0% 6.9% 6.9% 6.9% 7.0% 7.0%
Female 6.8 6.9 6.9 6.8 7.0 6.8 6.9 6.6 6.8 6.6
Job tenure (years)
0–1 4.9% 4.8% 4.8% 4.7% 4.9% 4.6% 5.0% 5.0% 5.1% 5.0%
2–3 6.1 6.3 6.3 6.0 6.3 6.2 6.5 6.3 6.6 6.4
4–6 6.5 6.8 6.8 6.8 7.0 7.0 7.1 6.9 7.3 7.1
7–9 6.9 7.0 7.0 7.0 7.2 7.2 7.4 7.2 7.6 7.4
10+ 7.7 7.8 7.8 7.9 8.0 8.0 8.0 7.9 8.1 8.1
Account balance
<$10,000 3.6% 3.8% 3.9% 3.8% 3.8% 3.8% 3.9% 3.9% 3.8% 3.7%
$10,000–$24,999 5.8 5.7 5.9 5.8 5.9 6.1 6.4 6.4 6.2 6.3
$25,000–$49,999 7.1 6.8 6.8 6.7 6.9 6.9 7.4 7.5 7.2 7.4
$50,000–$99,999 8.4 8.2 8.1 7.8 7.7 7.7 8.1 8.2 8.2 8.3
$100,000–$249,999 10.0 9.8 9.8 9.6 9.2 9.1 9.3 9.1 9.2 9.3
$250,000+ 10.6 10.4 10.3 10.4 10.4 10.2 10.4 10.2 10.3 10.4
Source: Vanguard, 2019.
40 > Accumulating plan assets
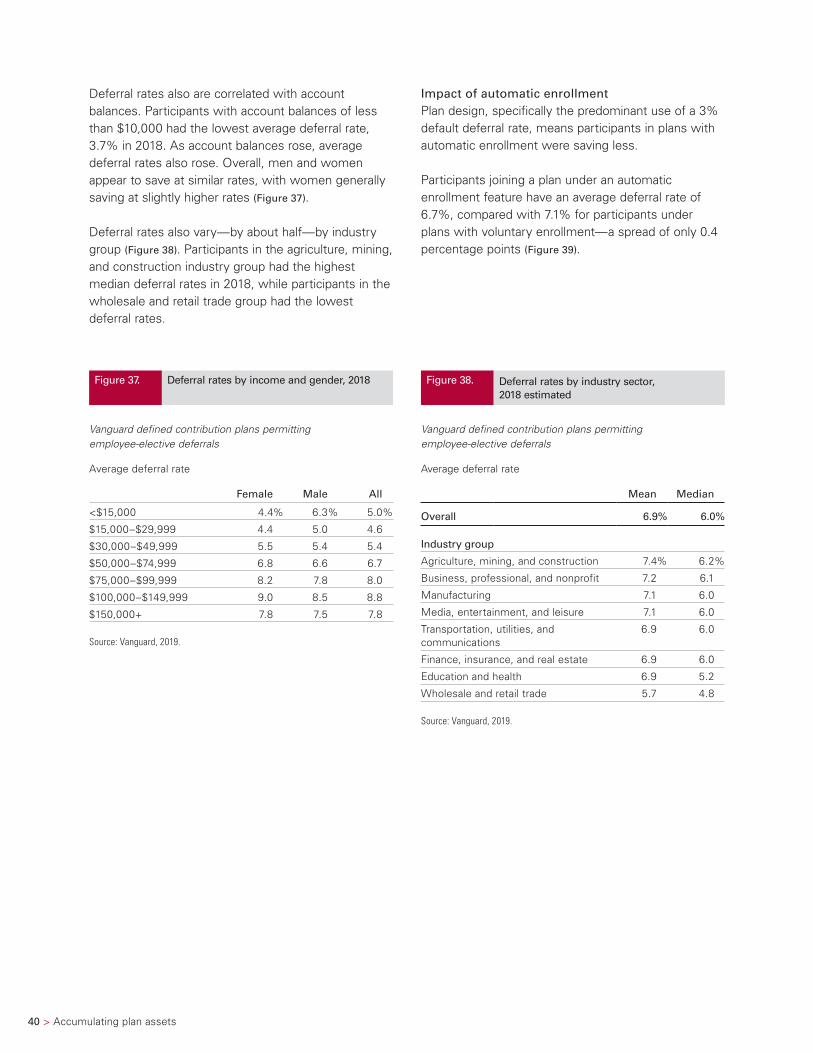
Deferral rates also are correlated with account balances. Participants with account balances of less than $10,000 had the lowest average deferral rate, 3.7% in 2018. As account balances rose, average deferral rates also rose. Overall, men and women appear to save at similar rates, with women generally saving at slightly higher rates (Figure 37).
Deferral rates also vary—by about half—by industry group (Figure 38). Participants in the agriculture, mining, and construction industry group had the highest median deferral rates in 2018, while participants in the wholesale and retail trade group had the lowest deferral rates.
Impact of automatic enrollmentPlan design, specifically the predominant use of a 3% default deferral rate, means participants in plans with automatic enrollment were saving less.
Participants joining a plan under an automatic enrollment feature have an average deferral rate of 6.7%, compared with 7.1% for participants under plans with voluntary enrollment—a spread of only 0.4 percentage points (Figure 39).
Figure 37. Deferral rates by income and gender, 2018
Vanguard defined contribution plans permitting employee-elective deferrals
Average deferral rate
Female Male All
<$15,000 4.4% 6.3% 5.0%
$15,000–$29,999 4.4 5.0 4.6
$30,000–$49,999 5.5 5.4 5.4
$50,000–$74,999 6.8 6.6 6.7
$75,000–$99,999 8.2 7.8 8.0
$100,000–$149,999 9.0 8.5 8.8
$150,000+ 7.8 7.5 7.8
Source: Vanguard, 2019.
Figure 38. Deferral rates by industry sector, 2018 estimated
Vanguard defined contribution plans permitting employee-elective deferrals
Average deferral rate
Mean Median
Overall 6.9% 6.0%
Industry group
Agriculture, mining, and construction 7.4% 6.2%
Business, professional, and nonprofit 7.2 6.1
Manufacturing 7.1 6.0
Media, entertainment, and leisure 7.1 6.0
Transportation, utilities, and communications
6.9 6.0
Finance, insurance, and real estate 6.9 6.0
Education and health 6.9 5.2
Wholesale and retail trade 5.7 4.8
Source: Vanguard, 2019.
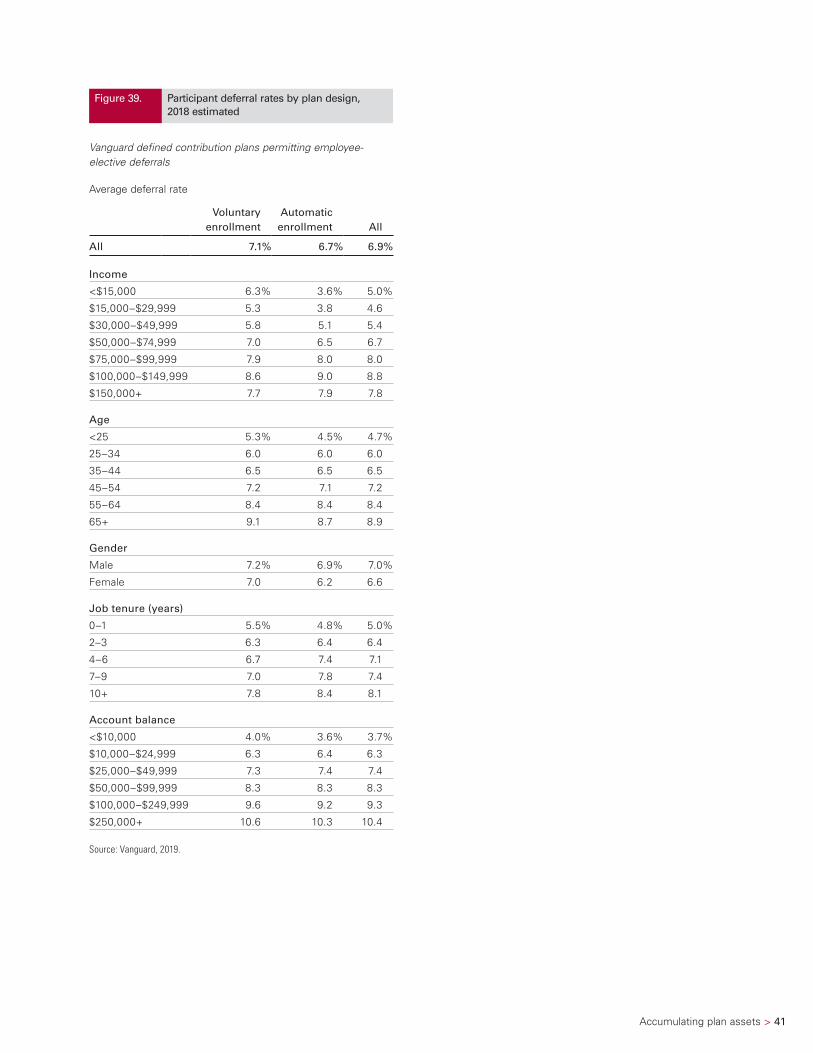
Accumulating plan assets > 41
Figure 39. Participant deferral rates by plan design, 2018 estimated
Vanguard defined contribution plans permitting employee-elective deferrals
Average deferral rate
Voluntary enrollment
Automatic enrollment All
All 7.1% 6.7% 6.9%
Income
<$15,000 6.3% 3.6% 5.0%
$15,000–$29,999 5.3 3.8 4.6
$30,000–$49,999 5.8 5.1 5.4
$50,000–$74,999 7.0 6.5 6.7
$75,000–$99,999 7.9 8.0 8.0
$100,000–$149,999 8.6 9.0 8.8
$150,000+ 7.7 7.9 7.8
Age
<25 5.3% 4.5% 4.7%
25–34 6.0 6.0 6.0
35–44 6.5 6.5 6.5
45–54 7.2 7.1 7.2
55–64 8.4 8.4 8.4
65+ 9.1 8.7 8.9
Gender
Male 7.2% 6.9% 7.0%
Female 7.0 6.2 6.6
Job tenure (years)
0–1 5.5% 4.8% 5.0%
2–3 6.3 6.4 6.4
4–6 6.7 7.4 7.1
7–9 7.0 7.8 7.4
10+ 7.8 8.4 8.1
Account balance
<$10,000 4.0% 3.6% 3.7%
$10,000–$24,999 6.3 6.4 6.3
$25,000–$49,999 7.3 7.4 7.4
$50,000–$99,999 8.3 8.3 8.3
$100,000–$249,999 9.6 9.2 9.3
$250,000+ 10.6 10.3 10.4
Source: Vanguard, 2019.
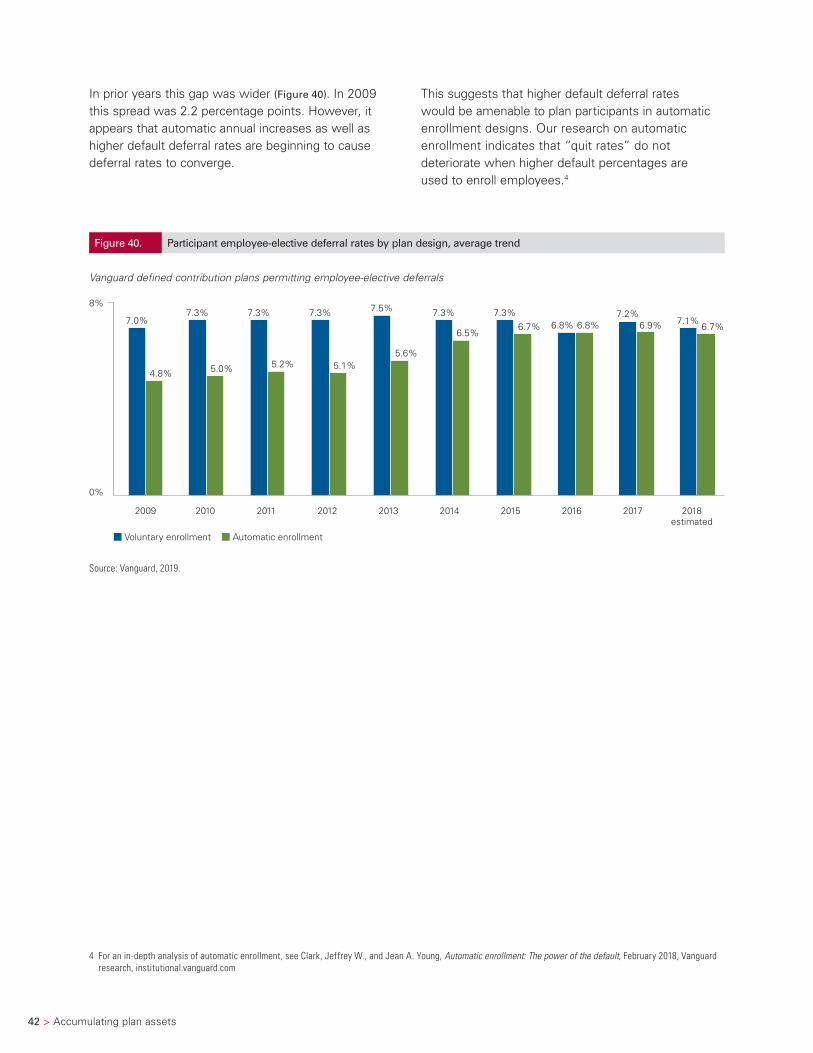
42 > Accumulating plan assets
In prior years this gap was wider (Figure 40). In 2009 this spread was 2.2 percentage points. However, it appears that automatic annual increases as well as higher default deferral rates are beginning to cause deferral rates to converge.
4 For an in-depth analysis of automatic enrollment, see Clark, Jeffrey W., and Jean A. Young, Automatic enrollment: The power of the default, February 2018, Vanguard research, institutional.vanguard.com
This suggests that higher default deferral rates would be amenable to plan participants in automatic enrollment designs. Our research on automatic enrollment indicates that “quit rates” do not deteriorate when higher default percentages are used to enroll employees.4
Figure 40. Participant employee-elective deferral rates by plan design, average trend
Vanguard defined contribution plans permitting employee-elective deferrals
7.1%6.7%
Voluntary enrollment Automatic enrollment
8%
0%
7.0%7.3% 7.3%7.3% 7.3% 7.5% 7.3%
4.8% 5.0%
6.8%7.2%
6.9%
5.2% 5.1%5.6%
6.5%6.7% 6.8%
2009 2010 2011 2012 2013 2014 2015 2016 2017 2018estimated
Source: Vanguard, 2019.
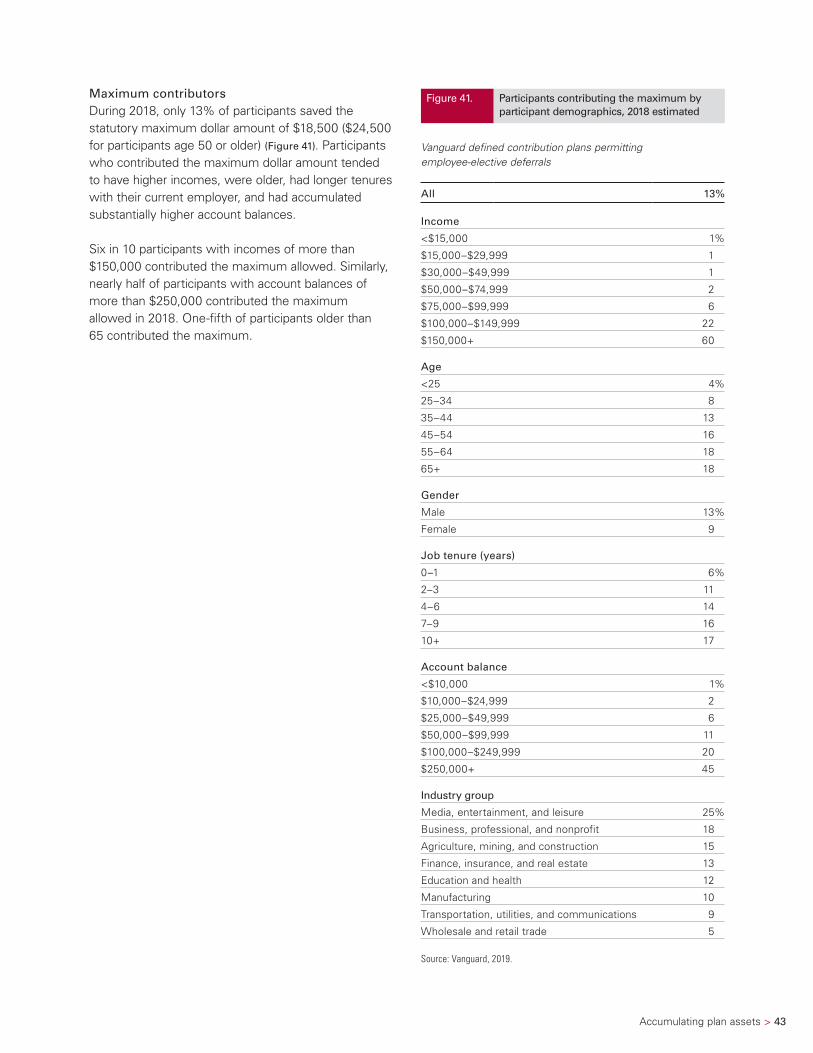
Accumulating plan assets > 43
Maximum contributorsDuring 2018, only 13% of participants saved the statutory maximum dollar amount of $18,500 ($24,500 for participants age 50 or older) (Figure 41). Participants who contributed the maximum dollar amount tended to have higher incomes, were older, had longer tenures with their current employer, and had accumulated substantially higher account balances.
Six in 10 participants with incomes of more than $150,000 contributed the maximum allowed. Similarly, nearly half of participants with account balances of more than $250,000 contributed the maximum allowed in 2018. One-fifth of participants older than 65 contributed the maximum.
Figure 41. Participants contributing the maximum by participant demographics, 2018 estimated
Vanguard defined contribution plans permitting employee-elective deferrals
All 13%
Income
<$15,000 1%
$15,000–$29,999 1
$30,000–$49,999 1
$50,000–$74,999 2
$75,000–$99,999 6
$100,000–$149,999 22
$150,000+ 60
Age
<25 4%
25–34 8
35–44 13
45–54 16
55–64 18
65+ 18
Gender
Male 13%
Female 9
Job tenure (years)
0–1 6%
2–3 11
4–6 14
7–9 16
10+ 17
Account balance
<$10,000 1%
$10,000–$24,999 2
$25,000–$49,999 6
$50,000–$99,999 11
$100,000–$249,999 20
$250,000+ 45
Industry group
Media, entertainment, and leisure 25%
Business, professional, and nonprofit 18
Agriculture, mining, and construction 15
Finance, insurance, and real estate 13
Education and health 12
Manufacturing 10
Transportation, utilities, and communications 9
Wholesale and retail trade 5
Source: Vanguard, 2019.
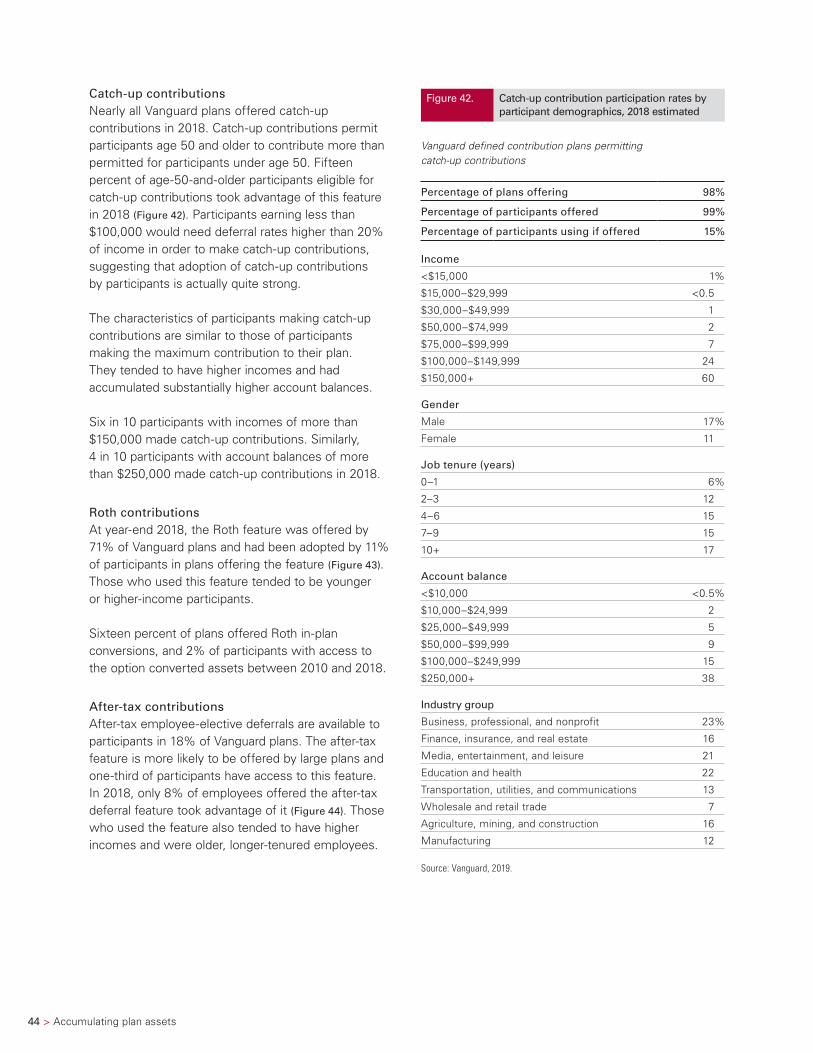
44 > Accumulating plan assets
Catch-up contributionsNearly all Vanguard plans offered catch-up contributions in 2018. Catch-up contributions permit participants age 50 and older to contribute more than permitted for participants under age 50. Fifteen percent of age-50-and-older participants eligible for catch-up contributions took advantage of this feature in 2018 (Figure 42). Participants earning less than $100,000 would need deferral rates higher than 20% of income in order to make catch-up contributions, suggesting that adoption of catch-up contributions by participants is actually quite strong.
The characteristics of participants making catch-up contributions are similar to those of participants making the maximum contribution to their plan. They tended to have higher incomes and had accumulated substantially higher account balances.
Six in 10 participants with incomes of more than $150,000 made catch-up contributions. Similarly, 4 in 10 participants with account balances of more than $250,000 made catch-up contributions in 2018.
Roth contributionsAt year-end 2018, the Roth feature was offered by 71% of Vanguard plans and had been adopted by 11% of participants in plans offering the feature (Figure 43). Those who used this feature tended to be younger or higher-income participants.
Sixteen percent of plans offered Roth in-plan conversions, and 2% of participants with access to the option converted assets between 2010 and 2018.
After-tax contributionsAfter-tax employee-elective deferrals are available to participants in 18% of Vanguard plans. The after-tax feature is more likely to be offered by large plans and one-third of participants have access to this feature. In 2018, only 8% of employees offered the after-tax deferral feature took advantage of it (Figure 44). Those who used the feature also tended to have higher incomes and were older, longer-tenured employees.
Figure 42. Catch-up contribution participation rates by participant demographics, 2018 estimated
Vanguard defined contribution plans permitting catch-up contributions
Percentage of plans offering 98%
Percentage of participants offered 99%
Percentage of participants using if offered 15%
Income
<$15,000 1%
$15,000–$29,999 <0.5
$30,000–$49,999 1
$50,000–$74,999 2
$75,000–$99,999 7
$100,000–$149,999 24
$150,000+ 60
Gender
Male 17%
Female 11
Job tenure (years)
0–1 6%
2–3 12
4–6 15
7–9 15
10+ 17
Account balance
<$10,000 <0.5%
$10,000–$24,999 2
$25,000–$49,999 5
$50,000–$99,999 9
$100,000–$249,999 15
$250,000+ 38
Industry group
Business, professional, and nonprofit 23%
Finance, insurance, and real estate 16
Media, entertainment, and leisure 21
Education and health 22
Transportation, utilities, and communications 13
Wholesale and retail trade 7
Agriculture, mining, and construction 16
Manufacturing 12
Source: Vanguard, 2019.
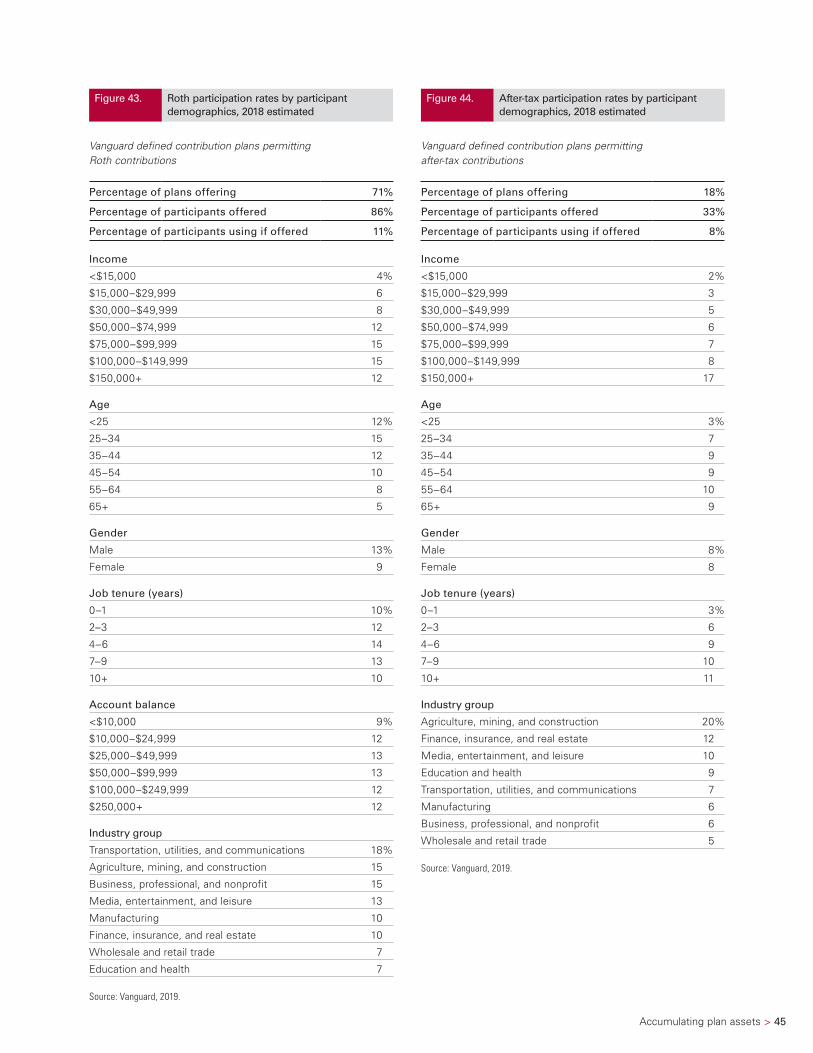
Accumulating plan assets > 45
Figure 44. After-tax participation rates by participant demographics, 2018 estimated
Vanguard defined contribution plans permitting after-tax contributions
Percentage of plans offering 18%
Percentage of participants offered 33%
Percentage of participants using if offered 8%
Income
<$15,000 2%
$15,000–$29,999 3
$30,000–$49,999 5
$50,000–$74,999 6
$75,000–$99,999 7
$100,000–$149,999 8
$150,000+ 17
Age
<25 3%
25–34 7
35–44 9
45–54 9
55–64 10
65+ 9
Gender
Male 8%
Female 8
Job tenure (years)
0–1 3%
2–3 6
4–6 9
7–9 10
10+ 11
Industry group
Agriculture, mining, and construction 20%
Finance, insurance, and real estate 12
Media, entertainment, and leisure 10
Education and health 9
Transportation, utilities, and communications 7
Manufacturing 6
Business, professional, and nonprofit 6
Wholesale and retail trade 5
Source: Vanguard, 2019.
Figure 43. Roth participation rates by participant demographics, 2018 estimated
Vanguard defined contribution plans permitting Roth contributions
Percentage of plans offering 71%
Percentage of participants offered 86%
Percentage of participants using if offered 11%
Income
<$15,000 4%
$15,000–$29,999 6
$30,000–$49,999 8
$50,000–$74,999 12
$75,000–$99,999 15
$100,000–$149,999 15
$150,000+ 12
Age
<25 12%
25–34 15
35–44 12
45–54 10
55–64 8
65+ 5
Gender
Male 13%
Female 9
Job tenure (years)
0–1 10%
2–3 12
4–6 14
7–9 13
10+ 10
Account balance
<$10,000 9%
$10,000–$24,999 12
$25,000–$49,999 13
$50,000–$99,999 13
$100,000–$249,999 12
$250,000+ 12
Industry group
Transportation, utilities, and communications 18%
Agriculture, mining, and construction 15
Business, professional, and nonprofit 15
Media, entertainment, and leisure 13
Manufacturing 10
Finance, insurance, and real estate 10
Wholesale and retail trade 7
Education and health 7
Source: Vanguard, 2019.
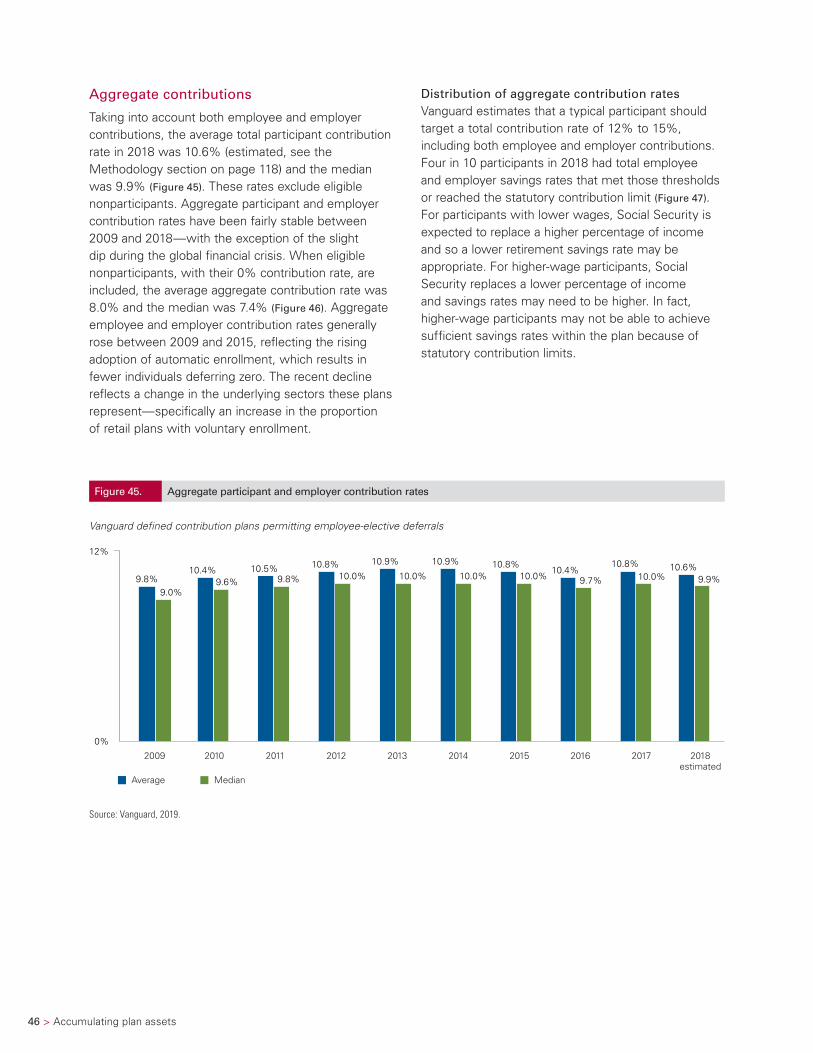
46 > Accumulating plan assets
Aggregate contributions
Taking into account both employee and employer contributions, the average total participant contribution rate in 2018 was 10.6% (estimated, see the Methodology section on page 118) and the median was 9.9% (Figure 45). These rates exclude eligible nonparticipants. Aggregate participant and employer contribution rates have been fairly stable between 2009 and 2018—with the exception of the slight dip during the global financial crisis. When eligible nonparticipants, with their 0% contribution rate, are included, the average aggregate contribution rate was 8.0% and the median was 7.4% (Figure 46). Aggregate employee and employer contribution rates generally rose between 2009 and 2015, reflecting the rising adoption of automatic enrollment, which results in fewer individuals deferring zero. The recent decline reflects a change in the underlying sectors these plans represent—specifically an increase in the proportion of retail plans with voluntary enrollment.
Distribution of aggregate contribution rates Vanguard estimates that a typical participant should target a total contribution rate of 12% to 15%, including both employee and employer contributions. Four in 10 participants in 2018 had total employee and employer savings rates that met those thresholds or reached the statutory contribution limit (Figure 47). For participants with lower wages, Social Security is expected to replace a higher percentage of income and so a lower retirement savings rate may be appropriate. For higher-wage participants, Social Security replaces a lower percentage of income and savings rates may need to be higher. In fact, higher-wage participants may not be able to achieve sufficient savings rates within the plan because of statutory contribution limits.
Figure 45. Aggregate participant and employer contribution rates
Vanguard defined contribution plans permitting employee-elective deferrals
10.6% 9.9%
Average Median
12%
0%
9.0%
10.9% 10.8% 10.0% 10.0%
10.5%9.8%
10.8% 10.9%
9.8% 10.0% 10.0% 10.4%
9.6% 10.4%
9.7%
10.8% 10.0%
2009 2010 2011 2012 2013 2014 2015 2016 2017 2018estimated
Source: Vanguard, 2019.
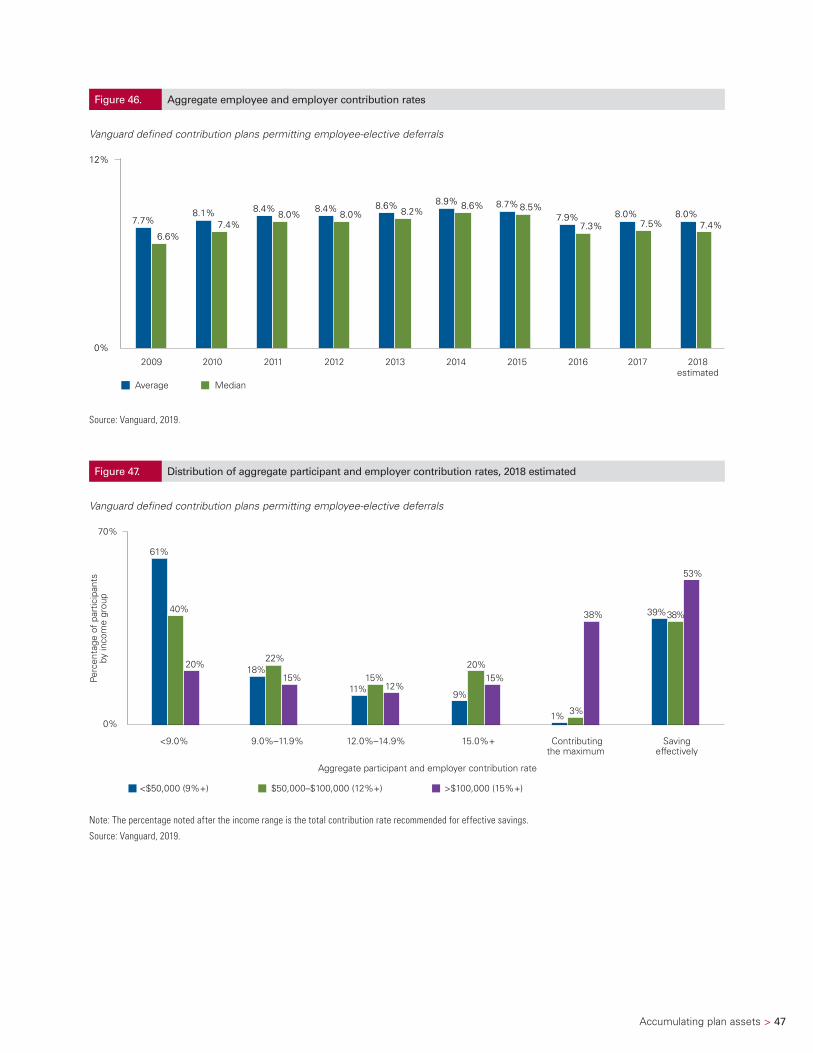
Accumulating plan assets > 47
Figure 46. Aggregate employee and employer contribution rates
Vanguard defined contribution plans permitting employee-elective deferrals
8.0%7.4%
8.7%8.9% 8.6% 8.5%
Average Median
12%
0%
7.7%8.4% 8.4%
6.6%
8.1%7.4%
8.0% 8.0%8.6%
8.2%7.9%
7.3% 8.0%
7.5%
2009 2010 2011 2012 2013 2014 2015 2016 2017 2018estimated
Source: Vanguard, 2019.
Figure 47. Distribution of aggregate participant and employer contribution rates, 2018 estimated
Vanguard defined contribution plans permitting employee-elective deferrals
Aggregate participant and employer contribution rate
<$50,000 (9%+) $50,000–$100,000 (12%+) >$100,000 (15%+)
Perc
enta
ge o
f pa
rtic
ipan
tsby
inco
me
grou
p
<9.0% 9.0%–11.9% 12.0%–14.9% 15.0%+ Contributingthe maximum
70%
0% 1% 3%
61%
18%
11% 9%
40%
22%
15%12%
20%15%
38%
20% 15%
Savingeffectively
39%
53%
38%
Note: The percentage noted after the income range is the total contribution rate recommended for effective savings.
Source: Vanguard, 2019.
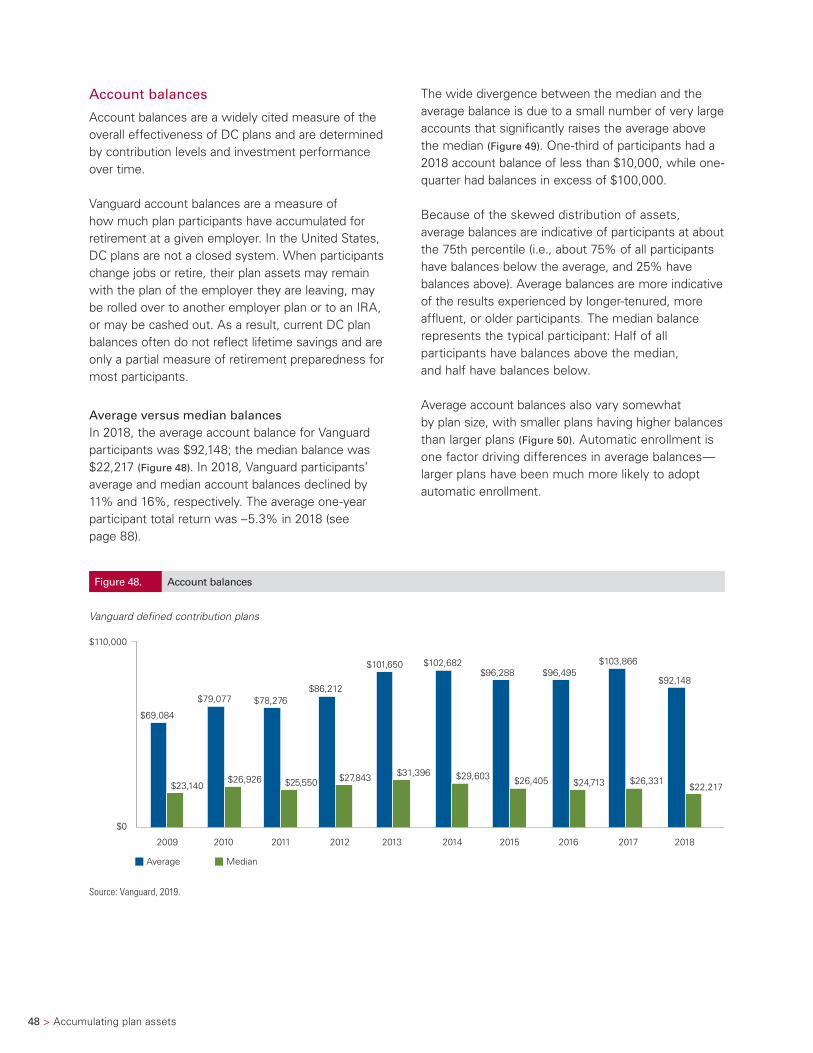
48 > Accumulating plan assets
Account balances
Account balances are a widely cited measure of the overall effectiveness of DC plans and are determined by contribution levels and investment performance over time.
Vanguard account balances are a measure of how much plan participants have accumulated for retirement at a given employer. In the United States, DC plans are not a closed system. When participants change jobs or retire, their plan assets may remain with the plan of the employer they are leaving, may be rolled over to another employer plan or to an IRA, or may be cashed out. As a result, current DC plan balances often do not reflect lifetime savings and are only a partial measure of retirement preparedness for most participants.
Average versus median balancesIn 2018, the average account balance for Vanguard participants was $92,148; the median balance was $22,217 (Figure 48). In 2018, Vanguard participants’ average and median account balances declined by 11% and 16%, respectively. The average one-year participant total return was –5.3% in 2018 (see page 88).
The wide divergence between the median and the average balance is due to a small number of very large accounts that significantly raises the average above the median (Figure 49). One-third of participants had a 2018 account balance of less than $10,000, while one-quarter had balances in excess of $100,000.
Because of the skewed distribution of assets, average balances are indicative of participants at about the 75th percentile (i.e., about 75% of all participants have balances below the average, and 25% have balances above). Average balances are more indicative of the results experienced by longer-tenured, more affluent, or older participants. The median balance represents the typical participant: Half of all participants have balances above the median, and half have balances below.
Average account balances also vary somewhat by plan size, with smaller plans having higher balances than larger plans (Figure 50). Automatic enrollment is one factor driving differences in average balances—larger plans have been much more likely to adopt automatic enrollment.
Figure 48. Account balances
Vanguard defined contribution plans
$69,084
$79,077 $78,276$86,212
$101,650 $102,682$96,288
$23,140$26,926 $25,550 $27,843 $31,396 $29,603 $26,405
$96,495
$24,713
$103,866
$26,331
Average Median
$110,000
$0
2009 2010 2011 2012 2013 2014 2015 2016 2017 2018
$92,148
$22,217
Source: Vanguard, 2019.
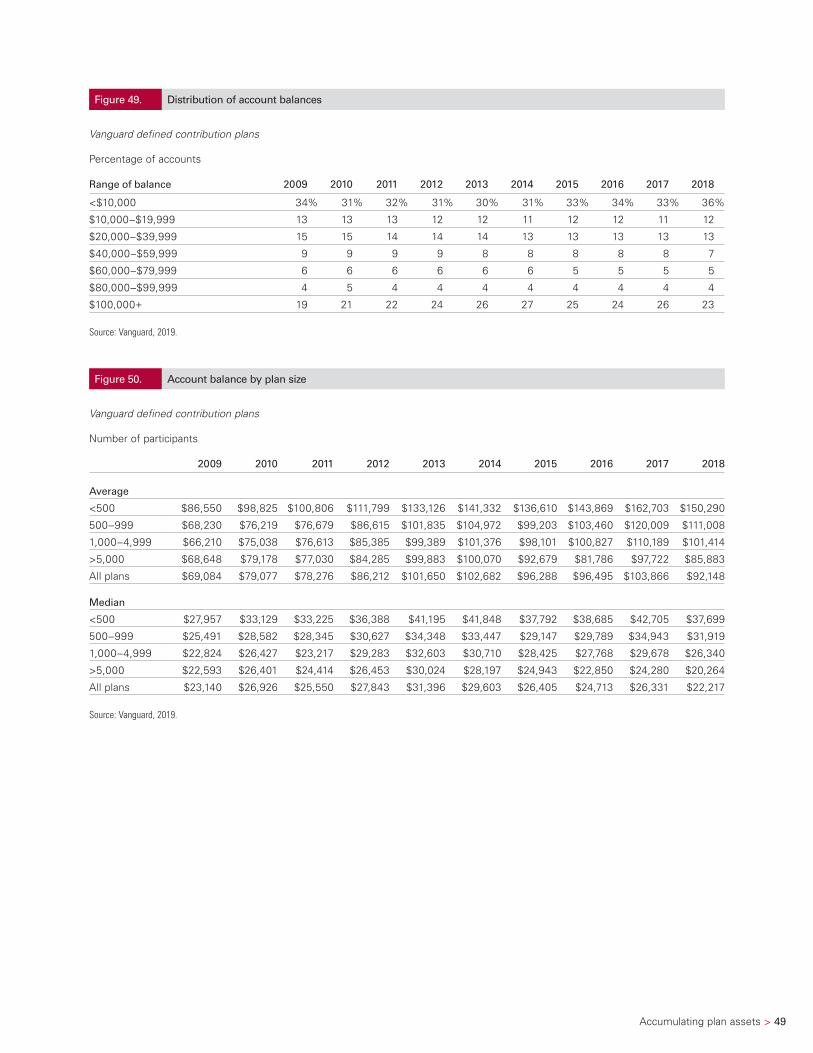
Accumulating plan assets > 49
Figure 49. Distribution of account balances
Vanguard defined contribution plans
Percentage of accounts
Range of balance 2009 2010 2011 2012 2013 2014 2015 2016 2017 2018
<$10,000 34% 31% 32% 31% 30% 31% 33% 34% 33% 36%
$10,000–$19,999 13 13 13 12 12 11 12 12 11 12
$20,000–$39,999 15 15 14 14 14 13 13 13 13 13
$40,000–$59,999 9 9 9 9 8 8 8 8 8 7
$60,000–$79,999 6 6 6 6 6 6 5 5 5 5
$80,000–$99,999 4 5 4 4 4 4 4 4 4 4
$100,000+ 19 21 22 24 26 27 25 24 26 23
Source: Vanguard, 2019.
Figure 50. Account balance by plan size
Vanguard defined contribution plans
Number of participants
2009 2010 2011 2012 2013 2014 2015 2016 2017 2018
Average
<500 $86,550 $98,825 $100,806 $111,799 $133,126 $141,332 $136,610 $143,869 $162,703 $150,290
500–999 $68,230 $76,219 $76,679 $86,615 $101,835 $104,972 $99,203 $103,460 $120,009 $111,008
1,000–4,999 $66,210 $75,038 $76,613 $85,385 $99,389 $101,376 $98,101 $100,827 $110,189 $101,414
>5,000 $68,648 $79,178 $77,030 $84,285 $99,883 $100,070 $92,679 $81,786 $97,722 $85,883
All plans $69,084 $79,077 $78,276 $86,212 $101,650 $102,682 $96,288 $96,495 $103,866 $92,148
Median
<500 $27,957 $33,129 $33,225 $36,388 $41,195 $41,848 $37,792 $38,685 $42,705 $37,699
500–999 $25,491 $28,582 $28,345 $30,627 $34,348 $33,447 $29,147 $29,789 $34,943 $31,919
1,000–4,999 $22,824 $26,427 $23,217 $29,283 $32,603 $30,710 $28,425 $27,768 $29,678 $26,340
>5,000 $22,593 $26,401 $24,414 $26,453 $30,024 $28,197 $24,943 $22,850 $24,280 $20,264
All plans $23,140 $26,926 $25,550 $27,843 $31,396 $29,603 $26,405 $24,713 $26,331 $22,217
Source: Vanguard, 2019.
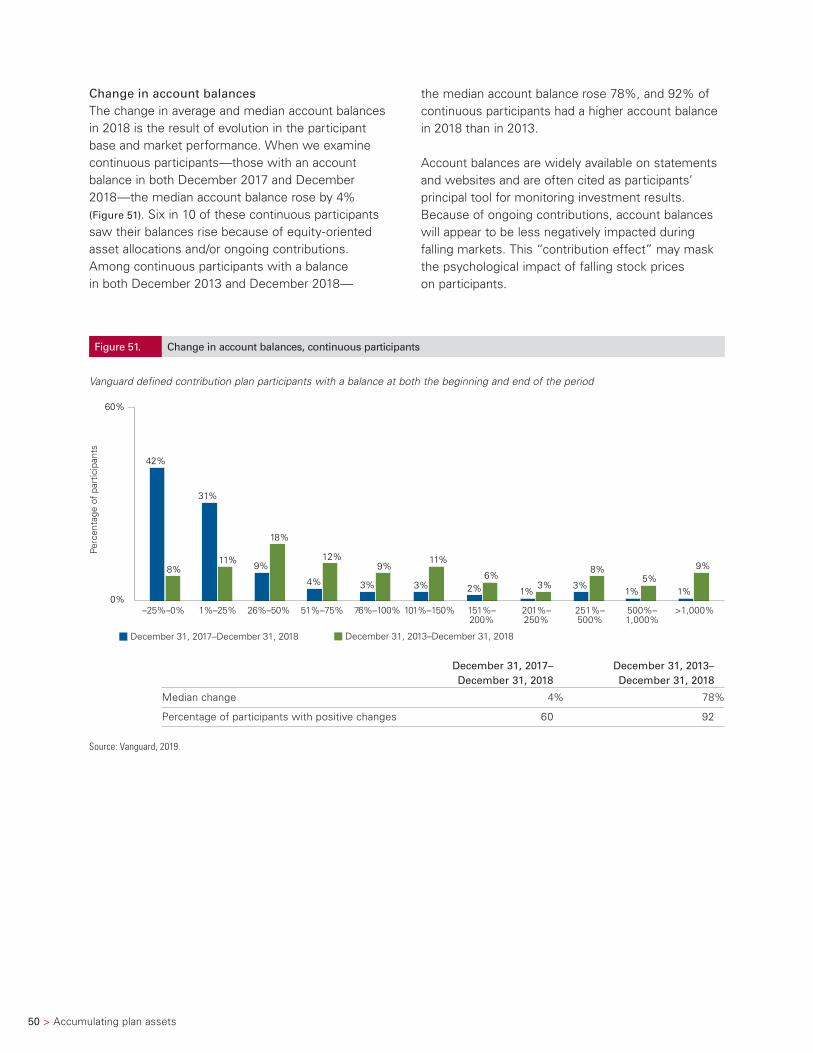
50 > Accumulating plan assets
Change in account balancesThe change in average and median account balances in 2018 is the result of evolution in the participant base and market performance. When we examine continuous participants—those with an account balance in both December 2017 and December 2018—the median account balance rose by 4% (Figure 51). Six in 10 of these continuous participants saw their balances rise because of equity-oriented asset allocations and/or ongoing contributions. Among continuous participants with a balance in both December 2013 and December 2018—
the median account balance rose 78%, and 92% of continuous participants had a higher account balance in 2018 than in 2013.
Account balances are widely available on statements and websites and are often cited as participants’ principal tool for monitoring investment results. Because of ongoing contributions, account balances will appear to be less negatively impacted during falling markets. This “contribution effect” may mask the psychological impact of falling stock prices on participants.
Figure 51. Change in account balances, continuous participants
Vanguard defined contribution plan participants with a balance at both the beginning and end of the period
December 31, 2017–December 31, 2018 December 31, 2013–December 31, 2018
60%
0% –25%–0% 1%–25% 26%–50% 51%–75% 76%–100% 101%–150% 151%–
200%201%–250%
251%–500%
500%–1,000%
>1,000%
Perc
enta
ge o
f pa
rtic
ipan
ts
42%
31%
9%
4% 3% 3% 2% 1% 3%
1% 1%
8% 11%
18%
12% 9%
11%
6% 3%
8% 5%
9%
December 31, 2017– December 31, 2018
December 31, 2013– December 31, 2018
Median change 4% 78%
Percentage of participants with positive changes 60 92
Source: Vanguard, 2019.
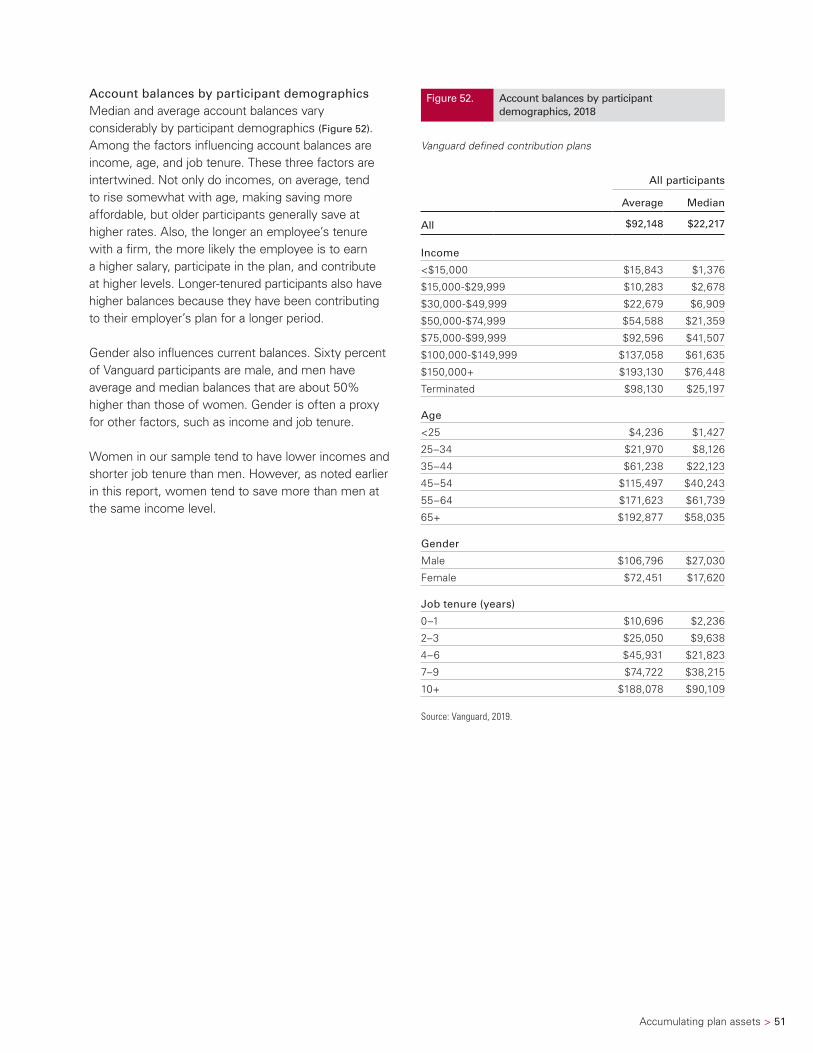
Accumulating plan assets > 51
Account balances by participant demographicsMedian and average account balances vary considerably by participant demographics (Figure 52). Among the factors influencing account balances are income, age, and job tenure. These three factors are intertwined. Not only do incomes, on average, tend to rise somewhat with age, making saving more affordable, but older participants generally save at higher rates. Also, the longer an employee’s tenure with a firm, the more likely the employee is to earn a higher salary, participate in the plan, and contribute at higher levels. Longer-tenured participants also have higher balances because they have been contributing to their employer’s plan for a longer period.
Gender also influences current balances. Sixty percent of Vanguard participants are male, and men have average and median balances that are about 50% higher than those of women. Gender is often a proxy for other factors, such as income and job tenure.
Women in our sample tend to have lower incomes and shorter job tenure than men. However, as noted earlier in this report, women tend to save more than men at the same income level.
Figure 52. Account balances by participant demographics, 2018
Vanguard defined contribution plans
All participants
Average Median
All $92,148 $22,217
Income
<$15,000 $15,843 $1,376
$15,000-$29,999 $10,283 $2,678
$30,000-$49,999 $22,679 $6,909
$50,000-$74,999 $54,588 $21,359
$75,000-$99,999 $92,596 $41,507
$100,000-$149,999 $137,058 $61,635
$150,000+ $193,130 $76,448
Terminated $98,130 $25,197
Age
<25 $4,236 $1,427
25–34 $21,970 $8,126
35–44 $61,238 $22,123
45–54 $115,497 $40,243
55–64 $171,623 $61,739
65+ $192,877 $58,035
Gender
Male $106,796 $27,030
Female $72,451 $17,620
Job tenure (years)
0–1 $10,696 $2,236
2–3 $25,050 $9,638
4–6 $45,931 $21,823
7–9 $74,722 $38,215
10+ $188,078 $90,109
Source: Vanguard, 2019.
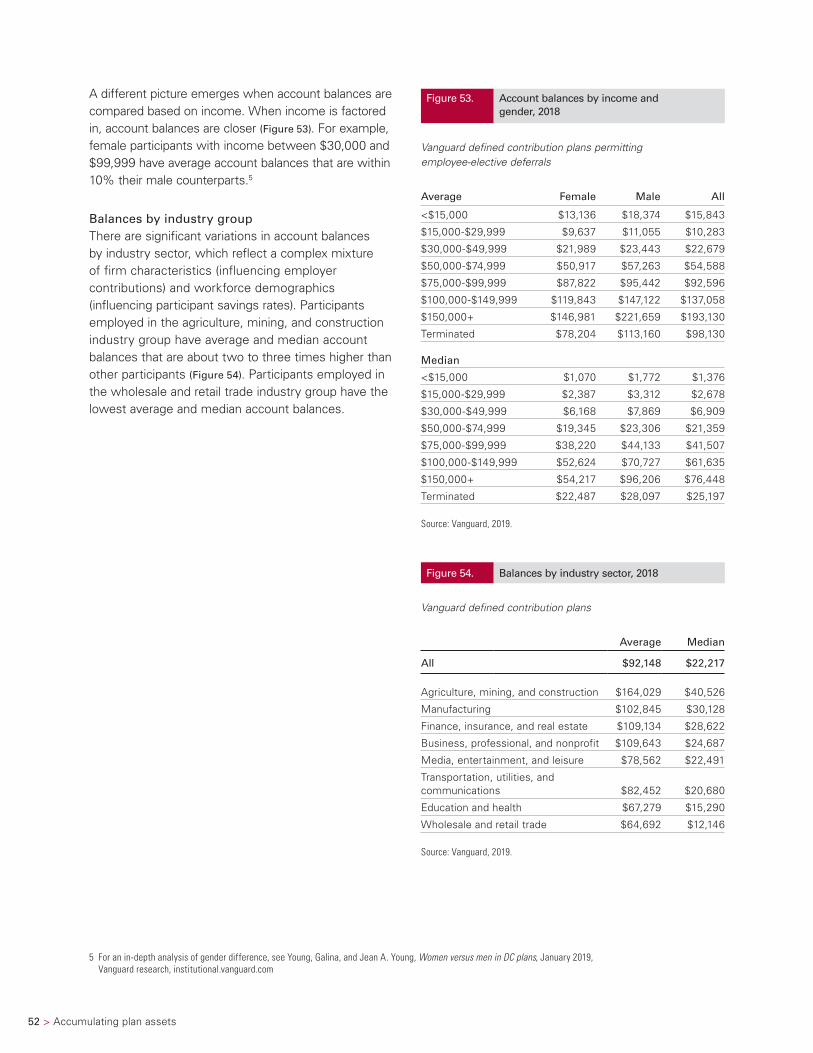
52 > Accumulating plan assets
A different picture emerges when account balances are compared based on income. When income is factored in, account balances are closer (Figure 53). For example, female participants with income between $30,000 and $99,999 have average account balances that are within 10% their male counterparts.5
Balances by industry groupThere are significant variations in account balances by industry sector, which reflect a complex mixture of firm characteristics (influencing employer contributions) and workforce demographics (influencing participant savings rates). Participants employed in the agriculture, mining, and construction industry group have average and median account balances that are about two to three times higher than other participants (Figure 54). Participants employed in the wholesale and retail trade industry group have the lowest average and median account balances.
5 For an in-depth analysis of gender difference, see Young, Galina, and Jean A. Young, Women versus men in DC plans, January 2019, Vanguard research, institutional.vanguard.com
Figure 53. Account balances by income and gender, 2018
Vanguard defined contribution plans permitting employee-elective deferrals
Average Female Male All
<$15,000 $13,136 $18,374 $15,843
$15,000-$29,999 $9,637 $11,055 $10,283
$30,000-$49,999 $21,989 $23,443 $22,679
$50,000-$74,999 $50,917 $57,263 $54,588
$75,000-$99,999 $87,822 $95,442 $92,596
$100,000-$149,999 $119,843 $147,122 $137,058
$150,000+ $146,981 $221,659 $193,130
Terminated $78,204 $113,160 $98,130
Median
<$15,000 $1,070 $1,772 $1,376
$15,000-$29,999 $2,387 $3,312 $2,678
$30,000-$49,999 $6,168 $7,869 $6,909
$50,000-$74,999 $19,345 $23,306 $21,359
$75,000-$99,999 $38,220 $44,133 $41,507
$100,000-$149,999 $52,624 $70,727 $61,635
$150,000+ $54,217 $96,206 $76,448
Terminated $22,487 $28,097 $25,197
Source: Vanguard, 2019.
Figure 54. Balances by industry sector, 2018
Vanguard defined contribution plans
Average Median
All $92,148 $22,217
Agriculture, mining, and construction $164,029 $40,526
Manufacturing $102,845 $30,128
Finance, insurance, and real estate $109,134 $28,622
Business, professional, and nonprofit $109,643 $24,687
Media, entertainment, and leisure $78,562 $22,491
Transportation, utilities, and communications $82,452 $20,680
Education and health $67,279 $15,290
Wholesale and retail trade $64,692 $12,146
Source: Vanguard, 2019.
TW
O
Participant investment decisions are a critical determinant of long-term retirement savings growth.
M A N A G I N G P A R T I C I P A N T A C C O U N T S
Participant investment decisions are a critical determinant of long-term retirement savings growth.
M A N A G I N G P A R T I C I P A N T A C C O U N T S
TW
O
Participant investment decisions are a critical determinant of long-term retirement savings growth.
M A N A G I N G P A R T I C I P A N T A C C O U N T S
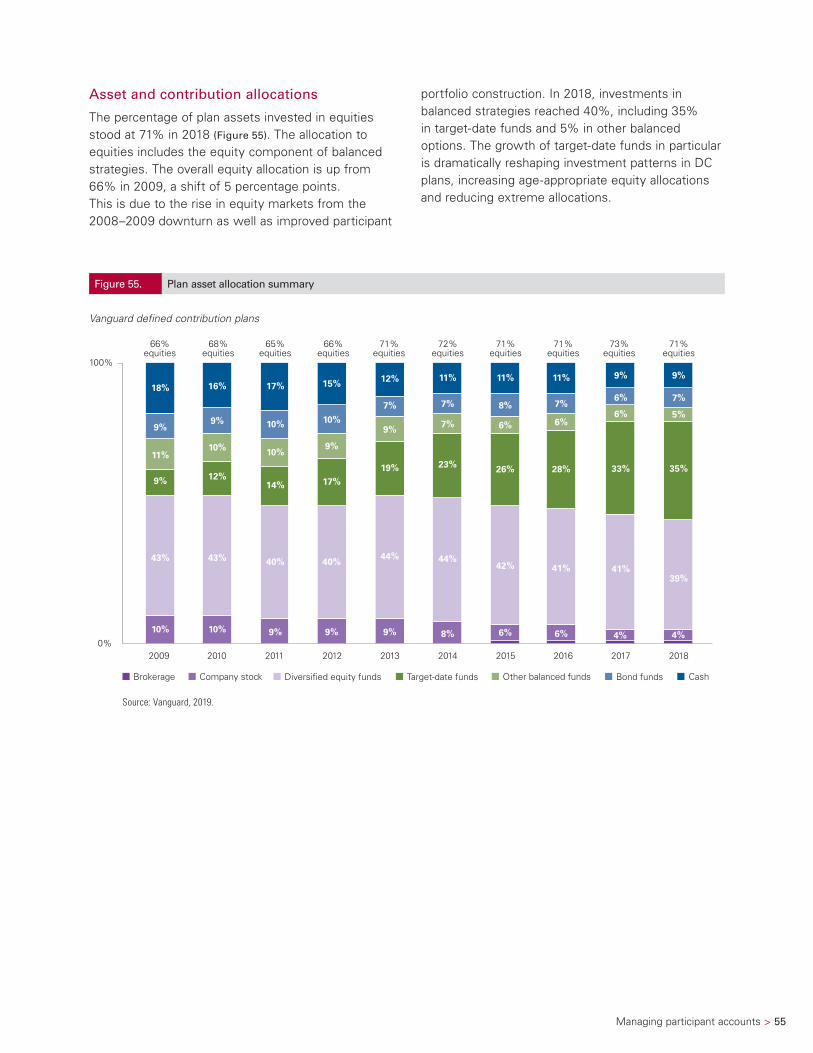
Managing participant accounts > 55
Asset and contribution allocations
The percentage of plan assets invested in equities stood at 71% in 2018 (Figure 55). The allocation to equities includes the equity component of balanced strategies. The overall equity allocation is up from 66% in 2009, a shift of 5 percentage points. This is due to the rise in equity markets from the 2008–2009 downturn as well as improved participant
portfolio construction. In 2018, investments in balanced strategies reached 40%, including 35% in target-date funds and 5% in other balanced options. The growth of target-date funds in particular is dramatically reshaping investment patterns in DC plans, increasing age-appropriate equity allocations and reducing extreme allocations.
Figure 55. Plan asset allocation summary
Vanguard defined contribution plans
72%equities
71%equities
71%equities
66%equities
68%equities
65%equities
66%equities
71%equities
2016 20172009 2010 2011 2012 2013 2014 2015
10%
43%
9%
11%
9%
18%
10%
43%
12%
10%
9%
16%
9%
40%
14%
10%
10%
17%
9%
44%
19%
9%
7%
12%
8%
44%
23%
7%
7%
11%
6%
42%
26%
6%
8%
11%
73%equities
6%
41%
28%
6%
7%
11%
17%
9%
10%
15%
9%
40%
2018
71%equities
41%
33%
6%
6%
9%
Company stock Diversi�ed equity funds Other balanced funds Bond funds CashTarget-date funds
0%
100%
Brokerage
4%
39%
35%
5%
7%
9%
4%
Source: Vanguard, 2019.
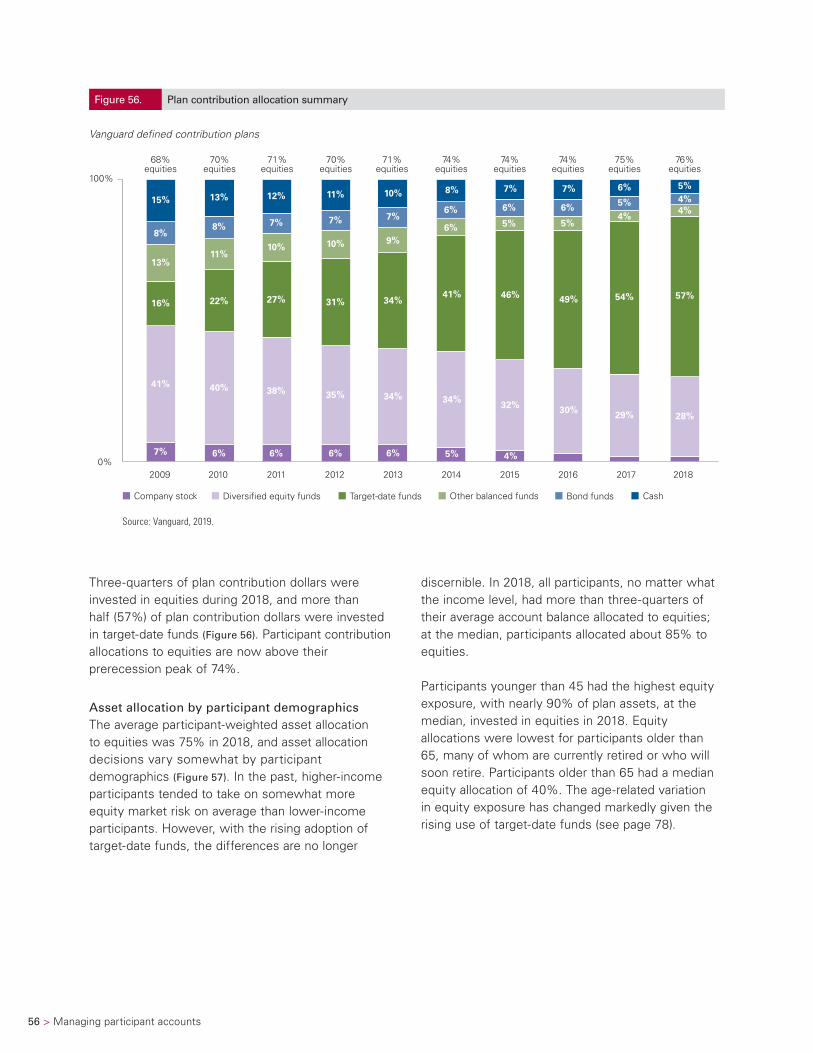
56 > Managing participant accounts
Three-quarters of plan contribution dollars were invested in equities during 2018, and more than half (57%) of plan contribution dollars were invested in target-date funds (Figure 56). Participant contribution allocations to equities are now above their prerecession peak of 74%.
Asset allocation by participant demographicsThe average participant-weighted asset allocation to equities was 75% in 2018, and asset allocation decisions vary somewhat by participant demographics (Figure 57). In the past, higher-income participants tended to take on somewhat more equity market risk on average than lower-income participants. However, with the rising adoption of target-date funds, the differences are no longer
discernible. In 2018, all participants, no matter what the income level, had more than three-quarters of their average account balance allocated to equities; at the median, participants allocated about 85% to equities.
Participants younger than 45 had the highest equity exposure, with nearly 90% of plan assets, at the median, invested in equities in 2018. Equity allocations were lowest for participants older than 65, many of whom are currently retired or who will soon retire. Participants older than 65 had a median equity allocation of 40%. The age-related variation in equity exposure has changed markedly given the rising use of target-date funds (see page 78).
Figure 56. Plan contribution allocation summary
Vanguard defined contribution plans
15%
8%
13%
16%
41%
7%
13%
8%
11%
22%
40%
6%
12%
7%
10%
27%
38%
6%
11%
7%
10%
31%
35%
6%
7%
6%
5%
46%
32%
7%
6%
5%
49%
30%
6%
5%
54%
29%
5%
57%
28%
10%
7%
9%
34%
34%
6%
8%
6%
6%
41%
34%
5%
74%equities
74%equities
74%equities
68%equities
70%equities
71%equities
70%equities
71%equities
2016 20172009 2010 2011 2012 2013 2014 2015
75%equities
2018
76%equities
Company stock Diversi�ed equity funds Other balanced funds Bond funds CashTarget-date funds
0%
100%
4%
4%4%
4%
Source: Vanguard, 2019.
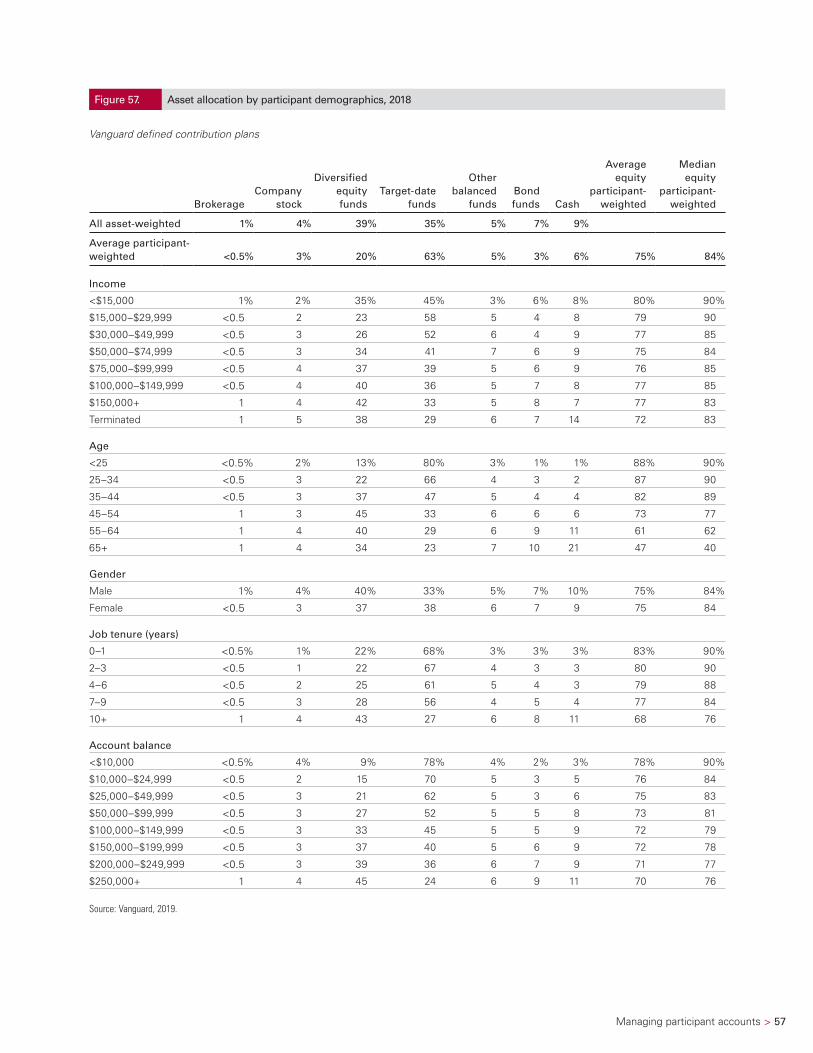
Managing participant accounts > 57
Figure 57. Asset allocation by participant demographics, 2018
Vanguard defined contribution plans
BrokerageCompany
stock
Diversified equity funds
Target-date funds
Other balanced
fundsBond funds Cash
Average equity
participant-weighted
Median equity
participant-weighted
All asset-weighted 1% 4% 39% 35% 5% 7% 9%
Average participant-weighted <0.5% 3% 20% 63% 5% 3% 6% 75% 84%
Income
<$15,000 1% 2% 35% 45% 3% 6% 8% 80% 90%
$15,000–$29,999 <0.5 2 23 58 5 4 8 79 90
$30,000–$49,999 <0.5 3 26 52 6 4 9 77 85
$50,000–$74,999 <0.5 3 34 41 7 6 9 75 84
$75,000–$99,999 <0.5 4 37 39 5 6 9 76 85
$100,000–$149,999 <0.5 4 40 36 5 7 8 77 85
$150,000+ 1 4 42 33 5 8 7 77 83
Terminated 1 5 38 29 6 7 14 72 83
Age
<25 <0.5% 2% 13% 80% 3% 1% 1% 88% 90%
25–34 <0.5 3 22 66 4 3 2 87 90
35–44 <0.5 3 37 47 5 4 4 82 89
45–54 1 3 45 33 6 6 6 73 77
55–64 1 4 40 29 6 9 11 61 62
65+ 1 4 34 23 7 10 21 47 40
Gender
Male 1% 4% 40% 33% 5% 7% 10% 75% 84%
Female <0.5 3 37 38 6 7 9 75 84
Job tenure (years)
0–1 <0.5% 1% 22% 68% 3% 3% 3% 83% 90%
2–3 <0.5 1 22 67 4 3 3 80 90
4–6 <0.5 2 25 61 5 4 3 79 88
7–9 <0.5 3 28 56 4 5 4 77 84
10+ 1 4 43 27 6 8 11 68 76
Account balance
<$10,000 <0.5% 4% 9% 78% 4% 2% 3% 78% 90%
$10,000–$24,999 <0.5 2 15 70 5 3 5 76 84
$25,000–$49,999 <0.5 3 21 62 5 3 6 75 83
$50,000–$99,999 <0.5 3 27 52 5 5 8 73 81
$100,000–$149,999 <0.5 3 33 45 5 5 9 72 79
$150,000–$199,999 <0.5 3 37 40 5 6 9 72 78
$200,000–$249,999 <0.5 3 39 36 6 7 9 71 77
$250,000+ 1 4 45 24 6 9 11 70 76
Source: Vanguard, 2019.
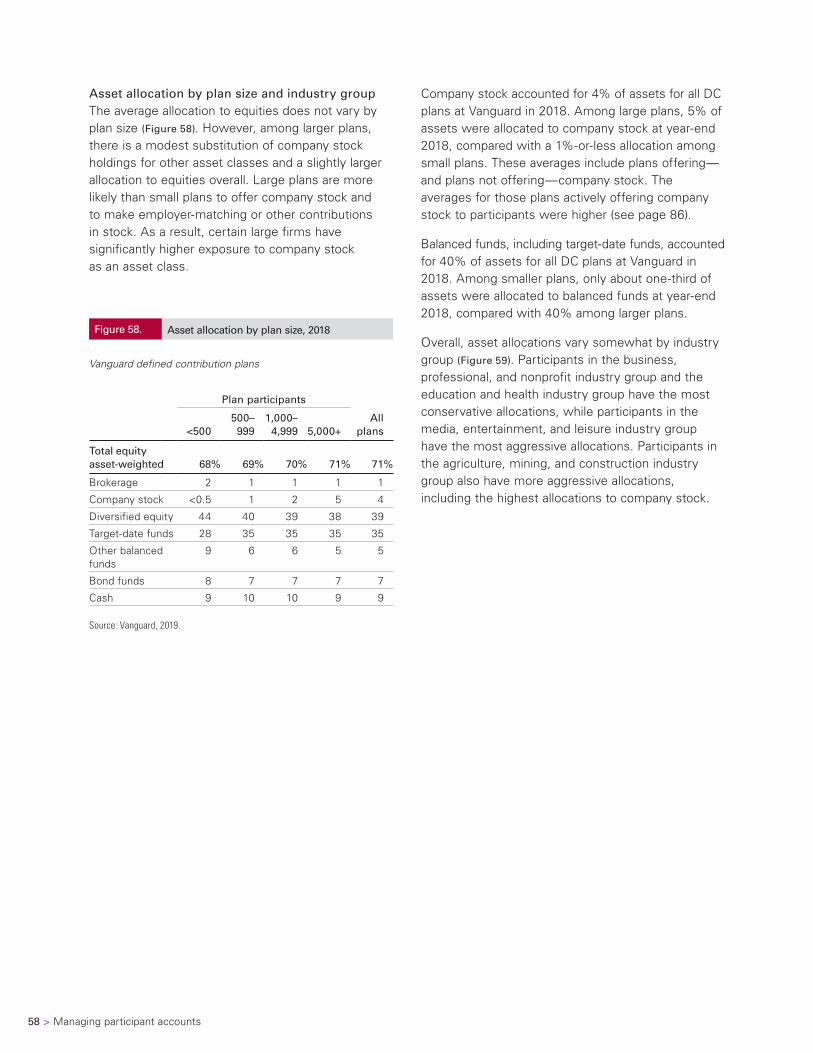
58 > Managing participant accounts
Asset allocation by plan size and industry groupThe average allocation to equities does not vary by plan size (Figure 58). However, among larger plans, there is a modest substitution of company stock holdings for other asset classes and a slightly larger allocation to equities overall. Large plans are more likely than small plans to offer company stock and to make employer-matching or other contributions in stock. As a result, certain large firms have significantly higher exposure to company stock as an asset class.
Company stock accounted for 4% of assets for all DC plans at Vanguard in 2018. Among large plans, 5% of assets were allocated to company stock at year-end 2018, compared with a 1%-or-less allocation among small plans. These averages include plans offering— and plans not offering—company stock. The averages for those plans actively offering company stock to participants were higher (see page 86).
Balanced funds, including target-date funds, accounted for 40% of assets for all DC plans at Vanguard in 2018. Among smaller plans, only about one-third of assets were allocated to balanced funds at year-end 2018, compared with 40% among larger plans.
Overall, asset allocations vary somewhat by industry group (Figure 59). Participants in the business, professional, and nonprofit industry group and the education and health industry group have the most conservative allocations, while participants in the media, entertainment, and leisure industry group have the most aggressive allocations. Participants in the agriculture, mining, and construction industry group also have more aggressive allocations, including the highest allocations to company stock.
Figure 58. Asset allocation by plan size, 2018
Vanguard defined contribution plans
Plan participants
<500500– 999
1,000– 4,999 5,000+
All plans
Total equity asset-weighted 68% 69% 70% 71% 71%
Brokerage 2 1 1 1 1
Company stock <0.5 1 2 5 4
Diversified equity 44 40 39 38 39
Target-date funds 28 35 35 35 35
Other balanced funds
9 6 6 5 5
Bond funds 8 7 7 7 7
Cash 9 10 10 9 9
Source: Vanguard, 2019.
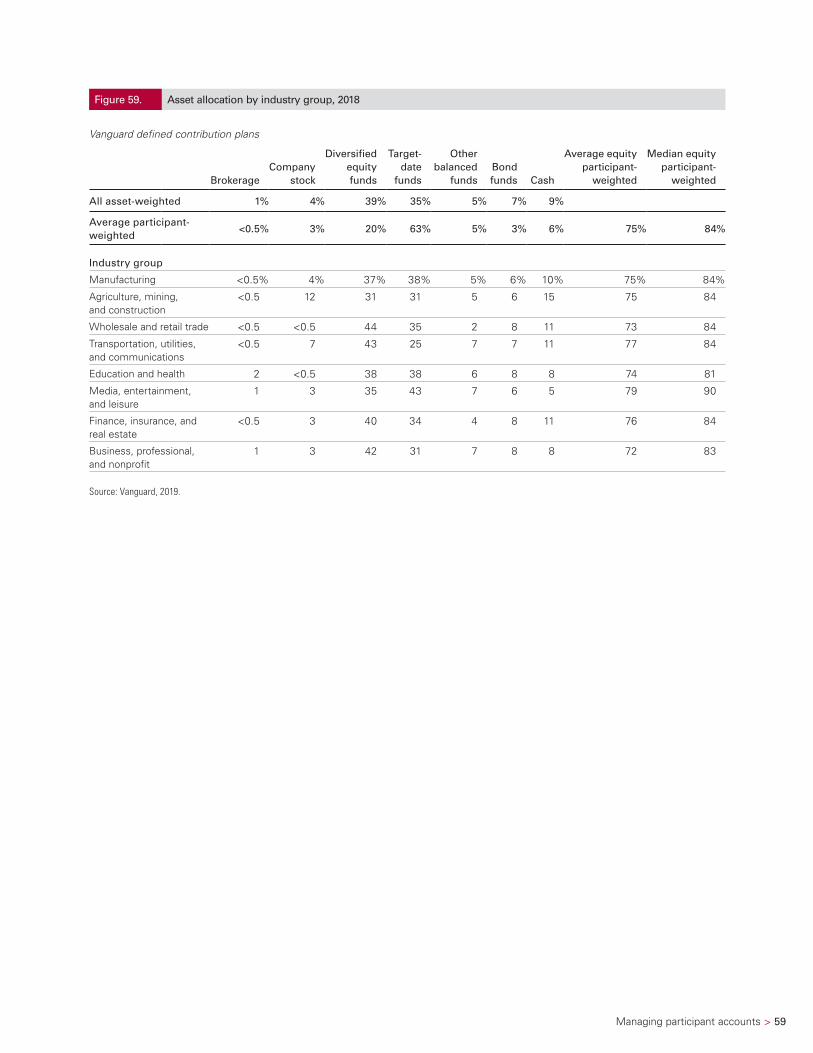
Managing participant accounts > 59
Figure 59. Asset allocation by industry group, 2018
Vanguard defined contribution plans
BrokerageCompany
stock
Diversified equity funds
Target-date
funds
Other balanced
fundsBond funds Cash
Average equity participant-
weighted
Median equity participant-
weighted
All asset-weighted 1% 4% 39% 35% 5% 7% 9%
Average participant-weighted
<0.5% 3% 20% 63% 5% 3% 6% 75% 84%
Industry group
Manufacturing <0.5% 4% 37% 38% 5% 6% 10% 75% 84%
Agriculture, mining, and construction
<0.5 12 31 31 5 6 15 75 84
Wholesale and retail trade <0.5 <0.5 44 35 2 8 11 73 84
Transportation, utilities, and communications
<0.5 7 43 25 7 7 11 77 84
Education and health 2 <0.5 38 38 6 8 8 74 81
Media, entertainment, and leisure
1 3 35 43 7 6 5 79 90
Finance, insurance, and real estate
<0.5 3 40 34 4 8 11 76 84
Business, professional, and nonprofit
1 3 42 31 7 8 8 72 83
Source: Vanguard, 2019.
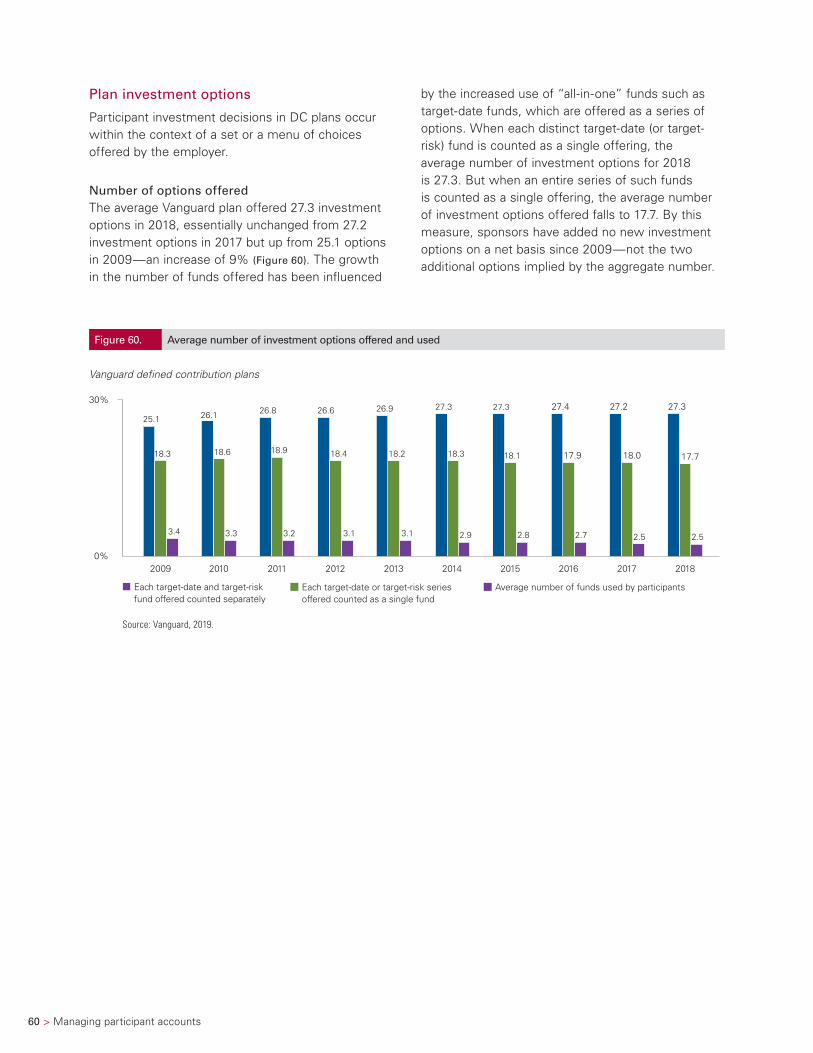
60 > Managing participant accounts
Plan investment options
Participant investment decisions in DC plans occur within the context of a set or a menu of choices offered by the employer.
Number of options offeredThe average Vanguard plan offered 27.3 investment options in 2018, essentially unchanged from 27.2 investment options in 2017 but up from 25.1 options in 2009—an increase of 9% (Figure 60). The growth in the number of funds offered has been influenced
by the increased use of “all-in-one” funds such as target-date funds, which are offered as a series of options. When each distinct target-date (or target-risk) fund is counted as a single offering, the average number of investment options for 2018 is 27.3. But when an entire series of such funds is counted as a single offering, the average number of investment options offered falls to 17.7. By this measure, sponsors have added no new investment options on a net basis since 2009—not the two additional options implied by the aggregate number.
Figure 60. Average number of investment options offered and used
Vanguard defined contribution plans
2.5
27.2
18.0
0%
30%
Each target-date and target-risk fund offered counted separately
Each target-date or target-risk series offered counted as a single fund
Average number of funds used by participants
25.1
18.3
3.4 3.3 3.2
26.8
2.9
26.6
18.4
3.1 3.1
18.2
27.3 26.1
18.6 18.9
26.9
2.8 2.7
18.3
27.3
18.1
27.4
17.9
2009 2010 2011 2012 2013 2014 2015 2016 2017 2018
2.5
27.3
17.7
Source: Vanguard, 2019.
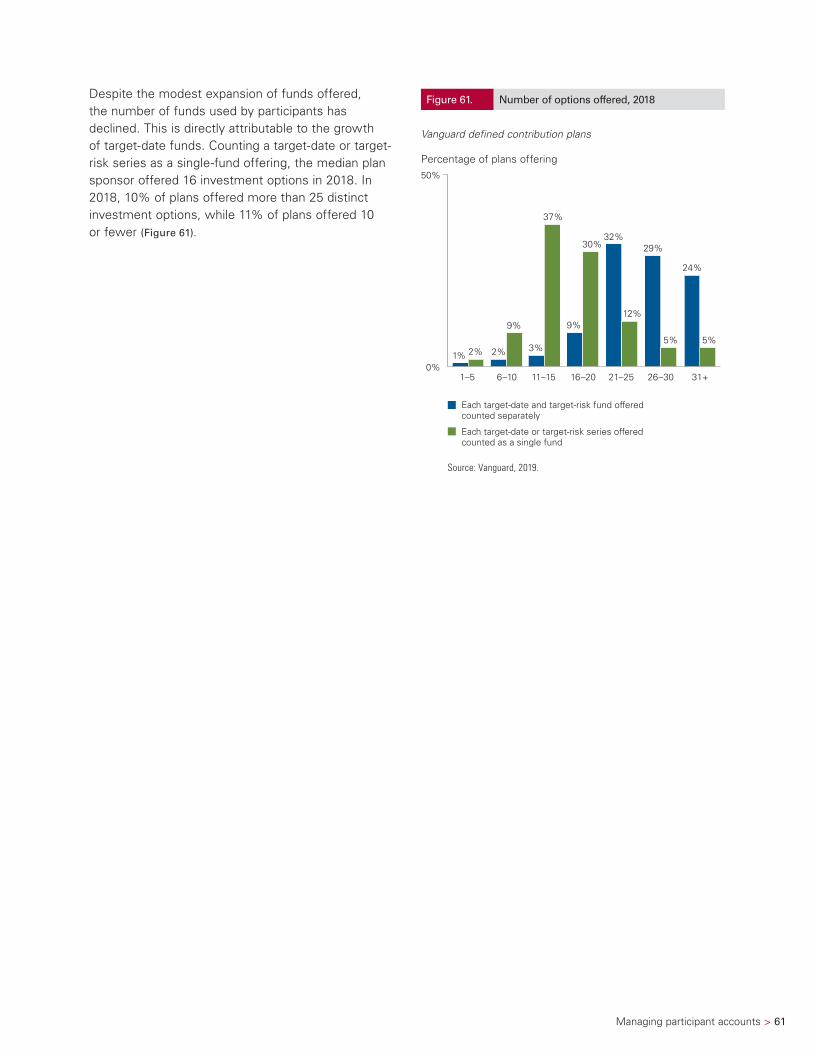
Managing participant accounts > 61
Despite the modest expansion of funds offered, the number of funds used by participants has declined. This is directly attributable to the growth of target-date funds. Counting a target-date or target-risk series as a single-fund offering, the median plan sponsor offered 16 investment options in 2018. In 2018, 10% of plans offered more than 25 distinct investment options, while 11% of plans offered 10 or fewer (Figure 61).
Figure 61. Number of options offered, 2018
Vanguard defined contribution plans
Percentage of plans offering
Each target-date and target-risk fund offered counted separately
Each target-date or target-risk series offered counted as a single fund
0%
50%
1–5 6–10 11–15 16–20 21–25 26–30 31+
1% 2% 3%
9%
32%29%
24%
2%
9%
37%
30%
12%
5% 5%
Source: Vanguard, 2019.
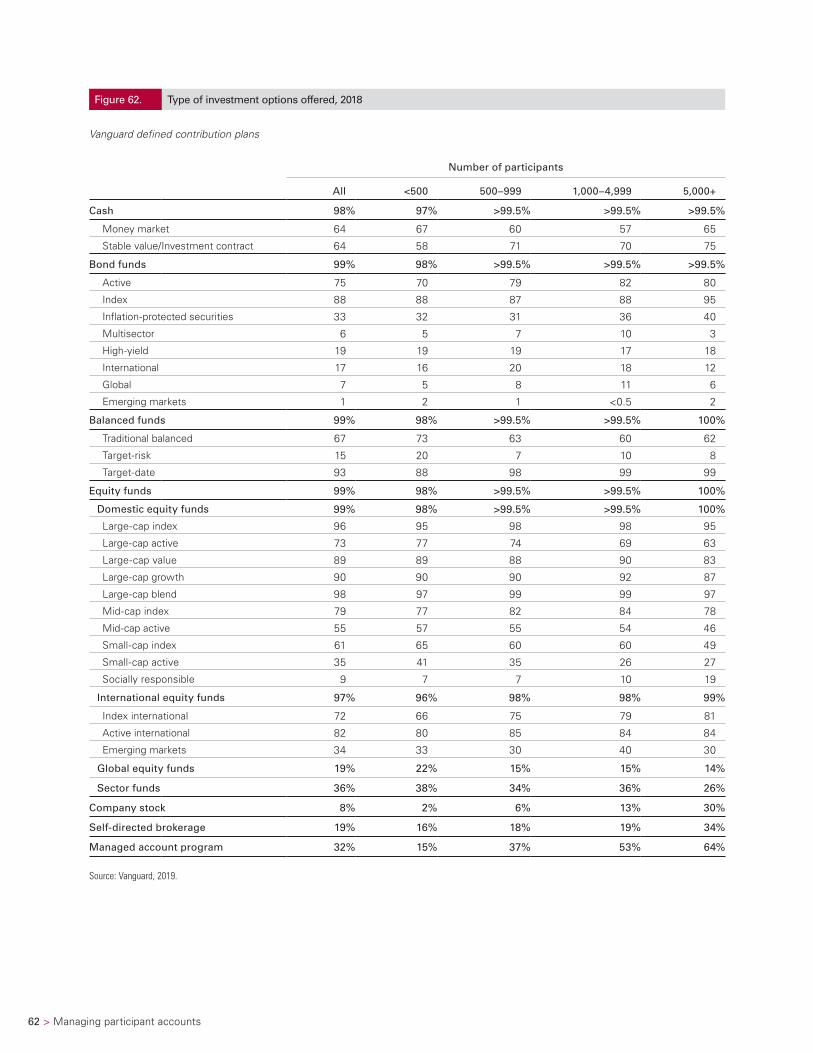
62 > Managing participant accounts
Figure 62. Type of investment options offered, 2018
Vanguard defined contribution plans
Number of participants
All <500 500–999 1,000–4,999 5,000+
Cash 98% 97% >99.5% >99.5% >99.5%
Money market 64 67 60 57 65
Stable value/Investment contract 64 58 71 70 75
Bond funds 99% 98% >99.5% >99.5% >99.5%
Active 75 70 79 82 80
Index 88 88 87 88 95
Inflation-protected securities 33 32 31 36 40
Multisector 6 5 7 10 3
High-yield 19 19 19 17 18
International 17 16 20 18 12
Global 7 5 8 11 6
Emerging markets 1 2 1 <0.5 2
Balanced funds 99% 98% >99.5% >99.5% 100%
Traditional balanced 67 73 63 60 62
Target-risk 15 20 7 10 8
Target-date 93 88 98 99 99
Equity funds 99% 98% >99.5% >99.5% 100%
Domestic equity funds 99% 98% >99.5% >99.5% 100%
Large-cap index 96 95 98 98 95
Large-cap active 73 77 74 69 63
Large-cap value 89 89 88 90 83
Large-cap growth 90 90 90 92 87
Large-cap blend 98 97 99 99 97
Mid-cap index 79 77 82 84 78
Mid-cap active 55 57 55 54 46
Small-cap index 61 65 60 60 49
Small-cap active 35 41 35 26 27
Socially responsible 9 7 7 10 19
International equity funds 97% 96% 98% 98% 99%
Index international 72 66 75 79 81
Active international 82 80 85 84 84
Emerging markets 34 33 30 40 30
Global equity funds 19% 22% 15% 15% 14%
Sector funds 36% 38% 34% 36% 26%
Company stock 8% 2% 6% 13% 30%
Self-directed brokerage 19% 16% 18% 19% 34%
Managed account program 32% 15% 37% 53% 64%
Source: Vanguard, 2019.
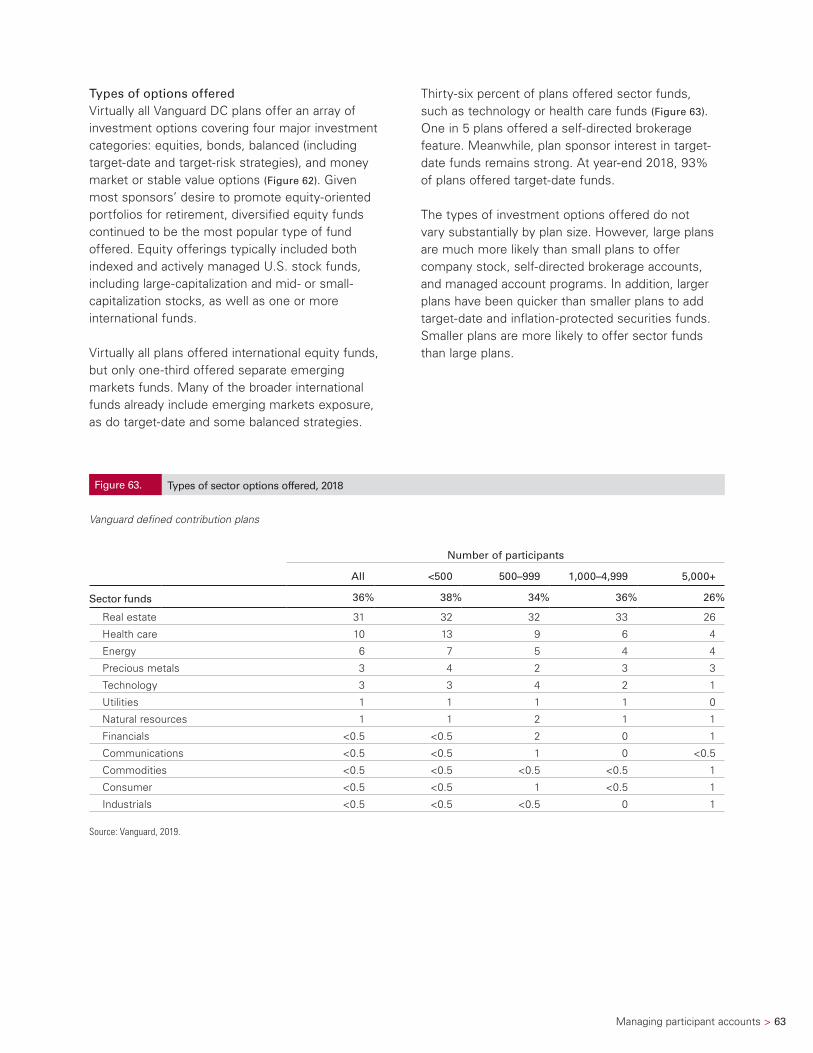
Managing participant accounts > 63
Types of options offeredVirtually all Vanguard DC plans offer an array of investment options covering four major investment categories: equities, bonds, balanced (including target-date and target-risk strategies), and money market or stable value options (Figure 62). Given most sponsors’ desire to promote equity-oriented portfolios for retirement, diversified equity funds continued to be the most popular type of fund offered. Equity offerings typically included both indexed and actively managed U.S. stock funds, including large-capitalization and mid- or small- capitalization stocks, as well as one or more international funds.
Virtually all plans offered international equity funds, but only one-third offered separate emerging markets funds. Many of the broader international funds already include emerging markets exposure, as do target-date and some balanced strategies.
Thirty-six percent of plans offered sector funds, such as technology or health care funds (Figure 63). One in 5 plans offered a self-directed brokerage feature. Meanwhile, plan sponsor interest in target-date funds remains strong. At year-end 2018, 93% of plans offered target-date funds.
The types of investment options offered do not vary substantially by plan size. However, large plans are much more likely than small plans to offer company stock, self-directed brokerage accounts, and managed account programs. In addition, larger plans have been quicker than smaller plans to add target-date and inflation-protected securities funds. Smaller plans are more likely to offer sector funds than large plans.
Figure 63. Types of sector options offered, 2018
Vanguard defined contribution plans
Number of participants
All <500 500–999 1,000–4,999 5,000+
Sector funds 36% 38% 34% 36% 26%
Real estate 31 32 32 33 26
Health care 10 13 9 6 4
Energy 6 7 5 4 4
Precious metals 3 4 2 3 3
Technology 3 3 4 2 1
Utilities 1 1 1 1 0
Natural resources 1 1 2 1 1
Financials <0.5 <0.5 2 0 1
Communications <0.5 <0.5 1 0 <0.5
Commodities <0.5 <0.5 <0.5 <0.5 1
Consumer <0.5 <0.5 1 <0.5 1
Industrials <0.5 <0.5 <0.5 0 1
Source: Vanguard, 2019.
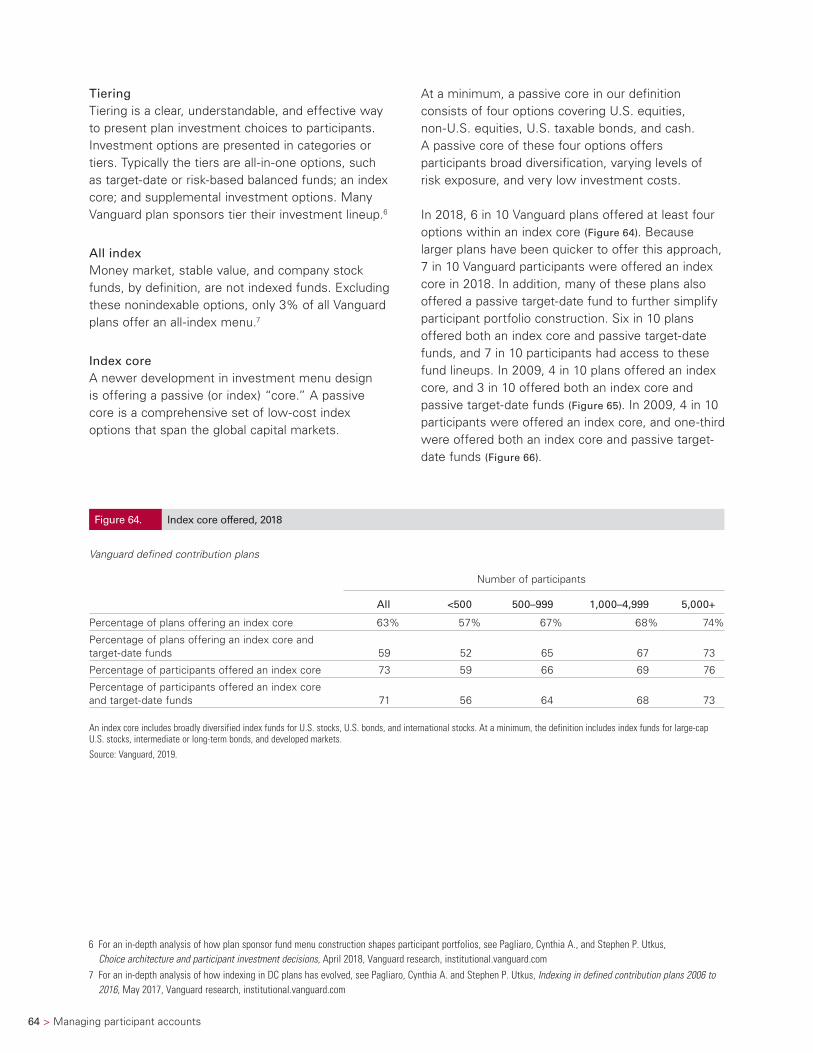
64 > Managing participant accounts
TieringTiering is a clear, understandable, and effective way to present plan investment choices to participants. Investment options are presented in categories or tiers. Typically the tiers are all-in-one options, such as target-date or risk-based balanced funds; an index core; and supplemental investment options. Many Vanguard plan sponsors tier their investment lineup.6
All indexMoney market, stable value, and company stock funds, by definition, are not indexed funds. Excluding these nonindexable options, only 3% of all Vanguard plans offer an all-index menu.7
Index coreA newer development in investment menu design is offering a passive (or index) “core.” A passive core is a comprehensive set of low-cost index options that span the global capital markets.
At a minimum, a passive core in our definition consists of four options covering U.S. equities, non-U.S. equities, U.S. taxable bonds, and cash. A passive core of these four options offers participants broad diversification, varying levels of risk exposure, and very low investment costs.
In 2018, 6 in 10 Vanguard plans offered at least four options within an index core (Figure 64). Because larger plans have been quicker to offer this approach, 7 in 10 Vanguard participants were offered an index core in 2018. In addition, many of these plans also offered a passive target-date fund to further simplify participant portfolio construction. Six in 10 plans offered both an index core and passive target-date funds, and 7 in 10 participants had access to these fund lineups. In 2009, 4 in 10 plans offered an index core, and 3 in 10 offered both an index core and passive target-date funds (Figure 65). In 2009, 4 in 10 participants were offered an index core, and one-third were offered both an index core and passive target-date funds (Figure 66).
6 For an in-depth analysis of how plan sponsor fund menu construction shapes participant portfolios, see Pagliaro, Cynthia A., and Stephen P. Utkus, Choice architecture and participant investment decisions, April 2018, Vanguard research, institutional.vanguard.com
7 For an in-depth analysis of how indexing in DC plans has evolved, see Pagliaro, Cynthia A. and Stephen P. Utkus, Indexing in defined contribution plans 2006 to 2016, May 2017, Vanguard research, institutional.vanguard.com
Figure 64. Index core offered, 2018
Vanguard defined contribution plans
Number of participants
All <500 500–999 1,000–4,999 5,000+
Percentage of plans offering an index core 63% 57% 67% 68% 74%
Percentage of plans offering an index core and target-date funds 59 52 65 67 73
Percentage of participants offered an index core 73 59 66 69 76
Percentage of participants offered an index core and target-date funds 71 56 64 68 73
An index core includes broadly diversified index funds for U.S. stocks, U.S. bonds, and international stocks. At a minimum, the definition includes index funds for large-cap U.S. stocks, intermediate or long-term bonds, and developed markets.
Source: Vanguard, 2019.
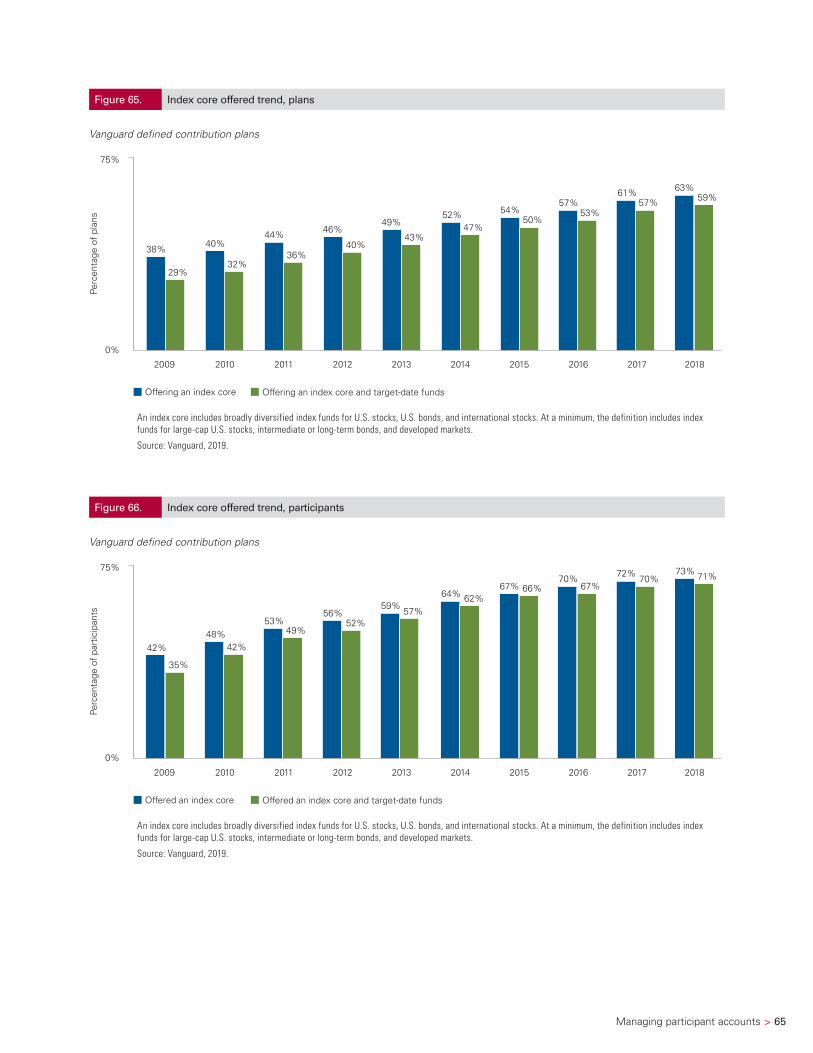
Managing participant accounts > 65
Figure 65. Index core offered trend, plans
Vanguard defined contribution plans
Perc
enta
ge o
f pl
ans
0%
75%
Offering an index core Offering an index core and target-date funds
2009 2010 2011 2012 2013 2014 2015 2016 2017 2018
38% 40%44%
40%
46%49%
52%
29%32%
36%
43%47%
54%50%
57%53%
61%57%
63%59%
An index core includes broadly diversified index funds for U.S. stocks, U.S. bonds, and international stocks. At a minimum, the definition includes index funds for large-cap U.S. stocks, intermediate or long-term bonds, and developed markets.
Source: Vanguard, 2019.
Figure 66. Index core offered trend, participants
Vanguard defined contribution plans
72%70%
Perc
enta
ge o
f pa
rtic
ipan
ts
0%
75%
Offered an index core Offered an index core and target-date funds
2009 2010 2011 2012 2013 2014 2015 2016 2017 2018
42%48% 49%
53%56%
59% 64%
35%
42%
52%57%
62%67% 66%
70%67%
73% 71%
An index core includes broadly diversified index funds for U.S. stocks, U.S. bonds, and international stocks. At a minimum, the definition includes index funds for large-cap U.S. stocks, intermediate or long-term bonds, and developed markets.
Source: Vanguard, 2019.
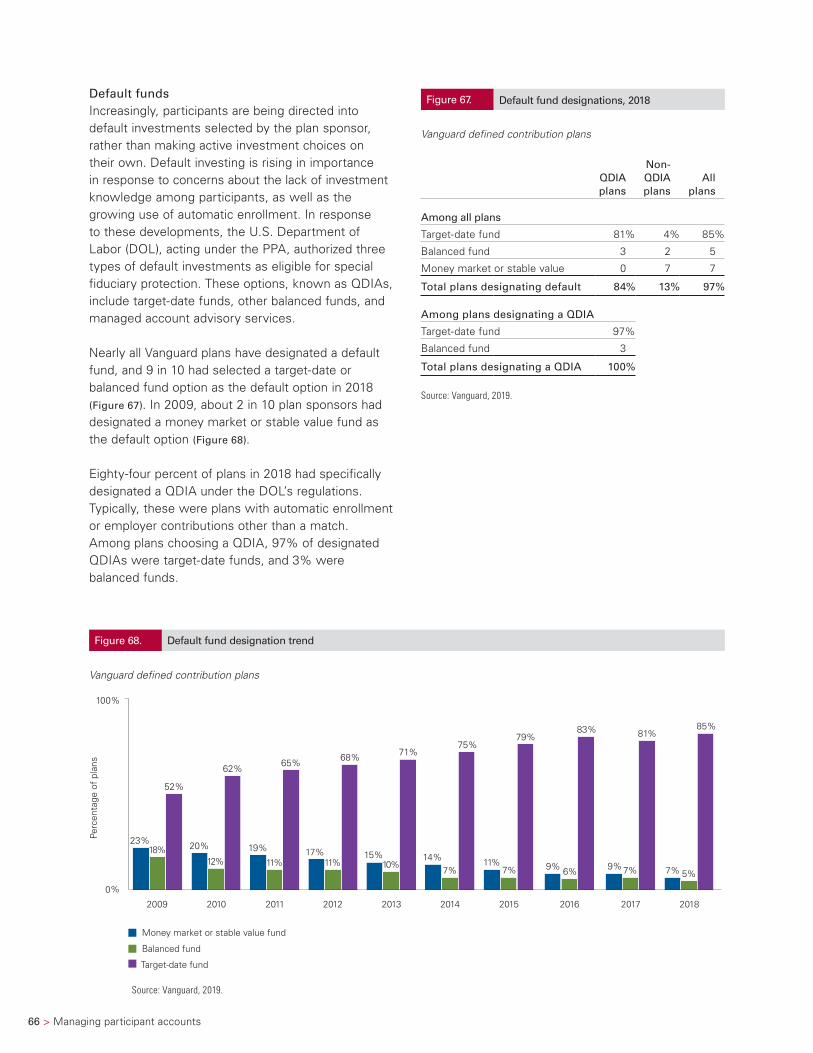
66 > Managing participant accounts
Default fundsIncreasingly, participants are being directed into default investments selected by the plan sponsor, rather than making active investment choices on their own. Default investing is rising in importance in response to concerns about the lack of investment knowledge among participants, as well as the growing use of automatic enrollment. In response to these developments, the U.S. Department of Labor (DOL), acting under the PPA, authorized three types of default investments as eligible for special fiduciary protection. These options, known as QDIAs, include target-date funds, other balanced funds, and managed account advisory services.
Nearly all Vanguard plans have designated a default fund, and 9 in 10 had selected a target-date or balanced fund option as the default option in 2018 (Figure 67). In 2009, about 2 in 10 plan sponsors had designated a money market or stable value fund as the default option (Figure 68).
Eighty-four percent of plans in 2018 had specifically designated a QDIA under the DOL’s regulations. Typically, these were plans with automatic enrollment or employer contributions other than a match. Among plans choosing a QDIA, 97% of designated QDIAs were target-date funds, and 3% were balanced funds.
Figure 68. Default fund designation trend
Vanguard defined contribution plans
2018
9%
81%
7%
Money market or stable value fund
Balanced fund
Target-date fund
23% 20% 19% 17% 15%
52%
62% 65% 68% 71%
0%
100%
2009 2010 2011 2012 2013 2014 2015 2016 2017
Perc
enta
ge o
f pl
ans
12% 11% 11%18%
10%14%
75%
7%11%
79%
7% 9%
83%
6% 7%
85%
5%
Source: Vanguard, 2019.
Figure 67. Default fund designations, 2018
Vanguard defined contribution plans
QDIA plans
Non-QDIA plans
All plans
Among all plans
Target-date fund 81% 4% 85%
Balanced fund 3 2 5
Money market or stable value 0 7 7
Total plans designating default 84% 13% 97%
Among plans designating a QDIA
Target-date fund 97%
Balanced fund 3
Total plans designating a QDIA 100%
Source: Vanguard, 2019.
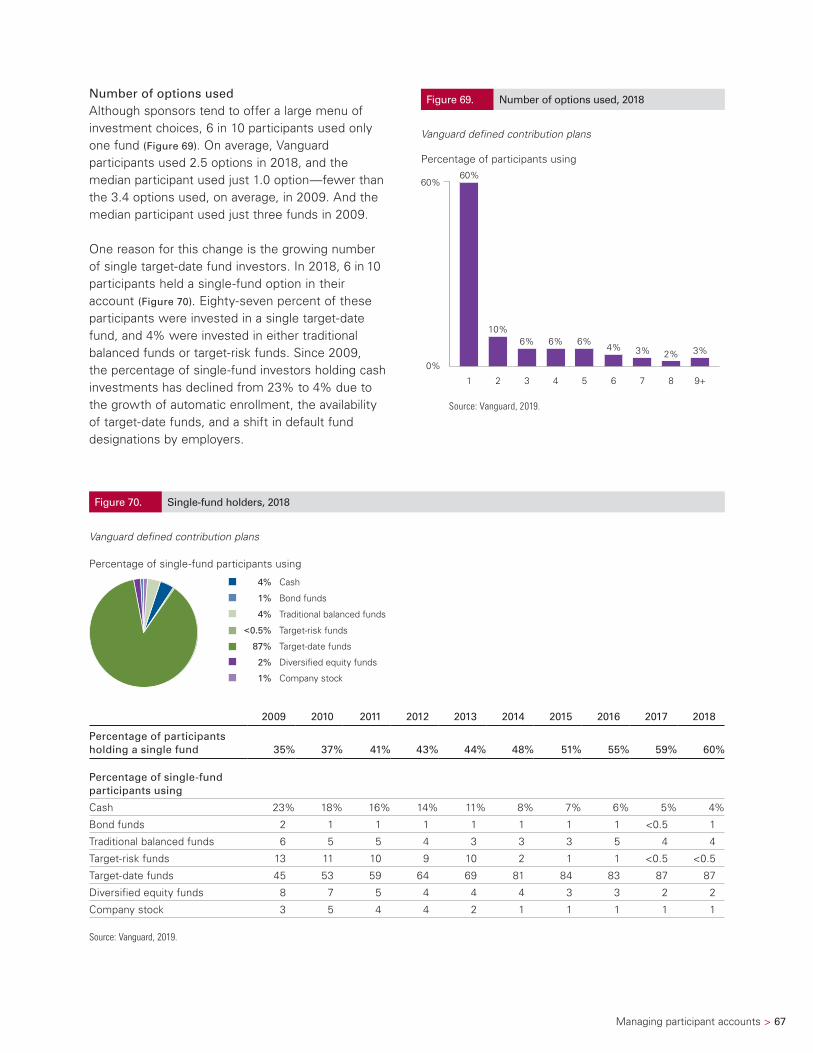
Managing participant accounts > 67
Number of options usedAlthough sponsors tend to offer a large menu of investment choices, 6 in 10 participants used only one fund (Figure 69). On average, Vanguard participants used 2.5 options in 2018, and the median participant used just 1.0 option—fewer than the 3.4 options used, on average, in 2009. And the median participant used just three funds in 2009.
One reason for this change is the growing number of single target-date fund investors. In 2018, 6 in 10 participants held a single-fund option in their account (Figure 70). Eighty-seven percent of these participants were invested in a single target-date fund, and 4% were invested in either traditional balanced funds or target-risk funds. Since 2009, the percentage of single-fund investors holding cash investments has declined from 23% to 4% due to the growth of automatic enrollment, the availability of target-date funds, and a shift in default fund designations by employers.
Figure 70. Single-fund holders, 2018
Vanguard defined contribution plans
Percentage of single-fund participants using
4% Cash
1% Bond funds
4% Traditional balanced funds
<0.5% Target-risk funds
87% Target-date funds
2% Diversi�ed equity funds
1% Company stock
2009 2010 2011 2012 2013 2014 2015 2016 2017 2018
Percentage of participants holding a single fund 35% 37% 41% 43% 44% 48% 51% 55% 59% 60%
Percentage of single-fund participants using
Cash 23% 18% 16% 14% 11% 8% 7% 6% 5% 4%
Bond funds 2 1 1 1 1 1 1 1 <0.5 1
Traditional balanced funds 6 5 5 4 3 3 3 5 4 4
Target-risk funds 13 11 10 9 10 2 1 1 <0.5 <0.5
Target-date funds 45 53 59 64 69 81 84 83 87 87
Diversified equity funds 8 7 5 4 4 4 3 3 2 2
Company stock 3 5 4 4 2 1 1 1 1 1
Source: Vanguard, 2019.
Figure 69. Number of options used, 2018
Vanguard defined contribution plans
Percentage of participants using
1 2 3 4 5 6 7 8 9+
0%
60% 60%
10%6% 6% 6%
4% 3% 2% 3%
Source: Vanguard, 2019.
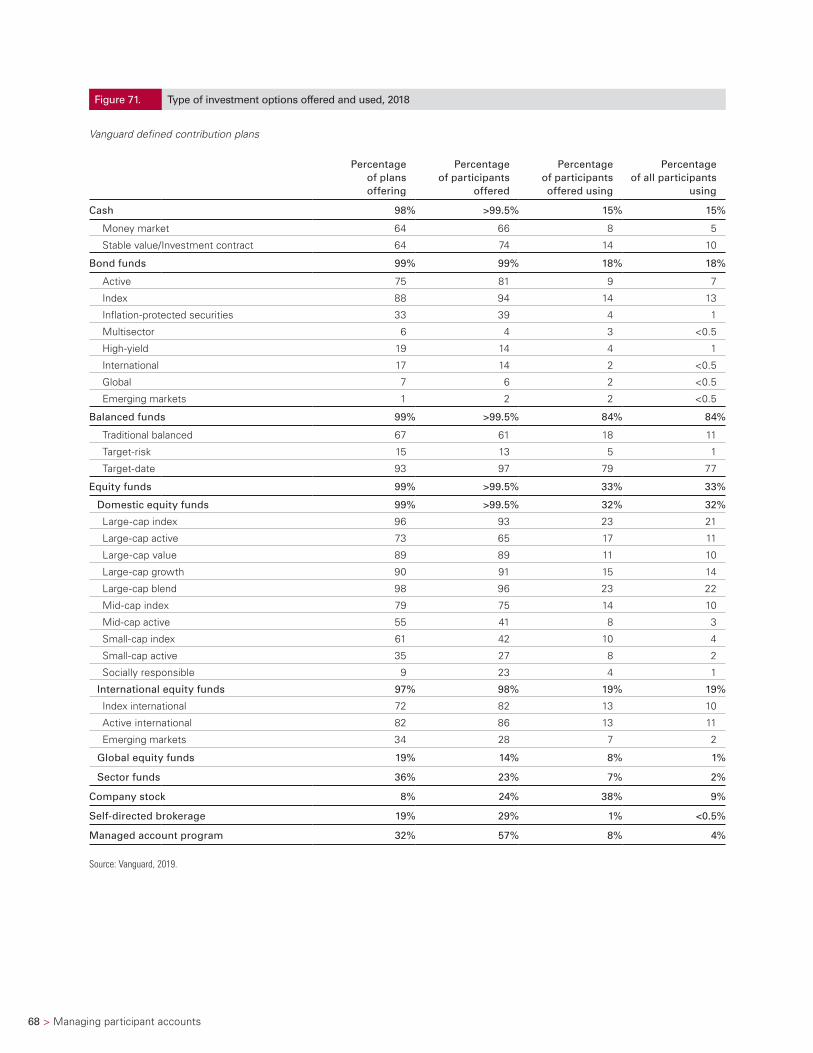
68 > Managing participant accounts
Figure 71. Type of investment options offered and used, 2018
Vanguard defined contribution plans
Percentage of plans offering
Percentage of participants
offered
Percentage of participants offered using
Percentage of all participants
using
Cash 98% >99.5% 15% 15%
Money market 64 66 8 5
Stable value/Investment contract 64 74 14 10
Bond funds 99% 99% 18% 18%
Active 75 81 9 7
Index 88 94 14 13
Inflation-protected securities 33 39 4 1
Multisector 6 4 3 <0.5
High-yield 19 14 4 1
International 17 14 2 <0.5
Global 7 6 2 <0.5
Emerging markets 1 2 2 <0.5
Balanced funds 99% >99.5% 84% 84%
Traditional balanced 67 61 18 11
Target-risk 15 13 5 1
Target-date 93 97 79 77
Equity funds 99% >99.5% 33% 33%
Domestic equity funds 99% >99.5% 32% 32%
Large-cap index 96 93 23 21
Large-cap active 73 65 17 11
Large-cap value 89 89 11 10
Large-cap growth 90 91 15 14
Large-cap blend 98 96 23 22
Mid-cap index 79 75 14 10
Mid-cap active 55 41 8 3
Small-cap index 61 42 10 4
Small-cap active 35 27 8 2
Socially responsible 9 23 4 1
International equity funds 97% 98% 19% 19%
Index international 72 82 13 10
Active international 82 86 13 11
Emerging markets 34 28 7 2
Global equity funds 19% 14% 8% 1%
Sector funds 36% 23% 7% 2%
Company stock 8% 24% 38% 9%
Self-directed brokerage 19% 29% 1% <0.5%
Managed account program 32% 57% 8% 4%
Source: Vanguard, 2019.
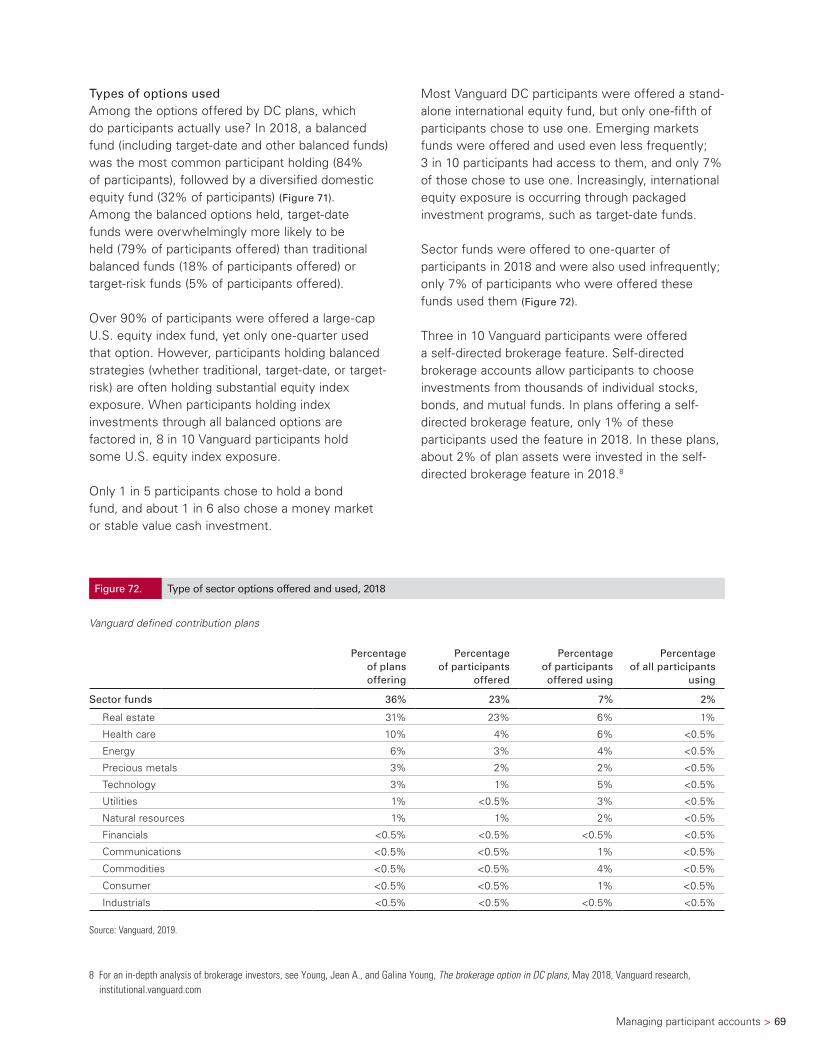
Managing participant accounts > 69
Types of options usedAmong the options offered by DC plans, which do participants actually use? In 2018, a balanced fund (including target-date and other balanced funds) was the most common participant holding (84% of participants), followed by a diversified domestic equity fund (32% of participants) (Figure 71). Among the balanced options held, target-date funds were overwhelmingly more likely to be held (79% of participants offered) than traditional balanced funds (18% of participants offered) or target-risk funds (5% of participants offered).
Over 90% of participants were offered a large-cap U.S. equity index fund, yet only one-quarter used that option. However, participants holding balanced strategies (whether traditional, target-date, or target-risk) are often holding substantial equity index exposure. When participants holding index investments through all balanced options are factored in, 8 in 10 Vanguard participants hold some U.S. equity index exposure.
Only 1 in 5 participants chose to hold a bond fund, and about 1 in 6 also chose a money market or stable value cash investment.
Most Vanguard DC participants were offered a stand-alone international equity fund, but only one-fifth of participants chose to use one. Emerging markets funds were offered and used even less frequently; 3 in 10 participants had access to them, and only 7% of those chose to use one. Increasingly, international equity exposure is occurring through packaged investment programs, such as target-date funds.
Sector funds were offered to one-quarter of participants in 2018 and were also used infrequently; only 7% of participants who were offered these funds used them (Figure 72).
Three in 10 Vanguard participants were offered a self-directed brokerage feature. Self-directed brokerage accounts allow participants to choose investments from thousands of individual stocks, bonds, and mutual funds. In plans offering a self-directed brokerage feature, only 1% of these participants used the feature in 2018. In these plans, about 2% of plan assets were invested in the self-directed brokerage feature in 2018.8
8 For an in-depth analysis of brokerage investors, see Young, Jean A., and Galina Young, The brokerage option in DC plans, May 2018, Vanguard research, institutional.vanguard.com
Figure 72. Type of sector options offered and used, 2018
Vanguard defined contribution plans
Percentage of plans offering
Percentage of participants
offered
Percentage of participants offered using
Percentage of all participants
using
Sector funds 36% 23% 7% 2%
Real estate 31% 23% 6% 1%
Health care 10% 4% 6% <0.5%
Energy 6% 3% 4% <0.5%
Precious metals 3% 2% 2% <0.5%
Technology 3% 1% 5% <0.5%
Utilities 1% <0.5% 3% <0.5%
Natural resources 1% 1% 2% <0.5%
Financials <0.5% <0.5% <0.5% <0.5%
Communications <0.5% <0.5% 1% <0.5%
Commodities <0.5% <0.5% 4% <0.5%
Consumer <0.5% <0.5% 1% <0.5%
Industrials <0.5% <0.5% <0.5% <0.5%
Source: Vanguard, 2019.
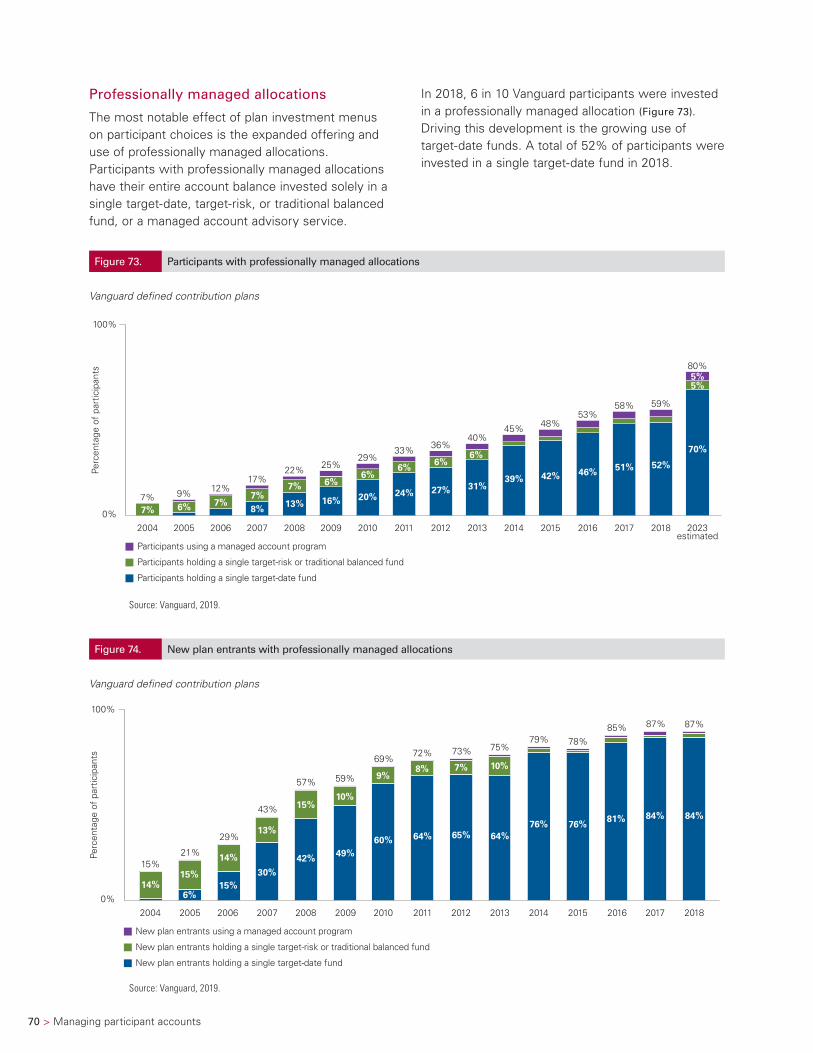
70 > Managing participant accounts
Professionally managed allocations
The most notable effect of plan investment menus on participant choices is the expanded offering and use of professionally managed allocations. Participants with professionally managed allocations have their entire account balance invested solely in a single target-date, target-risk, or traditional balanced fund, or a managed account advisory service.
In 2018, 6 in 10 Vanguard participants were invested in a professionally managed allocation (Figure 73). Driving this development is the growing use of target-date funds. A total of 52% of participants were invested in a single target-date fund in 2018.
Figure 73. Participants with professionally managed allocations
Vanguard defined contribution plans
3%3% 3%
7% 9% 12%17%
22% 25%29%
33% 36%40%
45% 48%53%
58% 59%
80%
70%
31%
46%
13% 16% 20% 24% 27%39% 42%
51% 52%
8%7% 6% 7%7%
6%
7% 6%6%
6%6%
5%5%
0%
100%
Perc
enta
ge o
f pa
rtic
ipan
ts
Participants holding a single target-date fund
Participants holding a single target-risk or traditional balanced fund
Participants using a managed account program
2008 2009 2010 2011 2012 2013 2014 2015 2016 2017 2018 2023estimated
2004 2005 2006 2007
Source: Vanguard, 2019.
Figure 74. New plan entrants with professionally managed allocations
Vanguard defined contribution plans
14%
15%15%
21% 14%
29%
15%6%
13%
30%
42%
15%10%
49%60% 64% 65% 64%
76% 76%84%81% 84%
9%8% 7% 10%
43%
57% 59%
69%72% 73% 75%
79% 78%85% 87% 87%
0%
100%
Perc
enta
ge o
f pa
rtic
ipan
ts
New plan entrants holding a single target-date fund
New plan entrants holding a single target-risk or traditional balanced fund
New plan entrants using a managed account program
2008 2009 2010 2011 2012 2013 2014 2015 2016 2017 20182004 2005 2006 2007
Source: Vanguard, 2019.
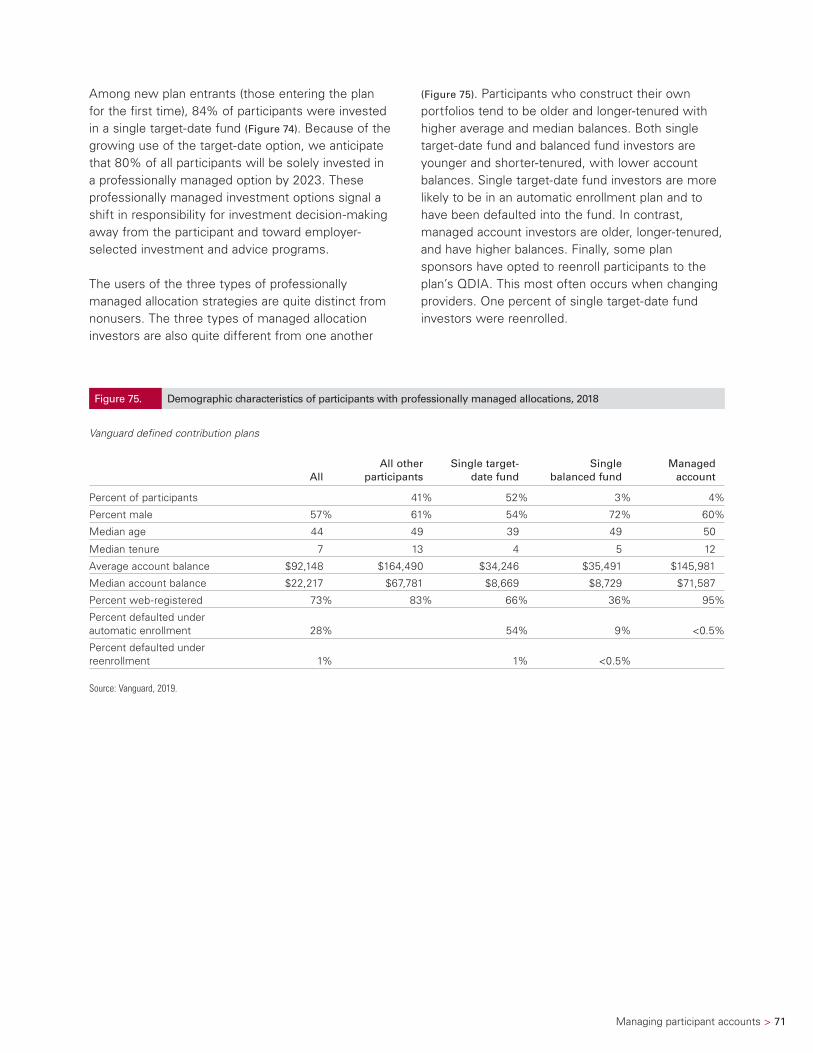
Managing participant accounts > 71
Among new plan entrants (those entering the plan for the first time), 84% of participants were invested in a single target-date fund (Figure 74). Because of the growing use of the target-date option, we anticipate that 80% of all participants will be solely invested in a professionally managed option by 2023. These professionally managed investment options signal a shift in responsibility for investment decision-making away from the participant and toward employer-selected investment and advice programs.
The users of the three types of professionally managed allocation strategies are quite distinct from nonusers. The three types of managed allocation investors are also quite different from one another
(Figure 75). Participants who construct their own portfolios tend to be older and longer-tenured with higher average and median balances. Both single target-date fund and balanced fund investors are younger and shorter-tenured, with lower account balances. Single target-date fund investors are more likely to be in an automatic enrollment plan and to have been defaulted into the fund. In contrast, managed account investors are older, longer-tenured, and have higher balances. Finally, some plan sponsors have opted to reenroll participants to the plan’s QDIA. This most often occurs when changing providers. One percent of single target-date fund investors were reenrolled.
Figure 75. Demographic characteristics of participants with professionally managed allocations, 2018
Vanguard defined contribution plans
AllAll other
participantsSingle target-
date fundSingle
balanced fundManaged
account
Percent of participants 41% 52% 3% 4%
Percent male 57% 61% 54% 72% 60%
Median age 44 49 39 49 50
Median tenure 7 13 4 5 12
Average account balance $92,148 $164,490 $34,246 $35,491 $145,981
Median account balance $22,217 $67,781 $8,669 $8,729 $71,587
Percent web-registered 73% 83% 66% 36% 95%
Percent defaulted under automatic enrollment 28% 54% 9% <0.5%
Percent defaulted under reenrollment 1% 1% <0.5%
Source: Vanguard, 2019.
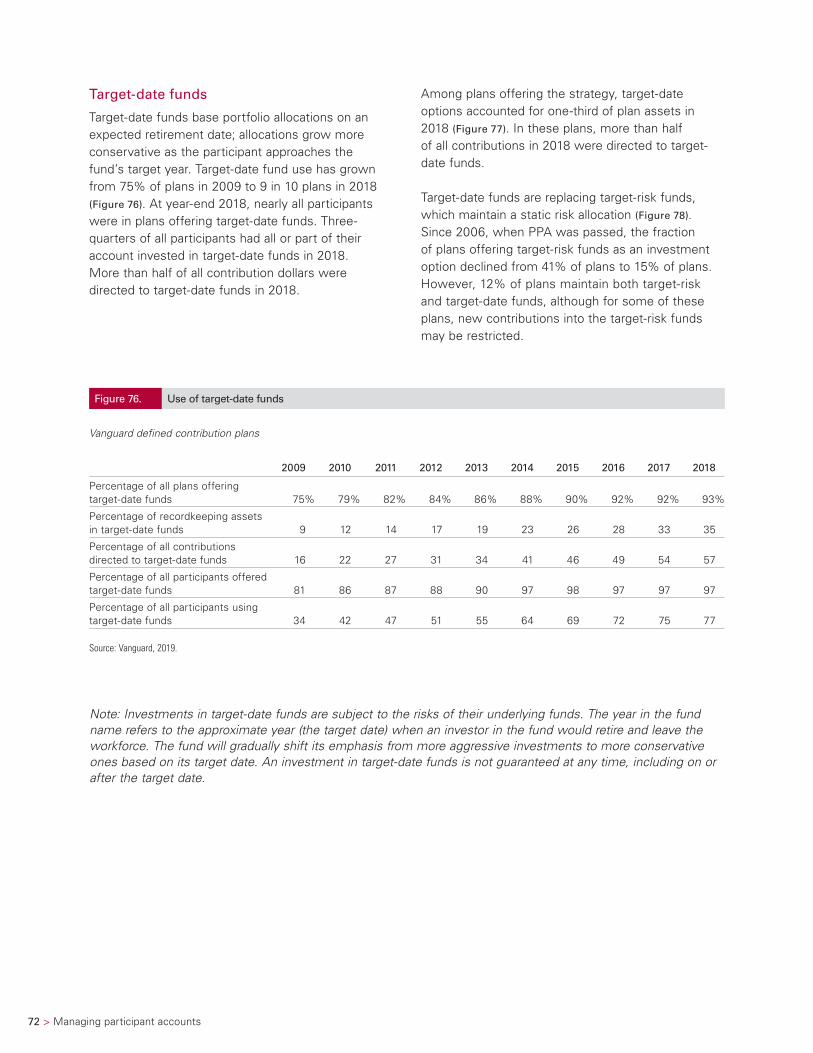
72 > Managing participant accounts
Note: Investments in target-date funds are subject to the risks of their underlying funds. The year in the fund name refers to the approximate year (the target date) when an investor in the fund would retire and leave the workforce. The fund will gradually shift its emphasis from more aggressive investments to more conservative ones based on its target date. An investment in target-date funds is not guaranteed at any time, including on or after the target date.
Target-date funds
Target-date funds base portfolio allocations on an expected retirement date; allocations grow more conservative as the participant approaches the fund’s target year. Target-date fund use has grown from 75% of plans in 2009 to 9 in 10 plans in 2018 (Figure 76). At year-end 2018, nearly all participants were in plans offering target-date funds. Three-quarters of all participants had all or part of their account invested in target-date funds in 2018. More than half of all contribution dollars were directed to target-date funds in 2018.
Among plans offering the strategy, target-date options accounted for one-third of plan assets in 2018 (Figure 77). In these plans, more than half of all contributions in 2018 were directed to target- date funds.
Target-date funds are replacing target-risk funds, which maintain a static risk allocation (Figure 78). Since 2006, when PPA was passed, the fraction of plans offering target-risk funds as an investment option declined from 41% of plans to 15% of plans. However, 12% of plans maintain both target-risk and target-date funds, although for some of these plans, new contributions into the target-risk funds may be restricted.
Figure 76. Use of target-date funds
Vanguard defined contribution plans
2009 2010 2011 2012 2013 2014 2015 2016 2017 2018
Percentage of all plans offering target-date funds 75% 79% 82% 84% 86% 88% 90% 92% 92% 93%
Percentage of recordkeeping assets in target-date funds 9 12 14 17 19 23 26 28 33 35
Percentage of all contributions directed to target-date funds 16 22 27 31 34 41 46 49 54 57
Percentage of all participants offered target-date funds 81 86 87 88 90 97 98 97 97 97
Percentage of all participants using target-date funds 34 42 47 51 55 64 69 72 75 77
Source: Vanguard, 2019.
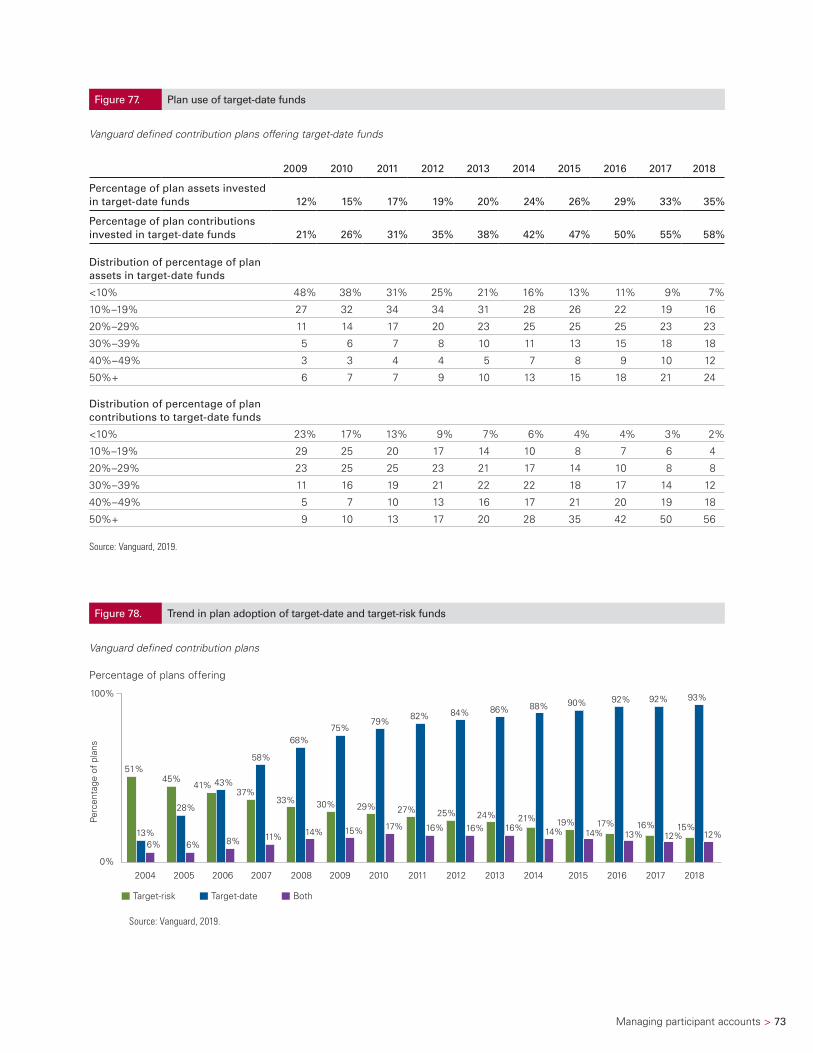
Managing participant accounts > 73
Figure 77. Plan use of target-date funds
Vanguard defined contribution plans offering target-date funds
2009 2010 2011 2012 2013 2014 2015 2016 2017 2018
Percentage of plan assets invested in target-date funds 12% 15% 17% 19% 20% 24% 26% 29% 33% 35%
Percentage of plan contributions invested in target-date funds 21% 26% 31% 35% 38% 42% 47% 50% 55% 58%
Distribution of percentage of plan assets in target-date funds
<10% 48% 38% 31% 25% 21% 16% 13% 11% 9% 7%
10%–19% 27 32 34 34 31 28 26 22 19 16
20%–29% 11 14 17 20 23 25 25 25 23 23
30%–39% 5 6 7 8 10 11 13 15 18 18
40%–49% 3 3 4 4 5 7 8 9 10 12
50%+ 6 7 7 9 10 13 15 18 21 24
Distribution of percentage of plan contributions to target-date funds
<10% 23% 17% 13% 9% 7% 6% 4% 4% 3% 2%
10%–19% 29 25 20 17 14 10 8 7 6 4
20%–29% 23 25 25 23 21 17 14 10 8 8
30%–39% 11 16 19 21 22 22 18 17 14 12
40%–49% 5 7 10 13 16 17 21 20 19 18
50%+ 9 10 13 17 20 28 35 42 50 56
Source: Vanguard, 2019.
Figure 78. Trend in plan adoption of target-date and target-risk funds
Vanguard defined contribution plans
Percentage of plans offering
51% 45%
41% 37%
33% 30% 29% 27% 25% 24% 21% 19% 17% 16% 15% 13%
28%
43%
58%
68% 75%
79% 82% 84% 86% 88% 90% 92% 92% 93%
6% 6% 8% 11% 14% 15% 17% 16% 16% 16% 14% 14% 13% 12% 12%
2004 2005 2006 2007 2008 2009 2010 2011 2012 2013 2014 2015 2016 2017 2018
Target-risk BothTarget-date
Perc
enta
ge o
f pl
ans
0%
100%
Source: Vanguard, 2019.
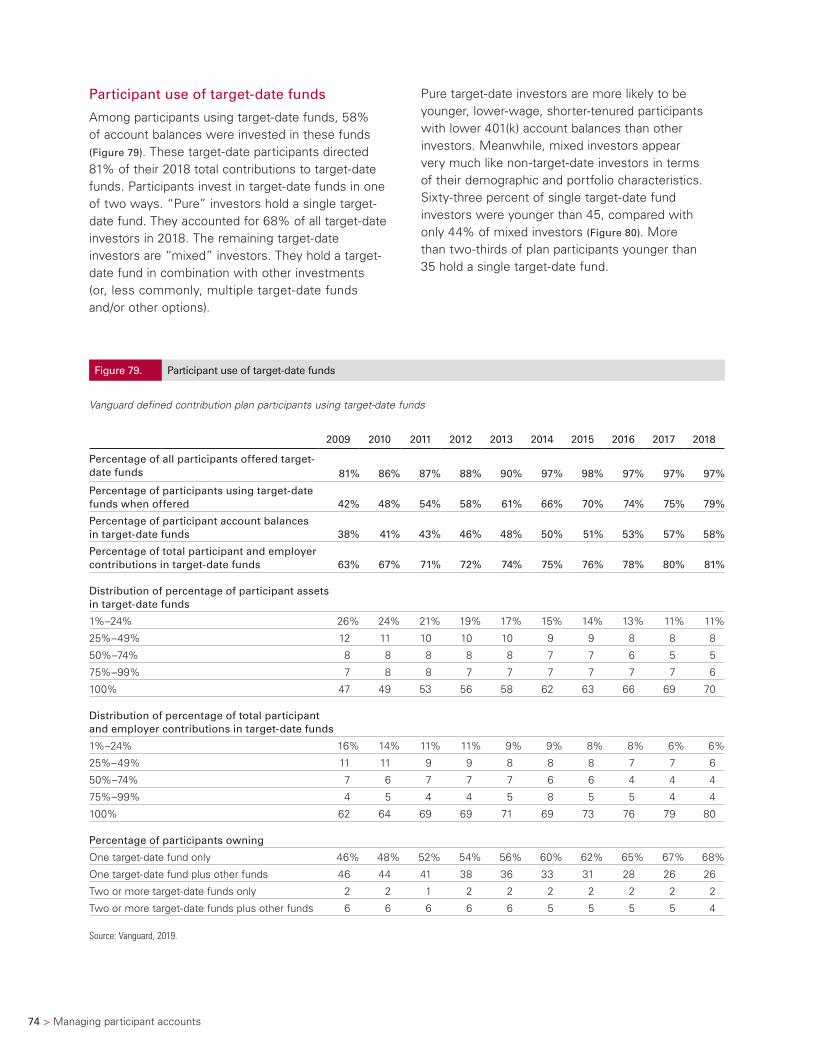
74 > Managing participant accounts
Participant use of target-date funds
Among participants using target-date funds, 58% of account balances were invested in these funds (Figure 79). These target-date participants directed 81% of their 2018 total contributions to target-date funds. Participants invest in target-date funds in one of two ways. “Pure” investors hold a single target-date fund. They accounted for 68% of all target-date investors in 2018. The remaining target-date investors are “mixed” investors. They hold a target-date fund in combination with other investments (or, less commonly, multiple target-date funds and/or other options).
Pure target-date investors are more likely to be younger, lower-wage, shorter-tenured participants with lower 401(k) account balances than other investors. Meanwhile, mixed investors appear very much like non-target-date investors in terms of their demographic and portfolio characteristics. Sixty-three percent of single target-date fund investors were younger than 45, compared with only 44% of mixed investors (Figure 80). More than two-thirds of plan participants younger than 35 hold a single target-date fund.
Figure 79. Participant use of target-date funds
Vanguard defined contribution plan participants using target-date funds
2009 2010 2011 2012 2013 2014 2015 2016 2017 2018
Percentage of all participants offered target-date funds 81% 86% 87% 88% 90% 97% 98% 97% 97% 97%
Percentage of participants using target-date funds when offered 42% 48% 54% 58% 61% 66% 70% 74% 75% 79%
Percentage of participant account balances in target-date funds 38% 41% 43% 46% 48% 50% 51% 53% 57% 58%
Percentage of total participant and employer contributions in target-date funds 63% 67% 71% 72% 74% 75% 76% 78% 80% 81%
Distribution of percentage of participant assets in target-date funds
1%–24% 26% 24% 21% 19% 17% 15% 14% 13% 11% 11%
25%–49% 12 11 10 10 10 9 9 8 8 8
50%–74% 8 8 8 8 8 7 7 6 5 5
75%–99% 7 8 8 7 7 7 7 7 7 6
100% 47 49 53 56 58 62 63 66 69 70
Distribution of percentage of total participant and employer contributions in target-date funds
1%–24% 16% 14% 11% 11% 9% 9% 8% 8% 6% 6%
25%–49% 11 11 9 9 8 8 8 7 7 6
50%–74% 7 6 7 7 7 6 6 4 4 4
75%–99% 4 5 4 4 5 8 5 5 4 4
100% 62 64 69 69 71 69 73 76 79 80
Percentage of participants owning
One target-date fund only 46% 48% 52% 54% 56% 60% 62% 65% 67% 68%
One target-date fund plus other funds 46 44 41 38 36 33 31 28 26 26
Two or more target-date funds only 2 2 1 2 2 2 2 2 2 2
Two or more target-date funds plus other funds 6 6 6 6 6 5 5 5 5 4
Source: Vanguard, 2019.
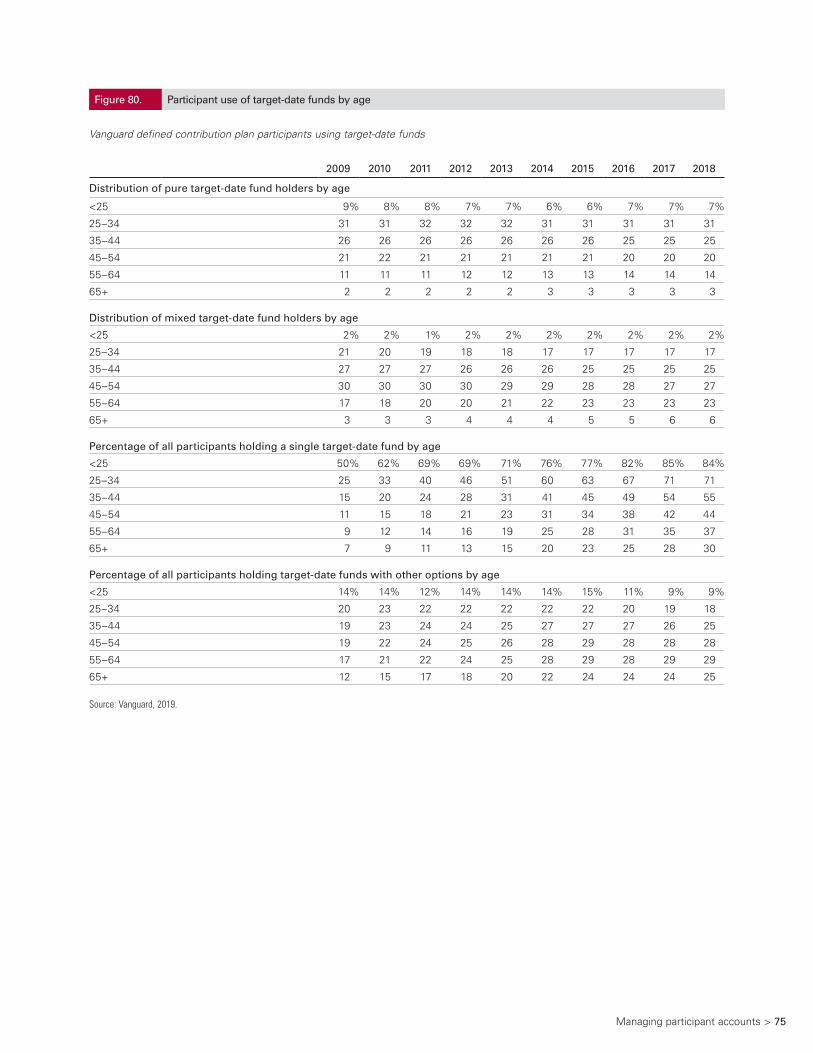
Managing participant accounts > 75
Figure 80. Participant use of target-date funds by age
Vanguard defined contribution plan participants using target-date funds
2009 2010 2011 2012 2013 2014 2015 2016 2017 2018
Distribution of pure target-date fund holders by age
<25 9% 8% 8% 7% 7% 6% 6% 7% 7% 7%
25–34 31 31 32 32 32 31 31 31 31 31
35–44 26 26 26 26 26 26 26 25 25 25
45–54 21 22 21 21 21 21 21 20 20 20
55–64 11 11 11 12 12 13 13 14 14 14
65+ 2 2 2 2 2 3 3 3 3 3
Distribution of mixed target-date fund holders by age
<25 2% 2% 1% 2% 2% 2% 2% 2% 2% 2%
25–34 21 20 19 18 18 17 17 17 17 17
35–44 27 27 27 26 26 26 25 25 25 25
45–54 30 30 30 30 29 29 28 28 27 27
55–64 17 18 20 20 21 22 23 23 23 23
65+ 3 3 3 4 4 4 5 5 6 6
Percentage of all participants holding a single target-date fund by age
<25 50% 62% 69% 69% 71% 76% 77% 82% 85% 84%
25–34 25 33 40 46 51 60 63 67 71 71
35–44 15 20 24 28 31 41 45 49 54 55
45–54 11 15 18 21 23 31 34 38 42 44
55–64 9 12 14 16 19 25 28 31 35 37
65+ 7 9 11 13 15 20 23 25 28 30
Percentage of all participants holding target-date funds with other options by age
<25 14% 14% 12% 14% 14% 14% 15% 11% 9% 9%
25–34 20 23 22 22 22 22 22 20 19 18
35–44 19 23 24 24 25 27 27 27 26 25
45–54 19 22 24 25 26 28 29 28 28 28
55–64 17 21 22 24 25 28 29 28 29 29
65+ 12 15 17 18 20 22 24 24 24 25
Source: Vanguard, 2019.
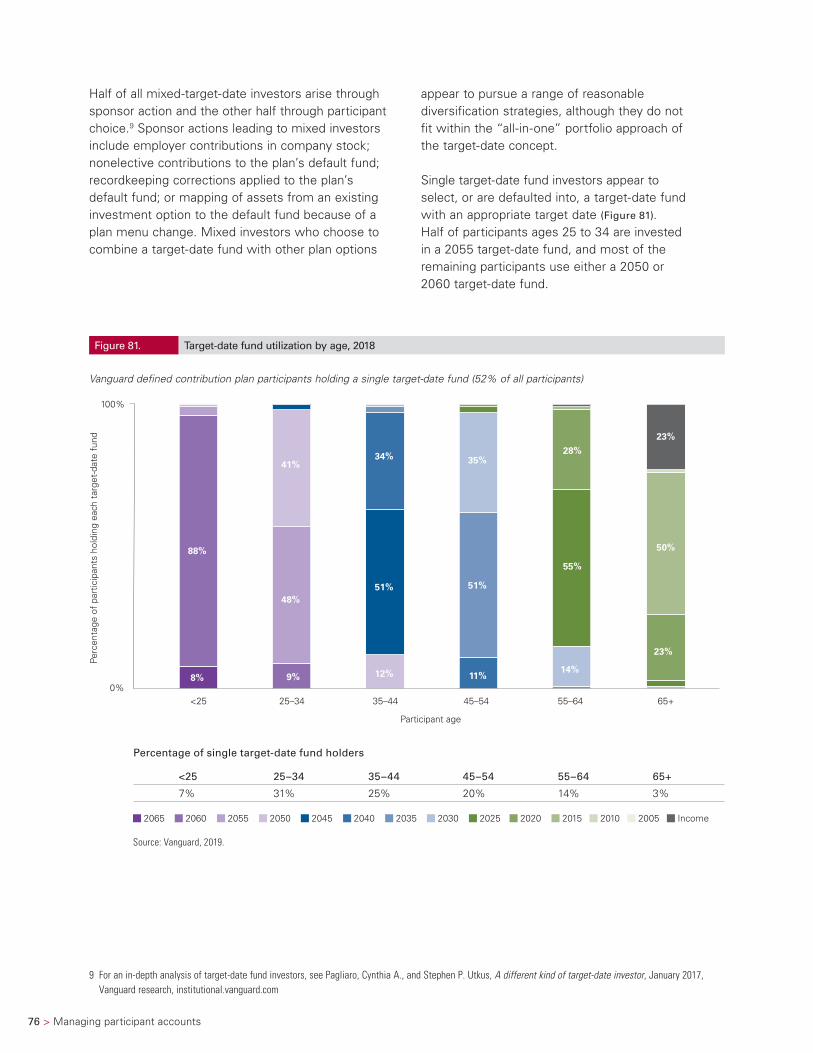
76 > Managing participant accounts
9 For an in-depth analysis of target-date fund investors, see Pagliaro, Cynthia A., and Stephen P. Utkus, A different kind of target-date investor, January 2017, Vanguard research, institutional.vanguard.com
Half of all mixed-target-date investors arise through sponsor action and the other half through participant choice.9 Sponsor actions leading to mixed investors include employer contributions in company stock; nonelective contributions to the plan’s default fund; recordkeeping corrections applied to the plan’s default fund; or mapping of assets from an existing investment option to the default fund because of a plan menu change. Mixed investors who choose to combine a target-date fund with other plan options
appear to pursue a range of reasonable diversification strategies, although they do not fit within the “all-in-one” portfolio approach of the target-date concept.
Single target-date fund investors appear to select, or are defaulted into, a target-date fund with an appropriate target date (Figure 81). Half of participants ages 25 to 34 are invested in a 2055 target-date fund, and most of the remaining participants use either a 2050 or 2060 target-date fund.
Figure 81. Target-date fund utilization by age, 2018
Vanguard defined contribution plan participants holding a single target-date fund (52% of all participants)
88%
8%
41% 34%
51% 51%
35% 28%
55%
14%
50%
23%
23%
48%
9% 12% 11%
Perc
enta
ge o
f pa
rtic
ipan
ts h
oldi
ng e
ach
targ
et-d
ate
fund
Participant age
2065 2060 2055 2050 2045 2040 2035 2030 2025 2020 2015 2010 2005 Income
0%
100%
<25 25–34 35–44 45–54 55–64 65+
Percentage of single target-date fund holders
<25 25–34 35–44 45–54 55–64 65+
7% 31% 25% 20% 14% 3%
88%
8%
41% 34%
51% 51%
35% 28%
55%
14%
50%
23%
23%
48%
9% 12% 11%
Perc
enta
ge o
f pa
rtic
ipan
ts h
oldi
ng e
ach
targ
et-d
ate
fund
Participant age
2065 2060 2055 2050 2045 2040 2035 2030 2025 2020 2015 2010 2005 Income
0%
100%
<25 25–34 35–44 45–54 55–64 65+
Source: Vanguard, 2019.
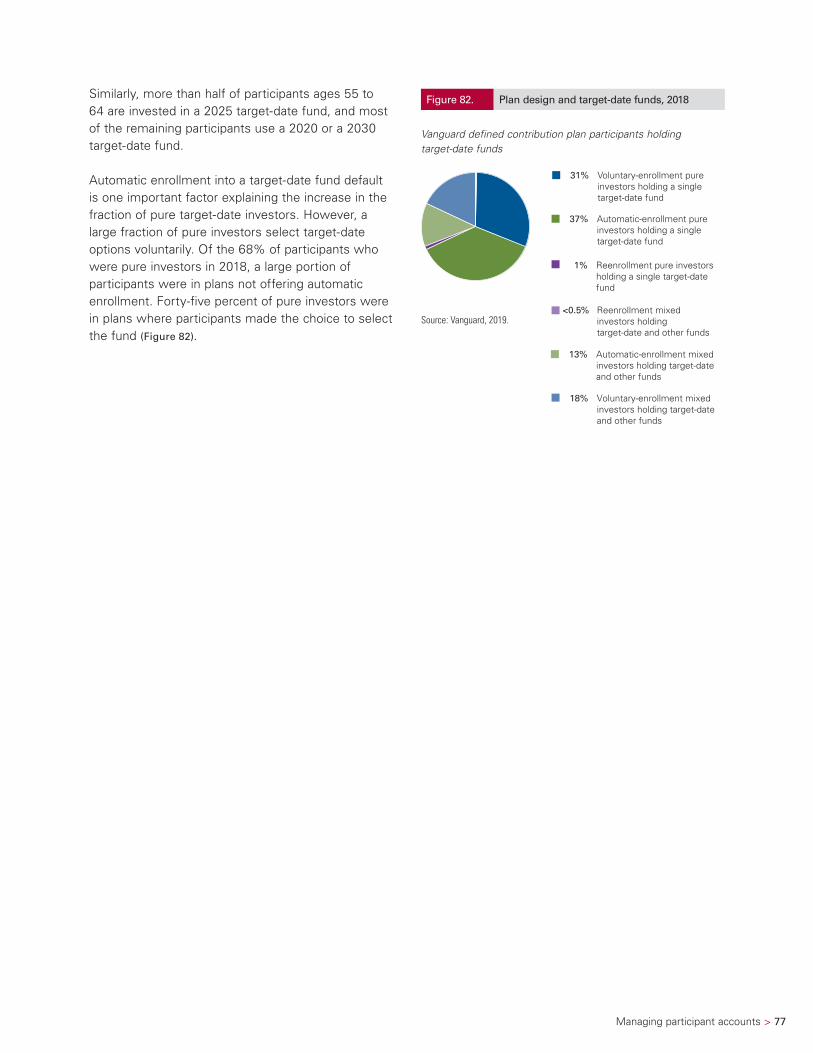
Managing participant accounts > 77
Similarly, more than half of participants ages 55 to 64 are invested in a 2025 target-date fund, and most of the remaining participants use a 2020 or a 2030 target-date fund.
Automatic enrollment into a target-date fund default is one important factor explaining the increase in the fraction of pure target-date investors. However, a large fraction of pure investors select target-date options voluntarily. Of the 68% of participants who were pure investors in 2018, a large portion of participants were in plans not offering automatic enrollment. Forty-five percent of pure investors were in plans where participants made the choice to select the fund (Figure 82).
Figure 82. Plan design and target-date funds, 2018
Vanguard defined contribution plan participants holding target-date funds
31% Voluntary-enrollment pure investors holding a single target-date fund
37% Automatic-enrollment pure investors holding a single target-date fund
13% Automatic-enrollment mixed investors holding target-date and other funds
18% Voluntary-enrollment mixed investors holding target-date and other funds
1% Reenrollment pure investors holding a single target-date fund
<0.5% Reenrollment mixed investors holding target-date and other funds
Source: Vanguard, 2019.
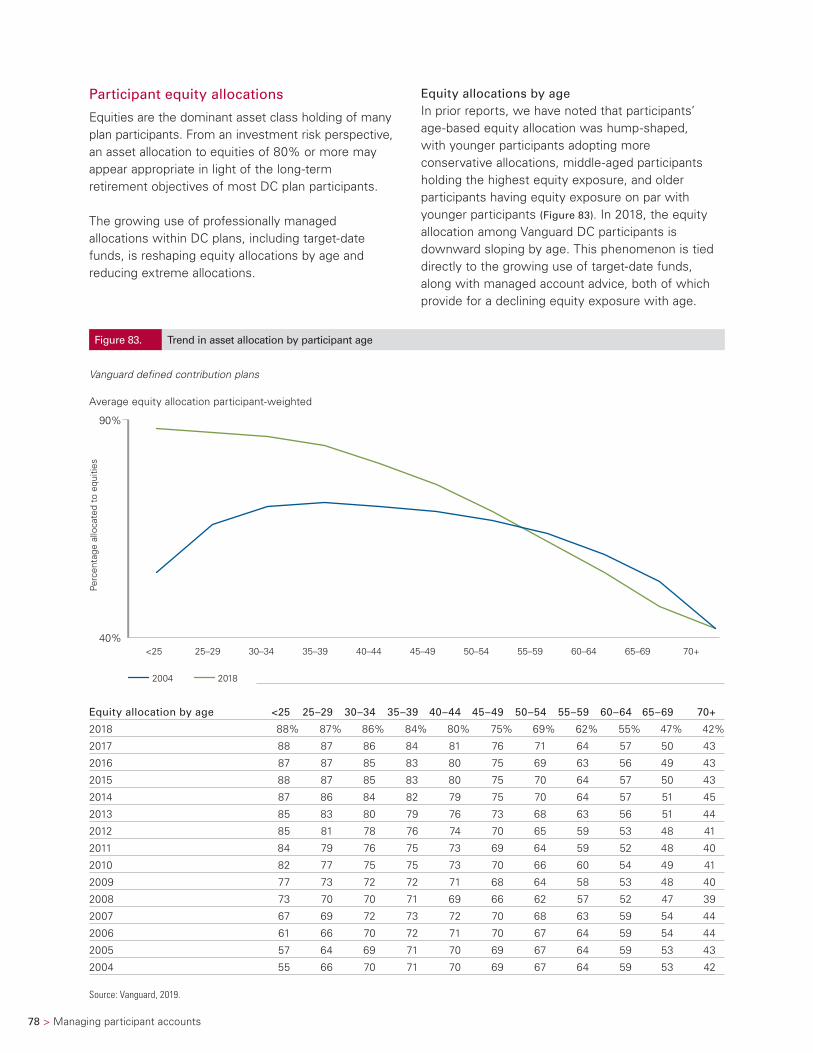
78 > Managing participant accounts
Participant equity allocations
Equities are the dominant asset class holding of many plan participants. From an investment risk perspective, an asset allocation to equities of 80% or more may appear appropriate in light of the long-term retirement objectives of most DC plan participants.
The growing use of professionally managed allocations within DC plans, including target-date funds, is reshaping equity allocations by age and reducing extreme allocations.
Equity allocations by ageIn prior reports, we have noted that participants’ age-based equity allocation was hump-shaped, with younger participants adopting more conservative allocations, middle-aged participants holding the highest equity exposure, and older participants having equity exposure on par with younger participants (Figure 83). In 2018, the equity allocation among Vanguard DC participants is downward sloping by age. This phenomenon is tied directly to the growing use of target-date funds, along with managed account advice, both of which provide for a declining equity exposure with age.
Figure 83. Trend in asset allocation by participant age
Vanguard defined contribution plans
Average equity allocation participant-weighted
2004 2018
Perc
enta
ge a
lloca
ted
to e
quiti
es
40%
90%
<25 25–29 30–34 35–39 40–44 45–49 50–54 55–59 60–64 65–69 70+
Equity allocation by age <25 25–29 30–34 35–39 40–44 45–49 50–54 55–59 60–64 65–69 70+
2018 88% 87% 86% 84% 80% 75% 69% 62% 55% 47% 42%
2017 88 87 86 84 81 76 71 64 57 50 43
2016 87 87 85 83 80 75 69 63 56 49 43
2015 88 87 85 83 80 75 70 64 57 50 43
2014 87 86 84 82 79 75 70 64 57 51 45
2013 85 83 80 79 76 73 68 63 56 51 44
2012 85 81 78 76 74 70 65 59 53 48 41
2011 84 79 76 75 73 69 64 59 52 48 40
2010 82 77 75 75 73 70 66 60 54 49 41
2009 77 73 72 72 71 68 64 58 53 48 40
2008 73 70 70 71 69 66 62 57 52 47 39
2007 67 69 72 73 72 70 68 63 59 54 44
2006 61 66 70 72 71 70 67 64 59 54 44
2005 57 64 69 71 70 69 67 64 59 53 43
2004 55 66 70 71 70 69 67 64 59 53 42
Source: Vanguard, 2019.
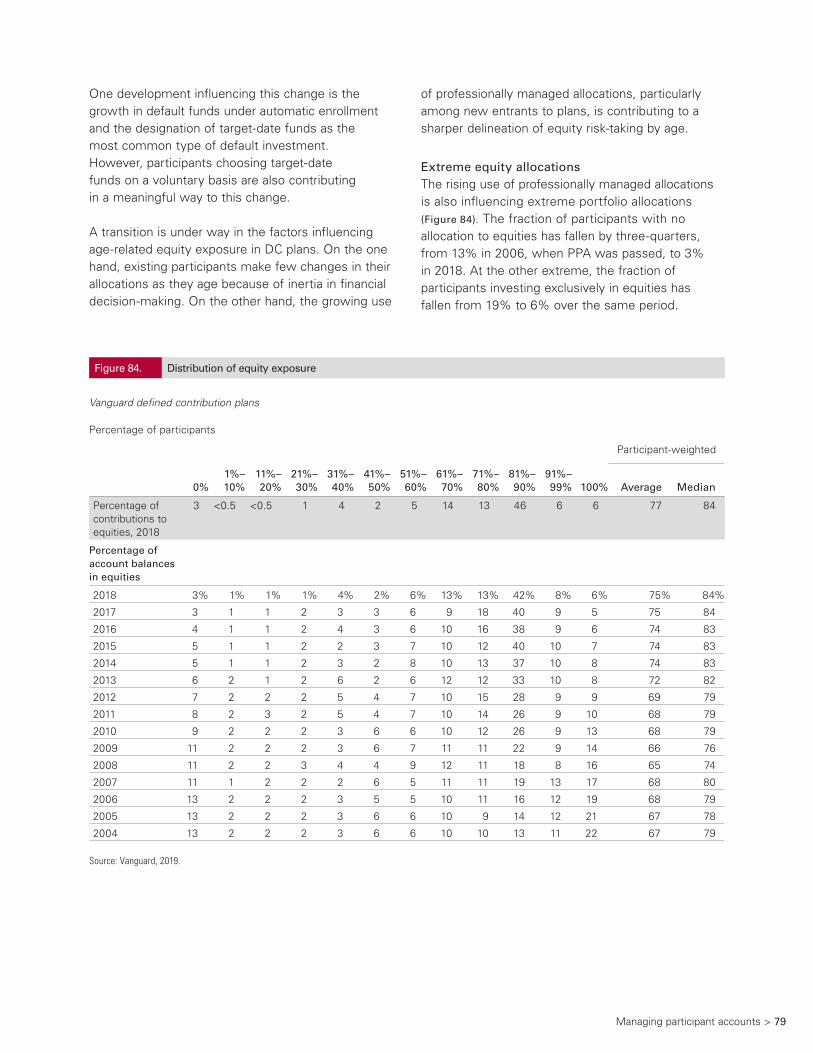
Managing participant accounts > 79
One development influencing this change is the growth in default funds under automatic enrollment and the designation of target-date funds as the most common type of default investment. However, participants choosing target-date funds on a voluntary basis are also contributing in a meaningful way to this change.
A transition is under way in the factors influencing age-related equity exposure in DC plans. On the one hand, existing participants make few changes in their allocations as they age because of inertia in financial decision-making. On the other hand, the growing use
of professionally managed allocations, particularly among new entrants to plans, is contributing to a sharper delineation of equity risk-taking by age.
Extreme equity allocationsThe rising use of professionally managed allocations is also influencing extreme portfolio allocations (Figure 84). The fraction of participants with no allocation to equities has fallen by three-quarters, from 13% in 2006, when PPA was passed, to 3% in 2018. At the other extreme, the fraction of participants investing exclusively in equities has fallen from 19% to 6% over the same period.
Figure 84. Distribution of equity exposure
Vanguard defined contribution plans
Percentage of participants
Participant-weighted
0%1%– 10%
11%–20%
21%–30%
31%–40%
41%–50%
51%–60%
61%–70%
71%–80%
81%–90%
91%–99% 100% Average Median
Percentage of contributions to equities, 2018
3 <0.5 <0.5 1 4 2 5 14 13 46 6 6 77 84
Percentage of account balances in equities
2018 3% 1% 1% 1% 4% 2% 6% 13% 13% 42% 8% 6% 75% 84%
2017 3 1 1 2 3 3 6 9 18 40 9 5 75 84
2016 4 1 1 2 4 3 6 10 16 38 9 6 74 83
2015 5 1 1 2 2 3 7 10 12 40 10 7 74 83
2014 5 1 1 2 3 2 8 10 13 37 10 8 74 83
2013 6 2 1 2 6 2 6 12 12 33 10 8 72 82
2012 7 2 2 2 5 4 7 10 15 28 9 9 69 79
2011 8 2 3 2 5 4 7 10 14 26 9 10 68 79
2010 9 2 2 2 3 6 6 10 12 26 9 13 68 79
2009 11 2 2 2 3 6 7 11 11 22 9 14 66 76
2008 11 2 2 3 4 4 9 12 11 18 8 16 65 74
2007 11 1 2 2 2 6 5 11 11 19 13 17 68 80
2006 13 2 2 2 3 5 5 10 11 16 12 19 68 79
2005 13 2 2 2 3 6 6 10 9 14 12 21 67 78
2004 13 2 2 2 3 6 6 10 10 13 11 22 67 79
Source: Vanguard, 2019.
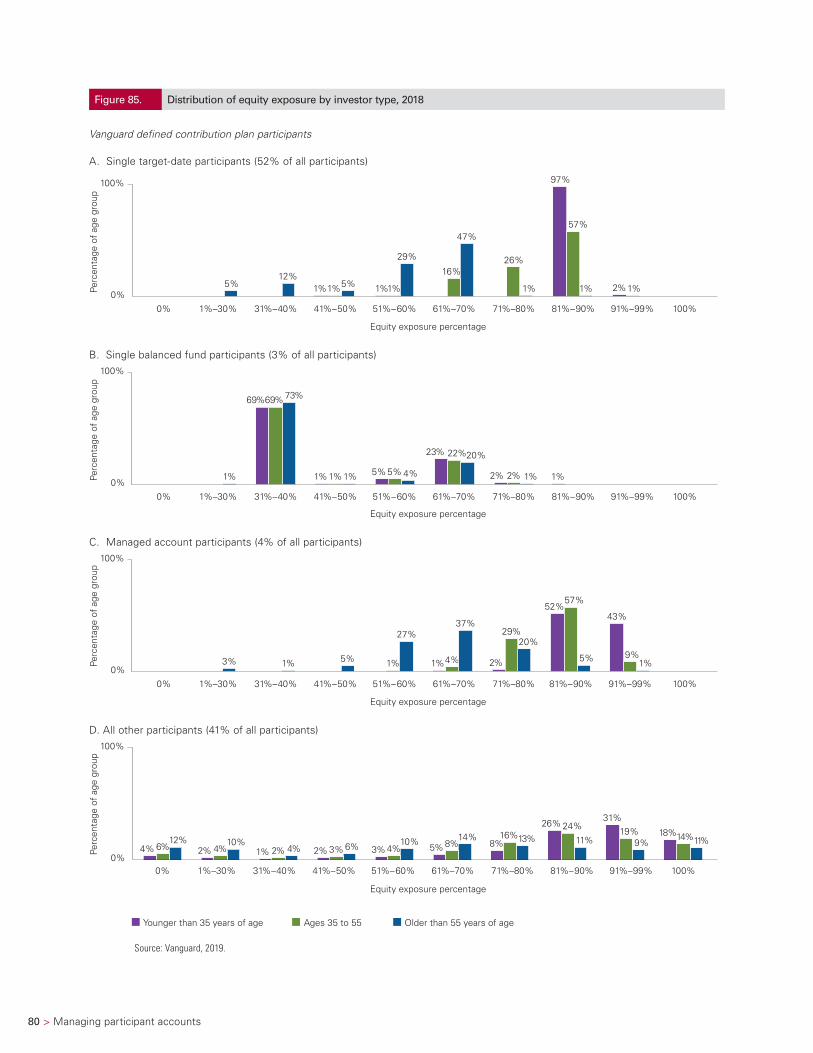
80 > Managing participant accounts
Figure 85. Distribution of equity exposure by investor type, 2018
Vanguard defined contribution plan participants
A. Single target-date participants (52% of all participants)
1% 2%1%
100%
0%5%
12%5%
29%
1%1%
16%
47%
26%
1%
97%
57%
1%1%Perc
enta
ge o
f ag
e gr
oup
Equity exposure percentage
0% 1%–30% 31%–40% 41%–50% 51%–60% 61%–70% 81%–90% 91%–99%71%–80% 100%
B. Single balanced fund participants (3% of all participants)100%
0%1%2%2%
20%22%23%
4%5%5%1%1%1%1%
69% 73%69%
Perc
enta
ge o
f ag
e gr
oup
Equity exposure percentage
0% 1%–30% 31%–40% 41%–50% 51%–60% 61%–70% 81%–90% 91%–99%71%–80% 100%
1%
C. Managed account participants (4% of all participants)100%
0%3% 1% 1% 1%4%
27%37%
29%
52%57%
5%
43%
9%20%
2%1% 5%
Equity exposure percentage
Perc
enta
ge o
f ag
e gr
oup
0% 1%–30% 31%–40% 41%–50% 51%–60% 61%–70% 81%–90% 91%–99%71%–80% 100%
D. All other participants (41% of all participants)100%
0%4% 6%
12% 10%1% 2% 2%4% 4%
10%2% 3% 6%
26% 31%19%
9%18%14%11%
24%
11%3%4% 5%8%
14%8%
16%13%
Equity exposure percentage
Younger than 35 years of age Ages 35 to 55 Older than 55 years of age
Perc
enta
ge o
f ag
e gr
oup
0% 1%–30% 31%–40% 41%–50% 51%–60% 61%–70% 81%–90% 91%–99%71%–80% 100%
Source: Vanguard, 2019.
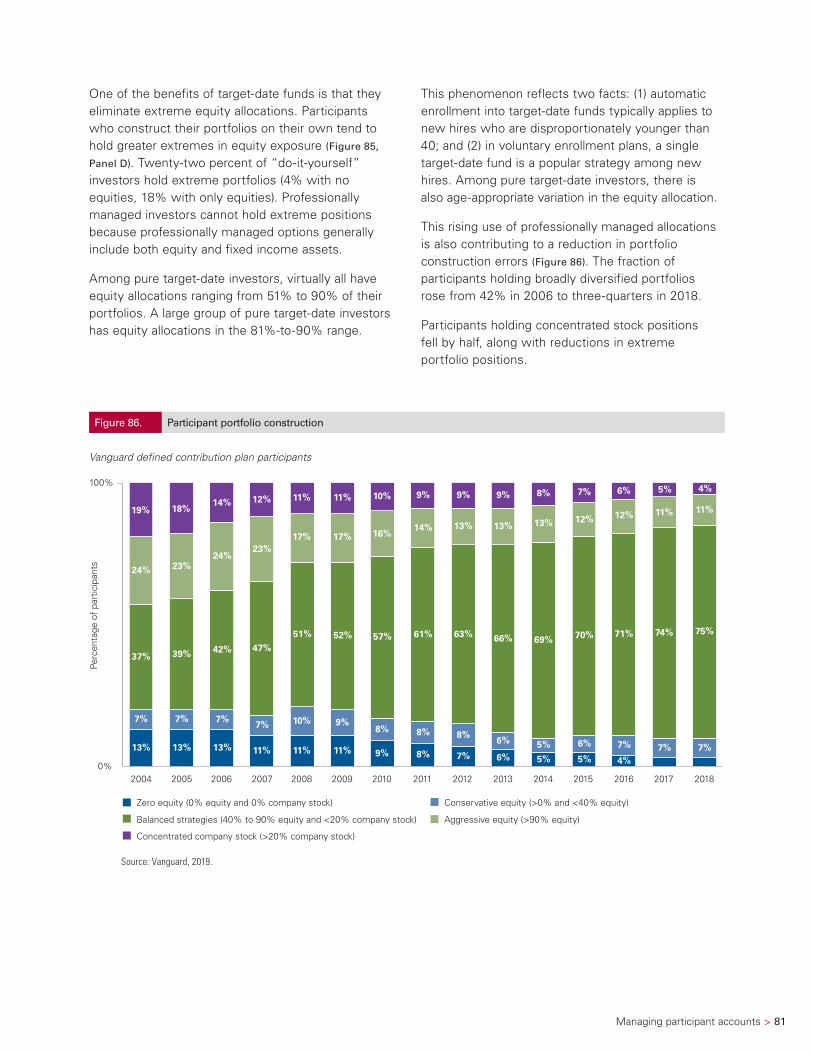
Managing participant accounts > 81
One of the benefits of target-date funds is that they eliminate extreme equity allocations. Participants who construct their portfolios on their own tend to hold greater extremes in equity exposure (Figure 85,
Panel D). Twenty-two percent of “do-it-yourself” investors hold extreme portfolios (4% with no equities, 18% with only equities). Professionally managed investors cannot hold extreme positions because professionally managed options generally include both equity and fixed income assets.
Among pure target-date investors, virtually all have equity allocations ranging from 51% to 90% of their portfolios. A large group of pure target-date investors has equity allocations in the 81%-to-90% range.
This phenomenon reflects two facts: (1) automatic enrollment into target-date funds typically applies to new hires who are disproportionately younger than 40; and (2) in voluntary enrollment plans, a single target-date fund is a popular strategy among new hires. Among pure target-date investors, there is also age-appropriate variation in the equity allocation.
This rising use of professionally managed allocations is also contributing to a reduction in portfolio construction errors (Figure 86). The fraction of participants holding broadly diversified portfolios rose from 42% in 2006 to three-quarters in 2018.
Participants holding concentrated stock positions fell by half, along with reductions in extreme portfolio positions.
Figure 86. Participant portfolio construction
Vanguard defined contribution plan participants
2015 20162008 2009 2010 2011 2012 2013 2014 20172004 2005 2006 2007 2018
11% 11%14% 12%19% 18%
24%23%
24% 23%
17% 17%
10% 9% 9% 9% 8% 7% 6% 5%
16%14% 13% 13% 13% 12% 12% 11%
4%
11%
42% 47%37% 39%
51% 52% 57% 61% 63% 66% 69% 70% 71% 74% 75%
7%7%
7% 7% 10% 9%8% 8% 8%
6% 5% 6% 7% 7% 7%13% 11%13% 13% 11% 11% 9% 8% 7% 6% 5% 5% 4%0%
100%
Conservative equity (>0% and <40% equity)
Aggressive equity (>90% equity)
Zero equity (0% equity and 0% company stock)
Balanced strategies (40% to 90% equity and <20% company stock)
Concentrated company stock (>20% company stock)
Perc
enta
ge o
f pa
rtic
ipan
ts
Source: Vanguard, 2019.
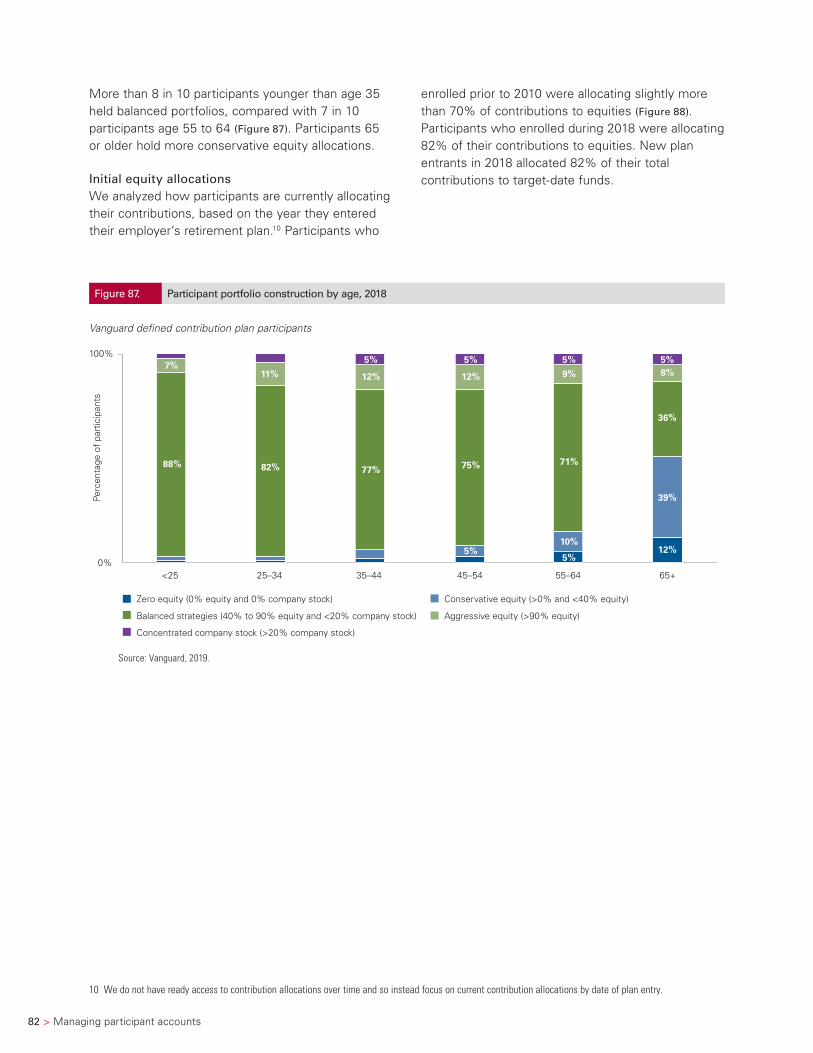
82 > Managing participant accounts
More than 8 in 10 participants younger than age 35 held balanced portfolios, compared with 7 in 10 participants age 55 to 64 (Figure 87). Participants 65 or older hold more conservative equity allocations.
Initial equity allocationsWe analyzed how participants are currently allocating their contributions, based on the year they entered their employer’s retirement plan.10 Participants who
enrolled prior to 2010 were allocating slightly more than 70% of contributions to equities (Figure 88). Participants who enrolled during 2018 were allocating 82% of their contributions to equities. New plan entrants in 2018 allocated 82% of their total contributions to target-date funds.
10 We do not have ready access to contribution allocations over time and so instead focus on current contribution allocations by date of plan entry.
Figure 87. Participant portfolio construction by age, 2018
Vanguard defined contribution plan participants
0%
100%
<25 25–34 35–44 45–54 55–64 65+
Perc
enta
ge o
f pa
rtic
ipan
ts
Conservative equity (>0% and <40% equity)
Aggressive equity (>90% equity)
Zero equity (0% equity and 0% company stock)
Balanced strategies (40% to 90% equity and <20% company stock)
Concentrated company stock (>20% company stock)
36%
8%5%
12%
39%
71%
9%
5%
5%
10%
75%
12%
5%
5%
77%
12%
5%
82%
11%
88%
7%
Source: Vanguard, 2019.
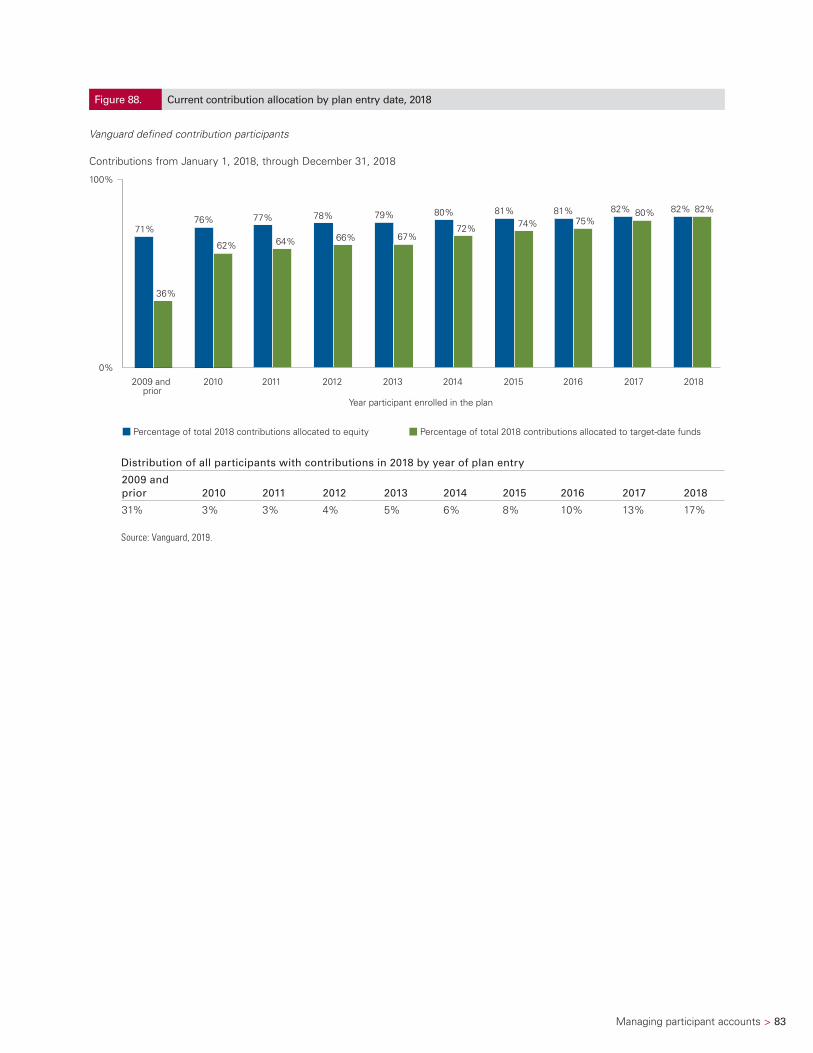
Managing participant accounts > 83
Figure 88. Current contribution allocation by plan entry date, 2018
Vanguard defined contribution participants
Contributions from January 1, 2018, through December 31, 2018
Year participant enrolled in the plan
2009 and prior
2010 2011 2012 2013 2014 2015 2016 2017 2018
100%
0%
71%76% 77% 78% 79% 80% 81% 81%
36%
62% 64% 66% 67% 72% 74% 75%
82% 80% 82% 82%
Percentage of total 2018 contributions allocated to equity Percentage of total 2018 contributions allocated to target-date funds
Distribution of all participants with contributions in 2018 by year of plan entry
2009 and prior 2010 2011 2012 2013 2014 2015 2016 2017 2018
31% 3% 3% 4% 5% 6% 8% 10% 13% 17%
Source: Vanguard, 2019.
84 > Managing participant accounts
Advice
Many participants in DC plans may lack the financial planning skills, time, or interest to make appropriate investment decisions. To address participants’ need for assistance with investment decisions, plan sponsors using Vanguard as their recordkeeper offer a range of advice programs, including an online advice service, Personal Online Advisor; a managed account advisory service, Vanguard Managed Account Program; and Vanguard Financial Planning Services.
The online advice service and managed account program are provided by Financial Engines, a third-party advisor; the financial planning services are provided by Vanguard Advisers, Inc. Each of these programs allows participants to include information about assets they have outside the plan, which may affect the selection of in-plan investments.
Online advice is targeted toward participants who want to manage their investments themselves. Four in 10 plans offer online advice, which assists participants in developing and managing optimal portfolios and continues to recommend portfolio changes over time (Figure 89). Participants need to take action to implement online advice.
Because large plans are more likely to offer advice, two-thirds of participants have access to the online advice service.
Managed account advice is targeted toward participants who prefer professional investment management. The managed account program includes development of customized portfolios using the funds offered in the plan and ongoing monitoring and rebalancing. It also offers customized retirement savings projections. Participants may also further personalize the advice according to risk tolerance or other holdings. One-third of plans offer managed account advice—and again, because larger plans are more likely to offer advice, more than half of participants have access to the service.
Financial planning services are offered to all participants with plan sponsor authorization, but a fee may apply. However, the service is available at no charge to participants 55 and older who are in or nearing retirement if their plan sponsor authorizes the offer. Two-thirds of plans offer this service to their participants, and 7 in 10 participants in this age group have access to the program.
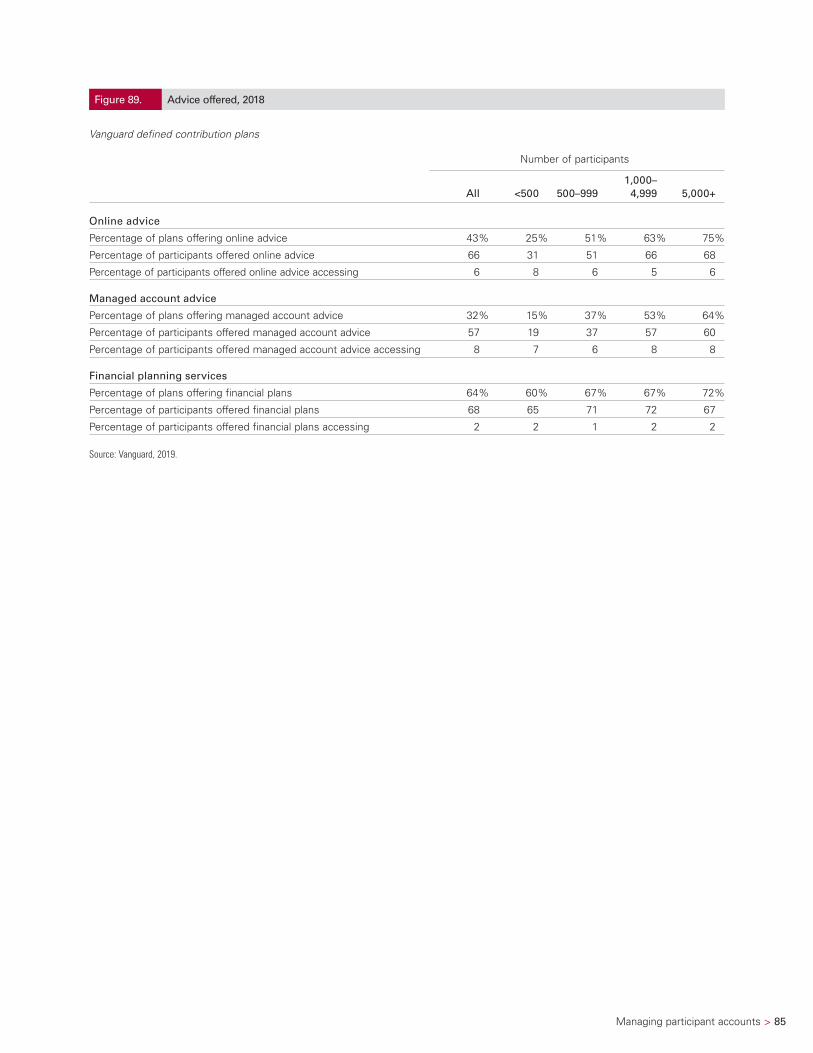
Managing participant accounts > 85
Figure 89. Advice offered, 2018
Vanguard defined contribution plans
Number of participants
All <500 500–9991,000–
4,999 5,000+
Online advice
Percentage of plans offering online advice 43% 25% 51% 63% 75%
Percentage of participants offered online advice 66 31 51 66 68
Percentage of participants offered online advice accessing 6 8 6 5 6
Managed account advice
Percentage of plans offering managed account advice 32% 15% 37% 53% 64%
Percentage of participants offered managed account advice 57 19 37 57 60
Percentage of participants offered managed account advice accessing 8 7 6 8 8
Financial planning services
Percentage of plans offering financial plans 64% 60% 67% 67% 72%
Percentage of participants offered financial plans 68 65 71 72 67
Percentage of participants offered financial plans accessing 2 2 1 2 2
Source: Vanguard, 2019.
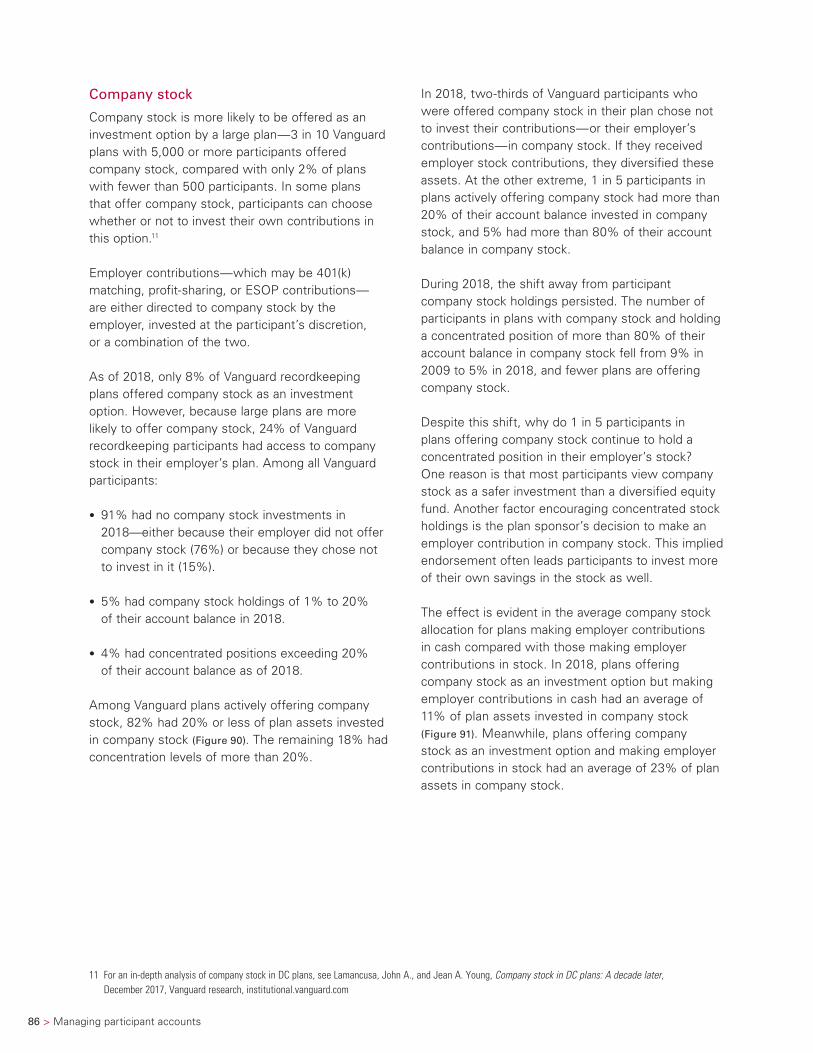
86 > Managing participant accounts
In 2018, two-thirds of Vanguard participants who were offered company stock in their plan chose not to invest their contributions—or their employer’s contributions—in company stock. If they received employer stock contributions, they diversified these assets. At the other extreme, 1 in 5 participants in plans actively offering company stock had more than 20% of their account balance invested in company stock, and 5% had more than 80% of their account balance in company stock.
During 2018, the shift away from participant company stock holdings persisted. The number of participants in plans with company stock and holding a concentrated position of more than 80% of their account balance in company stock fell from 9% in 2009 to 5% in 2018, and fewer plans are offering company stock.
Despite this shift, why do 1 in 5 participants in plans offering company stock continue to hold a concentrated position in their employer’s stock? One reason is that most participants view company stock as a safer investment than a diversified equity fund. Another factor encouraging concentrated stock holdings is the plan sponsor’s decision to make an employer contribution in company stock. This implied endorsement often leads participants to invest more of their own savings in the stock as well.
The effect is evident in the average company stock allocation for plans making employer contributions in cash compared with those making employer contributions in stock. In 2018, plans offering company stock as an investment option but making employer contributions in cash had an average of 11% of plan assets invested in company stock (Figure 91). Meanwhile, plans offering company stock as an investment option and making employer contributions in stock had an average of 23% of plan assets in company stock.
Company stock
Company stock is more likely to be offered as an investment option by a large plan—3 in 10 Vanguard plans with 5,000 or more participants offered company stock, compared with only 2% of plans with fewer than 500 participants. In some plans that offer company stock, participants can choose whether or not to invest their own contributions in this option.11
Employer contributions—which may be 401(k) matching, profit-sharing, or ESOP contributions— are either directed to company stock by the employer, invested at the participant’s discretion, or a combination of the two.
As of 2018, only 8% of Vanguard recordkeeping plans offered company stock as an investment option. However, because large plans are more likely to offer company stock, 24% of Vanguard recordkeeping participants had access to company stock in their employer’s plan. Among all Vanguard participants:
• 91% had no company stock investments in 2018—either because their employer did not offer company stock (76%) or because they chose not to invest in it (15%).
• 5% had company stock holdings of 1% to 20% of their account balance in 2018.
• 4% had concentrated positions exceeding 20% of their account balance as of 2018.
Among Vanguard plans actively offering company stock, 82% had 20% or less of plan assets invested in company stock (Figure 90). The remaining 18% had concentration levels of more than 20%.
11 For an in-depth analysis of company stock in DC plans, see Lamancusa, John A., and Jean A. Young, Company stock in DC plans: A decade later, December 2017, Vanguard research, institutional.vanguard.com
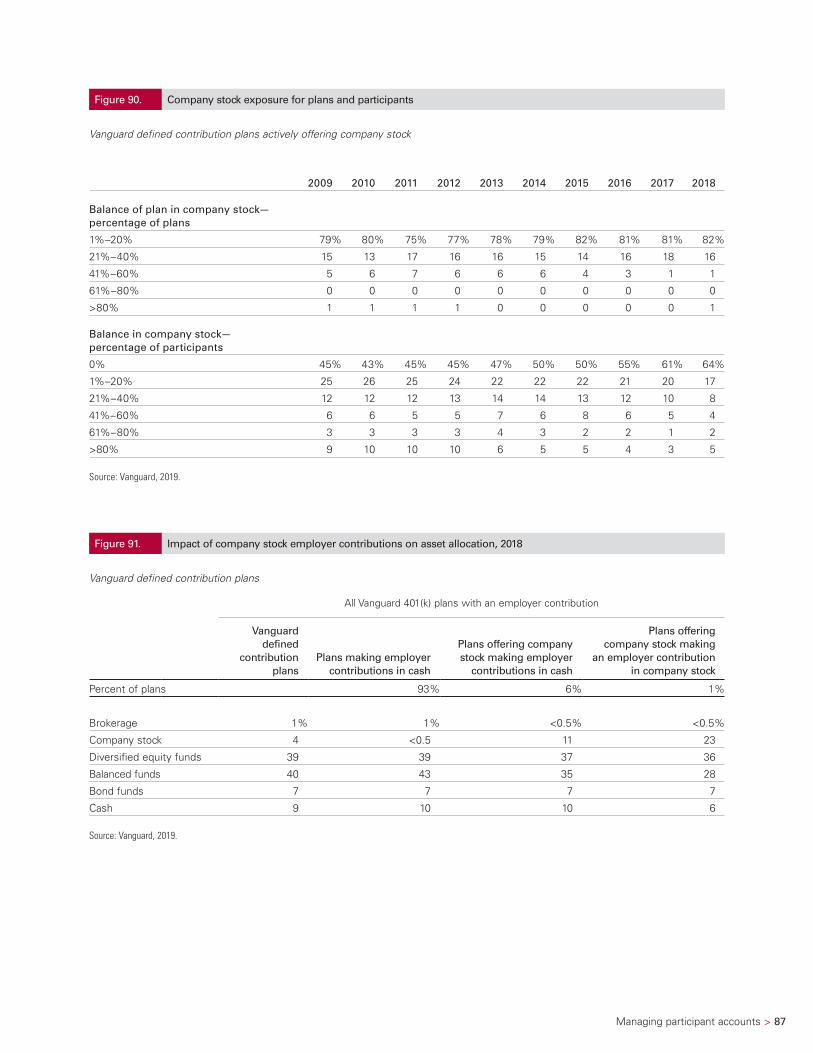
Managing participant accounts > 87
Figure 90. Company stock exposure for plans and participants
Vanguard defined contribution plans actively offering company stock
2009 2010 2011 2012 2013 2014 2015 2016 2017 2018
Balance of plan in company stock—percentage of plans
1%–20% 79% 80% 75% 77% 78% 79% 82% 81% 81% 82%
21%–40% 15 13 17 16 16 15 14 16 18 16
41%–60% 5 6 7 6 6 6 4 3 1 1
61%–80% 0 0 0 0 0 0 0 0 0 0
>80% 1 1 1 1 0 0 0 0 0 1
Balance in company stock— percentage of participants
0% 45% 43% 45% 45% 47% 50% 50% 55% 61% 64%
1%–20% 25 26 25 24 22 22 22 21 20 17
21%–40% 12 12 12 13 14 14 13 12 10 8
41%–60% 6 6 5 5 7 6 8 6 5 4
61%–80% 3 3 3 3 4 3 2 2 1 2
>80% 9 10 10 10 6 5 5 4 3 5
Source: Vanguard, 2019.
Figure 91. Impact of company stock employer contributions on asset allocation, 2018
Vanguard defined contribution plans
All Vanguard 401(k) plans with an employer contribution
Vanguard defined
contribution plans
Plans making employer contributions in cash
Plans offering company stock making employer
contributions in cash
Plans offering company stock making
an employer contribution in company stock
Percent of plans 93% 6% 1%
Brokerage 1% 1% <0.5% <0.5%
Company stock 4 <0.5 11 23
Diversified equity funds 39 39 37 36
Balanced funds 40 43 35 28
Bond funds 7 7 7 7
Cash 9 10 10 6
Source: Vanguard, 2019.
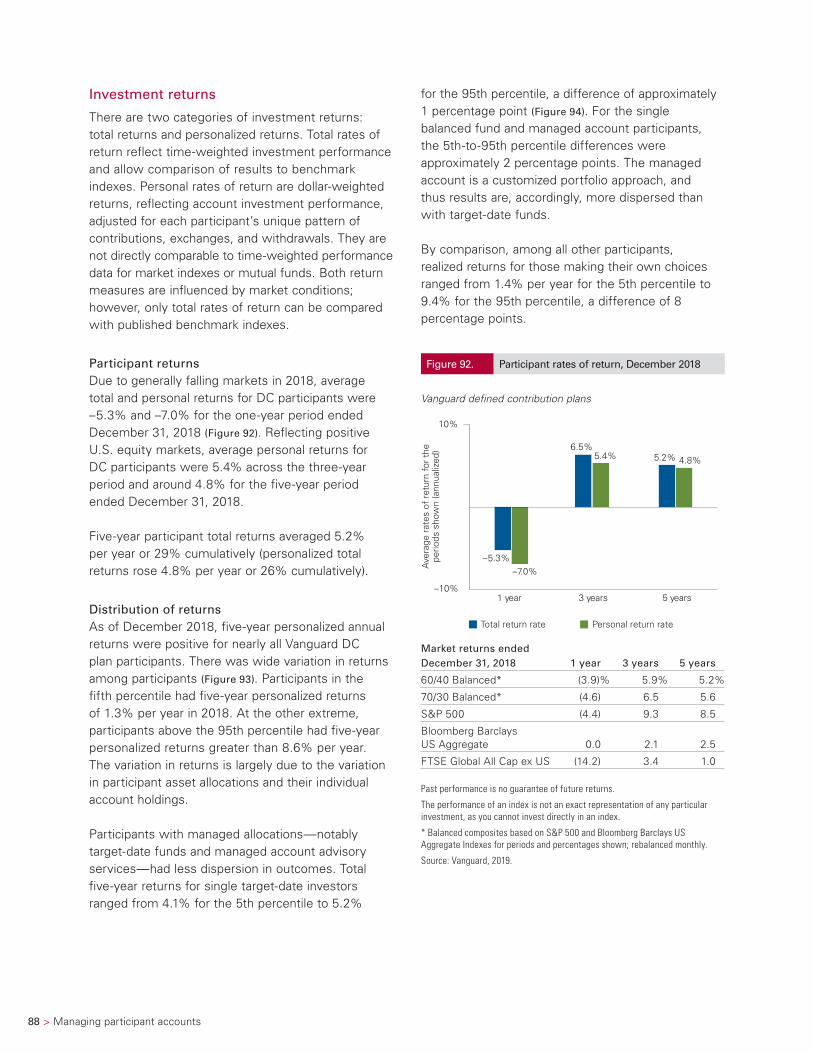
88 > Managing participant accounts
for the 95th percentile, a difference of approximately 1 percentage point (Figure 94). For the single balanced fund and managed account participants, the 5th-to-95th percentile differences were approximately 2 percentage points. The managed account is a customized portfolio approach, and thus results are, accordingly, more dispersed than with target-date funds.
By comparison, among all other participants, realized returns for those making their own choices ranged from 1.4% per year for the 5th percentile to 9.4% for the 95th percentile, a difference of 8 percentage points.
Investment returns
There are two categories of investment returns: total returns and personalized returns. Total rates of return reflect time-weighted investment performance and allow comparison of results to benchmark indexes. Personal rates of return are dollar-weighted returns, reflecting account investment performance, adjusted for each participant’s unique pattern of contributions, exchanges, and withdrawals. They are not directly comparable to time-weighted performance data for market indexes or mutual funds. Both return measures are influenced by market conditions; however, only total rates of return can be compared with published benchmark indexes.
Participant returnsDue to generally falling markets in 2018, average total and personal returns for DC participants were –5.3% and –7.0% for the one-year period ended December 31, 2018 (Figure 92). Reflecting positive U.S. equity markets, average personal returns for DC participants were 5.4% across the three-year period and around 4.8% for the five-year period ended December 31, 2018.
Five-year participant total returns averaged 5.2% per year or 29% cumulatively (personalized total returns rose 4.8% per year or 26% cumulatively).
Distribution of returnsAs of December 2018, five-year personalized annual returns were positive for nearly all Vanguard DC plan participants. There was wide variation in returns among participants (Figure 93). Participants in the fifth percentile had five-year personalized returns of 1.3% per year in 2018. At the other extreme, participants above the 95th percentile had five-year personalized returns greater than 8.6% per year. The variation in returns is largely due to the variation in participant asset allocations and their individual account holdings.
Participants with managed allocations—notably target-date funds and managed account advisory services—had less dispersion in outcomes. Total five-year returns for single target-date investors ranged from 4.1% for the 5th percentile to 5.2%
Figure 92. Participant rates of return, December 2018
Vanguard defined contribution plans
Ave
rage
rat
es o
f re
turn
for
the
perio
ds s
how
n (a
nnua
lized
)
Total return rate Personal return rate
1 year 3 years 5 years–10%
10%
–5.3%
5.2%
–7.0%
5.4%6.5%
4.8%
Market returns ended December 31, 2018 1 year 3 years 5 years
60/40 Balanced* (3.9)% 5.9% 5.2%
70/30 Balanced* (4.6) 6.5 5.6
S&P 500 (4.4) 9.3 8.5
Bloomberg Barclays US Aggregate 0.0 2.1 2.5
FTSE Global All Cap ex US (14.2) 3.4 1.0
Past performance is no guarantee of future returns.
The performance of an index is not an exact representation of any particular investment, as you cannot invest directly in an index.
* Balanced composites based on S&P 500 and Bloomberg Barclays US Aggregate Indexes for periods and percentages shown; rebalanced monthly.
Source: Vanguard, 2019.
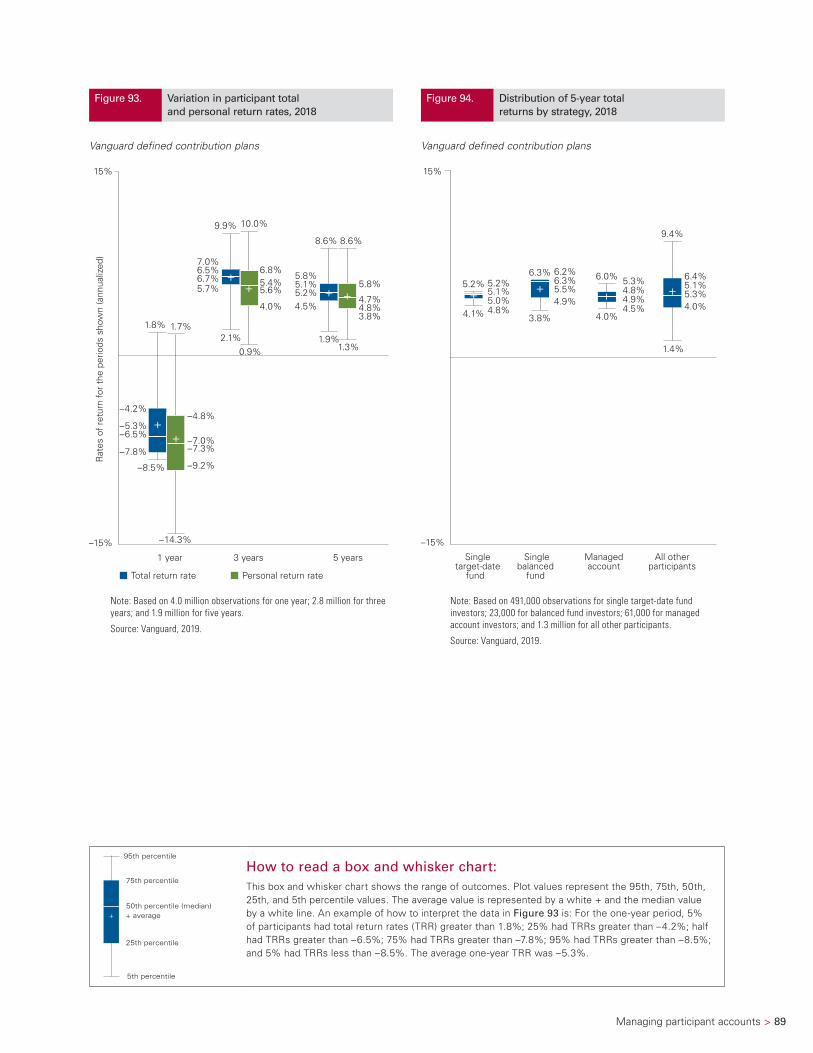
Managing participant accounts > 89
Figure 93. Variation in participant total and personal return rates, 2018
Vanguard defined contribution plans
–7.8%
5.7%
4.5%
1.8%
9.9%
8.6%
–5.3%
6.5%
5.2%
–6.5%
6.7%5.1%
–8.5%
2.1% 1.9%
–4.2%
7.0%
5.8%
–9.2%
4.0%3.8%
1.7%
10.0%
8.6%
–7.0%
5.4%
4.8%
–7.3%
5.6%4.7%
0.9% 1.3%
–4.8%
6.8%5.8%
++
–14.3%
++ + +
Total return rate Personal return rate
1 year 3 years 5 years
15%
–15%
Rat
es o
f re
turn
for
the
perio
ds s
how
n (a
nnua
lized
)
Note: Based on 4.0 million observations for one year; 2.8 million for three years; and 1.9 million for five years.
Source: Vanguard, 2019.
25th percentile
95th percentile
5th percentile
+ average 50th percentile (median)
75th percentile
+
How to read a box and whisker chart:This box and whisker chart shows the range of outcomes. Plot values represent the 95th, 75th, 50th, 25th, and 5th percentile values. The average value is represented by a white + and the median value by a white line. An example of how to interpret the data in Figure 93 is: For the one-year period, 5% of participants had total return rates (TRR) greater than 1.8%; 25% had TRRs greater than –4.2%; half had TRRs greater than –6.5%; 75% had TRRs greater than –7.8%; 95% had TRRs greater than –8.5%; and 5% had TRRs less than –8.5%. The average one-year TRR was –5.3%.
Figure 94. Distribution of 5-year total returns by strategy, 2018
Vanguard defined contribution plans
Singletarget-date
fund
Singlebalanced
fund
Managed account
All other participants
15%
–15%
4.8% 4.9%
4.5% 4.0%
5.2% 6.3% 6.0%
9.4%
5.0% 5.5%
4.9% 5.3% 5.1%
6.2%
4.8% 5.1%
4.1% 3.8% 4.0%
1.4%
5.2% 6.3% 5.3% 6.4%
++++
Note: Based on 491,000 observations for single target-date fund investors; 23,000 for balanced fund investors; 61,000 for managed account investors; and 1.3 million for all other participants.
Source: Vanguard, 2019.
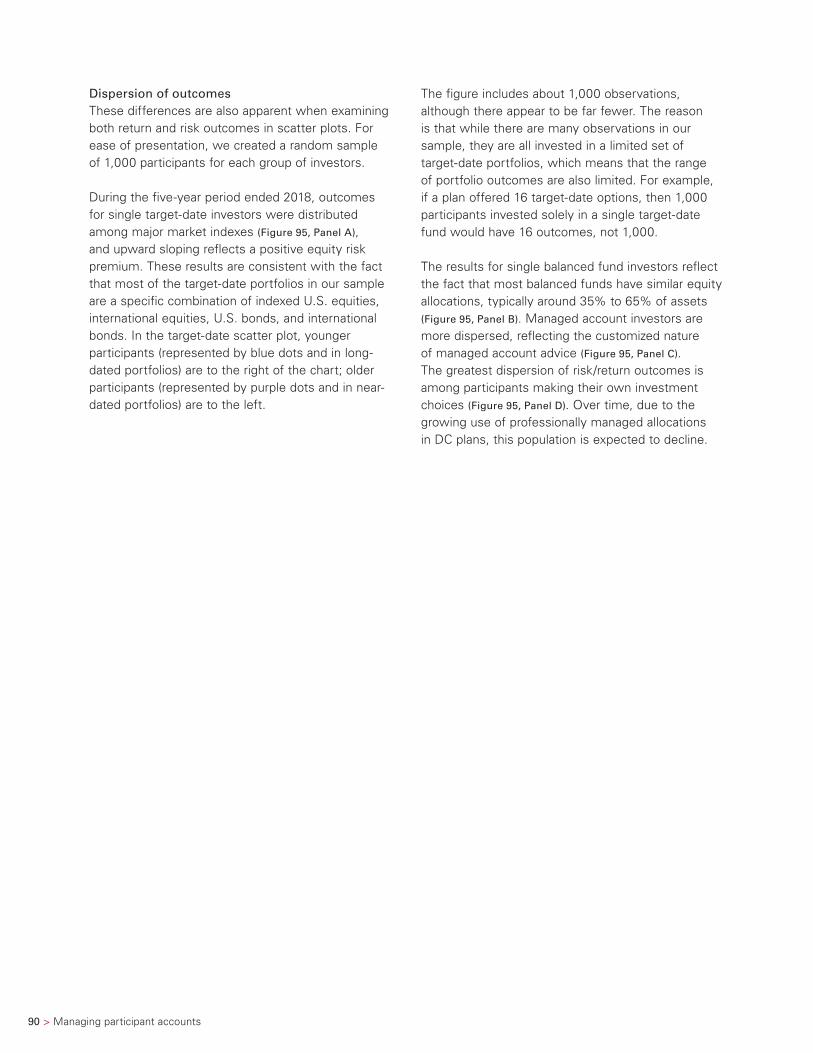
90 > Managing participant accounts
Dispersion of outcomesThese differences are also apparent when examining both return and risk outcomes in scatter plots. For ease of presentation, we created a random sample of 1,000 participants for each group of investors.
During the five-year period ended 2018, outcomes for single target-date investors were distributed among major market indexes (Figure 95, Panel A), and upward sloping reflects a positive equity risk premium. These results are consistent with the fact that most of the target-date portfolios in our sample are a specific combination of indexed U.S. equities, international equities, U.S. bonds, and international bonds. In the target-date scatter plot, younger participants (represented by blue dots and in long-dated portfolios) are to the right of the chart; older participants (represented by purple dots and in near-dated portfolios) are to the left.
The figure includes about 1,000 observations, although there appear to be far fewer. The reason is that while there are many observations in our sample, they are all invested in a limited set of target-date portfolios, which means that the range of portfolio outcomes are also limited. For example, if a plan offered 16 target-date options, then 1,000 participants invested solely in a single target-date fund would have 16 outcomes, not 1,000.
The results for single balanced fund investors reflect the fact that most balanced funds have similar equity allocations, typically around 35% to 65% of assets (Figure 95, Panel B). Managed account investors are more dispersed, reflecting the customized nature of managed account advice (Figure 95, Panel C). The greatest dispersion of risk/return outcomes is among participants making their own investment choices (Figure 95, Panel D). Over time, due to the growing use of professionally managed allocations in DC plans, this population is expected to decline.
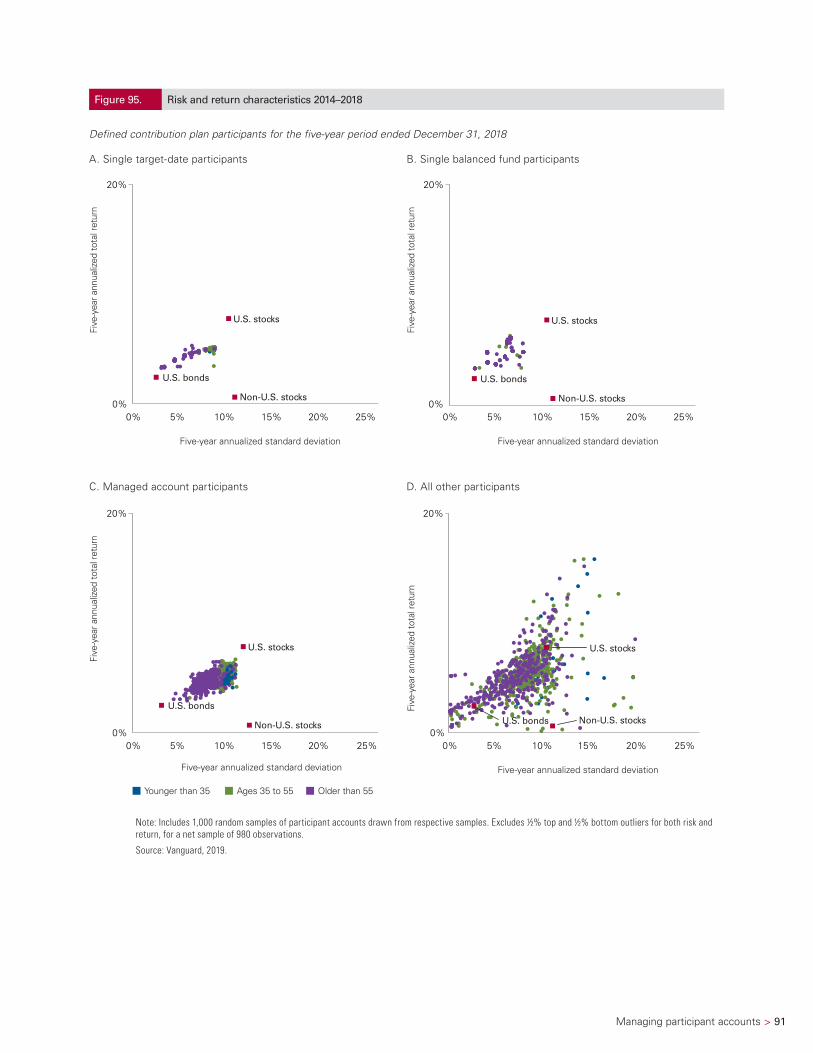
Managing participant accounts > 91
Figure 95. Risk and return characteristics 2014–2018
Defined contribution plan participants for the five-year period ended December 31, 2018
A. Single target-date participants B. Single balanced fund participants
0%
20%
0% 5% 10% 15% 20% 25%
Five
-yea
r ann
ualiz
ed to
tal r
etur
n
Five-year annualized standard deviation
U.S. bonds
U.S. stocks
Non-U.S. stocks0%
20%
0% 5% 10% 15% 20% 25%
Five-year annualized standard deviation
Five
-yea
r ann
ualiz
ed to
tal r
etur
n
U.S. bonds
U.S. stocks
Non-U.S. stocks
C. Managed account participants D. All other participants
0%
20%
0% 5% 10% 15% 20% 25%
Five
-yea
r ann
ualiz
ed to
tal r
etur
n
Five-year annualized standard deviation
Younger than 35 Ages 35 to 55 Older than 55
U.S. bonds
U.S. stocks
Non-U.S. stocks0%
20%
0% 5% 10% 15% 20% 25%
Five-year annualized standard deviation
Five
-yea
r ann
ualiz
ed to
tal r
etur
n
U.S. bonds
U.S. stocks
Non-U.S. stocks
Note: Includes 1,000 random samples of participant accounts drawn from respective samples. Excludes ½% top and ½% bottom outliers for both risk and return, for a net sample of 980 observations.
Source: Vanguard, 2019.
92 > Managing participant accounts
Trading activity
Participant trading or exchange activity is the movement of existing account assets from one plan investment option to another. This transaction is distinct from a contribution allocation decision, in which participants decide how future contributions to the plan should be invested. Exchange activity is a proxy for a participant’s holding period for investments, as well as a measure of the participant’s willingness to change their portfolio in response to short-term market volatility.
Exchange provisionsDaily trading is nearly universal for Vanguard DC plans, with virtually all plan sponsors allowing it. While assets can be traded daily, Vanguard and other investment companies serving DC plans typically have “round-trip” restrictions designed to thwart the minority of individual participants who seek to engage in active market-timing or day-trading.
Volume of exchangesU.S. equity markets declined in 2018, interspersed with some volatile days (Figure 96). Only 12% of participants made one or more portfolio trades or exchanges during the year, down from 20% in 2004.
When participants using the managed account program are excluded, only 8% of participants initiated an exchange. As in prior years, most participants did not trade. Not only did participant trading activity remain low during 2018, trading activity between 2009 and 2018 was lower than the trading activity between 2004 and 2008.
Another measure of trading is the volume of dollars traded. We measure dollar volume movements as a fraction of total recordkeeping assets in order to scale them to growth in assets and growth in the underlying recordkeeping business. In effect, the fraction of assets traded is a measure of portfolio turnover.
In 2018, traders exchanged the dollar equivalent of 11.6% of average DC recordkeeping assets at Vanguard. On a net basis, 1.1% of assets were shifted from equities to fixed income in 2018, compared with a 0.3% shift from equities to fixed income in 2017.
Since 2009, dollar-trading levels have generally remained stable, with the exception of periods of high market volatility (Figure 97). The most notable spikes in dollars traded occurred in months of high market volatility: March 2009 and August 2011.
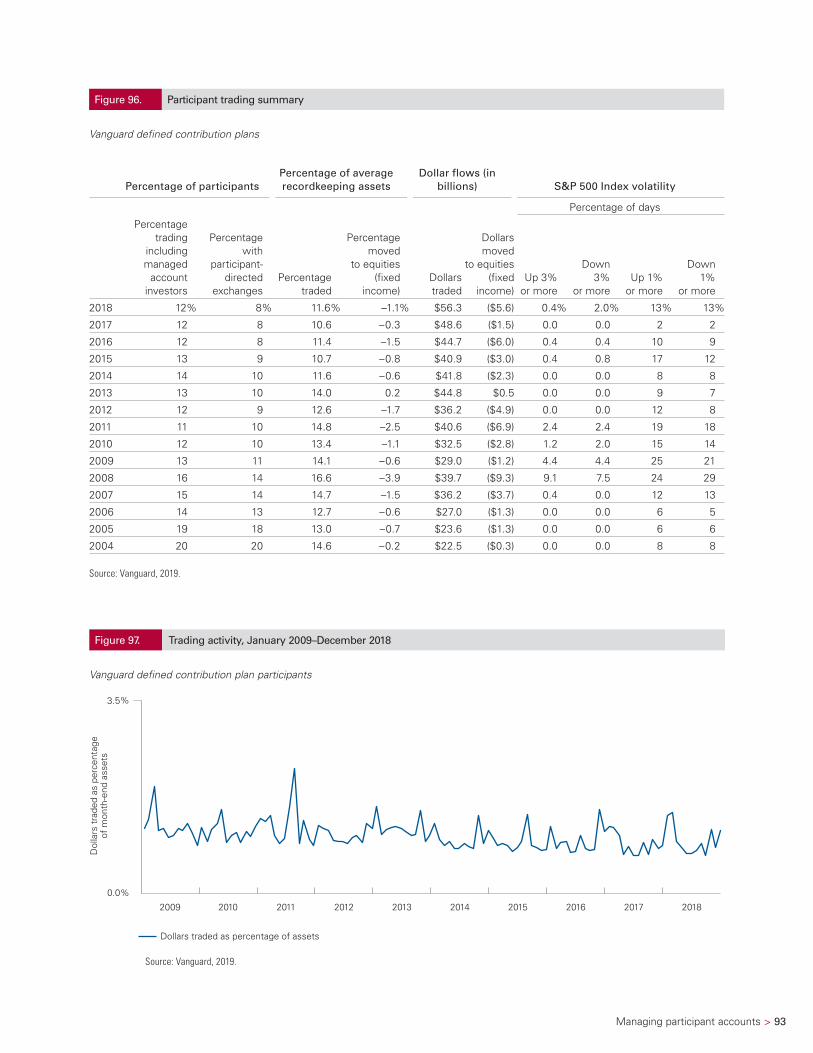
Managing participant accounts > 93
Figure 96. Participant trading summary
Vanguard defined contribution plans
Percentage of participantsPercentage of average recordkeeping assets
Dollar flows (in billions) S&P 500 Index volatility
Percentage of days
Percentage trading
including managed
account investors
Percentage with
participant-directed
exchangesPercentage
traded
Percentage moved
to equities (fixed
income)Dollars traded
Dollars moved
to equities (fixed
income)Up 3%
or more
Down 3%
or moreUp 1%
or more
Down 1%
or more
2018 12% 8% 11.6% –1.1% $56.3 ($5.6) 0.4% 2.0% 13% 13%
2017 12 8 10.6 –0.3 $48.6 ($1.5) 0.0 0.0 2 2
2016 12 8 11.4 –1.5 $44.7 ($6.0) 0.4 0.4 10 9
2015 13 9 10.7 –0.8 $40.9 ($3.0) 0.4 0.8 17 12
2014 14 10 11.6 –0.6 $41.8 ($2.3) 0.0 0.0 8 8
2013 13 10 14.0 0.2 $44.8 $0.5 0.0 0.0 9 7
2012 12 9 12.6 –1.7 $36.2 ($4.9) 0.0 0.0 12 8
2011 11 10 14.8 –2.5 $40.6 ($6.9) 2.4 2.4 19 18
2010 12 10 13.4 –1.1 $32.5 ($2.8) 1.2 2.0 15 14
2009 13 11 14.1 –0.6 $29.0 ($1.2) 4.4 4.4 25 21
2008 16 14 16.6 –3.9 $39.7 ($9.3) 9.1 7.5 24 29
2007 15 14 14.7 –1.5 $36.2 ($3.7) 0.4 0.0 12 13
2006 14 13 12.7 –0.6 $27.0 ($1.3) 0.0 0.0 6 5
2005 19 18 13.0 –0.7 $23.6 ($1.3) 0.0 0.0 6 6
2004 20 20 14.6 –0.2 $22.5 ($0.3) 0.0 0.0 8 8
Source: Vanguard, 2019.
Figure 97. Trading activity, January 2009–December 2018
Vanguard defined contribution plan participants
2009
Dol
lars
tra
ded
as p
erce
ntag
eof
mon
th-e
nd a
sset
s
Dollars traded as percentage of assets
0.0%
3.5%
2010 2011 2012 2013 2014 2015 2016 2017 2018
Source: Vanguard, 2019.
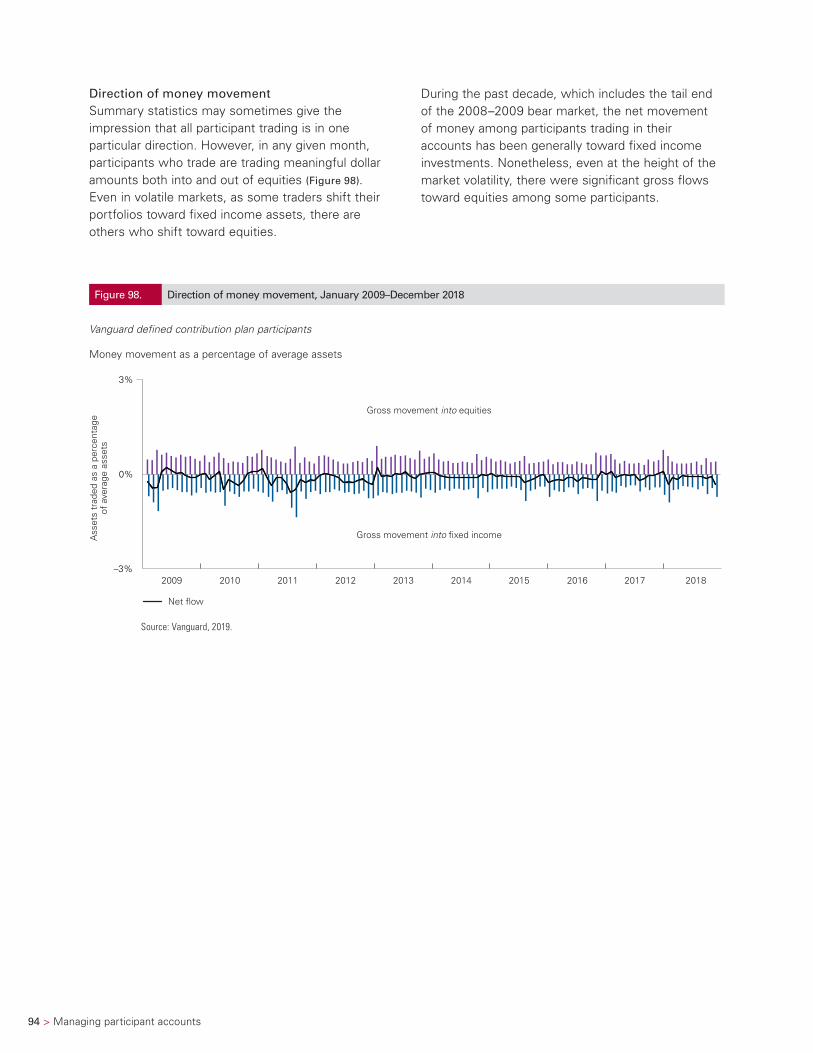
94 > Managing participant accounts
Direction of money movementSummary statistics may sometimes give the impression that all participant trading is in one particular direction. However, in any given month, participants who trade are trading meaningful dollar amounts both into and out of equities (Figure 98). Even in volatile markets, as some traders shift their portfolios toward fixed income assets, there are others who shift toward equities.
During the past decade, which includes the tail end of the 2008–2009 bear market, the net movement of money among participants trading in their accounts has been generally toward fixed income investments. Nonetheless, even at the height of the market volatility, there were significant gross flows toward equities among some participants.
Figure 98. Direction of money movement, January 2009–December 2018
Vanguard defined contribution plan participants
Money movement as a percentage of average assets
Ass
ets
trad
ed a
s a
perc
enta
geof
ave
rage
ass
ets
Net �ow
Gross movement into equities
Gross movement into �xed income
–3%
0%
3%
2009 2010 2011 2012 2013 2014 2015 2016 2017 2018
Source: Vanguard, 2019.
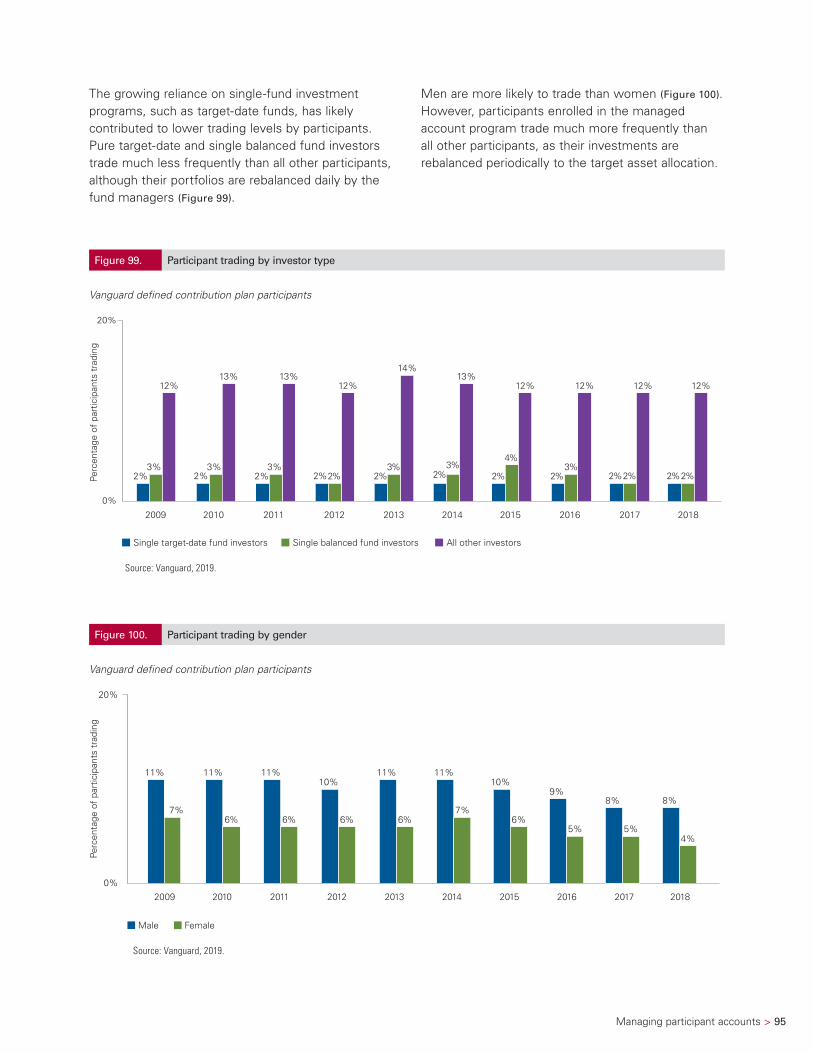
Managing participant accounts > 95
The growing reliance on single-fund investment programs, such as target-date funds, has likely contributed to lower trading levels by participants. Pure target-date and single balanced fund investors trade much less frequently than all other participants, although their portfolios are rebalanced daily by the fund managers (Figure 99).
Men are more likely to trade than women (Figure 100). However, participants enrolled in the managed account program trade much more frequently than all other participants, as their investments are rebalanced periodically to the target asset allocation.
Figure 99. Participant trading by investor type
Vanguard defined contribution plan participants
2%2%
12%
20%
Single target-date fund investors All other investorsSingle balanced fund investors
Perc
enta
ge o
f pa
rtic
ipan
ts t
radi
ng
0%
2009
2%3%
12%
2010
3%2%
13%
2011
2%3%
13%
2012
2%2%
12%
2013
2%3%
14%
2014
2%3%
13%
2015
2%
4%
12%
2016
2%3%
12%
2017
2%2%
12%
2018
Source: Vanguard, 2019.
Figure 100. Participant trading by gender
Vanguard defined contribution plan participants
Male Female
Perc
enta
ge o
f pa
rtic
ipan
ts t
radi
ng
2009 2010 2011 2012 2013 2014 2015 2016 2017 2018
20%
0%
11% 11% 11%
7% 6% 6%
10%
6%
11%
6%
11%
7%
10%
6%
9%
5%
8%
4%
8%
5%
Source: Vanguard, 2019.
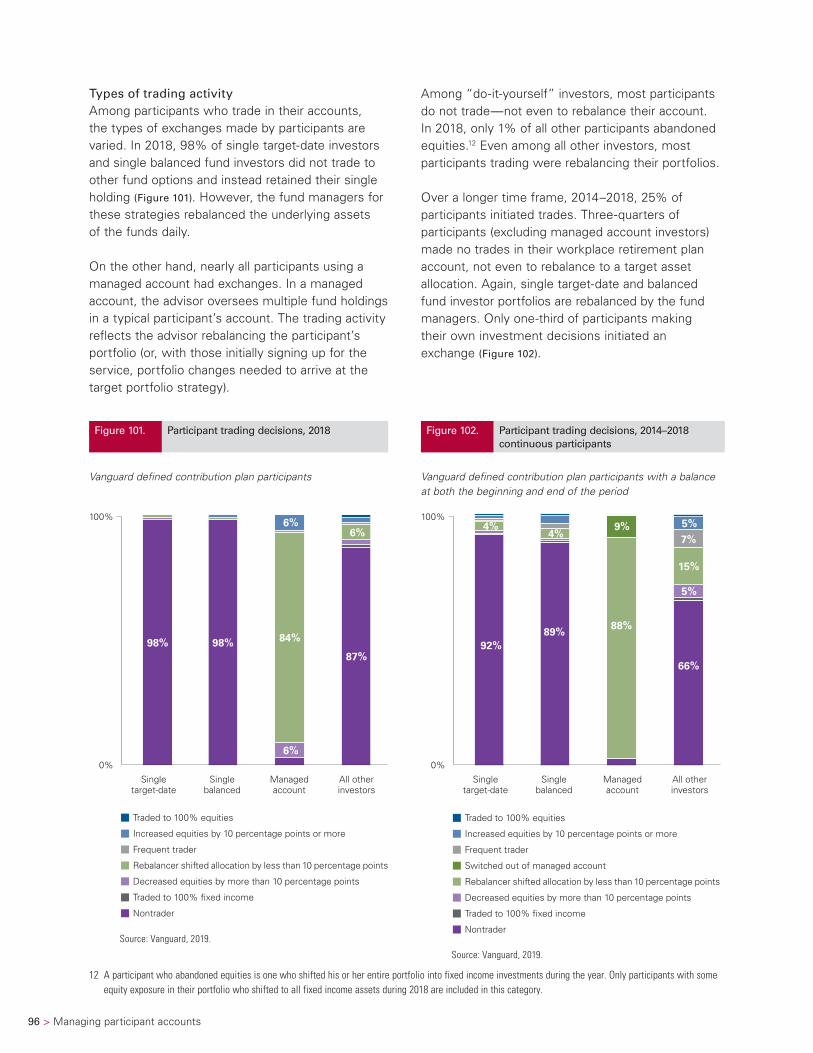
96 > Managing participant accounts
Types of trading activityAmong participants who trade in their accounts, the types of exchanges made by participants are varied. In 2018, 98% of single target-date investors and single balanced fund investors did not trade to other fund options and instead retained their single holding (Figure 101). However, the fund managers for these strategies rebalanced the underlying assets of the funds daily.
On the other hand, nearly all participants using a managed account had exchanges. In a managed account, the advisor oversees multiple fund holdings in a typical participant’s account. The trading activity reflects the advisor rebalancing the participant’s portfolio (or, with those initially signing up for the service, portfolio changes needed to arrive at the target portfolio strategy).
Among “do-it-yourself” investors, most participants do not trade—not even to rebalance their account. In 2018, only 1% of all other participants abandoned equities.12 Even among all other investors, most participants trading were rebalancing their portfolios.
Over a longer time frame, 2014–2018, 25% of participants initiated trades. Three-quarters of participants (excluding managed account investors) made no trades in their workplace retirement plan account, not even to rebalance to a target asset allocation. Again, single target-date and balanced fund investor portfolios are rebalanced by the fund managers. Only one-third of participants making their own investment decisions initiated an exchange (Figure 102).
Figure 101. Participant trading decisions, 2018
Vanguard defined contribution plan participants
98% 98% 87%
6%
84%
6% 6%
0%
Single target-date
Single balanced
Managed account
All other investors
Traded to 100% equities
Increased equities by 10 percentage points or more
Frequent trader
Rebalancer shifted allocation by less than 10 percentage points
Decreased equities by more than 10 percentage points
Traded to 100% �xed income
Nontrader
100%
Source: Vanguard, 2019.
12 A participant who abandoned equities is one who shifted his or her entire portfolio into fixed income investments during the year. Only participants with some equity exposure in their portfolio who shifted to all fixed income assets during 2018 are included in this category.
Figure 102. Participant trading decisions, 2014–2018 continuous participants
Vanguard defined contribution plan participants with a balance at both the beginning and end of the period
100%
92%
4% 4%
89% 88%
66%
5%
5%
7% 9%
15%
0%
Single target-date
Single balanced
Managed account
All other investors
Traded to 100% equities
Increased equities by 10 percentage points or more
Frequent trader
Rebalancer shifted allocation by less than 10 percentage points
Decreased equities by more than 10 percentage points
Traded to 100% �xed income
Nontrader
Switched out of managed account
Source: Vanguard, 2019.
TH
RE
E
Participants can access their plan assets by taking a loan or a withdrawal while they are working, or through a withdrawal or a rollover when they change jobs or retire.
A C C E S S I N G P L A N A S S E T S
TH
RE
E
Participants can access their plan assets by taking a loan or a withdrawal while they are working, or through a withdrawal or a rollover when they change jobs or retire.
A C C E S S I N G P L A N A S S E T S
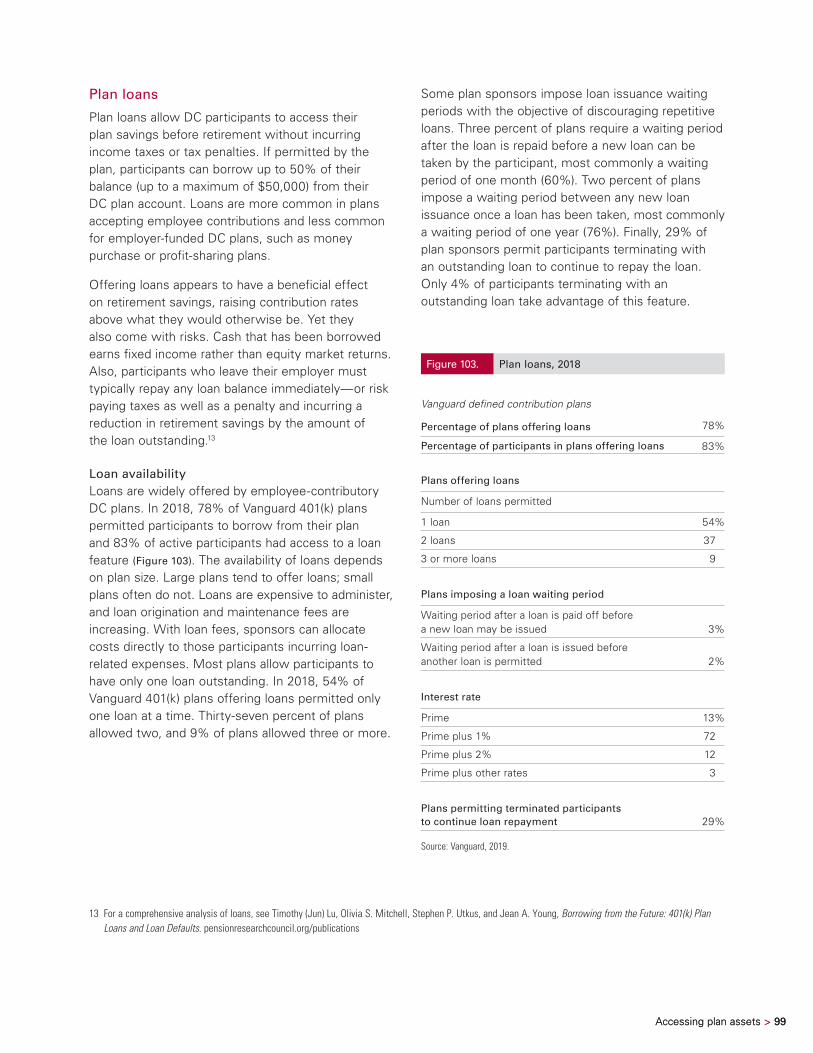
Accessing plan assets > 99 Accessing plan assets > 99
Plan loans
Plan loans allow DC participants to access their plan savings before retirement without incurring income taxes or tax penalties. If permitted by the plan, participants can borrow up to 50% of their balance (up to a maximum of $50,000) from their DC plan account. Loans are more common in plans accepting employee contributions and less common for employer-funded DC plans, such as money purchase or profit-sharing plans.
Offering loans appears to have a beneficial effect on retirement savings, raising contribution rates above what they would otherwise be. Yet they also come with risks. Cash that has been borrowed earns fixed income rather than equity market returns. Also, participants who leave their employer must typically repay any loan balance immediately—or risk paying taxes as well as a penalty and incurring a reduction in retirement savings by the amount of the loan outstanding.13
Loan availabilityLoans are widely offered by employee-contributory DC plans. In 2018, 78% of Vanguard 401(k) plans permitted participants to borrow from their plan and 83% of active participants had access to a loan feature (Figure 103). The availability of loans depends on plan size. Large plans tend to offer loans; small plans often do not. Loans are expensive to administer, and loan origination and maintenance fees are increasing. With loan fees, sponsors can allocate costs directly to those participants incurring loan-related expenses. Most plans allow participants to have only one loan outstanding. In 2018, 54% of Vanguard 401(k) plans offering loans permitted only one loan at a time. Thirty-seven percent of plans allowed two, and 9% of plans allowed three or more.
13 For a comprehensive analysis of loans, see Timothy (Jun) Lu, Olivia S. Mitchell, Stephen P. Utkus, and Jean A. Young, Borrowing from the Future: 401(k) Plan Loans and Loan Defaults. pensionresearchcouncil.org/publications
Some plan sponsors impose loan issuance waiting periods with the objective of discouraging repetitive loans. Three percent of plans require a waiting period after the loan is repaid before a new loan can be taken by the participant, most commonly a waiting period of one month (60%). Two percent of plans impose a waiting period between any new loan issuance once a loan has been taken, most commonly a waiting period of one year (76%). Finally, 29% of plan sponsors permit participants terminating with an outstanding loan to continue to repay the loan. Only 4% of participants terminating with an outstanding loan take advantage of this feature.
Figure 103. Plan loans, 2018
Vanguard defined contribution plans
Percentage of plans offering loans 78%
Percentage of participants in plans offering loans 83%
Plans offering loans
Number of loans permitted
1 loan 54%
2 loans 37
3 or more loans 9
Plans imposing a loan waiting period
Waiting period after a loan is paid off before a new loan may be issued 3%
Waiting period after a loan is issued before another loan is permitted 2%
Interest rate
Prime 13%
Prime plus 1% 72
Prime plus 2% 12
Prime plus other rates 3
Plans permitting terminated participants to continue loan repayment 29%
Source: Vanguard, 2019.
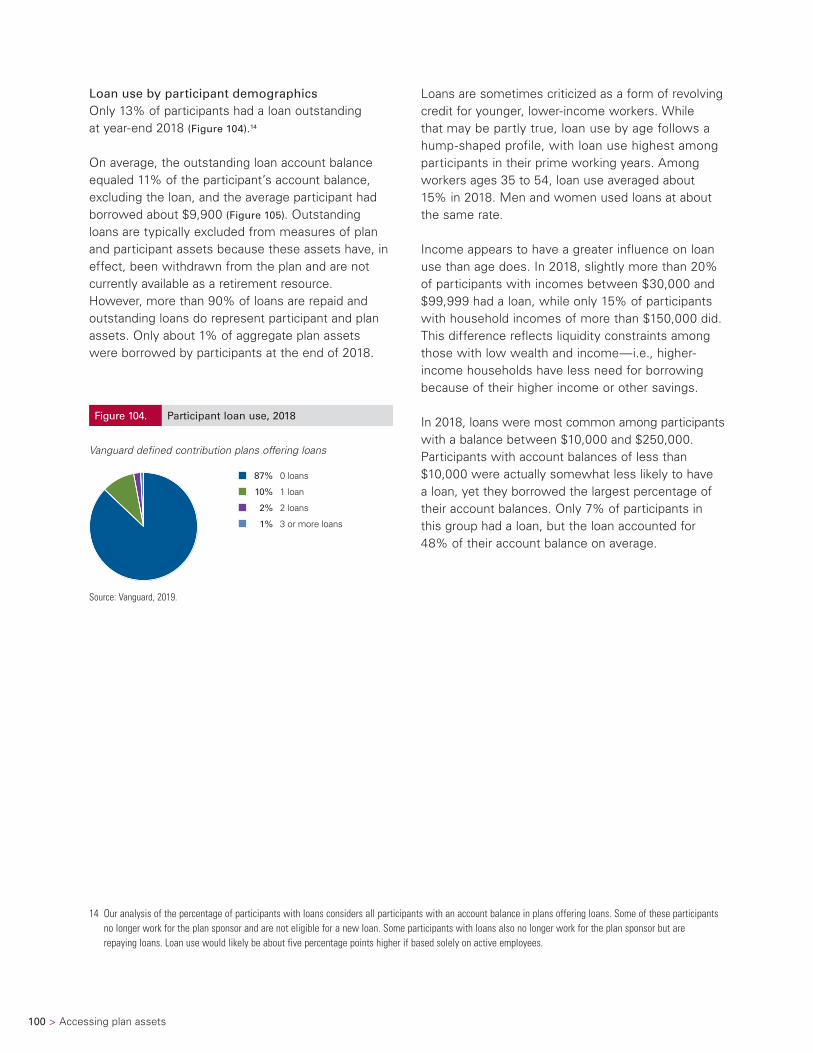
100 > Accessing plan assets
Loan use by participant demographicsOnly 13% of participants had a loan outstanding at year-end 2018 (Figure 104).14
On average, the outstanding loan account balance equaled 11% of the participant’s account balance, excluding the loan, and the average participant had borrowed about $9,900 (Figure 105). Outstanding loans are typically excluded from measures of plan and participant assets because these assets have, in effect, been withdrawn from the plan and are not currently available as a retirement resource. However, more than 90% of loans are repaid and outstanding loans do represent participant and plan assets. Only about 1% of aggregate plan assets were borrowed by participants at the end of 2018.
Loans are sometimes criticized as a form of revolving credit for younger, lower-income workers. While that may be partly true, loan use by age follows a hump-shaped profile, with loan use highest among participants in their prime working years. Among workers ages 35 to 54, loan use averaged about 15% in 2018. Men and women used loans at about the same rate.
Income appears to have a greater influence on loan use than age does. In 2018, slightly more than 20% of participants with incomes between $30,000 and $99,999 had a loan, while only 15% of participants with household incomes of more than $150,000 did. This difference reflects liquidity constraints among those with low wealth and income—i.e., higher-income households have less need for borrowing because of their higher income or other savings.
In 2018, loans were most common among participants with a balance between $10,000 and $250,000. Participants with account balances of less than $10,000 were actually somewhat less likely to have a loan, yet they borrowed the largest percentage of their account balances. Only 7% of participants in this group had a loan, but the loan accounted for 48% of their account balance on average.
14 Our analysis of the percentage of participants with loans considers all participants with an account balance in plans offering loans. Some of these participants no longer work for the plan sponsor and are not eligible for a new loan. Some participants with loans also no longer work for the plan sponsor but are repaying loans. Loan use would likely be about five percentage points higher if based solely on active employees.
Figure 104. Participant loan use, 2018
Vanguard defined contribution plans offering loans
87% 0 loans
10% 1 loan
2% 2 loans
1% 3 or more loans
Source: Vanguard, 2019.
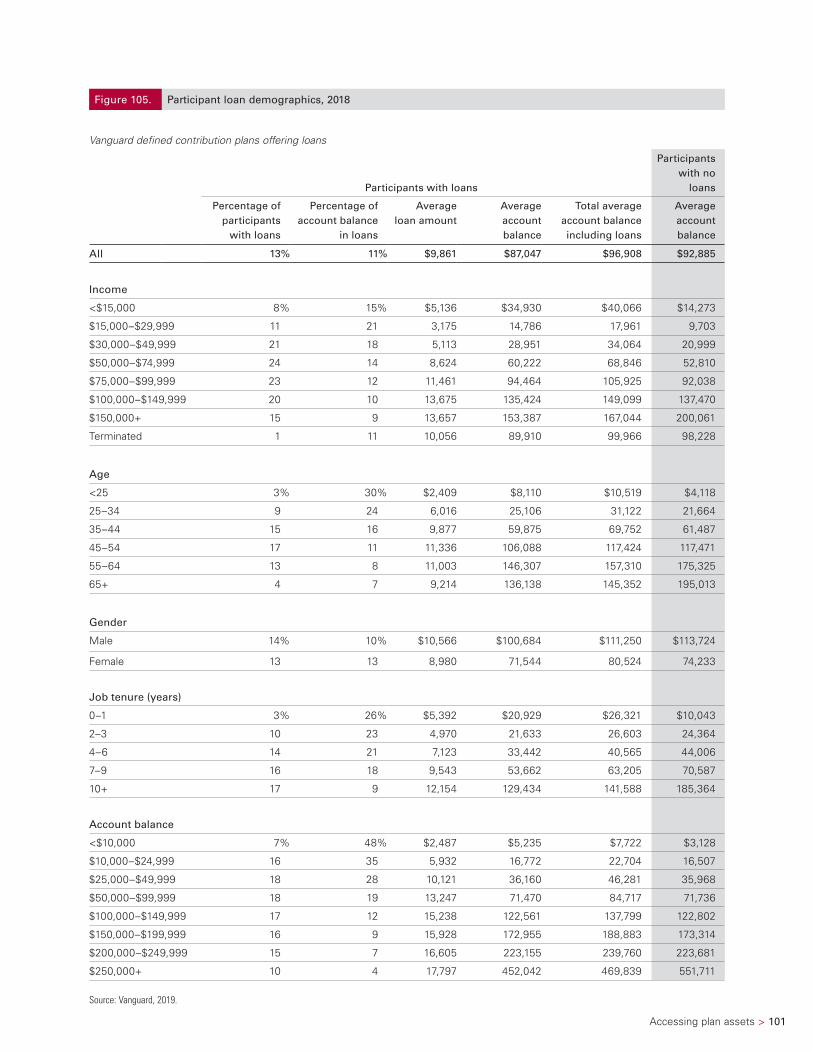
Accessing plan assets > 101
Figure 105. Participant loan demographics, 2018
Vanguard defined contribution plans offering loans
Participants with loans
Participants with no
loans
Percentage of participants
with loans
Percentage of account balance
in loans
Average loan amount
Average account balance
Total average account balance including loans
Average account balance
All 13% 11% $9,861 $87,047 $96,908 $92,885
Income
<$15,000 8% 15% $5,136 $34,930 $40,066 $14,273
$15,000–$29,999 11 21 3,175 14,786 17,961 9,703
$30,000–$49,999 21 18 5,113 28,951 34,064 20,999
$50,000–$74,999 24 14 8,624 60,222 68,846 52,810
$75,000–$99,999 23 12 11,461 94,464 105,925 92,038
$100,000–$149,999 20 10 13,675 135,424 149,099 137,470
$150,000+ 15 9 13,657 153,387 167,044 200,061
Terminated 1 11 10,056 89,910 99,966 98,228
Age
<25 3% 30% $2,409 $8,110 $10,519 $4,118
25–34 9 24 6,016 25,106 31,122 21,664
35–44 15 16 9,877 59,875 69,752 61,487
45–54 17 11 11,336 106,088 117,424 117,471
55–64 13 8 11,003 146,307 157,310 175,325
65+ 4 7 9,214 136,138 145,352 195,013
Gender
Male 14% 10% $10,566 $100,684 $111,250 $113,724
Female 13 13 8,980 71,544 80,524 74,233
Job tenure (years)
0–1 3% 26% $5,392 $20,929 $26,321 $10,043
2–3 10 23 4,970 21,633 26,603 24,364
4–6 14 21 7,123 33,442 40,565 44,006
7–9 16 18 9,543 53,662 63,205 70,587
10+ 17 9 12,154 129,434 141,588 185,364
Account balance
<$10,000 7% 48% $2,487 $5,235 $7,722 $3,128
$10,000–$24,999 16 35 5,932 16,772 22,704 16,507
$25,000–$49,999 18 28 10,121 36,160 46,281 35,968
$50,000–$99,999 18 19 13,247 71,470 84,717 71,736
$100,000–$149,999 17 12 15,238 122,561 137,799 122,802
$150,000–$199,999 16 9 15,928 172,955 188,883 173,314
$200,000–$249,999 15 7 16,605 223,155 239,760 223,681
$250,000+ 10 4 17,797 452,042 469,839 551,711
Source: Vanguard, 2019.
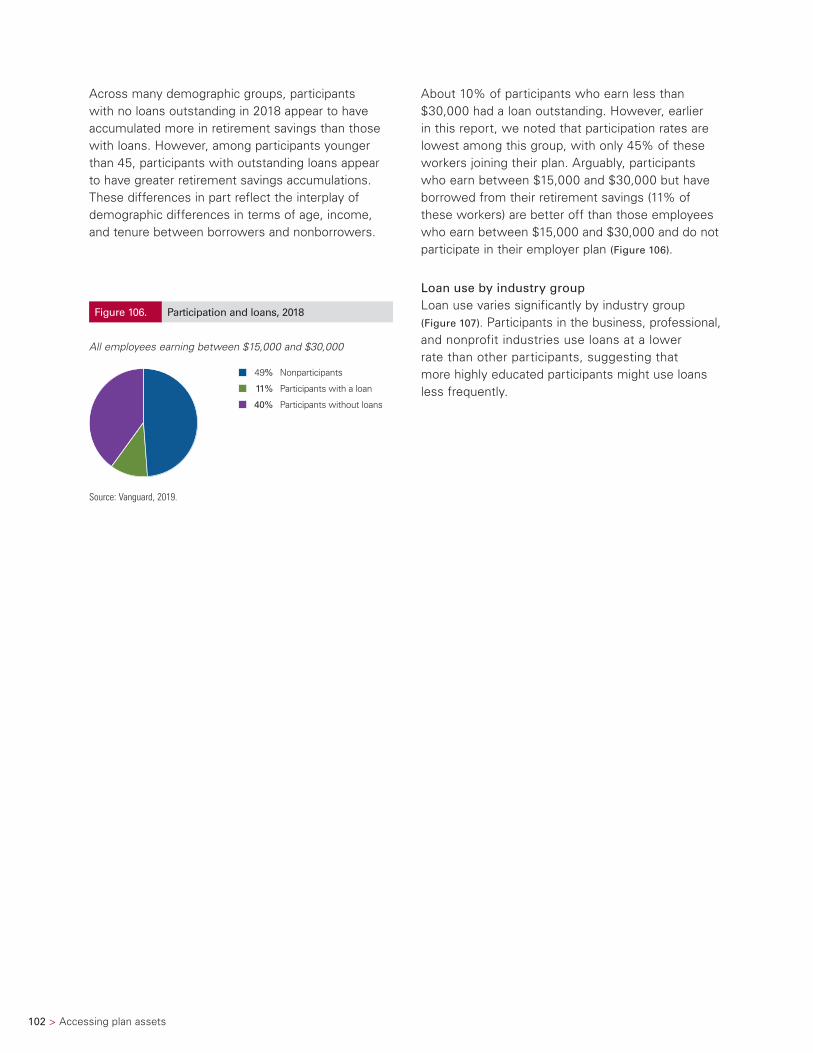
102 > Accessing plan assets
Across many demographic groups, participants with no loans outstanding in 2018 appear to have accumulated more in retirement savings than those with loans. However, among participants younger than 45, participants with outstanding loans appear to have greater retirement savings accumulations. These differences in part reflect the interplay of demographic differences in terms of age, income, and tenure between borrowers and nonborrowers.
About 10% of participants who earn less than $30,000 had a loan outstanding. However, earlier in this report, we noted that participation rates are lowest among this group, with only 45% of these workers joining their plan. Arguably, participants who earn between $15,000 and $30,000 but have borrowed from their retirement savings (11% of these workers) are better off than those employees who earn between $15,000 and $30,000 and do not participate in their employer plan (Figure 106).
Loan use by industry groupLoan use varies significantly by industry group (Figure 107). Participants in the business, professional, and nonprofit industries use loans at a lower rate than other participants, suggesting that more highly educated participants might use loans less frequently.
Figure 106. Participation and loans, 2018
All employees earning between $15,000 and $30,000
49% Nonparticipants
11% Participants with a loan
40% Participants without loans
Source: Vanguard, 2019.
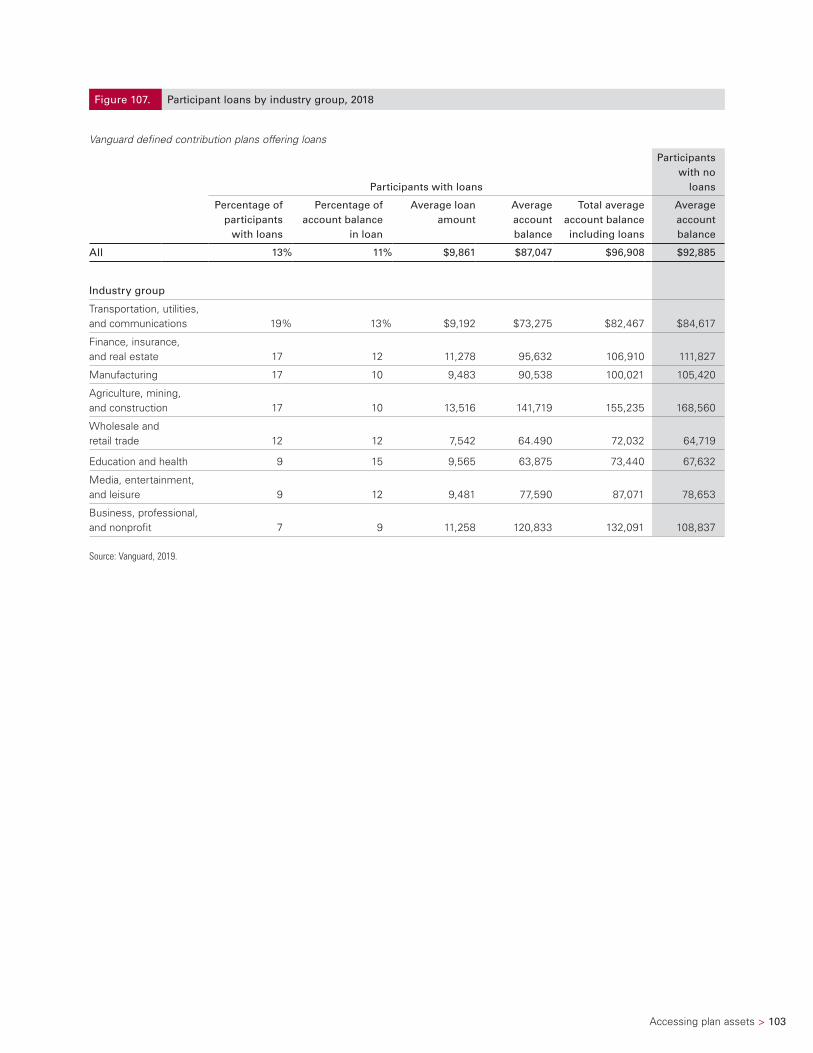
Accessing plan assets > 103
Figure 107. Participant loans by industry group, 2018
Vanguard defined contribution plans offering loans
Participants with loans
Participants with no
loans
Percentage of participants
with loans
Percentage of account balance
in loan
Average loan amount
Average account balance
Total average account balance including loans
Average account balance
All 13% 11% $9,861 $87,047 $96,908 $92,885
Industry group
Transportation, utilities, and communications 19% 13% $9,192 $73,275 $82,467 $84,617
Finance, insurance, and real estate 17 12 11,278 95,632 106,910 111,827
Manufacturing 17 10 9,483 90,538 100,021 105,420
Agriculture, mining, and construction 17 10 13,516 141,719 155,235 168,560
Wholesale and retail trade 12 12 7,542 64.490 72,032 64,719
Education and health 9 15 9,565 63,875 73,440 67,632
Media, entertainment, and leisure 9 12 9,481 77,590 87,071 78,653
Business, professional, and nonprofit 7 9 11,258 120,833 132,091 108,837
Source: Vanguard, 2019.
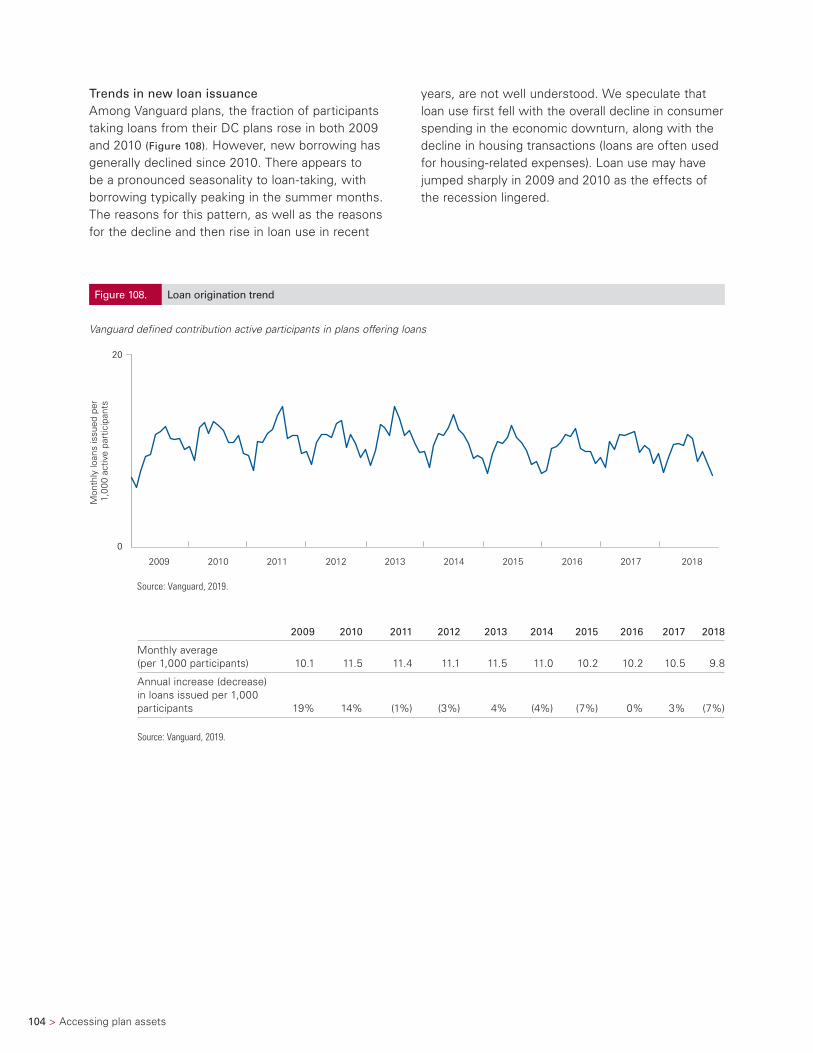
104 > Accessing plan assets
Trends in new loan issuanceAmong Vanguard plans, the fraction of participants taking loans from their DC plans rose in both 2009 and 2010 (Figure 108). However, new borrowing has generally declined since 2010. There appears to be a pronounced seasonality to loan-taking, with borrowing typically peaking in the summer months. The reasons for this pattern, as well as the reasons for the decline and then rise in loan use in recent
years, are not well understood. We speculate that loan use first fell with the overall decline in consumer spending in the economic downturn, along with the decline in housing transactions (loans are often used for housing-related expenses). Loan use may have jumped sharply in 2009 and 2010 as the effects of the recession lingered.
Figure 108. Loan origination trend
Vanguard defined contribution active participants in plans offering loans
Mon
thly
loan
s is
sued
per
1,
000
activ
e pa
rtic
ipan
ts
0
20
2009 2010 2011 2012 2013 2014 2015 2016 2017 2018
Source: Vanguard, 2019.
2009 2010 2011 2012 2013 2014 2015 2016 2017 2018
Monthly average (per 1,000 participants) 10.1 11.5 11.4 11.1 11.5 11.0 10.2 10.2 10.5 9.8
Annual increase (decrease) in loans issued per 1,000 participants 19% 14% (1%) (3%) 4% (4%) (7%) 0% 3% (7%)
Source: Vanguard, 2019.
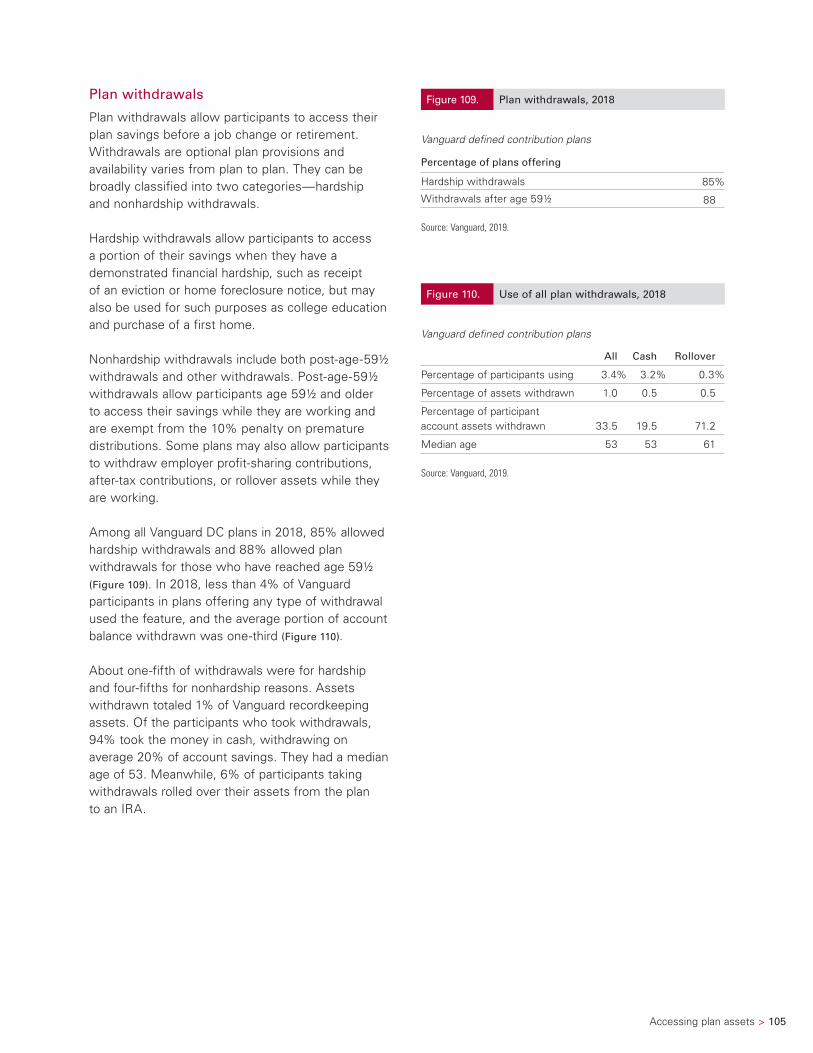
Accessing plan assets > 105
Plan withdrawals
Plan withdrawals allow participants to access their plan savings before a job change or retirement. Withdrawals are optional plan provisions and availability varies from plan to plan. They can be broadly classified into two categories—hardship and nonhardship withdrawals.
Hardship withdrawals allow participants to access a portion of their savings when they have a demonstrated financial hardship, such as receipt of an eviction or home foreclosure notice, but may also be used for such purposes as college education and purchase of a first home.
Nonhardship withdrawals include both post-age-59½ withdrawals and other withdrawals. Post-age-59½ withdrawals allow participants age 59½ and older to access their savings while they are working and are exempt from the 10% penalty on premature distributions. Some plans may also allow participants to withdraw employer profit-sharing contributions, after-tax contributions, or rollover assets while they are working.
Among all Vanguard DC plans in 2018, 85% allowed hardship withdrawals and 88% allowed plan withdrawals for those who have reached age 59½ (Figure 109). In 2018, less than 4% of Vanguard participants in plans offering any type of withdrawal used the feature, and the average portion of account balance withdrawn was one-third (Figure 110).
About one-fifth of withdrawals were for hardship and four-fifths for nonhardship reasons. Assets withdrawn totaled 1% of Vanguard recordkeeping assets. Of the participants who took withdrawals, 94% took the money in cash, withdrawing on average 20% of account savings. They had a median age of 53. Meanwhile, 6% of participants taking withdrawals rolled over their assets from the plan to an IRA.
Figure 109. Plan withdrawals, 2018
Vanguard defined contribution plans
Percentage of plans offering
Hardship withdrawals 85%
Withdrawals after age 59½ 88
Source: Vanguard, 2019.
Figure 110. Use of all plan withdrawals, 2018
Vanguard defined contribution plans
All Cash Rollover
Percentage of participants using 3.4% 3.2% 0.3%
Percentage of assets withdrawn 1.0 0.5 0.5
Percentage of participant account assets withdrawn 33.5 19.5 71.2
Median age 53 53 61
Source: Vanguard, 2019.

106 > Accessing plan assets
A major contributor to this is likely participants older than 59½ rolling over their plan savings even as they continue to work and participate in the plan. Participants choosing a rollover had a median age of 61 and on average they rolled over about 70% of their account balance. These participants rolling over assets account for half of the assets being withdrawn.
In the aftermath of the global financial crisis, the rate of new nonhardship withdrawals, such as post-age-59½ in-service or other withdrawals, has grown by two-thirds between 2009 and 2018 (Figure 111). Nonhardship withdrawals also have a seasonal pattern and often spike in the first quarter of the year. This spike in activity is likely due to the withdrawal of employer profit-sharing contributions, which are frequently made early in the calendar year.
Over the same 2009-to-2018 period, the rate of new hardship withdrawals rose modestly and then fell modestly, while remaining at a low absolute level of
2% of participants. One of the reasons a participant can take a hardship withdrawal is to avoid foreclosure or eviction from a home. We believe that the surge in foreclosures resulting from the housing bubble did, in part, drive the 2010 increase. Hardship withdrawals have fluctuated within a relatively narrow range from 2009 to 2018.
Plan withdrawals are used infrequently in the aggregate. However, 4 in 10 participants taking a withdrawal in 2018 had also taken plan withdrawals in 2017, and about 1 in 10 in this group had taken a plan withdrawal in each of the past five years. Certain participants could, over time, jeopardize their retirement program if they continue to rely on this feature throughout their working careers.
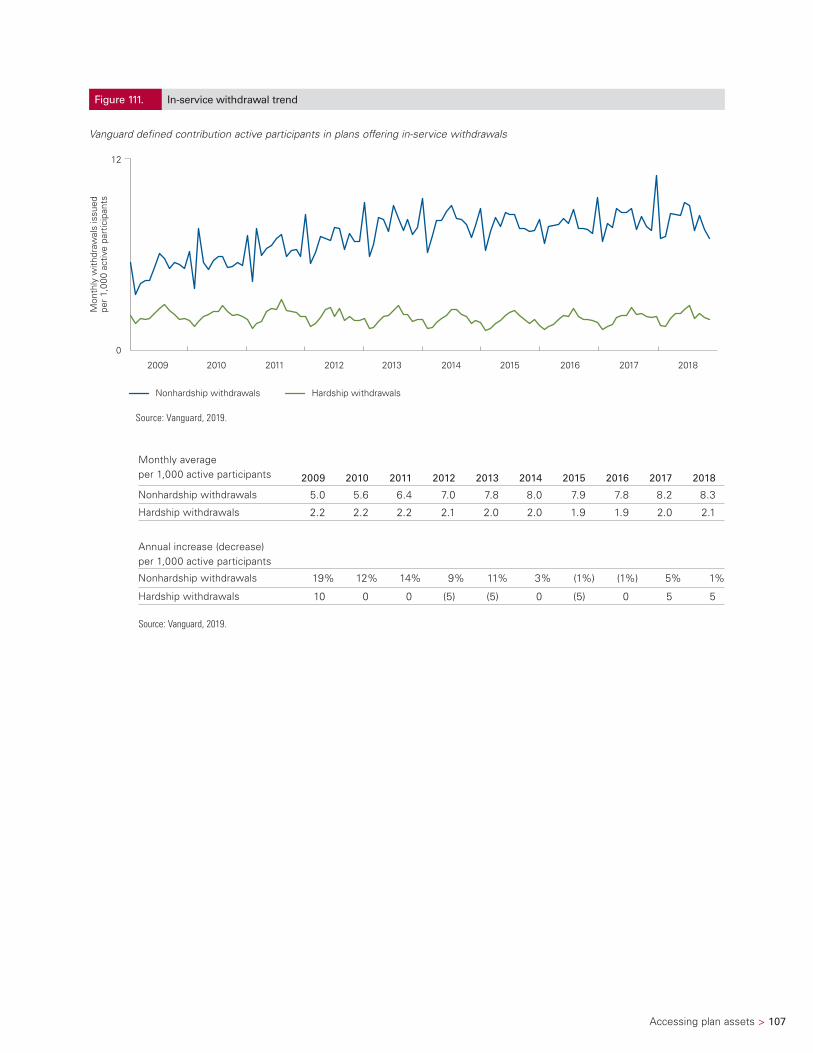
Accessing plan assets > 107
Figure 111. In-service withdrawal trend
Vanguard defined contribution active participants in plans offering in-service withdrawals
Mon
thly
with
draw
als
issu
edpe
r 1,
000
activ
e pa
rtic
ipan
ts
Nonhardship withdrawals Hardship withdrawals
0
12
2009 2010 2011 2012 2013 2014 2015 2016 2017 2018
Source: Vanguard, 2019.
Monthly average per 1,000 active participants 2009 2010 2011 2012 2013 2014 2015 2016 2017 2018
Nonhardship withdrawals 5.0 5.6 6.4 7.0 7.8 8.0 7.9 7.8 8.2 8.3
Hardship withdrawals 2.2 2.2 2.2 2.1 2.0 2.0 1.9 1.9 2.0 2.1
Annual increase (decrease) per 1,000 active participants
Nonhardship withdrawals 19% 12% 14% 9% 11% 3% (1%) (1%) 5% 1%
Hardship withdrawals 10 0 0 (5) (5) 0 (5) 0 5 5
Source: Vanguard, 2019.
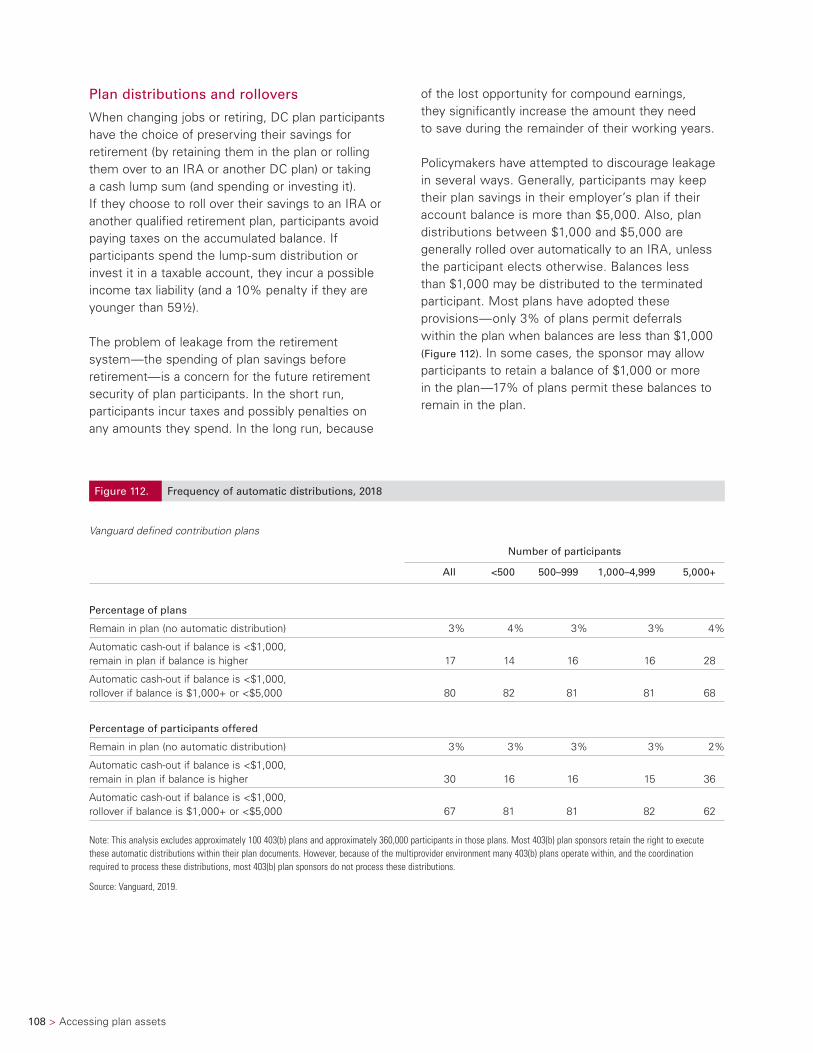
108 > Accessing plan assets
Plan distributions and rollovers
When changing jobs or retiring, DC plan participants have the choice of preserving their savings for retirement (by retaining them in the plan or rolling them over to an IRA or another DC plan) or taking a cash lump sum (and spending or investing it). If they choose to roll over their savings to an IRA or another qualified retirement plan, participants avoid paying taxes on the accumulated balance. If participants spend the lump-sum distribution or invest it in a taxable account, they incur a possible income tax liability (and a 10% penalty if they are younger than 59½).
The problem of leakage from the retirement system—the spending of plan savings before retirement—is a concern for the future retirement security of plan participants. In the short run, participants incur taxes and possibly penalties on any amounts they spend. In the long run, because
of the lost opportunity for compound earnings, they significantly increase the amount they need to save during the remainder of their working years.
Policymakers have attempted to discourage leakage in several ways. Generally, participants may keep their plan savings in their employer’s plan if their account balance is more than $5,000. Also, plan distributions between $1,000 and $5,000 are generally rolled over automatically to an IRA, unless the participant elects otherwise. Balances less than $1,000 may be distributed to the terminated participant. Most plans have adopted these provisions—only 3% of plans permit deferrals within the plan when balances are less than $1,000 (Figure 112). In some cases, the sponsor may allow participants to retain a balance of $1,000 or more in the plan—17% of plans permit these balances to remain in the plan.
Figure 112. Frequency of automatic distributions, 2018
Vanguard defined contribution plans
Number of participants
All <500 500–999 1,000–4,999 5,000+
Percentage of plans
Remain in plan (no automatic distribution) 3% 4% 3% 3% 4%
Automatic cash-out if balance is <$1,000, remain in plan if balance is higher 17 14 16 16 28
Automatic cash-out if balance is <$1,000, rollover if balance is $1,000+ or <$5,000 80 82 81 81 68
Percentage of participants offered
Remain in plan (no automatic distribution) 3% 3% 3% 3% 2%
Automatic cash-out if balance is <$1,000, remain in plan if balance is higher 30 16 16 15 36
Automatic cash-out if balance is <$1,000, rollover if balance is $1,000+ or <$5,000 67 81 81 82 62
Note: This analysis excludes approximately 100 403(b) plans and approximately 360,000 participants in those plans. Most 403(b) plan sponsors retain the right to execute these automatic distributions within their plan documents. However, because of the multiprovider environment many 403(b) plans operate within, and the coordination required to process these distributions, most 403(b) plan sponsors do not process these distributions.
Source: Vanguard, 2019.
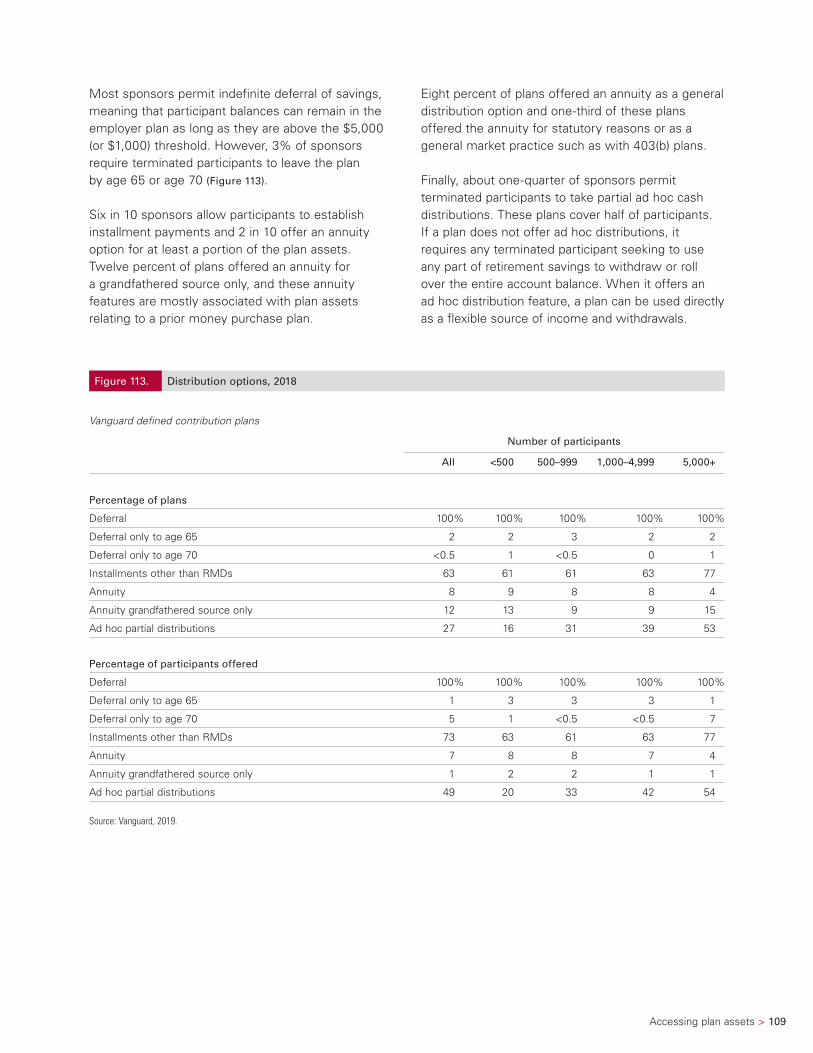
Accessing plan assets > 109
Most sponsors permit indefinite deferral of savings, meaning that participant balances can remain in the employer plan as long as they are above the $5,000 (or $1,000) threshold. However, 3% of sponsors require terminated participants to leave the plan by age 65 or age 70 (Figure 113).
Six in 10 sponsors allow participants to establish installment payments and 2 in 10 offer an annuity option for at least a portion of the plan assets. Twelve percent of plans offered an annuity for a grandfathered source only, and these annuity features are mostly associated with plan assets relating to a prior money purchase plan.
Eight percent of plans offered an annuity as a general distribution option and one-third of these plans offered the annuity for statutory reasons or as a general market practice such as with 403(b) plans.
Finally, about one-quarter of sponsors permit terminated participants to take partial ad hoc cash distributions. These plans cover half of participants. If a plan does not offer ad hoc distributions, it requires any terminated participant seeking to use any part of retirement savings to withdraw or roll over the entire account balance. When it offers an ad hoc distribution feature, a plan can be used directly as a flexible source of income and withdrawals.
Figure 113. Distribution options, 2018
Vanguard defined contribution plans
Number of participants
All <500 500–999 1,000–4,999 5,000+
Percentage of plans
Deferral 100% 100% 100% 100% 100%
Deferral only to age 65 2 2 3 2 2
Deferral only to age 70 <0.5 1 <0.5 0 1
Installments other than RMDs 63 61 61 63 77
Annuity 8 9 8 8 4
Annuity grandfathered source only 12 13 9 9 15
Ad hoc partial distributions 27 16 31 39 53
Percentage of participants offered
Deferral 100% 100% 100% 100% 100%
Deferral only to age 65 1 3 3 3 1
Deferral only to age 70 5 1 <0.5 <0.5 7
Installments other than RMDs 73 63 61 63 77
Annuity 7 8 8 7 4
Annuity grandfathered source only 1 2 2 1 1
Ad hoc partial distributions 49 20 33 42 54
Source: Vanguard, 2019.
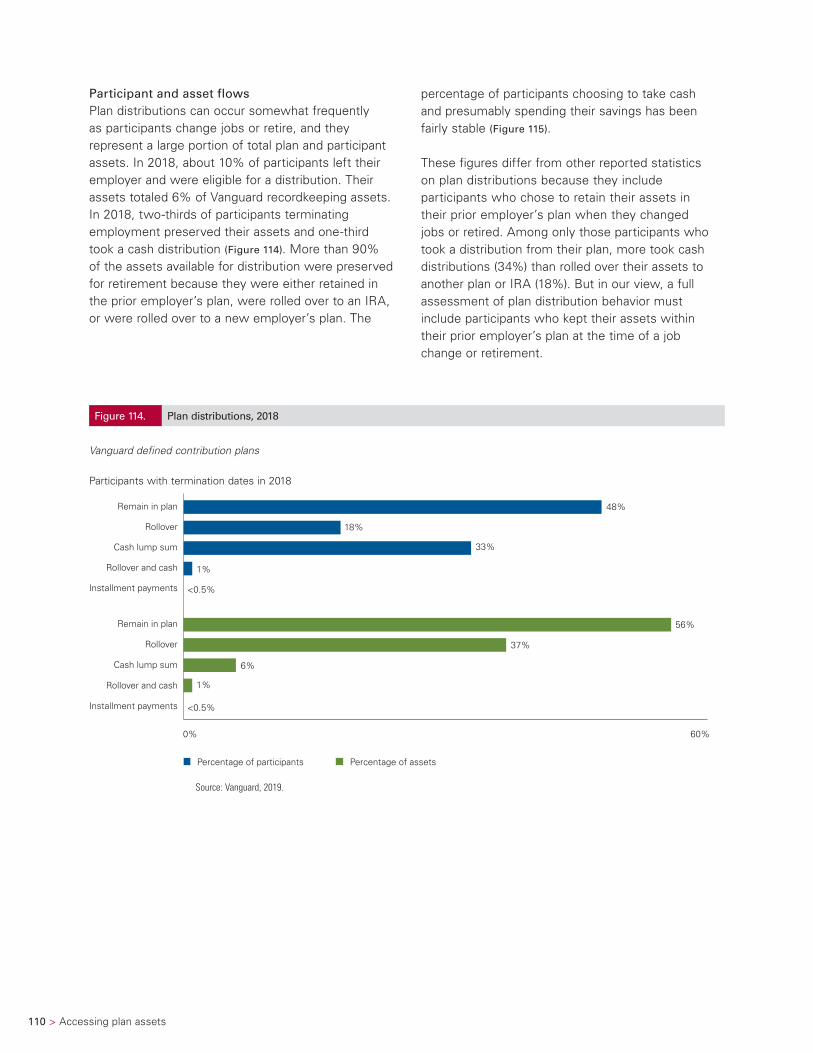
110 > Accessing plan assets
Participant and asset flowsPlan distributions can occur somewhat frequently as participants change jobs or retire, and they represent a large portion of total plan and participant assets. In 2018, about 10% of participants left their employer and were eligible for a distribution. Their assets totaled 6% of Vanguard recordkeeping assets. In 2018, two-thirds of participants terminating employment preserved their assets and one-third took a cash distribution (Figure 114). More than 90% of the assets available for distribution were preserved for retirement because they were either retained in the prior employer’s plan, were rolled over to an IRA, or were rolled over to a new employer’s plan. The
percentage of participants choosing to take cash and presumably spending their savings has been fairly stable (Figure 115).
These figures differ from other reported statistics on plan distributions because they include participants who chose to retain their assets in their prior employer’s plan when they changed jobs or retired. Among only those participants who took a distribution from their plan, more took cash distributions (34%) than rolled over their assets to another plan or IRA (18%). But in our view, a full assessment of plan distribution behavior must include participants who kept their assets within their prior employer’s plan at the time of a job change or retirement.
Figure 114. Plan distributions, 2018
Vanguard defined contribution plans
Participants with termination dates in 2018
Percentage of participants Percentage of assets
Remain in plan
Rollover
Installment payments
Cash lump sum
Rollover and cash
Remain in plan
Rollover
Installment payments
Cash lump sum
Rollover and cash
<0.5%
1%
37%
6%
56%
0% 60%
<0.5%
1%
33%
18%
48%
Source: Vanguard, 2019.
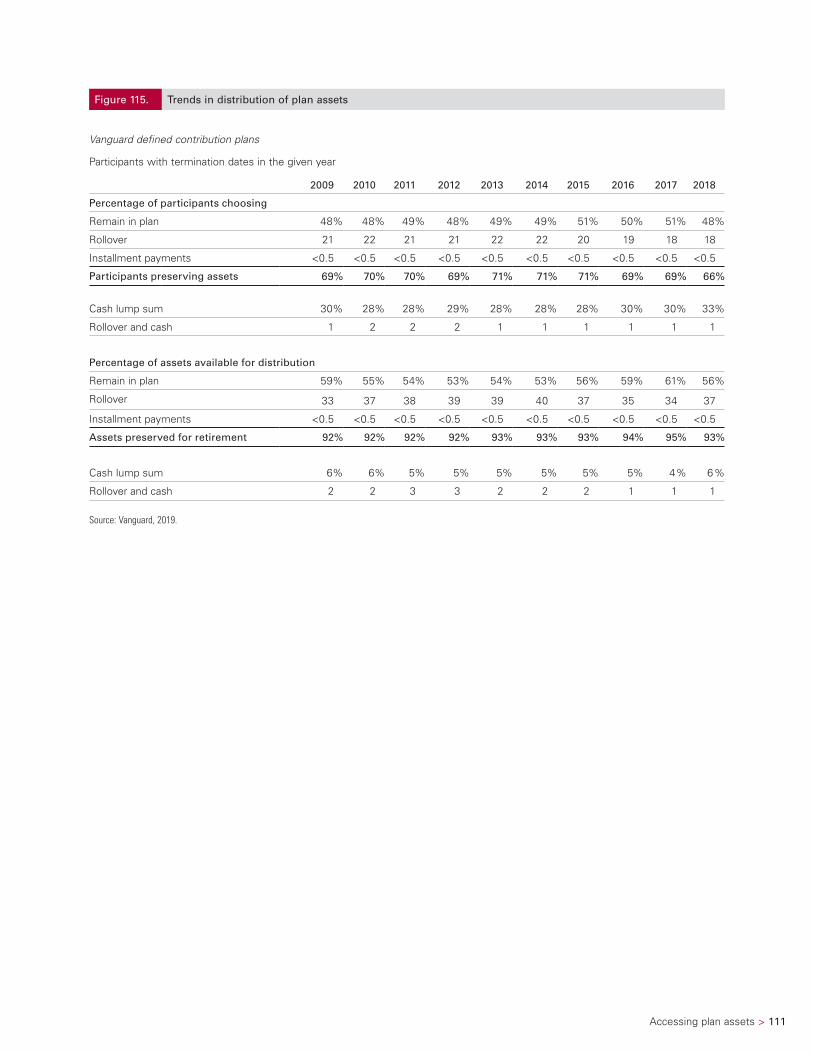
Accessing plan assets > 111
Figure 115. Trends in distribution of plan assets
Vanguard defined contribution plans
Participants with termination dates in the given year
2009 2010 2011 2012 2013 2014 2015 2016 2017 2018
Percentage of participants choosing
Remain in plan 48% 48% 49% 48% 49% 49% 51% 50% 51% 48%
Rollover 21 22 21 21 22 22 20 19 18 18
Installment payments <0.5 <0.5 <0.5 <0.5 <0.5 <0.5 <0.5 <0.5 <0.5 <0.5
Participants preserving assets 69% 70% 70% 69% 71% 71% 71% 69% 69% 66%
Cash lump sum 30% 28% 28% 29% 28% 28% 28% 30% 30% 33%
Rollover and cash 1 2 2 2 1 1 1 1 1 1
Percentage of assets available for distribution
Remain in plan 59% 55% 54% 53% 54% 53% 56% 59% 61% 56%
Rollover 33 37 38 39 39 40 37 35 34 37
Installment payments <0.5 <0.5 <0.5 <0.5 <0.5 <0.5 <0.5 <0.5 <0.5 <0.5
Assets preserved for retirement 92% 92% 92% 92% 93% 93% 93% 94% 95% 93%
Cash lump sum 6% 6% 5% 5% 5% 5% 5% 5% 4% 6%
Rollover and cash 2 2 3 3 2 2 2 1 1 1
Source: Vanguard, 2019.
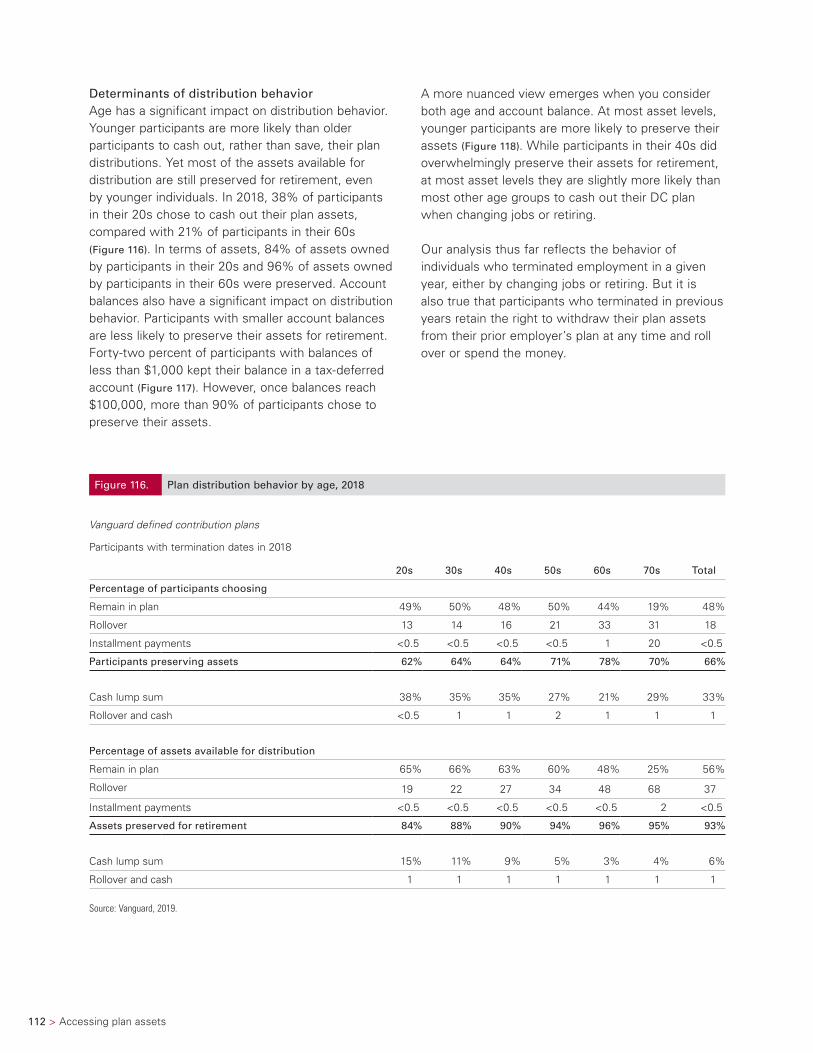
112 > Accessing plan assets
Determinants of distribution behaviorAge has a significant impact on distribution behavior. Younger participants are more likely than older participants to cash out, rather than save, their plan distributions. Yet most of the assets available for distribution are still preserved for retirement, even by younger individuals. In 2018, 38% of participants in their 20s chose to cash out their plan assets, compared with 21% of participants in their 60s (Figure 116). In terms of assets, 84% of assets owned by participants in their 20s and 96% of assets owned by participants in their 60s were preserved. Account balances also have a significant impact on distribution behavior. Participants with smaller account balances are less likely to preserve their assets for retirement. Forty-two percent of participants with balances of less than $1,000 kept their balance in a tax-deferred account (Figure 117). However, once balances reach $100,000, more than 90% of participants chose to preserve their assets.
A more nuanced view emerges when you consider both age and account balance. At most asset levels, younger participants are more likely to preserve their assets (Figure 118). While participants in their 40s did overwhelmingly preserve their assets for retirement, at most asset levels they are slightly more likely than most other age groups to cash out their DC plan when changing jobs or retiring.
Our analysis thus far reflects the behavior of individuals who terminated employment in a given year, either by changing jobs or retiring. But it is also true that participants who terminated in previous years retain the right to withdraw their plan assets from their prior employer’s plan at any time and roll over or spend the money.
Figure 116. Plan distribution behavior by age, 2018
Vanguard defined contribution plans
Participants with termination dates in 2018
20s 30s 40s 50s 60s 70s Total
Percentage of participants choosing
Remain in plan 49% 50% 48% 50% 44% 19% 48%
Rollover 13 14 16 21 33 31 18
Installment payments <0.5 <0.5 <0.5 <0.5 1 20 <0.5
Participants preserving assets 62% 64% 64% 71% 78% 70% 66%
Cash lump sum 38% 35% 35% 27% 21% 29% 33%
Rollover and cash <0.5 1 1 2 1 1 1
Percentage of assets available for distribution
Remain in plan 65% 66% 63% 60% 48% 25% 56%
Rollover 19 22 27 34 48 68 37
Installment payments <0.5 <0.5 <0.5 <0.5 <0.5 2 <0.5
Assets preserved for retirement 84% 88% 90% 94% 96% 95% 93%
Cash lump sum 15% 11% 9% 5% 3% 4% 6%
Rollover and cash 1 1 1 1 1 1 1
Source: Vanguard, 2019.
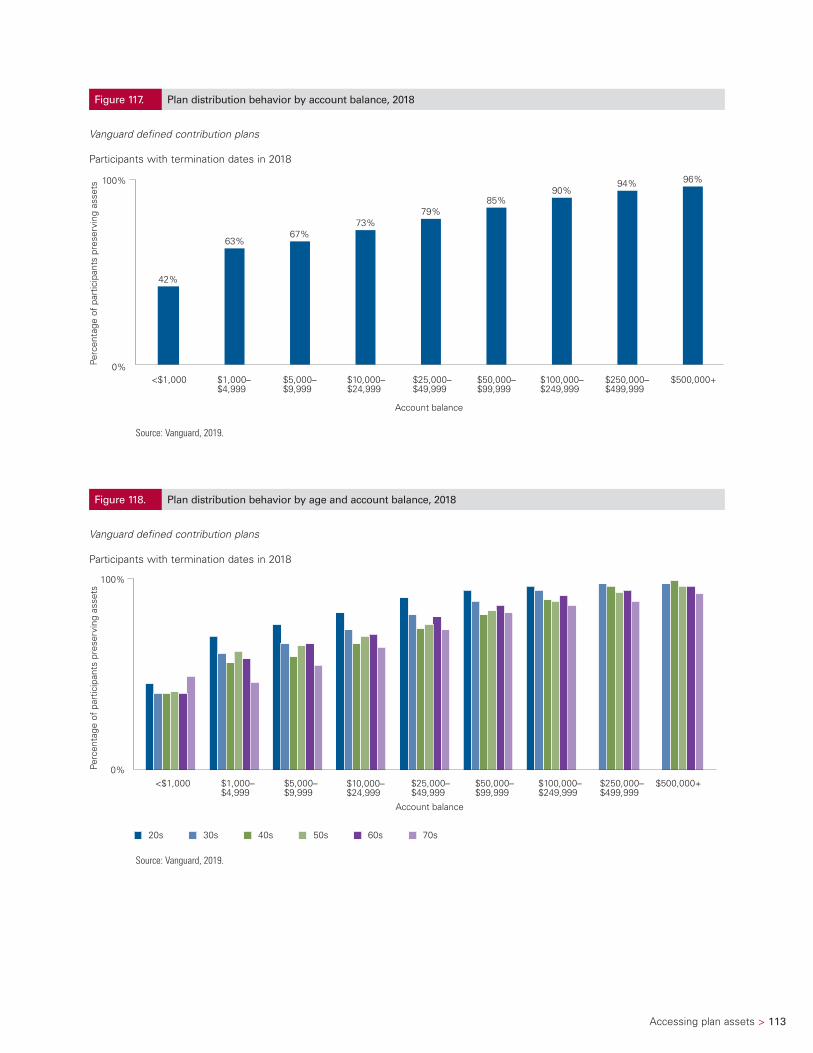
Accessing plan assets > 113
Figure 117. Plan distribution behavior by account balance, 2018
Vanguard defined contribution plans
Participants with termination dates in 2018
Perc
enta
ge o
f pa
rtic
ipan
ts p
rese
rvin
g as
sets
Account balance
<$1,000 $1,000–$4,999
$5,000–$9,999
$50,000–$99,999
$10,000–$24,999
$25,000–$49,999
$250,000–$499,999
$500,000+$100,000–$249,999
0%
100%
42%
63%67%
73%79%
85%90%
94% 96%
Source: Vanguard, 2019.
Figure 118. Plan distribution behavior by age and account balance, 2018
Vanguard defined contribution plans
Participants with termination dates in 2018
Perc
enta
ge o
f pa
rtic
ipan
ts p
rese
rvin
g as
sets
20s 30s 40s 70s50s 60s
<$1,000 $1,000–$4,999
$5,000–$9,999
$50,000–$99,999
$10,000–$24,999
$25,000–$49,999
$250,000–$499,999
$500,000+$100,000–$249,999
Account balance
0%
100%
Source: Vanguard, 2019.
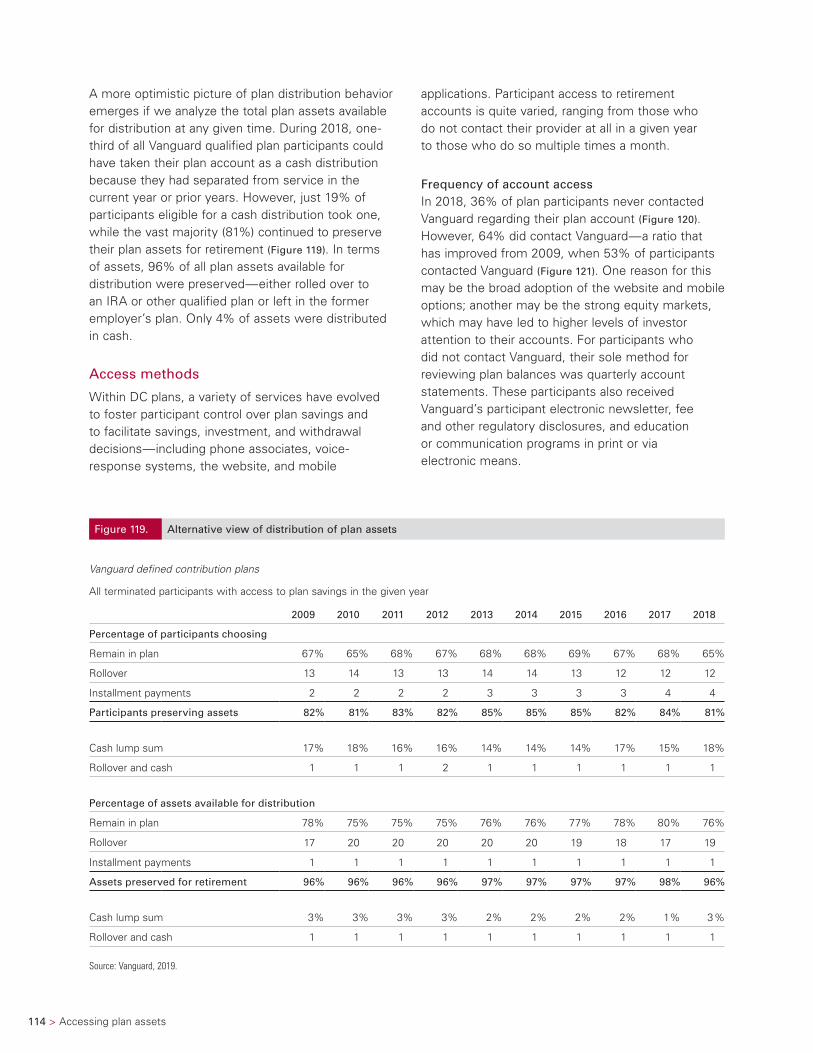
114 > Accessing plan assets
A more optimistic picture of plan distribution behavior emerges if we analyze the total plan assets available for distribution at any given time. During 2018, one-third of all Vanguard qualified plan participants could have taken their plan account as a cash distribution because they had separated from service in the current year or prior years. However, just 19% of participants eligible for a cash distribution took one, while the vast majority (81%) continued to preserve their plan assets for retirement (Figure 119). In terms of assets, 96% of all plan assets available for distribution were preserved—either rolled over to an IRA or other qualified plan or left in the former employer’s plan. Only 4% of assets were distributed in cash.
Access methods
Within DC plans, a variety of services have evolved to foster participant control over plan savings and to facilitate savings, investment, and withdrawal decisions—including phone associates, voice-response systems, the website, and mobile
applications. Participant access to retirement accounts is quite varied, ranging from those who do not contact their provider at all in a given year to those who do so multiple times a month.
Frequency of account accessIn 2018, 36% of plan participants never contacted Vanguard regarding their plan account (Figure 120). However, 64% did contact Vanguard—a ratio that has improved from 2009, when 53% of participants contacted Vanguard (Figure 121). One reason for this may be the broad adoption of the website and mobile options; another may be the strong equity markets, which may have led to higher levels of investor attention to their accounts. For participants who did not contact Vanguard, their sole method for reviewing plan balances was quarterly account statements. These participants also received Vanguard’s participant electronic newsletter, fee and other regulatory disclosures, and education or communication programs in print or via electronic means.
Figure 119. Alternative view of distribution of plan assets
Vanguard defined contribution plans
All terminated participants with access to plan savings in the given year
2009 2010 2011 2012 2013 2014 2015 2016 2017 2018
Percentage of participants choosing
Remain in plan 67% 65% 68% 67% 68% 68% 69% 67% 68% 65%
Rollover 13 14 13 13 14 14 13 12 12 12
Installment payments 2 2 2 2 3 3 3 3 4 4
Participants preserving assets 82% 81% 83% 82% 85% 85% 85% 82% 84% 81%
Cash lump sum 17% 18% 16% 16% 14% 14% 14% 17% 15% 18%
Rollover and cash 1 1 1 2 1 1 1 1 1 1
Percentage of assets available for distribution
Remain in plan 78% 75% 75% 75% 76% 76% 77% 78% 80% 76%
Rollover 17 20 20 20 20 20 19 18 17 19
Installment payments 1 1 1 1 1 1 1 1 1 1
Assets preserved for retirement 96% 96% 96% 96% 97% 97% 97% 97% 98% 96%
Cash lump sum 3% 3% 3% 3% 2% 2% 2% 2% 1% 3%
Rollover and cash 1 1 1 1 1 1 1 1 1 1
Source: Vanguard, 2019.
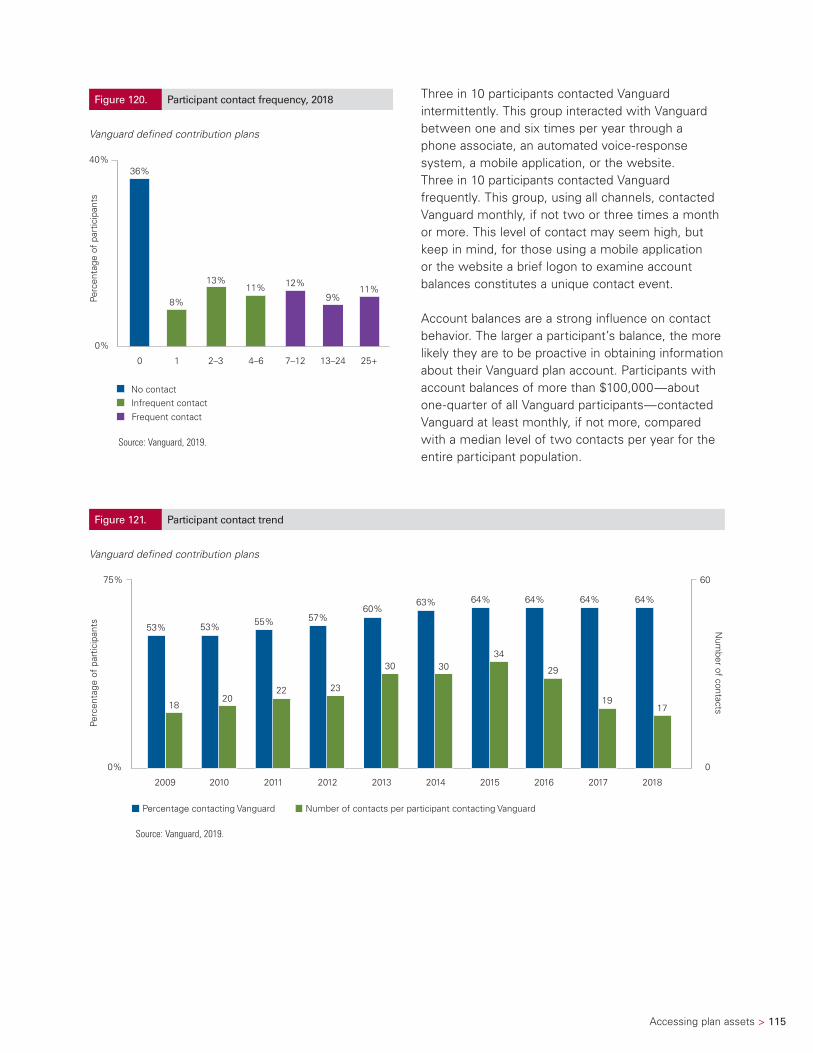
Accessing plan assets > 115
Three in 10 participants contacted Vanguard intermittently. This group interacted with Vanguard between one and six times per year through a phone associate, an automated voice-response system, a mobile application, or the website. Three in 10 participants contacted Vanguard frequently. This group, using all channels, contacted Vanguard monthly, if not two or three times a month or more. This level of contact may seem high, but keep in mind, for those using a mobile application or the website a brief logon to examine account balances constitutes a unique contact event.
Account balances are a strong influence on contact behavior. The larger a participant’s balance, the more likely they are to be proactive in obtaining information about their Vanguard plan account. Participants with account balances of more than $100,000—about one-quarter of all Vanguard participants—contacted Vanguard at least monthly, if not more, compared with a median level of two contacts per year for the entire participant population.
Figure 121. Participant contact trend
Vanguard defined contribution plans
Percentage contacting Vanguard Number of contacts per participant contacting Vanguard
2009 2010 2011 2012 2013 2014 2015 2016 2017 2018
0 0%
75% 60
Perc
enta
ge o
f pa
rtic
ipan
ts Num
ber of contacts
23
18
3034
29
1922
30
63% 64% 64% 64%60%
20
57%53%
55%53%
17
64%
Source: Vanguard, 2019.
Figure 120. Participant contact frequency, 2018
Vanguard defined contribution plans
Infrequent contactNo contact
Frequent contact
0 1 2–3 4–6 7–12 13–24 25+
0%
40% 36%
13% 12%11%
8% 9%11%
Perc
enta
ge o
f pa
rtic
ipan
ts
Source: Vanguard, 2019.
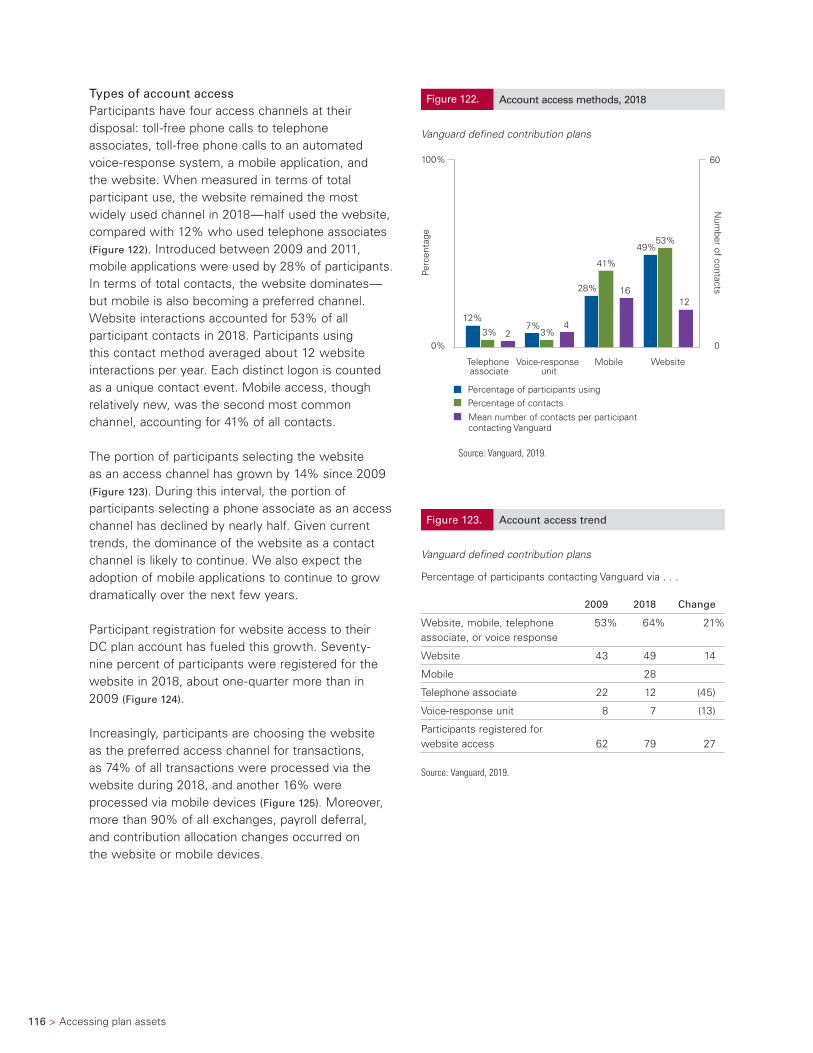
116 > Accessing plan assets
Types of account accessParticipants have four access channels at their disposal: toll-free phone calls to telephone associates, toll-free phone calls to an automated voice-response system, a mobile application, and the website. When measured in terms of total participant use, the website remained the most widely used channel in 2018—half used the website, compared with 12% who used telephone associates (Figure 122). Introduced between 2009 and 2011, mobile applications were used by 28% of participants. In terms of total contacts, the website dominates—but mobile is also becoming a preferred channel. Website interactions accounted for 53% of all participant contacts in 2018. Participants using this contact method averaged about 12 website interactions per year. Each distinct logon is counted as a unique contact event. Mobile access, though relatively new, was the second most common channel, accounting for 41% of all contacts.
The portion of participants selecting the website as an access channel has grown by 14% since 2009 (Figure 123). During this interval, the portion of participants selecting a phone associate as an access channel has declined by nearly half. Given current trends, the dominance of the website as a contact channel is likely to continue. We also expect the adoption of mobile applications to continue to grow dramatically over the next few years.
Participant registration for website access to their DC plan account has fueled this growth. Seventy-nine percent of participants were registered for the website in 2018, about one-quarter more than in 2009 (Figure 124).
Increasingly, participants are choosing the website as the preferred access channel for transactions, as 74% of all transactions were processed via the website during 2018, and another 16% were processed via mobile devices (Figure 125). Moreover, more than 90% of all exchanges, payroll deferral, and contribution allocation changes occurred on the website or mobile devices.
Figure 123. Account access trend
Vanguard defined contribution plans
Percentage of participants contacting Vanguard via . . .
2009 2018 Change
Website, mobile, telephone associate, or voice response
53% 64% 21%
Website 43 49 14
Mobile 28
Telephone associate 22 12 (45)
Voice-response unit 8 7 (13)
Participants registered for website access 62 79 27
Source: Vanguard, 2019.
Figure 122. Account access methods, 2018
Vanguard defined contribution plans
Percentage of contactsPercentage of participants using
Mean number of contacts per participantcontacting Vanguard
Telephone associate
Voice-response unit
Mobile Website
12%7%
3%
28%
41%
16
49%
12
53%
3%4
2
60 100%
0% 0
Perc
enta
ge
Num
ber of contacts
Source: Vanguard, 2019.
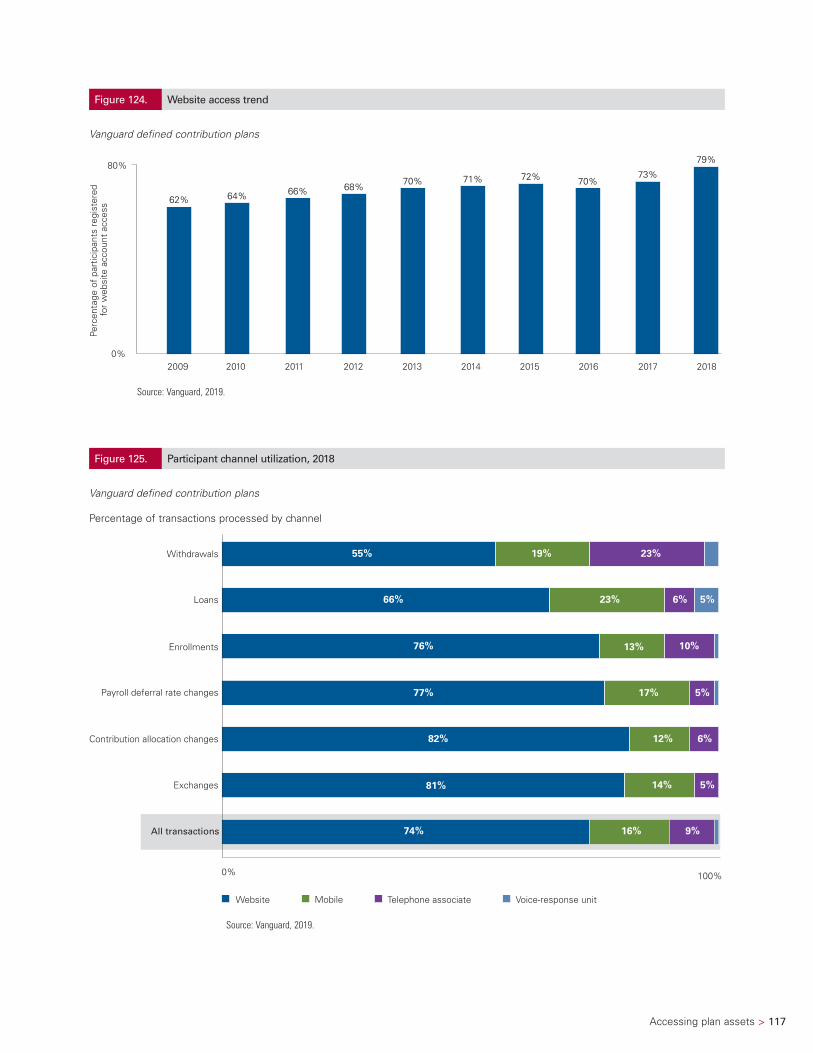
Accessing plan assets > 117
Figure 125. Participant channel utilization, 2018
Vanguard defined contribution plans
Percentage of transactions processed by channel
3%
Telephone associateMobileWebsite
All transactions
0% 100%
Exchanges
Contribution allocation changes
Payroll deferral rate changes
Enrollments
Loans
Withdrawals
Voice-response unit
74% 16% 9%
81%
82% 12%
77% 5%17%
76% 10%
66% 23%
13%
6% 5%
55% 23%19%
6%
14% 5%
Source: Vanguard, 2019.
Figure 124. Website access trend
Vanguard defined contribution plans
Perc
enta
ge o
f pa
rtic
ipan
ts r
egis
tere
d fo
r w
ebsi
te a
ccou
nt a
cces
s
20172009 2011 2012 20142013 2015 20162010
80%
0%2018
62% 64% 66% 68%70% 71% 72% 73%
70%
79%
Source: Vanguard, 2019.
Methodology > 118
Methodology
The Vanguard data included in this report is drawn from several sources.
Defined contribution clients. This universe consists of about 1,900 qualified plans, 1,500 clients, and 5 million participants for which Vanguard directly provides recordkeeping services. About 9 in 10 of these plans have a 401(k) or 403(b) employee-contributory feature; the other 1 in 10 is an employer-contributory DC plan, such as a profit-sharing or money purchase plan, in which investments are directed by participants. Unless otherwise noted, all references to “Vanguard” are to this universe, and all data is as of December 31, 2018.
Vanguard participation and deferral rates. Data on participation and deferral rates is drawn from a subset of Vanguard recordkeeping clients for whom we perform nondiscrimination testing. Selected plan design features are also derived from this data. For the 2018 analysis, the subset is composed of plans that complete their testing by March and represents approximately one-third of the clients for whom we perform testing. Plans that complete their testing by March generally have lower participation rates and generally include plans with concerns related to passing testing. When all plans have completed their testing by the end of 2019, the participation rates improve. Plan design features derived from this data also improve.
Based on the trends experienced over the prior three years, we have estimated participation and deferral rates for 2018. The estimations use a combination of linear extrapolation and subjective estimation. The same approach is applied to plan design features derived from this data. We will continue to restate these results in the following year based on the final compliance testing results.
The 2017 restated analysis includes approximately 1,000 plans and 2.2 million participants and eligible nonparticipants. Almost all of these plans are 401(k) or paired 401(k)/profit-sharing plans. Income data used in participation and deferral rate analyses also come from this subset of plans.
How America Saves: Small business edition
We also make available How America Saves: Small business edition which is a benchmarking analysis for the small business plans for which we provide service. Launched in 2011, the Vanguard Retirement Plan Access™ offer is a comprehensive service for retirement plans with up to $20-plus million in assets. Ascensus, LLC.—a nationally recognized recordkeeping firm—provides the administration of these plans on Vanguard’s behalf. Through VRPA, we served an additional 11,300 plan sponsors with more than 480,000 participants as of year-end 2018.
Industry benchmark data supplements to How America Saves
Industry benchmark data supplements to How America Saves are available for the following sectors:
• Ambulatory health care services
• Engineering
• Finance and insurance
• Information firms
• Legal services
• Manufacturing
• Mining, oil, and gas extraction
• Technology
If the sector you are interested in is not available at this time, please contact your sales executive or relationship manager.

Acknowledgments
We extend our thanks to the following Vanguard crew members who made this publication possible:
Data analysisJeffrey W. ClarkDaniel C. ProctorGalina Young
AuthorsStephen P. UtkusJean A. Young
Vanguard Institutional Investor Group
P.O. Box 2900 Valley Forge, PA 19482-2900
© 2019 The Vanguard Group, Inc. All rights reserved. Vanguard Marketing Corporation, Distributor of the Vanguard Funds.
HAS19 062019
The Vanguard Group has partnered with Financial Engines Advisors LLC to provide subadvisory services to the Vanguard Managed Account Program and Personal Online Advisor. Financial Engines Advisors LLC is an independent, federally registered investment advisor that does not sell investments or receive commission for the investments it recommends. Advice is provided by Vanguard Advisers, Inc. (VAI), a federally registered investment advisor and an affiliate of The Vanguard Group, Inc. (Vanguard). Eligibility restrictions may apply. Neither Vanguard, Financial Engines, nor their respective affiliates guarantee future results.
Vanguard Financial Planning Services are provided by Vanguard Advisers, Inc., a registered investment advisor.
For more information about Vanguard funds, visit institutional.vanguard.com or call 800-523-1036 to obtain a prospectus or, if available, a summary prospectus. Investment objectives, risks, charges, expenses, and other important information about a fund are contained in the prospectus; read and consider it carefully before investing.
All investing is subject to risk, including the possible loss of the money you invest. Be aware that fluctuations in the financial markets and other factors may cause declines in the value of your account. There is no guarantee that any particular asset allocation or mix of funds will meet your investment objectives or provide you with a given level of income.
Diversification does not ensure a profit or protect against a loss.
Connect with Vanguard® > institutional.vanguard.com > global.vanguard.com (non-U.S. investors)