Embed Size (px)
Citation preview

Vancouver EA2015 Bargaining Survey
Results
April 23, 2015Bethany Gordon, WEA Research1

Overview
• Vancouver EA survey administration• About the Respondents• Results for All Respondents• Open Comments
2

Vancouver EA Survey Administration
3
• Online survey administered in late March – April 2015
• 674 respondents, about 50% of membership
• WEA Research likes to see at least a 50% response rate.

About the Respondents
4

Almost 2/3 (65%) of respondents have the primary work assignment of general education classroom teacher.
5
About the Respondents
Work Assignment (Q12, page 4 of statistics)
Genera
l...
Teach
ing..
.
Speci
al ..
.
Educa
tio..
.
Nurs
e/s
o..
.
Sch
ool c.
..
OT/P
T/S
...
Oth
er
(22)0%
10%
20%
30%
40%
50%
60%
70%
80%
65%
12% 9%3% 1%
5% 2% 3%
Numbers in parentheses indicate
how many respondents chose
that option.

60% of respondents have worked in VSD for 9+ years.
6
About the Respondents
Years in VSD (Q13, page 5 of statistics)
Less than 3 years (115)
3 - 5 years (62)
6 - 8 years (77)
9 - 14 years (152)
15 - 20 years (120)
More than 20 years
(127)
0%
10%
20%
30%
40%
50%
18%
9%12%
23%18% 19%
60%

The most common subject taught by respondents is elementary education.
7
About the Respondents
Subject(s) Taught Majority of the Time, could select more than one
(Q14, page 6 of statistics)
Ele
m e
d
Ma
th
En
glis
h/la
ng
u..
.
Sp
eci
al e
d
So
cia
l st
ud
ies
Sci
en
ce
N/A
Re
ad
ing
CT
E
PE
/he
alt
h
Oth
er
Art
Wo
rld
la
ng
u..
.
Lib
rary
Mu
sic
ELL
Pe
rfo
rmin
g a
rts
0
50
100
150
200
250219
80 7656 56 47 46 41 39 33 29 18 17 14 14 12 10N
um
ber
of
Resp
on
den
ts

Almost half (49%) of respondents work at the elementary level.
8
About the Respondents
Grade Level (Q15, page 7 of statistics)
Elementary (313) Middle school (126)
High school (189) Other or equally divided (15)-10%
0%
10%
20%
30%
40%
50%
60%
49%
20%
29%
2%

Respondents were from various buildings.
9
About the Respondents
Building Worked the Majority of the Time (Q16, pages 8-9 of statistics)
Skyvie
w H
S
Co
lum
bia
Riv
...
Dis
cove
ry M
S
Wa
lnu
t G
rov..
.
An
de
rso
n E
S
Min
ne
ha
ha
ES
Jaso
n L
ee
MS
TJM
S
Tru
ma
n E
S
McL
ou
gh
lin M
S
Ch
ino
ok E
S
Ha
rne
y E
S
Oth
er
Ha
zel D
ell
ES
Lin
coln
ES
Fra
nklin
ES
Va
nc
Ho
me
Co
...
iTe
ch H
igh
iTe
ch M
idd
le
Fir
Gro
ve
0
10
20
30
40
50
6055
3733
3127
2424232222212019171716161616151414
121212111010 9 9 8 7 7 6 63 2 2 1 1
6-9 respon-dents = er-ratic means Too few
to do break-outs
Nu
mb
er
of
Resp
on
den
ts

Results for All Respondents
10

Importance To Improve Items 1-8
• All importance to improve items had the same 4-point scale:o Very important = 4 o Somewhat important = 3o Somewhat unimportant = 2 o Very unimportant = 1o Choosing ‘don’t know or not sure,’ ‘not applicable’ or skipping
the question isn’t given a value.
• The scale mean (“average” importance to improve) is 2.50.
• Means* of 2.50 or higher indicate a higher importance to improve level for all respondents.
o Green bar = mean of 2.50 – 2.99o Blue bar = mean of 3.00 or higher
• Means lower than 2.50 indicate a lower importance to improve level for all respondents.
o Yellow bar = mean of 2.01 – 2.49o Orange bar = mean of 2.00 or lower
* The calculated mean for each item is the weighted average and excludes those who selected ‘don’t know or not sure,’ ‘not applicable’ or who skipped the item. 11

2 of the 8 Importance To Improve Items Had a Mean Above 3.00 Importance To Improve Items 1-8 in Rank Order by Mean, page 10 of statistics
7. Improve your personal physical safety
3. Improve the instructional enrichment materials available
8. Improve your building's student discipline procedures
2. Improve (lower) the number of school-related meetings
5. Improve the extent to which administrators and staff in your building share decision-making
6. Improve the relevance of district in-services/staff development
4. Improve (lower) your class size(s)/caseload
1. Improve your total pay level
1.00 1.50 2.00 2.50 3.00 3.50 4.00
2.44
2.85
2.88
2.91
2.95
2.97
3.49
3.73
12Questions truncated for the purpose of this
chart.
Scale Mean = 2.50Very unimportant Very
important

Uncompensated Hours Beyond Normal Work Week
13
0 - 5 hours (138)
6 - 10 hours (240)
11 - 15 hours (147)
16 - 20 hours (76)
More than 20 hours (66)
0%
10%
20%
30%
40%
50%
21%
36%
22%
11% 10%
79%
How many uncompensated hours do you spend, on average, on school-related activities? (Q9, page 2)
79% of respondents spend 6 or more uncompensated hours per week, on average, on school-related activities.

Professional Educator
14
Very
impo
rtant
(519
)
Som
ewha
t im
porta
nt (1
27)
Som
ewha
t unim
porta
nt (1
2)
Very
unim
porta
nt (6
)
Don't
know
or n
ot sur
e (2
)
Not a
pplic
able (1
)0%
20%40%60%80%
100%78%
19%2% 1% 0% 0%
97%
How important is it to you to feel valued as a professional educator by the administration? (Q10, page 2)
97% of respondents think it is important (78% very important / 19% somewhat important) to feel valued as a professional educator by the administration.
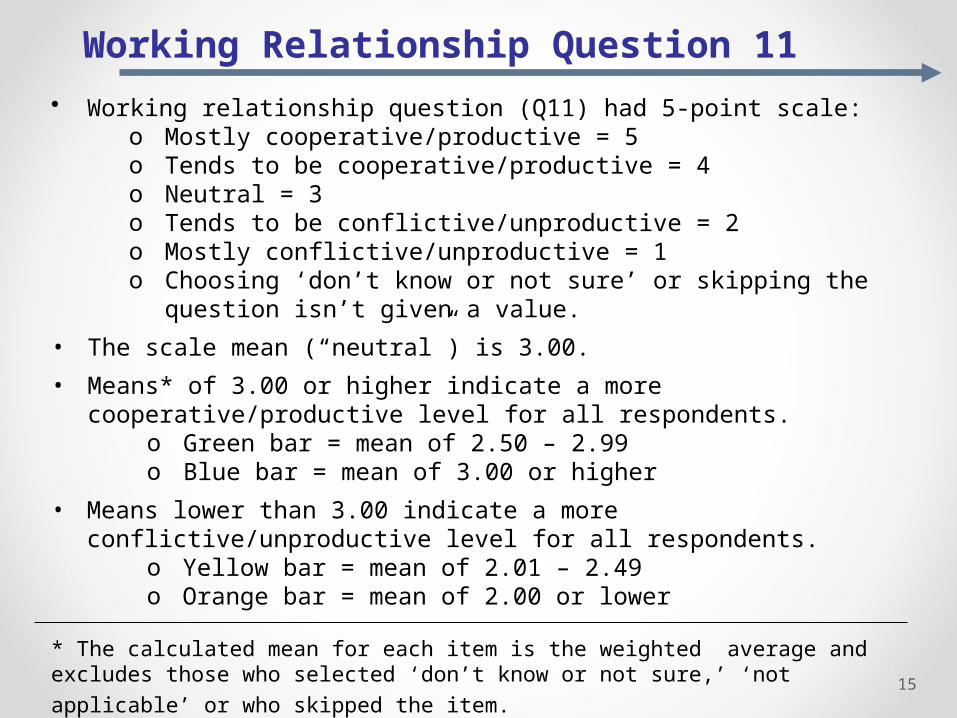
Working Relationship Question 11
• Working relationship question (Q11) had 5-point scale:o Mostly cooperative/productive = 5o Tends to be cooperative/productive = 4 o Neutral = 3o Tends to be conflictive/unproductive = 2 o Mostly conflictive/unproductive = 1o Choosing ‘don’t know or not sure’ or skipping the question isn’t
given a value.
• The scale mean (“neutral”) is 3.00.
• Means* of 3.00 or higher indicate a more cooperative/productive level for all respondents.
o Green bar = mean of 2.50 – 2.99o Blue bar = mean of 3.00 or higher
• Means lower than 3.00 indicate a more conflictive/unproductive level for all respondents.
o Yellow bar = mean of 2.01 – 2.49o Orange bar = mean of 2.00 or lower
* The calculated mean for each item is the weighted average and excludes those who selected ‘don’t know or not sure,’ ‘not applicable’ or who skipped the item.
15

Working Relationship Mean Well Above Scale MeanQuestion 11 For All Respondents, page 11 of statistics
11. Working relationship between the staff and the principal in the school where you assigned the majority of
the time.
1.00 1.50 2.00 2.50 3.00 3.50 4.00 4.50 5.00
4.01
16Questions truncated for the purpose of this
chart.
Scale Mean = 3.00Mostly uncooperative Mostly
cooperative

Open Comments- Major Themes
17
• Time
• Compensation Issues
• Substitute Shortage
• TPEP Issues
• Respect/ Equity / Professionalism
• Other specific individual concerns (will be shared at Labor Management)

Communication With Members
18
• Members appreciated being asked their opinions.
• Members also appreciate knowing how their opinions will be used and the next steps.