Embed Size (px)
Citation preview
Chemical Geology 421 (2016) 17–25
Contents lists available at ScienceDirect
Chemical Geology
j ourna l homepage: www.e lsev ie r .com/ locate /chemgeo
Vanadium isotope measurement by MC-ICP-MS
Fei Wu, Yuhan Qi, Huimin Yu, Shengyu Tian, Zhenhui Hou, Fang Huang ⁎CAS Key Laboratory of Crust-Mantle Materials and Environments, School of Earth and Space Sciences, University of Science and Technology of China, Hefei 230026, Anhui, China
⁎ Corresponding author.E-mail address: [email protected] (F. Huang).
http://dx.doi.org/10.1016/j.chemgeo.2015.11.0270009-2541/© 2015 Published by Elsevier B.V.
a b s t r a c t
a r t i c l e i n f oArticle history:Received 5 September 2015Received in revised form 23 November 2015Accepted 26 November 2015Available online 26 November 2015
Wepresent amethod tomeasure vanadium (V) isotopic composition for terrestrial rocks in this study. Vanadiumwas efficiently separated from matrix elements by a chromatographic technique using cation- and anion-exchange resin columns, avoiding the expensive TRU Spec resin. Vanadium isotope ratios were measuredusing a Thermo Scientific Neptune Plus MC-ICP-MS employing a sample–standard bracketing method. The in-crease in instrument sensitivity significantly reduces the amount of V required for the isotope analysis. Potentialeffects of acidmolarities and concentrationmismatch on instrumental analyseswere rigorously evaluated. In ad-dition, we performed Cr- and Ti-doping experiments to ensure the precision and accuracy of V isotopemeasure-ment. The δ51V values of mono-elemental V standards (BDH and USTC-V) relative to an Alfa Aesar (AA) standardsolution (defined as δ51V = [(51 V/50 V)sample / (
51V/50V)AA − 1] × 1000) measured in our laboratory were−1.23± 0.08‰ (2 SD, n=197) and 0.07± 0.07‰ (2 SD, n=112), respectively. Analyses of synthetic standardsolutions (element doping + matrix spiking) obtained the same δ51V for the pure V solutions with a precisionbetter than ±0.1‰ (2 SD). Vanadium isotopic compositions of 12 reference materials, including igneous rocks(with mafic to felsic compositions) and manganese nodules, were measured using this method. These referencematerials including basalts: BCR-2,−0.78±0.08‰ (2 SD, n=36); BHVO-2,−0.83±0.09‰ (2 SD, n=22); BIR-1,−0.92 ± 0.09‰ (2 SD, n = 52); JB-2, −0.87 ± 0.06‰ (2 SD, n = 20); diabase: W-2,−0.94 ± 0.08‰ (2 SD,n = 15); andesites: AGV-1, −0.71 ± 0.10‰ (2 SD, n = 6); AGV-2, −0.70 ± 0.10‰ (2 SD, n = 37); JA-2,−0.80 ± 0.07‰ (2 SD, n = 15); quartz latite: QLO-1, −0.61 ± 0.03‰ (2 SD, n = 3); granodiorite: GSP-2,−0.62 ± 0.07‰ (2 SD, n = 26); and manganese nodules: NOD-P, −1.65 ± 0.06‰ (2 SD, n = 10); NOD-A,−0.99± 0.10‰ (2 SD, n=19). Based on repeated analyses of the rock standards, the long-term external preci-sion of our method is better than ±0.1‰ (2 SD) for δ51V. Such precision allows us to identify V isotope fraction-ation in high-temperature terrestrial samples, suggesting that V isotope geochemistry can be more widely usedto study magmatism as well as supergene processes.
© 2015 Published by Elsevier B.V.
Keywords:Vanadium isotopeChemical separationMC-ICP-MSGeological reference materials
1. Introduction
Vanadium (V) is a transition metal with multiple valence states(V5+, V4+, V3+, and V2+) in nature. The proportion of vanadium withdifferent valence states in the planetary basaltic melts and mantleperidotites is related to oxygen fugacity of the systems (e.g., Papikeet al., 2005). The chemical speciation and solubility of V in water arestrong functions of pH and Eh conditions (e.g., Baes and Mesmer,1976; Takeno, 2005; Zhou et al., 2011). Therefore, vanadium has beenwidely used to constrain variations of redox conditions during manygeological processes (Huang et al., 2015 and references therein). For ex-ample, vanadium concentrations of the bulk earth versus bulk silicateearth (BSE) have been used to understand the conditions of terrestrialaccretion and core formation (e.g., Siebert et al., 2013; Wood et al.,2008). Furthermore, vanadium concentrations and its ratios relative tosingle valent elements with similar compatibility in peridotites and
mantle-derived magma have been used as a proxy for redox conditionvariations of the mantle (e.g., Canil, 2002; Lee et al., 2005; Mallmannand O'Neill, 2009). Vanadium is significantly enriched in carbonaceousrocks or materials (up to 10,000 ppm) (Breit and Wanty, 1991), whichcan be used to trace marine oxidation state (e.g. Algeo and Maynard,2004;Morford and Emerson, 1999). In addition, vanadiumcan be signif-icantly enriched into crude oil, and the value of V / (V+Ni) is common-ly used to determine crude oil grade (e.g., Ventura et al., 2015, andreferences therein).
Vanadium has two stable isotopes (51V and 50V) with relative abun-dances of ~99.76% and ~0.24%, respectively (Shore et al., 2010). Theo-retical investigation and experimental studies have shown thatisotopes of multi-valence elements can be fractionated during redox re-actions (e.g., Anbar et al., 2005; Ellis et al., 2002; Schauble et al., 2004).Recently, first-principle calculations predicted that large V isotope frac-tionation could occur duringV transportation and segregation in naturalsolutions via redox reaction and adsorption processes (Wu et al., 2015).Thus, V isotopic compositions of terrestrial samplesmay also fingerprintredox-state variations in nature.
18 F. Wu et al. / Chemical Geology 421 (2016) 17–25
Vanadium isotopes were analyzed using thermal ionization massspectrometry (TIMS) in early studies (Balsiger et al., 1969; Balsigeret al., 1976; Pelly et al., 1970). Because of large uncertainty of V isotopesmeasurement (N1‰), no isotope difference between terrestrial mattersand meteoritic samples could be observed at that time. However, chro-matographic experiments have implied that V isotope fractionationwould occur at low temperature (Zhang et al., 2003a, 2003b).
Analytical development based on application ofMC-ICP-MS over thelast two decades has dramatically expanded the feasibility of high-precision stable isotope analyses in the periodic table. However, appli-cation of V isotope geochemistry is still in its infancy. Themain obstaclesto precise and accurate V isotopemeasurements byMC-ICP-MS include:(1) the double-spike method cannot be applied to correct the instru-ment fractionation of V isotopes because V only has two stable isotopes;(2) the high 51V⁄50V (~400) makes it difficult simultaneously to obtainstable signals for both 51V and 50V in MC-ICP-MS; (3) isobaric interfer-ences from 50Ti and 50Cr on theminor 50V isotope mean that the chem-istry has to separate those elements effectively; and (4) multi-atommolecular interferences (e.g., 36Ar14N+, 36Ar16O+, 38Ar14N+) could pro-duce erroneous isotope data.
Recently, highly precise and accurate V isotope data have been ob-tained with analysis precision better than ±0.15‰ (2 SD) (Nielsenet al., 2011; Prytulak et al., 2011). Vanadium isotopic datawere reportedin standard δ-notation in per mil relative to the AA V standard solution(Nielsen et al., 2011): δ51V = 1000 × [(51 V/50Vsample / 51V/50VAA)− 1].Studies onmantle xenoliths andmafic lavas gave an estimation of the Visotopic composition of the BSE, showing that V isotopes can be frac-tionated during high-temperature mantle-melting processes (Prytulaket al., 2013). Vanadium isotope measurements of meteorites indicatethat the silicate Earth is enriched in 51V by about 0.8‰ relative to chon-drites, likely reflecting the different irradiation history of the Solar Sys-tem (Nielsen et al., 2014). More recently, up to ~1.5‰ variation of δ51Vwas observed in crude oils, implying the potential application of V iso-tope to constraining the biogeochemical cycling of V and understandingthe formation and preservation of petroleum source rocks (Venturaet al., 2015).
Despite the development of V isotope measurement with MC-ICP-MS, a more efficient procedure for chemical separation of V is neededto explore V isotope variations in nature. Application of V isotope geo-chemistry to high-temperature processes requires to further improve-ment in the analytical precision. Furthermore, there is still a lack ofadequate V isotope data of referencematerials for inter-lab comparison.
In this study, we present a method tomeasure V isotopes usingMC-ICP-MS by the sample-standard bracketing technique. A chemical pro-cedure of V purification modified after Nielsen et al. (2011) improvesthe time efficiency and eliminates the use of expensive TRU Specresin. The increase in instrument sensitivity greatly reduces the abun-dance requirement of V for isotope analysis. We measured V isotopiccompositions of 12 reference materials rock standards including 10 ig-neous rock standards from the United States Geological Survey (USGS)and the Geological Survey of Japan (GSJ) and two manganese nodulestandards from the USGS. The reference values for these geological ref-erence materials are helpful for future inter-lab calibration and dataquality control. Based on replicated analyses of solution standards androck standards, our long-term external reproducibility for δ51V is betterthan ±0.1‰ (2 SD).
2. Analytical methods
2.1. Sample dissolution
Chemistry purification was carried out in a class 1000 clean labora-tory equippedwith class 100 laminarflowexhaust hood. All concentrat-ed high-purity acids (HCl, HNO3 and HF) were made through doublesub-boiling distillation of the trace grade acids from Thermo Fisher Sci-entific. Hydrogen peroxide (30% v/v, ultrapure, AUECC) and ultrapure
water (18.2MΩ·cm)were used during the experiment. Vanadium con-centrations in the analyzed reference materials vary from ~50 to~800 ppm. 20–100 mg samples were weighed to contain 5–10 μg Vfor isotopic analysis. The igneous rock standards were digested in a3:1 (v/v) mixture of concentrated HF and HNO3 in Savillex screw-topbeakers by heating at 140 °C on a hotplate for about 3–4 days. Afterevaporation to dryness, samples were treated with aqua regia,6 mol L−1 HCl, and 8 mol L−1 HNO3 in sequence and dried to removeany remaining fluorides. For manganese nodules/crusts, samples werefirst treated with aqua regia in Savillex screw-top beakers by heatingat 120 °C on a hotplate for about two days. After evaporation to dryness,sampleswere dissolvedwith a 3:1 (v/v)mixture of concentratedHF andHNO3 to digest the remaining oxide and silicate phases. Then, aqua regiaand 8mol L−1 HNO3were used to ensure that samples were totally dis-solved. The final material was dissolved in 1 mL of 1 mol L−1 HNO3 forion-exchange separation.
2.2. Ion-exchange chromatography
In this study, chemical separation of V was achieved in a multi-stepion-exchange procedure by coupling cation- and anion-exchange col-umns (Table 1).
2.2.1. Cation resin procedureVanadium purification was first performed in a pre-cleaned Bio-Rad
Poly-Prep chromatography column (9 cm high and 2 mL bed volume)loaded with 2 mL of Bio-Rad AG50W-X12 (200–400 mesh) cationresin. Fig. 1 shows the elution curves for our V purification procedures.The cation-exchange resin column was used to remove Fe, Ti, andsome major matrix elements (e.g., Al, Ca, Mn, and Cr). Before loadingthe resin into the columns, it was cleaned by rinsing and shaking with6 mol L−1 HCl and H2O alternately for more than twice, and then1mol L−1 HNO3 andH2O alternately at least twice. In addition, the load-ed cation resinwas cleanedwith 20mL 6mol L−1 HCl and 10mLH2O insequence, and then conditioned with 3 mL 1 mol L−1 HNO3 twice priorto any use. The sample solutionwith 5–10 μg V in 1mL 1mol L−1 HNO3
was then loaded on the conditioned cation-exchange column. 4 mL of1 mol L−1 HNO3 + 0.1 mol L−1 HF and 1 mL 1.2 N HNO3 were used toelute Ti and Al. Vanadium was then collected with 19 mL 1.2 mol L−1
HNO3. After this step, most matrix elements (e.g., Fe, Ca, most Mn, andCr) were still retained on the columnwhile V was quantitatively eluted.In general, such a cation-exchange procedure was run twice to ensurethat Fe and Ti were totally removed.
Elution curves can shift with variations in the amount of target ele-ment loaded to the column (e.g., An et al., 2014). To achieve a 100% re-covery rate of V for different type of samples, it is necessary to test if Velution curves drift with various loading sizes. As shown in Fig. 2, al-though elution curves of V shift with different amounts of V, 100% re-covery rate of V could be achieved if no more than 10 μg V was loadedto the column. Besides, for each sample the aliquots before and afterthe “V-cut”were collected to monitor V leakage during the chromatog-raphy process. After such a cation-exchange procedure, the sample wasevaporated to dryness and dissolved in 1mL dilute HCl (b0.01mol L−1;pH 2–3). Because K, Na andMg are themainmatrix elements remainingafter the cation-exchange procedures, it is easy to dissolve the samplecompletely in dilute HCl (b0.01 mol L−1; pH 2–3), avoiding the some-what time-consuming operation described by Prytulak et al. (2011).This step is important for the next anion-exchange step, which sepa-rates V from most other matrix elements.
2.2.2. Anion resin procedureFurther purification of V was achieved through anion-exchange col-
umns. The procedurewasmodified after Nielsen et al. (2011) to removeresidual matrix compounds (such as K, Na, Mg, and trace Cr). A pre-cleaned Bio-Rad Poly-Prep chromatography column (9 cm high and2 mL bed volume) was filled with 1.4 mL of Bio-Rad AG1-X8
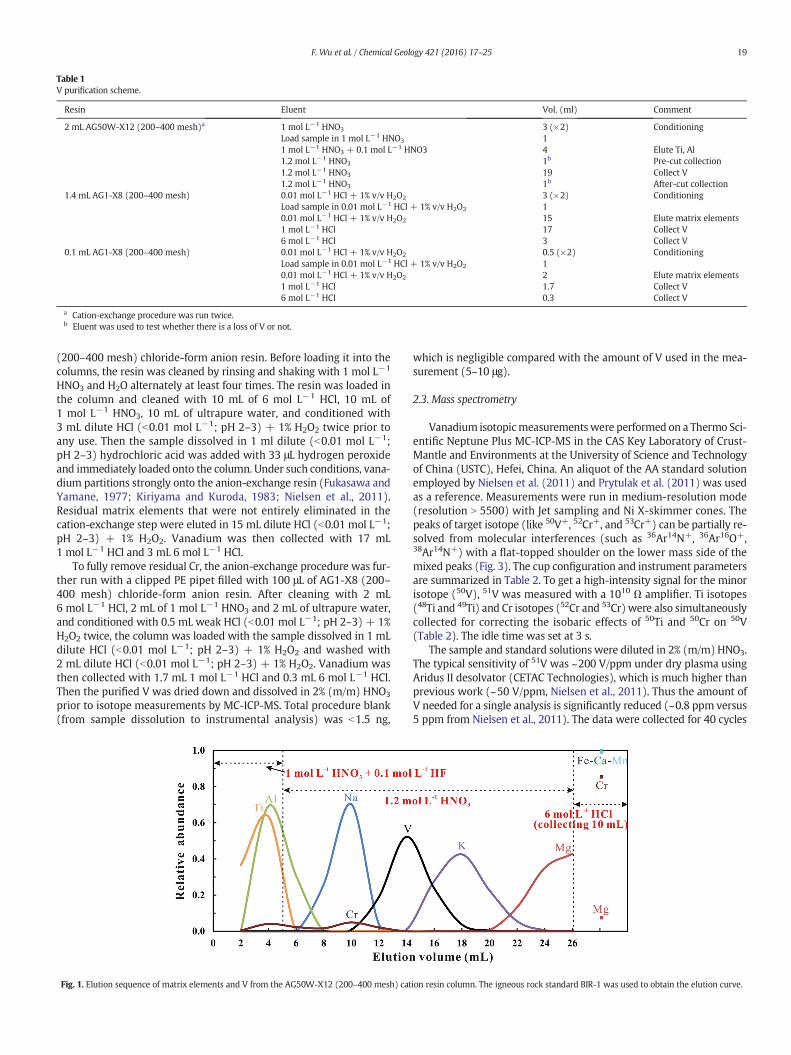
Table 1V purification scheme.
Resin Eluent Vol. (ml) Comment
2 mL AG50W-X12 (200–400 mesh)a 1 mol L−1 HNO3 3 (×2) ConditioningLoad sample in 1 mol L−1 HNO3 11 mol L−1 HNO3 + 0.1 mol L−1 HNO3 4 Elute Ti, Al1.2 mol L−1 HNO3 1b Pre-cut collection1.2 mol L−1 HNO3 19 Collect V1.2 mol L−1 HNO3 1b After-cut collection
1.4 mL AG1-X8 (200–400 mesh) 0.01 mol L−1 HCl + 1% v/v H2O2 3 (×2) ConditioningLoad sample in 0.01 mol L−1 HCl + 1% v/v H2O2 10.01 mol L−1 HCl + 1% v/v H2O2 15 Elute matrix elements1 mol L−1 HCl 17 Collect V6 mol L−1 HCl 3 Collect V
0.1 mL AG1-X8 (200–400 mesh) 0.01 mol L−1 HCl + 1% v/v H2O2 0.5 (×2) ConditioningLoad sample in 0.01 mol L−1 HCl + 1% v/v H2O2 10.01 mol L−1 HCl + 1% v/v H2O2 2 Elute matrix elements1 mol L−1 HCl 1.7 Collect V6 mol L−1 HCl 0.3 Collect V
a Cation-exchange procedure was run twice.b Eluent was used to test whether there is a loss of V or not.
19F. Wu et al. / Chemical Geology 421 (2016) 17–25
(200–400 mesh) chloride-form anion resin. Before loading it into thecolumns, the resin was cleaned by rinsing and shaking with 1 mol L−1
HNO3 and H2O alternately at least four times. The resin was loaded inthe column and cleaned with 10 mL of 6 mol L−1 HCl, 10 mL of1 mol L−1 HNO3, 10 mL of ultrapure water, and conditioned with3 mL dilute HCl (b0.01 mol L−1; pH 2–3) + 1% H2O2 twice prior toany use. Then the sample dissolved in 1 ml dilute (b0.01 mol L−1;pH 2–3) hydrochloric acid was added with 33 μL hydrogen peroxideand immediately loaded onto the column. Under such conditions, vana-dium partitions strongly onto the anion-exchange resin (Fukasawa andYamane, 1977; Kiriyama and Kuroda, 1983; Nielsen et al., 2011).Residual matrix elements that were not entirely eliminated in thecation-exchange step were eluted in 15 mL dilute HCl (b0.01 mol L−1;pH 2–3) + 1% H2O2. Vanadium was then collected with 17 mL1 mol L−1 HCl and 3 mL 6 mol L−1 HCl.
To fully remove residual Cr, the anion-exchange procedure was fur-ther run with a clipped PE pipet filled with 100 μL of AG1-X8 (200–400 mesh) chloride-form anion resin. After cleaning with 2 mL6 mol L−1 HCl, 2 mL of 1 mol L−1 HNO3 and 2 mL of ultrapure water,and conditioned with 0.5 mL weak HCl (b0.01 mol L−1; pH 2–3) + 1%H2O2 twice, the column was loaded with the sample dissolved in 1 mLdilute HCl (b0.01 mol L−1; pH 2–3) + 1% H2O2 and washed with2 mL dilute HCl (b0.01 mol L−1; pH 2–3) + 1% H2O2. Vanadium wasthen collected with 1.7 mL 1 mol L−1 HCl and 0.3 mL 6 mol L−1 HCl.Then the purified V was dried down and dissolved in 2% (m/m) HNO3
prior to isotope measurements by MC-ICP-MS. Total procedure blank(from sample dissolution to instrumental analysis) was b1.5 ng,
Fig. 1. Elution sequence of matrix elements and V from the AG50W-X12 (200–400 mesh) cat
which is negligible compared with the amount of V used in the mea-surement (5–10 μg).
2.3. Mass spectrometry
Vanadium isotopicmeasurementswere performed on a Thermo Sci-entific Neptune Plus MC-ICP-MS in the CAS Key Laboratory of Crust-Mantle and Environments at the University of Science and Technologyof China (USTC), Hefei, China. An aliquot of the AA standard solutionemployed by Nielsen et al. (2011) and Prytulak et al. (2011) was usedas a reference. Measurements were run in medium-resolution mode(resolution N 5500) with Jet sampling and Ni X-skimmer cones. Thepeaks of target isotope (like 50V+, 52Cr+, and 53Cr+) can be partially re-solved from molecular interferences (such as 36Ar14N+, 36Ar16O+,38Ar14N+) with a flat-topped shoulder on the lower mass side of themixed peaks (Fig. 3). The cup configuration and instrument parametersare summarized in Table 2. To get a high-intensity signal for the minorisotope (50V), 51V was measured with a 1010 Ω amplifier. Ti isotopes(48Ti and 49Ti) and Cr isotopes (52Cr and 53Cr) were also simultaneouslycollected for correcting the isobaric effects of 50Ti and 50Cr on 50V(Table 2). The idle time was set at 3 s.
The sample and standard solutions were diluted in 2% (m/m) HNO3.The typical sensitivity of 51V was ~200 V/ppm under dry plasma usingAridus II desolvator (CETAC Technologies), which is much higher thanprevious work (~50 V/ppm, Nielsen et al., 2011). Thus the amount ofV needed for a single analysis is significantly reduced (~0.8 ppm versus5 ppm from Nielsen et al., 2011). The data were collected for 40 cycles
ion resin column. The igneous rock standard BIR-1 was used to obtain the elution curve.
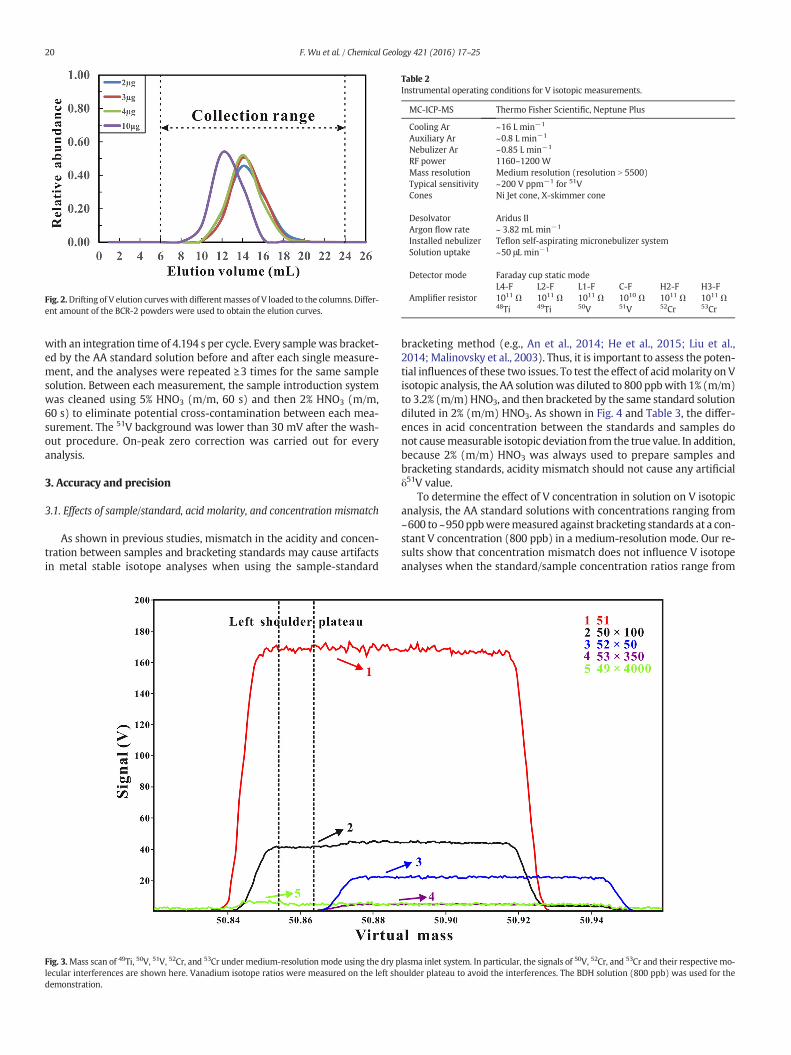
Fig. 2.Drifting of V elution curveswith differentmasses of V loaded to the columns. Differ-ent amount of the BCR-2 powders were used to obtain the elution curves.
Table 2Instrumental operating conditions for V isotopic measurements.
MC-ICP-MS Thermo Fisher Scientific, Neptune Plus
Cooling Ar ~16 L min−1
Auxiliary Ar ~0.8 L min−1
Nebulizer Ar ~0.85 L min−1
RF power 1160–1200 WMass resolution Medium resolution (resolution N 5500)Typical sensitivity ~200 V ppm−1 for 51VCones Ni Jet cone, X-skimmer cone
Desolvator Aridus IIArgon flow rate ~ 3.82 mL min−1
Installed nebulizer Teflon self-aspirating micronebulizer systemSolution uptake ~50 μL min−1
Detector mode Faraday cup static modeL4-F L2-F L1-F C-F H2-F H3-F
Amplifier resistor 1011 Ω 1011 Ω 1011 Ω 1010 Ω 1011 Ω 1011 Ω48Ti 49Ti 50V 51V 52Cr 53Cr
20 F. Wu et al. / Chemical Geology 421 (2016) 17–25
with an integration time of 4.194 s per cycle. Every sample was bracket-ed by the AA standard solution before and after each single measure-ment, and the analyses were repeated ≥3 times for the same samplesolution. Between each measurement, the sample introduction systemwas cleaned using 5% HNO3 (m/m, 60 s) and then 2% HNO3 (m/m,60 s) to eliminate potential cross-contamination between each mea-surement. The 51V background was lower than 30 mV after the wash-out procedure. On-peak zero correction was carried out for everyanalysis.
3. Accuracy and precision
3.1. Effects of sample/standard, acid molarity, and concentration mismatch
As shown in previous studies, mismatch in the acidity and concen-tration between samples and bracketing standards may cause artifactsin metal stable isotope analyses when using the sample-standard
Fig. 3.Mass scan of 49Ti, 50V, 51V, 52Cr, and 53Cr under medium-resolution mode using the dry plecular interferences are shown here. Vanadium isotope ratios were measured on the left shdemonstration.
bracketing method (e.g., An et al., 2014; He et al., 2015; Liu et al.,2014; Malinovsky et al., 2003). Thus, it is important to assess the poten-tial influences of these two issues. To test the effect of acidmolarity on Visotopic analysis, the AA solutionwas diluted to 800 ppbwith 1% (m/m)to 3.2% (m/m)HNO3, and then bracketed by the same standard solutiondiluted in 2% (m/m) HNO3. As shown in Fig. 4 and Table 3, the differ-ences in acid concentration between the standards and samples donot causemeasurable isotopic deviation from the true value. In addition,because 2% (m/m) HNO3 was always used to prepare samples andbracketing standards, acidity mismatch should not cause any artificialδ51V value.
To determine the effect of V concentration in solution on V isotopicanalysis, the AA standard solutions with concentrations ranging from~600 to ~950ppbweremeasured against bracketing standards at a con-stant V concentration (800 ppb) in a medium-resolution mode. Our re-sults show that concentration mismatch does not influence V isotopeanalyses when the standard/sample concentration ratios range from
lasma inlet system. In particular, the signals of 50V, 52Cr, and 53Cr and their respective mo-oulder plateau to avoid the interferences. The BDH solution (800 ppb) was used for the
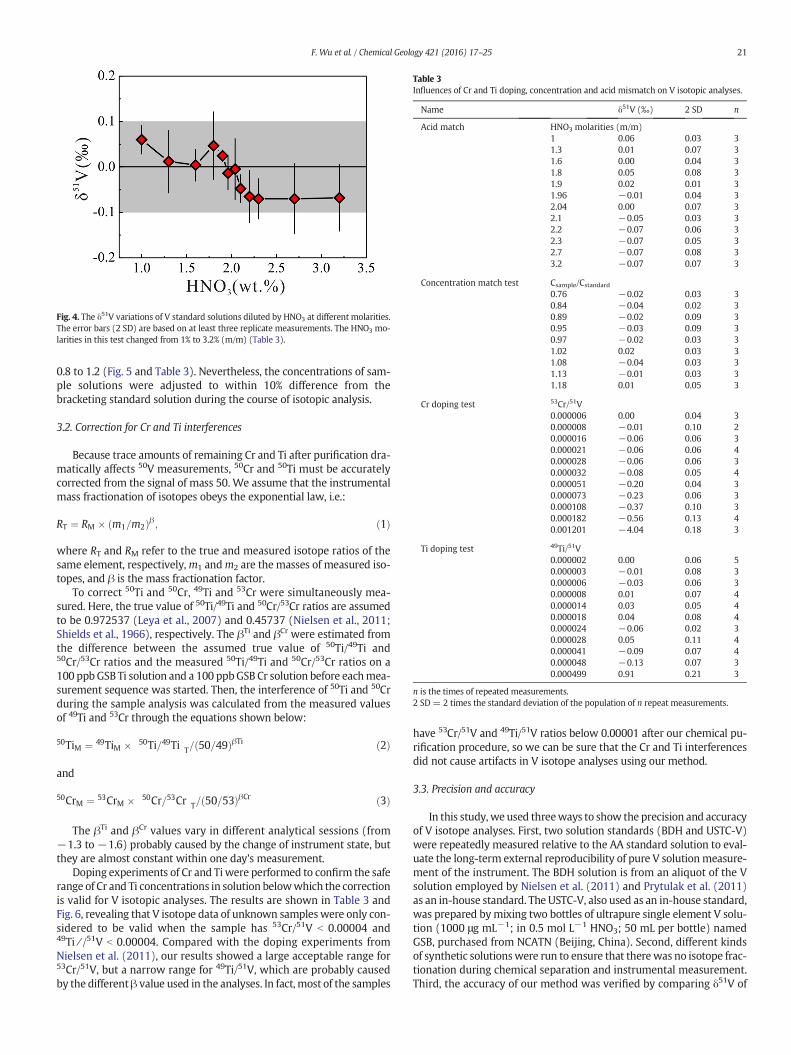
Fig. 4. The δ51V variations of V standard solutions diluted by HNO3 at different molarities.The error bars (2 SD) are based on at least three replicate measurements. The HNO3 mo-larities in this test changed from 1% to 3.2% (m/m) (Table 3).
Table 3Influences of Cr and Ti doping, concentration and acid mismatch on V isotopic analyses.
Name δ51V (‰) 2 SD n
Acid match HNO3 molarities (m/m)1 0.06 0.03 31.3 0.01 0.07 31.6 0.00 0.04 31.8 0.05 0.08 31.9 0.02 0.01 31.96 −0.01 0.04 32.04 0.00 0.07 32.1 −0.05 0.03 32.2 −0.07 0.06 32.3 −0.07 0.05 32.7 −0.07 0.08 33.2 −0.07 0.07 3
Concentration match test Csample/Cstandard
0.76 −0.02 0.03 30.84 −0.04 0.02 30.89 −0.02 0.09 30.95 −0.03 0.09 30.97 −0.02 0.03 31.02 0.02 0.03 31.08 −0.04 0.03 31.13 −0.01 0.03 31.18 0.01 0.05 3
Cr doping test 53Cr/51V0.000006 0.00 0.04 30.000008 −0.01 0.10 20.000016 −0.06 0.06 30.000021 −0.06 0.06 40.000028 −0.06 0.06 30.000032 −0.08 0.05 40.000051 −0.20 0.04 30.000073 −0.23 0.06 30.000108 −0.37 0.10 30.000182 −0.56 0.13 40.001201 −4.04 0.18 3
Ti doping test 49Ti/51V0.000002 0.00 0.06 50.000003 −0.01 0.08 30.000006 −0.03 0.06 30.000008 0.01 0.07 40.000014 0.03 0.05 40.000018 0.04 0.08 40.000024 −0.06 0.02 30.000028 0.05 0.11 40.000041 −0.09 0.07 40.000048 −0.13 0.07 30.000499 0.91 0.21 3
n is the times of repeated measurements.2 SD= 2 times the standard deviation of the population of n repeat measurements.
21F. Wu et al. / Chemical Geology 421 (2016) 17–25
0.8 to 1.2 (Fig. 5 and Table 3). Nevertheless, the concentrations of sam-ple solutions were adjusted to within 10% difference from thebracketing standard solution during the course of isotopic analysis.
3.2. Correction for Cr and Ti interferences
Because trace amounts of remaining Cr and Ti after purification dra-matically affects 50V measurements, 50Cr and 50Ti must be accuratelycorrected from the signal of mass 50. We assume that the instrumentalmass fractionation of isotopes obeys the exponential law, i.e.:
RT ¼ RM � m1=m2ð Þβ ; ð1Þ
where RT and RM refer to the true and measured isotope ratios of thesame element, respectively,m1 andm2 are themasses of measured iso-topes, and β is the mass fractionation factor.
To correct 50Ti and 50Cr, 49Ti and 53Cr were simultaneously mea-sured. Here, the true value of 50Ti/49Ti and 50Cr/53Cr ratios are assumedto be 0.972537 (Leya et al., 2007) and 0.45737 (Nielsen et al., 2011;Shields et al., 1966), respectively. The βTi and βCr were estimated fromthe difference between the assumed true value of 50Ti/49Ti and50Cr/53Cr ratios and the measured 50Ti/49Ti and 50Cr/53Cr ratios on a100 ppbGSB Ti solution and a 100 ppbGSB Cr solution before eachmea-surement sequence was started. Then, the interference of 50Ti and 50Crduring the sample analysis was calculated from the measured valuesof 49Ti and 53Cr through the equations shown below:
50TiM ¼ 49TiM � 50Ti=49Ti� �
T= 50=49ð ÞβTi ð2Þ
and
50CrM ¼ 53CrM � 50Cr=53Cr� �
T= 50=53ð ÞβCr ð3Þ
The βTi and βCr values vary in different analytical sessions (from−1.3 to −1.6) probably caused by the change of instrument state, butthey are almost constant within one day's measurement.
Doping experiments of Cr and Tiwere performed to confirm the saferange of Cr and Ti concentrations in solution belowwhich the correctionis valid for V isotopic analyses. The results are shown in Table 3 andFig. 6, revealing that V isotope data of unknown sampleswere only con-sidered to be valid when the sample has 53Cr/51V b 0.00004 and49Ti⁄/51V b 0.00004. Compared with the doping experiments fromNielsen et al. (2011), our results showed a large acceptable range for53Cr/51V, but a narrow range for 49Ti/51V, which are probably causedby the differentβ value used in the analyses. In fact, most of the samples
have 53Cr/51V and 49Ti/51V ratios below 0.00001 after our chemical pu-rification procedure, so we can be sure that the Cr and Ti interferencesdid not cause artifacts in V isotope analyses using our method.
3.3. Precision and accuracy
In this study, we used threeways to show the precision and accuracyof V isotope analyses. First, two solution standards (BDH and USTC-V)were repeatedly measured relative to the AA standard solution to eval-uate the long-term external reproducibility of pure V solutionmeasure-ment of the instrument. The BDH solution is from an aliquot of the Vsolution employed by Nielsen et al. (2011) and Prytulak et al. (2011)as an in-house standard. The USTC-V, also used as an in-house standard,was prepared bymixing two bottles of ultrapure single element V solu-tion (1000 μg mL−1; in 0.5 mol L−1 HNO3; 50 mL per bottle) namedGSB, purchased from NCATN (Beijing, China). Second, different kindsof synthetic solutionswere run to ensure that therewas no isotope frac-tionation during chemical separation and instrumental measurement.Third, the accuracy of our method was verified by comparing δ51V of
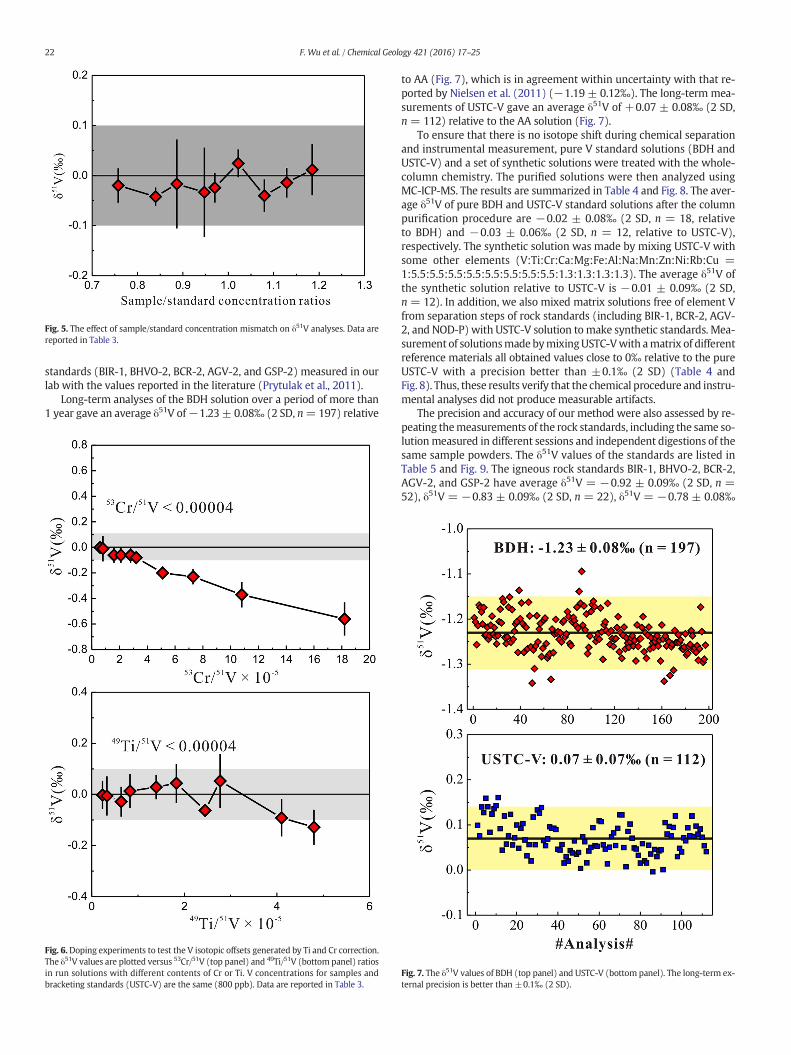
Fig. 5. The effect of sample/standard concentration mismatch on δ51V analyses. Data arereported in Table 3.
22 F. Wu et al. / Chemical Geology 421 (2016) 17–25
standards (BIR-1, BHVO-2, BCR-2, AGV-2, and GSP-2) measured in ourlab with the values reported in the literature (Prytulak et al., 2011).
Long-term analyses of the BDH solution over a period of more than1 year gave an average δ51V of−1.23 ± 0.08‰ (2 SD, n=197) relative
Fig. 6.Doping experiments to test the V isotopic offsets generated by Ti and Cr correction.The δ51V values are plotted versus 53Cr/51V (top panel) and 49Ti/51V (bottom panel) ratiosin run solutions with different contents of Cr or Ti. V concentrations for samples andbracketing standards (USTC-V) are the same (800 ppb). Data are reported in Table 3.
to AA (Fig. 7), which is in agreement within uncertainty with that re-ported by Nielsen et al. (2011) (−1.19 ± 0.12‰). The long-term mea-surements of USTC-V gave an average δ51V of +0.07 ± 0.08‰ (2 SD,n = 112) relative to the AA solution (Fig. 7).
To ensure that there is no isotope shift during chemical separationand instrumental measurement, pure V standard solutions (BDH andUSTC-V) and a set of synthetic solutions were treated with the whole-column chemistry. The purified solutions were then analyzed usingMC-ICP-MS. The results are summarized in Table 4 and Fig. 8. The aver-age δ51V of pure BDH and USTC-V standard solutions after the columnpurification procedure are −0.02 ± 0.08‰ (2 SD, n = 18, relativeto BDH) and −0.03 ± 0.06‰ (2 SD, n = 12, relative to USTC-V),respectively. The synthetic solution was made by mixing USTC-V withsome other elements (V:Ti:Cr:Ca:Mg:Fe:Al:Na:Mn:Zn:Ni:Rb:Cu =1:5.5:5.5:5.5:5.5:5.5:5.5:5.5:5.5:1.3:1.3:1.3:1.3). The average δ51V ofthe synthetic solution relative to USTC-V is −0.01 ± 0.09‰ (2 SD,n = 12). In addition, we also mixed matrix solutions free of element Vfrom separation steps of rock standards (including BIR-1, BCR-2, AGV-2, and NOD-P) with USTC-V solution tomake synthetic standards. Mea-surement of solutionsmade bymixingUSTC-Vwith amatrix of differentreference materials all obtained values close to 0‰ relative to the pureUSTC-V with a precision better than ±0.1‰ (2 SD) (Table 4 andFig. 8). Thus, these results verify that the chemical procedure and instru-mental analyses did not produce measurable artifacts.
The precision and accuracy of our method were also assessed by re-peating themeasurements of the rock standards, including the same so-lutionmeasured in different sessions and independent digestions of thesame sample powders. The δ51V values of the standards are listed inTable 5 and Fig. 9. The igneous rock standards BIR-1, BHVO-2, BCR-2,AGV-2, and GSP-2 have average δ51V = −0.92 ± 0.09‰ (2 SD, n =52), δ51V = −0.83 ± 0.09‰ (2 SD, n = 22), δ51V = −0.78 ± 0.08‰
Fig. 7. The δ51V values of BDH (top panel) and USTC-V (bottom panel). The long-term ex-ternal precision is better than ±0.1‰ (2 SD).
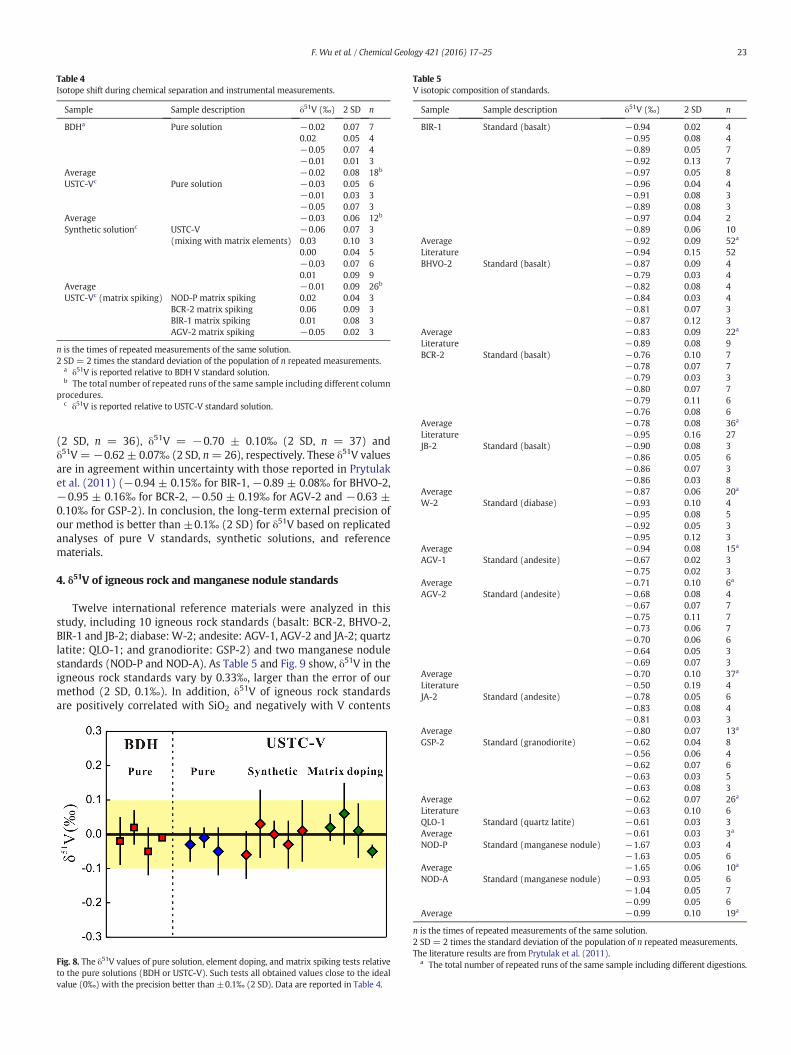
Table 4Isotope shift during chemical separation and instrumental measurements.
Sample Sample description δ51V (‰) 2 SD n
BDHa Pure solution −0.02 0.07 70.02 0.05 4−0.05 0.07 4−0.01 0.01 3
Average −0.02 0.08 18b
USTC-Vc Pure solution −0.03 0.05 6−0.01 0.03 3−0.05 0.07 3
Average −0.03 0.06 12b
Synthetic solutionc USTC-V(mixing with matrix elements)
−0.06 0.07 30.03 0.10 30.00 0.04 5−0.03 0.07 60.01 0.09 9
Average −0.01 0.09 26b
USTC-Vc (matrix spiking) NOD-P matrix spiking 0.02 0.04 3BCR-2 matrix spiking 0.06 0.09 3BIR-1 matrix spiking 0.01 0.08 3AGV-2 matrix spiking −0.05 0.02 3
n is the times of repeated measurements of the same solution.2 SD= 2 times the standard deviation of the population of n repeated measurements.
a δ51V is reported relative to BDH V standard solution.b The total number of repeated runs of the same sample including different column
procedures.c δ51V is reported relative to USTC-V standard solution.
Table 5V isotopic composition of standards.
Sample Sample description δ51V (‰) 2 SD n
BIR-1 Standard (basalt) −0.94 0.02 4−0.95 0.08 4−0.89 0.05 7−0.92 0.13 7−0.97 0.05 8−0.96 0.04 4−0.91 0.08 3−0.89 0.08 3−0.97 0.04 2−0.89 0.06 10
Average −0.92 0.09 52a
Literature −0.94 0.15 52BHVO-2 Standard (basalt) −0.87 0.09 4
−0.79 0.03 4−0.82 0.08 4−0.84 0.03 4−0.81 0.07 3−0.87 0.12 3
Average −0.83 0.09 22a
Literature −0.89 0.08 9BCR-2 Standard (basalt) −0.76 0.10 7
−0.78 0.07 7−0.79 0.03 3−0.80 0.07 7−0.79 0.11 6−0.76 0.08 6
Average −0.78 0.08 36a
Literature −0.95 0.16 27JB-2 Standard (basalt) −0.90 0.08 3
−0.86 0.05 6−0.86 0.07 3−0.86 0.03 8
Average −0.87 0.06 20a
W-2 Standard (diabase) −0.93 0.10 4−0.95 0.08 5−0.92 0.05 3−0.95 0.12 3
Average −0.94 0.08 15a
AGV-1 Standard (andesite) −0.67 0.02 3−0.75 0.02 3
Average −0.71 0.10 6a
AGV-2 Standard (andesite) −0.68 0.08 4−0.67 0.07 7−0.75 0.11 7−0.73 0.06 7−0.70 0.06 6−0.64 0.05 3−0.69 0.07 3
Average −0.70 0.10 37a
Literature −0.50 0.19 4JA-2 Standard (andesite) −0.78 0.05 6
−0.83 0.08 4
23F. Wu et al. / Chemical Geology 421 (2016) 17–25
(2 SD, n = 36), δ51V = −0.70 ± 0.10‰ (2 SD, n = 37) andδ51V =−0.62 ± 0.07‰ (2 SD, n=26), respectively. These δ51V valuesare in agreement within uncertainty with those reported in Prytulaket al. (2011) (−0.94 ± 0.15‰ for BIR-1, −0.89 ± 0.08‰ for BHVO-2,−0.95 ± 0.16‰ for BCR-2, −0.50 ± 0.19‰ for AGV-2 and −0.63 ±0.10‰ for GSP-2). In conclusion, the long-term external precision ofour method is better than ±0.1‰ (2 SD) for δ51V based on replicatedanalyses of pure V standards, synthetic solutions, and referencematerials.
4. δ51V of igneous rock and manganese nodule standards
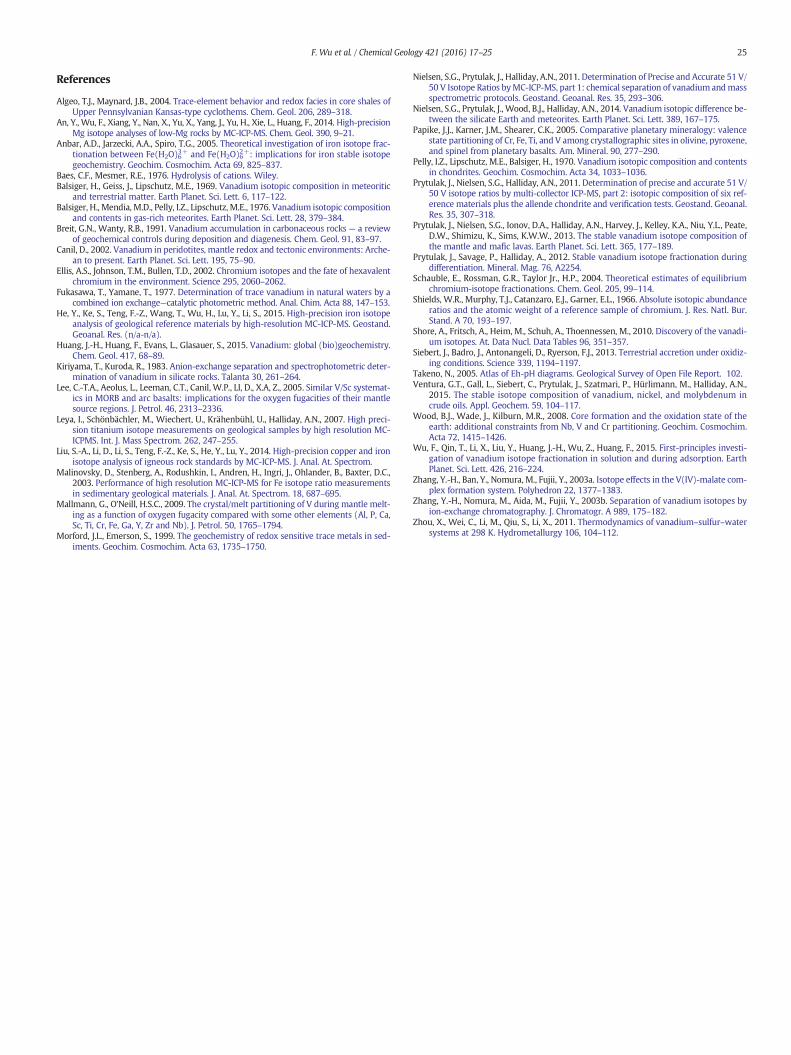
Twelve international reference materials were analyzed in thisstudy, including 10 igneous rock standards (basalt: BCR-2, BHVO-2,BIR-1 and JB-2; diabase: W-2; andesite: AGV-1, AGV-2 and JA-2; quartzlatite: QLO-1; and granodiorite: GSP-2) and two manganese nodulestandards (NOD-P and NOD-A). As Table 5 and Fig. 9 show, δ51V in theigneous rock standards vary by 0.33‰, larger than the error of ourmethod (2 SD, 0.1‰). In addition, δ51V of igneous rock standardsare positively correlated with SiO2 and negatively with V contents
Fig. 8. The δ51V values of pure solution, element doping, and matrix spiking tests relativeto the pure solutions (BDH or USTC-V). Such tests all obtained values close to the idealvalue (0‰) with the precision better than ±0.1‰ (2 SD). Data are reported in Table 4.
−0.81 0.03 3Average −0.80 0.07 13a
GSP-2 Standard (granodiorite) −0.62 0.04 8−0.56 0.06 4−0.62 0.07 6−0.63 0.03 5−0.63 0.08 3
Average −0.62 0.07 26a
Literature −0.63 0.10 6QLO-1 Standard (quartz latite) −0.61 0.03 3Average −0.61 0.03 3a
NOD-P Standard (manganese nodule) −1.67 0.03 4−1.63 0.05 6
Average −1.65 0.06 10a
NOD-A Standard (manganese nodule) −0.93 0.05 6−1.04 0.05 7−0.99 0.05 6
Average −0.99 0.10 19a
n is the times of repeated measurements of the same solution.2 SD= 2 times the standard deviation of the population of n repeated measurements.The literature results are from Prytulak et al. (2011).
a The total number of repeated runs of the same sample including different digestions.
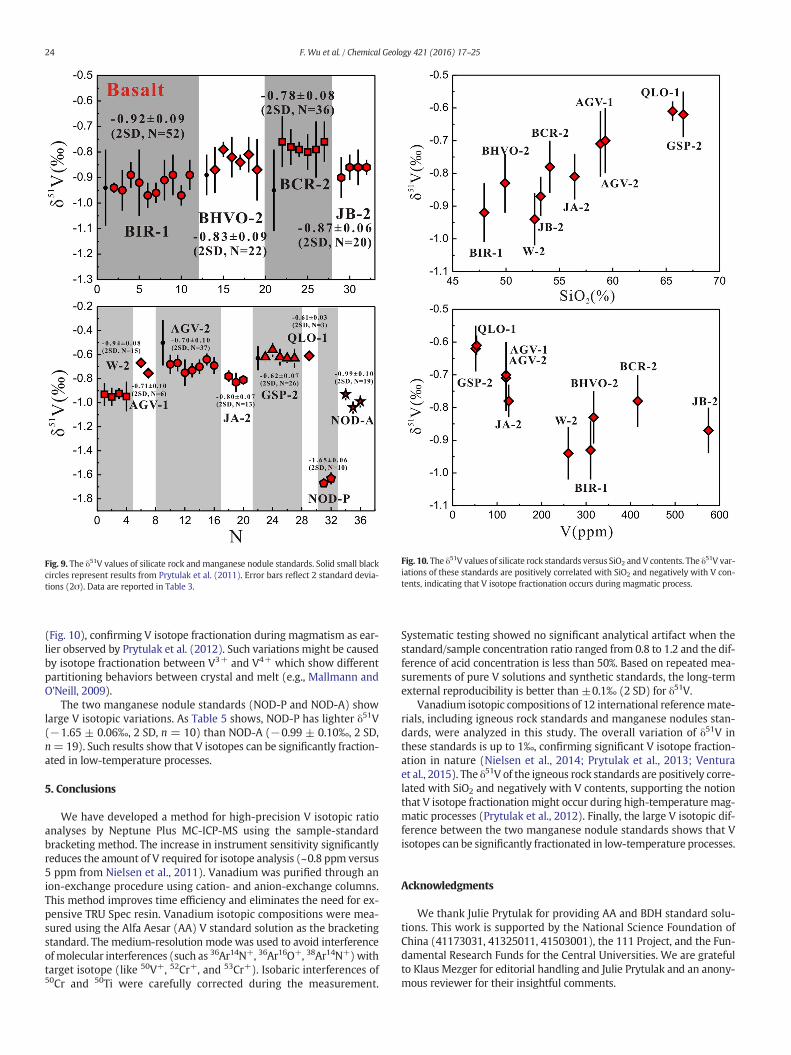
Fig. 9. The δ51V values of silicate rock and manganese nodule standards. Solid small blackcircles represent results from Prytulak et al. (2011). Error bars reflect 2 standard devia-tions (2σ). Data are reported in Table 3.
Fig. 10. The δ51V values of silicate rock standards versus SiO2 and V contents. The δ51V var-iations of these standards are positively correlated with SiO2 and negatively with V con-tents, indicating that V isotope fractionation occurs during magmatic process.
24 F. Wu et al. / Chemical Geology 421 (2016) 17–25
(Fig. 10), confirming V isotope fractionation during magmatism as ear-lier observed by Prytulak et al. (2012). Such variations might be causedby isotope fractionation between V3+ and V4+ which show differentpartitioning behaviors between crystal and melt (e.g., Mallmann andO'Neill, 2009).
The two manganese nodule standards (NOD-P and NOD-A) showlarge V isotopic variations. As Table 5 shows, NOD-P has lighter δ51V(−1.65 ± 0.06‰, 2 SD, n = 10) than NOD-A (−0.99 ± 0.10‰, 2 SD,n=19). Such results show that V isotopes can be significantly fraction-ated in low-temperature processes.
5. Conclusions
We have developed a method for high-precision V isotopic ratioanalyses by Neptune Plus MC-ICP-MS using the sample-standardbracketing method. The increase in instrument sensitivity significantlyreduces the amount of V required for isotope analysis (~0.8 ppm versus5 ppm from Nielsen et al., 2011). Vanadium was purified through anion-exchange procedure using cation- and anion-exchange columns.This method improves time efficiency and eliminates the need for ex-pensive TRU Spec resin. Vanadium isotopic compositions were mea-sured using the Alfa Aesar (AA) V standard solution as the bracketingstandard. The medium-resolution mode was used to avoid interferenceof molecular interferences (such as 36Ar14N+, 36Ar16O+, 38Ar14N+)withtarget isotope (like 50V+, 52Cr+, and 53Cr+). Isobaric interferences of50Cr and 50Ti were carefully corrected during the measurement.
Systematic testing showed no significant analytical artifact when thestandard/sample concentration ratio ranged from 0.8 to 1.2 and the dif-ference of acid concentration is less than 50%. Based on repeated mea-surements of pure V solutions and synthetic standards, the long-termexternal reproducibility is better than ±0.1‰ (2 SD) for δ51V.
Vanadium isotopic compositions of 12 international referencemate-rials, including igneous rock standards and manganese nodules stan-dards, were analyzed in this study. The overall variation of δ51V inthese standards is up to 1‰, confirming significant V isotope fraction-ation in nature (Nielsen et al., 2014; Prytulak et al., 2013; Venturaet al., 2015). The δ51V of the igneous rock standards are positively corre-lated with SiO2 and negatively with V contents, supporting the notionthat V isotope fractionation might occur during high-temperaturemag-matic processes (Prytulak et al., 2012). Finally, the large V isotopic dif-ference between the two manganese nodule standards shows that Visotopes can be significantly fractionated in low-temperature processes.
Acknowledgments
We thank Julie Prytulak for providing AA and BDH standard solu-tions. This work is supported by the National Science Foundation ofChina (41173031, 41325011, 41503001), the 111 Project, and the Fun-damental Research Funds for the Central Universities. We are gratefulto Klaus Mezger for editorial handling and Julie Prytulak and an anony-mous reviewer for their insightful comments.
25F. Wu et al. / Chemical Geology 421 (2016) 17–25
References
Algeo, T.J., Maynard, J.B., 2004. Trace-element behavior and redox facies in core shales ofUpper Pennsylvanian Kansas-type cyclothems. Chem. Geol. 206, 289–318.
An, Y., Wu, F., Xiang, Y., Nan, X., Yu, X., Yang, J., Yu, H., Xie, L., Huang, F., 2014. High-precisionMg isotope analyses of low-Mg rocks by MC-ICP-MS. Chem. Geol. 390, 9–21.
Anbar, A.D., Jarzecki, A.A., Spiro, T.G., 2005. Theoretical investigation of iron isotope frac-tionation between Fe(H2O)63+ and Fe(H2O)62+: implications for iron stable isotopegeochemistry. Geochim. Cosmochim. Acta 69, 825–837.
Baes, C.F., Mesmer, R.E., 1976. Hydrolysis of cations. Wiley.Balsiger, H., Geiss, J., Lipschutz, M.E., 1969. Vanadium isotopic composition in meteoritic
and terrestrial matter. Earth Planet. Sci. Lett. 6, 117–122.Balsiger, H., Mendia, M.D., Pelly, I.Z., Lipschutz, M.E., 1976. Vanadium isotopic composition
and contents in gas-rich meteorites. Earth Planet. Sci. Lett. 28, 379–384.Breit, G.N., Wanty, R.B., 1991. Vanadium accumulation in carbonaceous rocks — a review
of geochemical controls during deposition and diagenesis. Chem. Geol. 91, 83–97.Canil, D., 2002. Vanadium in peridotites, mantle redox and tectonic environments: Arche-
an to present. Earth Planet. Sci. Lett. 195, 75–90.Ellis, A.S., Johnson, T.M., Bullen, T.D., 2002. Chromium isotopes and the fate of hexavalent
chromium in the environment. Science 295, 2060–2062.Fukasawa, T., Yamane, T., 1977. Determination of trace vanadium in natural waters by a
combined ion exchange—catalytic photometric method. Anal. Chim. Acta 88, 147–153.He, Y., Ke, S., Teng, F.-Z., Wang, T., Wu, H., Lu, Y., Li, S., 2015. High-precision iron isotope
analysis of geological reference materials by high-resolution MC-ICP-MS. Geostand.Geoanal. Res. (n/a-n/a).
Huang, J.-H., Huang, F., Evans, L., Glasauer, S., 2015. Vanadium: global (bio)geochemistry.Chem. Geol. 417, 68–89.
Kiriyama, T., Kuroda, R., 1983. Anion-exchange separation and spectrophotometric deter-mination of vanadium in silicate rocks. Talanta 30, 261–264.
Lee, C.-T.A., Aeolus, L., Leeman, C.T., Canil, W.P., LI, D., X.A, Z., 2005. Similar V/Sc systemat-ics in MORB and arc basalts: implications for the oxygen fugacities of their mantlesource regions. J. Petrol. 46, 2313–2336.
Leya, I., Schönbächler, M., Wiechert, U., Krähenbühl, U., Halliday, A.N., 2007. High preci-sion titanium isotope measurements on geological samples by high resolution MC-ICPMS. Int. J. Mass Spectrom. 262, 247–255.
Liu, S.-A., Li, D., Li, S., Teng, F.-Z., Ke, S., He, Y., Lu, Y., 2014. High-precision copper and ironisotope analysis of igneous rock standards by MC-ICP-MS. J. Anal. At. Spectrom.
Malinovsky, D., Stenberg, A., Rodushkin, I., Andren, H., Ingri, J., Ohlander, B., Baxter, D.C.,2003. Performance of high resolution MC-ICP-MS for Fe isotope ratio measurementsin sedimentary geological materials. J. Anal. At. Spectrom. 18, 687–695.
Mallmann, G., O'Neill, H.S.C., 2009. The crystal/melt partitioning of V during mantle melt-ing as a function of oxygen fugacity compared with some other elements (Al, P, Ca,Sc, Ti, Cr, Fe, Ga, Y, Zr and Nb). J. Petrol. 50, 1765–1794.
Morford, J.L., Emerson, S., 1999. The geochemistry of redox sensitive trace metals in sed-iments. Geochim. Cosmochim. Acta 63, 1735–1750.
Nielsen, S.G., Prytulak, J., Halliday, A.N., 2011. Determination of Precise and Accurate 51 V/50 V Isotope Ratios byMC-ICP-MS, part 1: chemical separation of vanadium andmassspectrometric protocols. Geostand. Geoanal. Res. 35, 293–306.
Nielsen, S.G., Prytulak, J., Wood, B.J., Halliday, A.N., 2014. Vanadium isotopic difference be-tween the silicate Earth and meteorites. Earth Planet. Sci. Lett. 389, 167–175.
Papike, J.J., Karner, J.M., Shearer, C.K., 2005. Comparative planetary mineralogy: valencestate partitioning of Cr, Fe, Ti, and V among crystallographic sites in olivine, pyroxene,and spinel from planetary basalts. Am. Mineral. 90, 277–290.
Pelly, I.Z., Lipschutz, M.E., Balsiger, H., 1970. Vanadium isotopic composition and contentsin chondrites. Geochim. Cosmochim. Acta 34, 1033–1036.
Prytulak, J., Nielsen, S.G., Halliday, A.N., 2011. Determination of precise and accurate 51 V/50 V isotope ratios by multi-collector ICP-MS, part 2: isotopic composition of six ref-erence materials plus the allende chondrite and verification tests. Geostand. Geoanal.Res. 35, 307–318.
Prytulak, J., Nielsen, S.G., Ionov, D.A., Halliday, A.N., Harvey, J., Kelley, K.A., Niu, Y.L., Peate,D.W., Shimizu, K., Sims, K.W.W., 2013. The stable vanadium isotope composition ofthe mantle and mafic lavas. Earth Planet. Sci. Lett. 365, 177–189.
Prytulak, J., Savage, P., Halliday, A., 2012. Stable vanadium isotope fractionation duringdifferentiation. Mineral. Mag. 76, A2254.
Schauble, E., Rossman, G.R., Taylor Jr., H.P., 2004. Theoretical estimates of equilibriumchromium-isotope fractionations. Chem. Geol. 205, 99–114.
Shields, W.R., Murphy, T.J., Catanzaro, E.J., Garner, E.L., 1966. Absolute isotopic abundanceratios and the atomic weight of a reference sample of chromium. J. Res. Natl. Bur.Stand. A 70, 193–197.
Shore, A., Fritsch, A., Heim, M., Schuh, A., Thoennessen, M., 2010. Discovery of the vanadi-um isotopes. At. Data Nucl. Data Tables 96, 351–357.
Siebert, J., Badro, J., Antonangeli, D., Ryerson, F.J., 2013. Terrestrial accretion under oxidiz-ing conditions. Science 339, 1194–1197.
Takeno, N., 2005. Atlas of Eh-pH diagrams. Geological Survey of Open File Report. 102.Ventura, G.T., Gall, L., Siebert, C., Prytulak, J., Szatmari, P., Hürlimann, M., Halliday, A.N.,
2015. The stable isotope composition of vanadium, nickel, and molybdenum incrude oils. Appl. Geochem. 59, 104–117.
Wood, B.J., Wade, J., Kilburn, M.R., 2008. Core formation and the oxidation state of theearth: additional constraints from Nb, V and Cr partitioning. Geochim. Cosmochim.Acta 72, 1415–1426.
Wu, F., Qin, T., Li, X., Liu, Y., Huang, J.-H., Wu, Z., Huang, F., 2015. First-principles investi-gation of vanadium isotope fractionation in solution and during adsorption. EarthPlanet. Sci. Lett. 426, 216–224.
Zhang, Y.-H., Ban, Y., Nomura, M., Fujii, Y., 2003a. Isotope effects in the V(IV)-malate com-plex formation system. Polyhedron 22, 1377–1383.
Zhang, Y.-H., Nomura, M., Aida, M., Fujii, Y., 2003b. Separation of vanadium isotopes byion-exchange chromatography. J. Chromatogr. A 989, 175–182.
Zhou, X., Wei, C., Li, M., Qiu, S., Li, X., 2011. Thermodynamics of vanadium–sulfur–watersystems at 298 K. Hydrometallurgy 106, 104–112.