Embed Size (px)
Citation preview
Vamsi VakulabharanamUniversity of Massachusetts, Amherst
Class and Inequality in Asia During the Twentieth Century
(Presentation at the AGW, Jan 7, 2015, APU, Bangalore. Research funded by the Institute for New Economic Thinking)
Motivation How did Asian Inequality Evolve after WWII?
How does Class as an analytical category help us understand Asian Inequality – particularly Chinese and Indian Inequality?
Within-country inequality dynamics still a puzzle (even after Piketty’s weighty work).
What can the Asian story teach us about the relationship between Development and Inequality? Outline of a model.
Theoretical Context (1)
Lot of interest in within-country (and global) inequality dynamics after the Global Crisis of 2008.
Focus in recent work mostly on characteristics or outcomes of inequality, rather than causal structures.
How do we make sense of structural and class dynamics and their determination of inequality within a country?
Theoretical Context (2)
What causes inequality to rise within a country? Kuznets hypothesis (1955) – Non-mechanistic, PE-based. Later –
mechanistic, problematic (e.g. Ahluwalia 1976 and Kanbur 2011).
What is the problem?
Two well-known anomalies – Developed nations (1970s -), East Asia (1950s -).
Focus for a while shifted to micro studies and characteristics of inequality.
Causal Structures? Long-term Macro Patterns? Asian inequality story is a counter-example of the Kuznets hypothesis,
interrogate this further. Does Piketty have a coherent answer?
Theoretical Context (3)
Piketty’s Capital in the Twenty First Century – Magisterial empirical work (especially the developed world; developing
world underexplored). Theoretical work: unconvincing, somewhat unsound and obscure - the
definition of Capital and, inferences from so-called Fundamental Laws. Piketty’s ‘α’, ‘r’ are outcomes of deeper socio-political-economic regimes. No adequate conception of change. Change seems to happen only through
exogenous “shocks.” Emphasizes long-term trends, but does not pay adequate attention to the
endogenous deep periodic crises in capitalism that produce new class dynamics and inequality regimes. In particular, he does not have a clear conception of or analytical role for effective demand/realization crises!
Crises, deep capitalist dynamics and new regimes – a point of departure and a better abstraction to track inequality patterns than the Kuznets hypothesis or Piketty’s so-called Fundamental Laws.

Possibilities for New Thinking?
Focus of my reflections today:
Analyze Chinese and Indian inequality experiences in terms of class categories.
Broader Asian Inequality experience.
Hypothesize from the Asian Experience after 1950s to a more durable understanding of the relation between development and inequality.
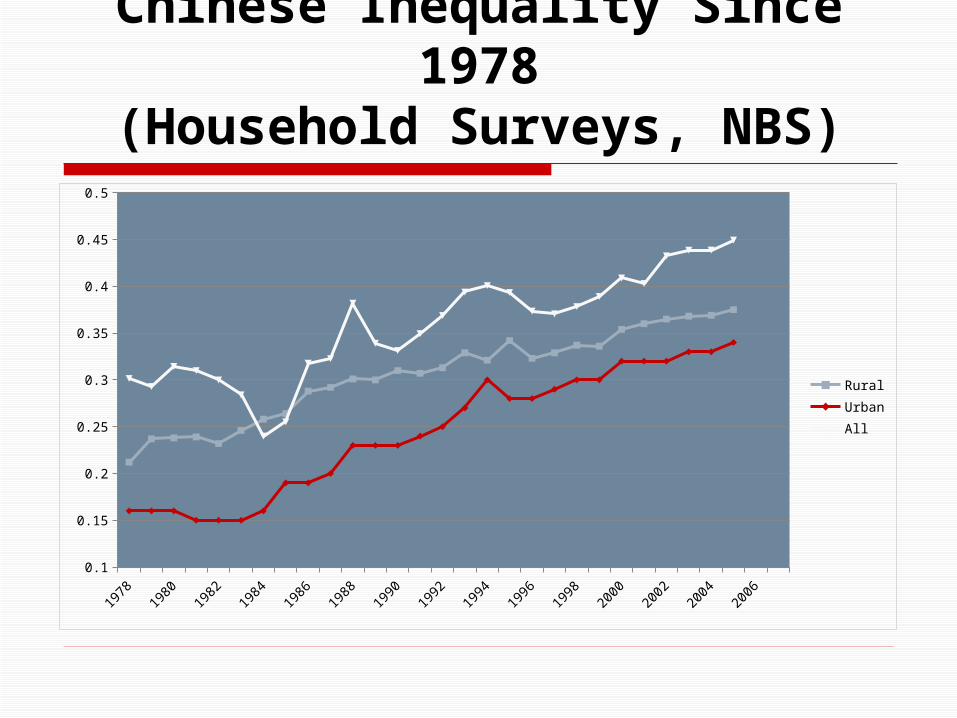
Chinese Inequality Since 1978(Household Surveys, NBS)
1978
1979
1980
1981
1982
1983
1984
1985
1986
1987
1988
1989
1990
1991
1992
1993
1994
1995
1996
1997
1998
1999
2000
2001
2002
2003
2004
2005
2006
2007
0.1
0.15
0.2
0.25
0.3
0.35
0.4
0.45
0.5
Rural
Urban
All
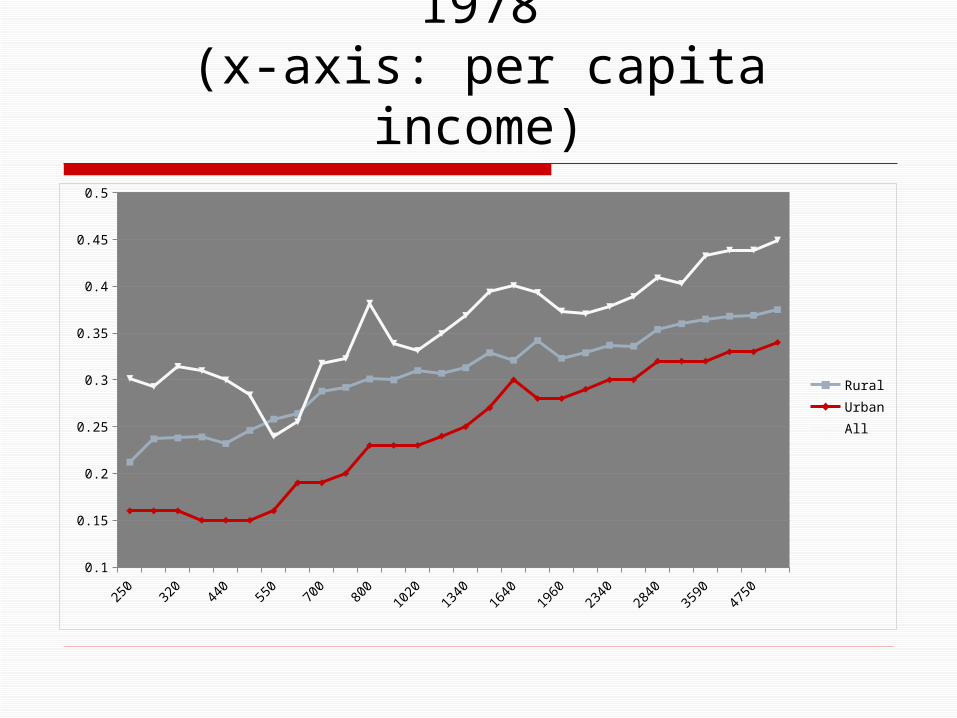
Chinese Inequality Since 1978(x-axis: per capita income)
250
280
320
370
440
500
550
620
700
750
800
890
1020
1170
1340
1480
1640
1820
1960
2120
2340
2560
2840
3180
3590
4090
4750
5580
0.1
0.15
0.2
0.25
0.3
0.35
0.4
0.45
0.5
Rural
Urban
All
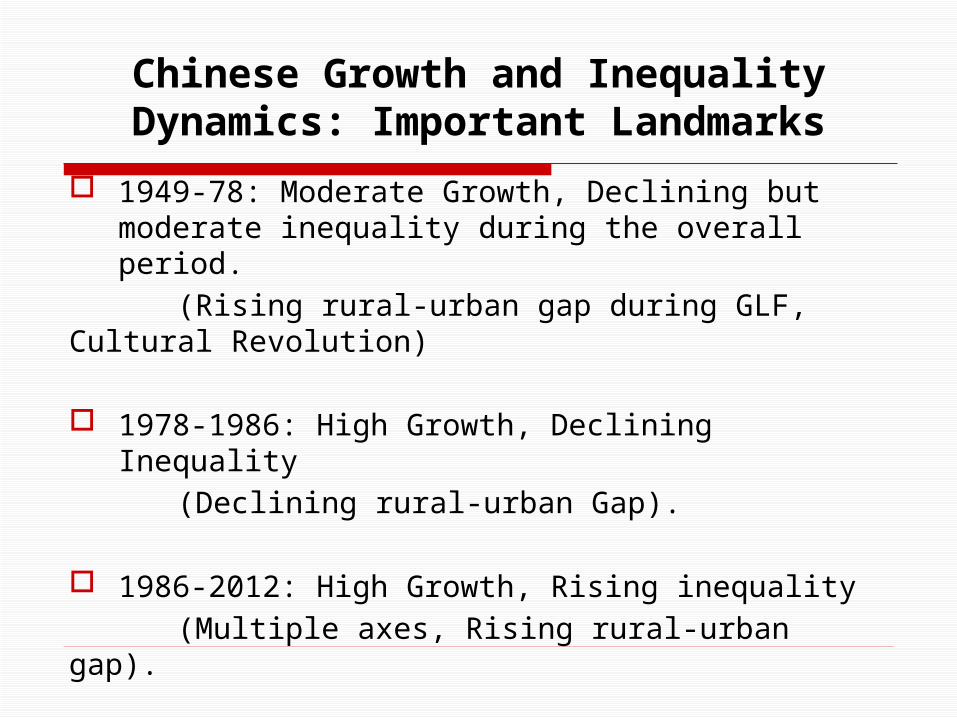
Chinese Growth and Inequality Dynamics: Important Landmarks
1949-78: Moderate Growth, Declining but moderate inequality during the overall period.
(Rising rural-urban gap during GLF, Cultural Revolution)
1978-1986: High Growth, Declining Inequality
(Declining rural-urban Gap).
1986-2012: High Growth, Rising inequality
(Multiple axes, Rising rural-urban gap).
Overall, a U pattern of inequality and development.
Data From China and India
Data Source: China Household Income Project (CHIP - 1988, 1995, 2002, 2007), NBS Sub-samples. Indian National Sample Survey Consumer Expenditure data from 1960-83 (Detailed data not available),1983-84, 1993-94 and 2009-10 (raw data available for the last three points in time).
Biases: Upper end groups are not adequately sampled. Elite Classes somewhat under-represented in the class
schemas. Implication: Chinese and Indian inequality levels
understated.
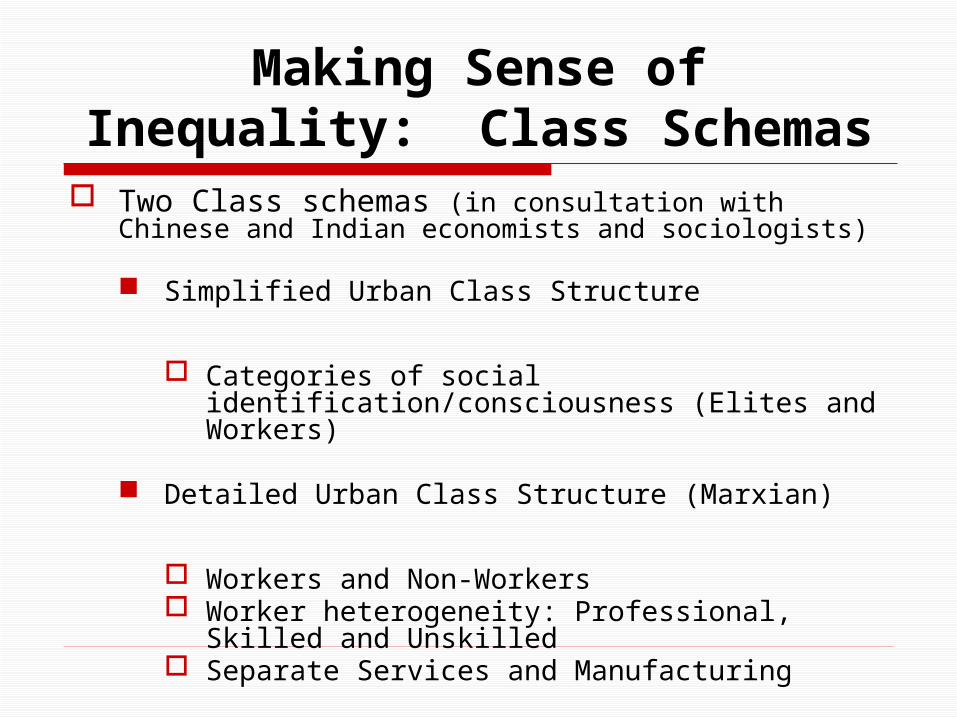
Making Sense of Inequality: Class Schemas
Two Class schemas (in consultation with Chinese and Indian economists and sociologists)
Simplified Urban Class Structure
Categories of social identification/consciousness (Elites and Workers)
Detailed Urban Class Structure (Marxian)
Workers and Non-Workers Worker heterogeneity: Professional, Skilled and
Unskilled Separate Services and Manufacturing
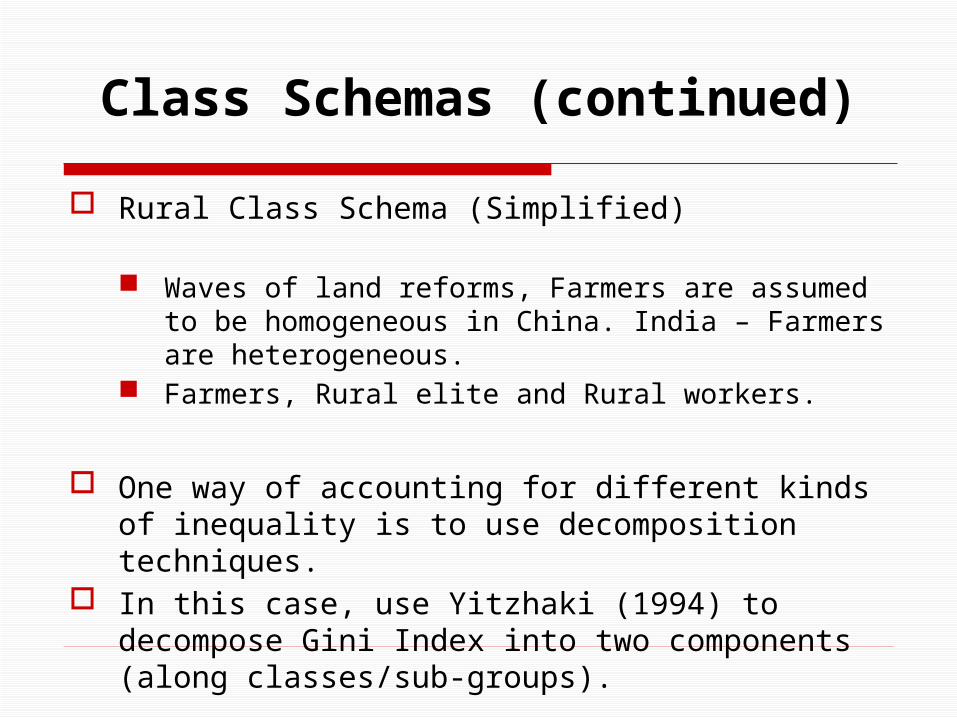
Class Schemas (continued)
Rural Class Schema (Simplified)
Waves of land reforms, Farmers are assumed to be homogeneous in China. India – Farmers are heterogeneous.
Farmers, Rural elite and Rural workers.
One way of accounting for different kinds of inequality is to use decomposition techniques.
In this case, use Yitzhaki (1994) to decompose Gini Index into two components (along classes/sub-groups).
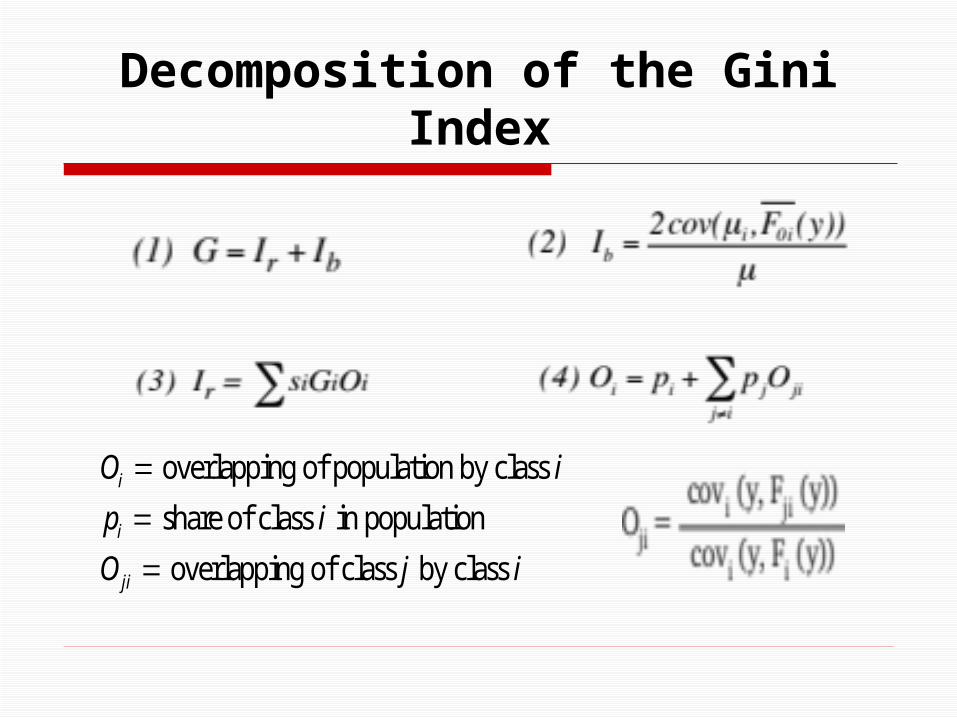
Decomposition of the Gini Index
overlapping of population by class
share of class in population
overlapping of class by class
i
i
ji
O i
p i
O j i
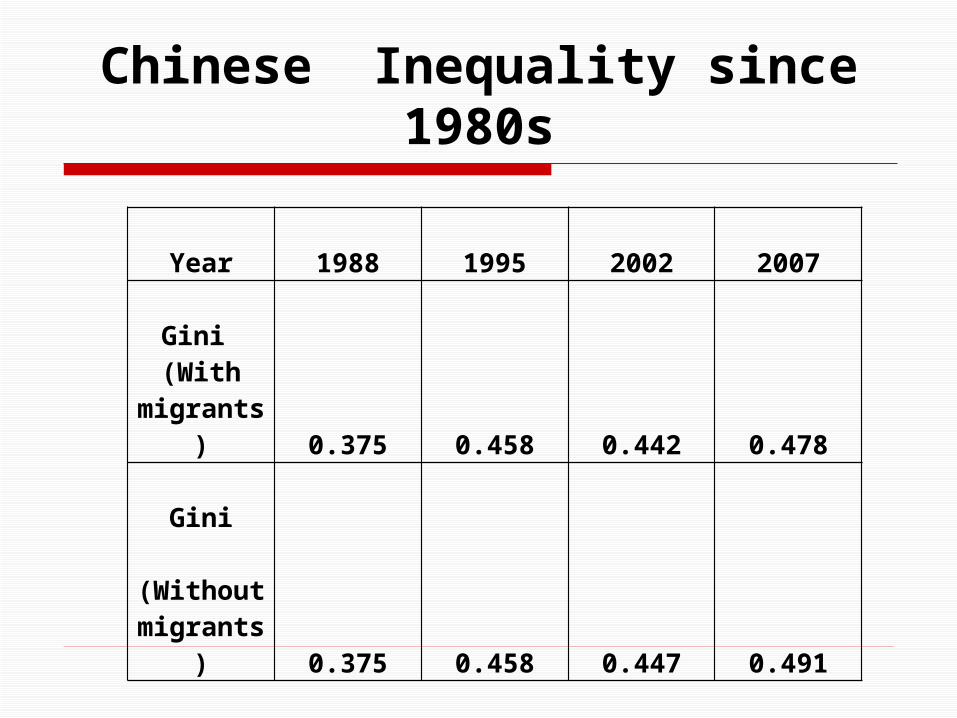
Chinese Inequality since 1980s
Year 1988 1995 2002 2007
Gini (With
migrants)0.375 0.458 0.442 0.478
Gini (Without migrants)
0.375 0.458 0.447 0.491
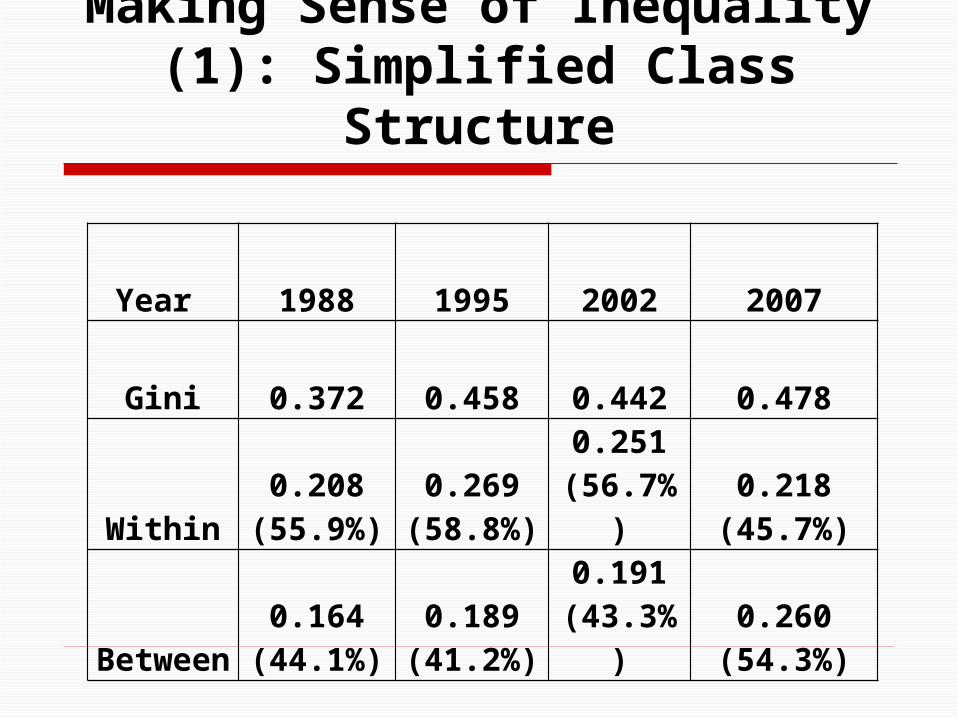
Making Sense of Inequality (1): Simplified Class Structure
Year 1988 1995 2002 2007
Gini 0.372 0.458 0.442 0.478
Within0.208
(55.9%)0.269
(58.8%)0.251
(56.7%)0.218
(45.7%)
Between0.164
(44.1%)0.189
(41.2%)0.191
(43.3%)0.260
(54.3%)
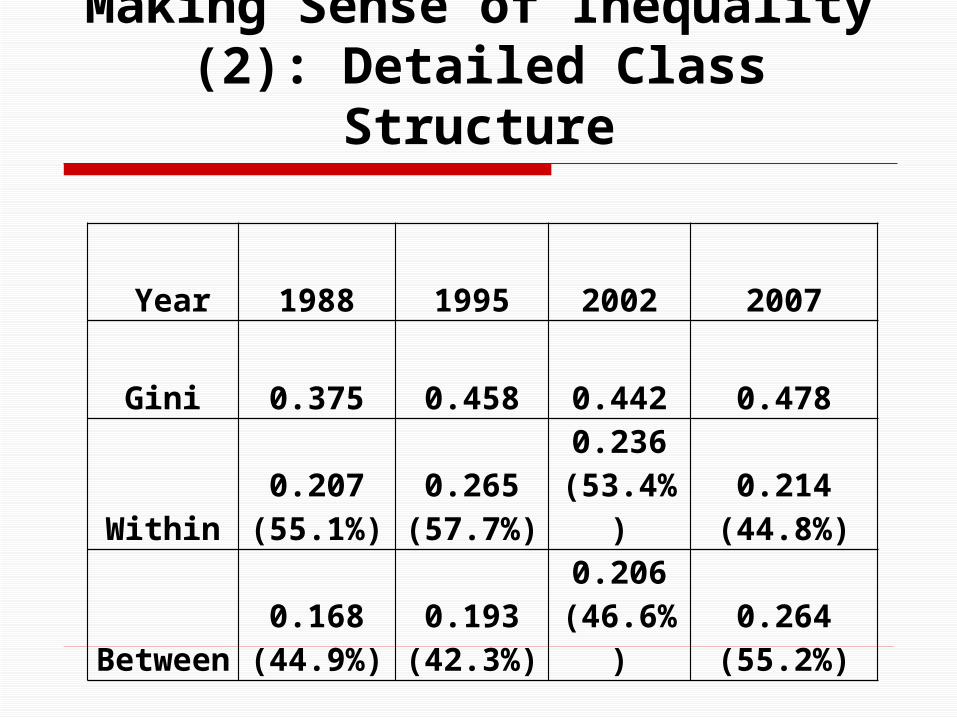
Making Sense of Inequality (2): Detailed Class Structure
Year 1988 1995 2002 2007
Gini 0.375 0.458 0.442 0.478
Within0.207
(55.1%)0.265
(57.7%)0.236
(53.4%)0.214
(44.8%)
Between0.168
(44.9%)0.193
(42.3%)0.206
(46.6%)0.264
(55.2%)
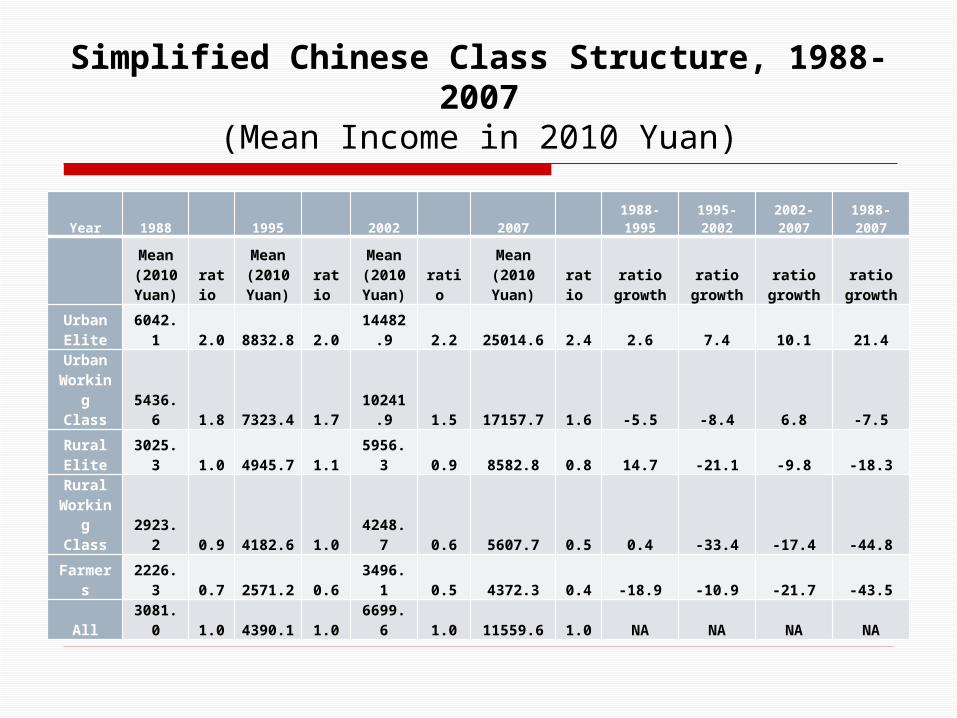
Simplified Chinese Class Structure, 1988-2007(Mean Income in 2010 Yuan)
Year 1988 1995 2002 2007 1988-1995 1995-2002 2002-2007 1988-2007
Mean(2010 Yuan) ratio
Mean (2010 Yuan) ratio
Mean (2010 Yuan) ratio
Mean (2010 Yuan) ratio
ratio growth
ratio growth
ratio growth
ratio growth
Urban Elite 6042.1 2.0 8832.8 2.0 14482.9 2.2 25014.6 2.4 2.6 7.4 10.1 21.4
Urban Working
Class 5436.6 1.8 7323.4 1.7 10241.9 1.5 17157.7 1.6 -5.5 -8.4 6.8 -7.5
Rural Elite 3025.3 1.0 4945.7 1.1 5956.3 0.9 8582.8 0.8 14.7 -21.1 -9.8 -18.3
Rural Working
Class 2923.2 0.9 4182.6 1.0 4248.7 0.6 5607.7 0.5 0.4 -33.4 -17.4 -44.8
Farmers 2226.3 0.7 2571.2 0.6 3496.1 0.5 4372.3 0.4 -18.9 -10.9 -21.7 -43.5
All 3081.0 1.0 4390.1 1.0 6699.6 1.0 11559.6 1.0 NA NA NA NA
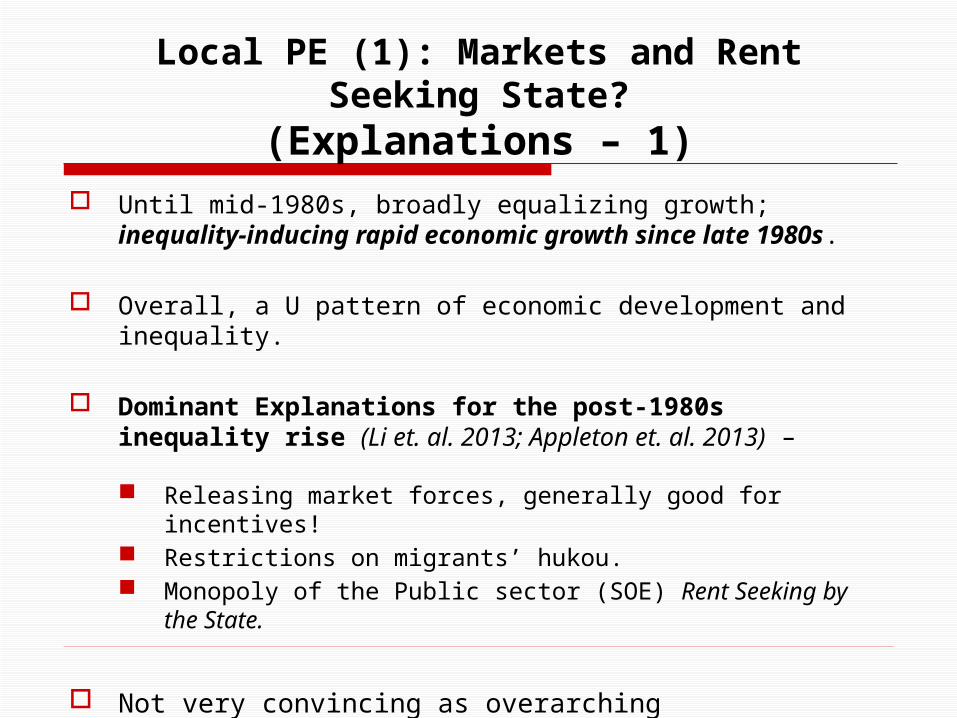
Local PE (1): Markets and Rent Seeking State?(Explanations – 1)
Until mid-1980s, broadly equalizing growth; inequality-inducing rapid economic growth since late 1980s.
Overall, a U pattern of economic development and inequality.
Dominant Explanations for the post-1980s inequality rise (Li et.
al. 2013; Appleton et. al. 2013) –
Releasing market forces, generally good for incentives! Restrictions on migrants’ hukou. Monopoly of the Public sector (SOE) Rent Seeking by the State.
Not very convincing as overarching explanations.
Local PE (2): Class Dynamics (Explanations – 2)
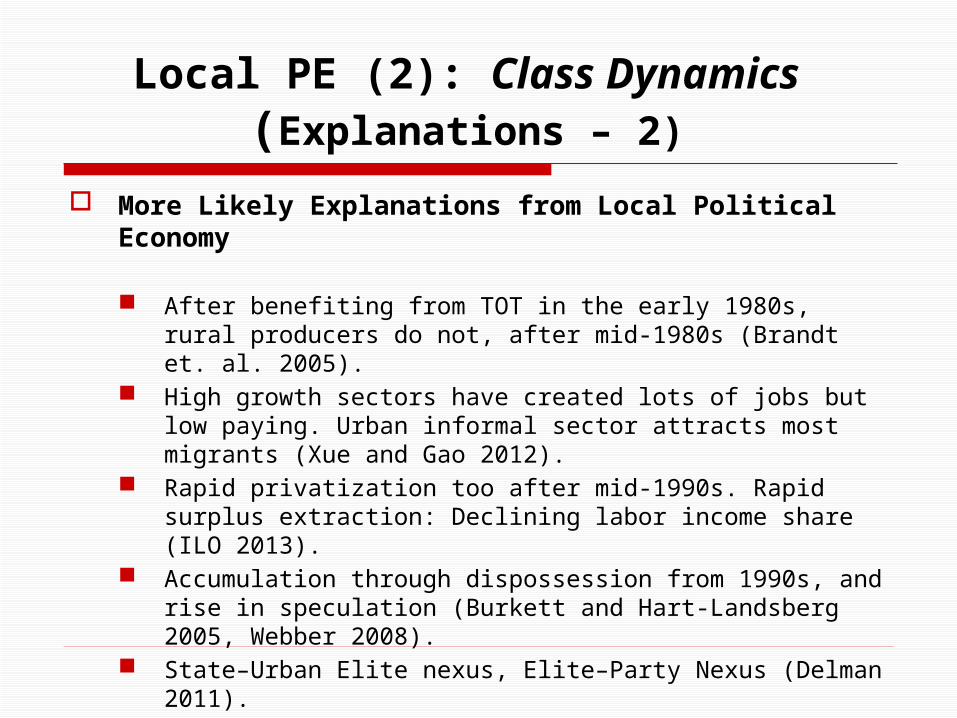
More Likely Explanations from Local Political Economy
After benefiting from TOT in the early 1980s, rural producers do not, after mid-1980s (Brandt et. al. 2005).
High growth sectors have created lots of jobs but low paying. Urban informal sector attracts most migrants (Xue and Gao 2012).
Rapid privatization too after mid-1990s. Rapid surplus extraction: Declining labor income share (ILO 2013).
Accumulation through dispossession from 1990s, and rise in speculation (Burkett and Hart-Landsberg 2005, Webber 2008).
State–Urban Elite nexus, Elite–Party Nexus (Delman 2011).
Is the tail wagging the dog? Retreat from Inequality until 1980s, Retreat from Equality
thereafter.
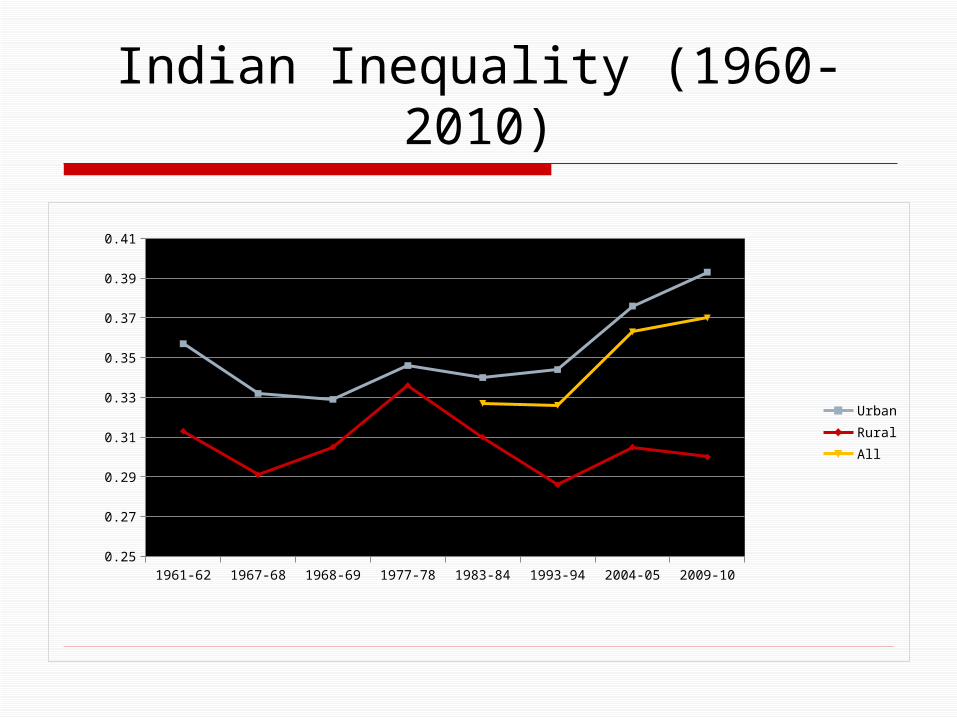
Indian Inequality (1960-2010)
1961-62 1967-68 1968-69 1977-78 1983-84 1993-94 2004-05 2009-100.25
0.27
0.29
0.31
0.33
0.35
0.37
0.39
0.41
Urban
Rural
All
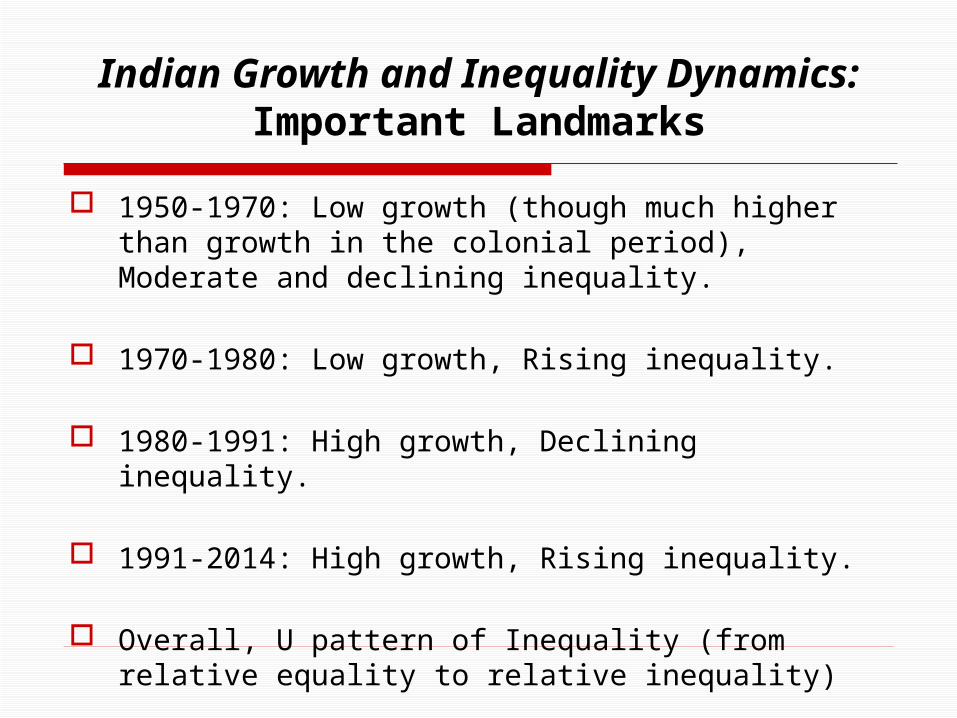
Indian Growth and Inequality Dynamics: Important Landmarks
1950-1970: Low growth (though much higher than growth in the colonial period), Moderate and declining inequality.
1970-1980: Low growth, Rising inequality.
1980-1991: High growth, Declining inequality.
1991-2014: High growth, Rising inequality.
Overall, U pattern of Inequality (from relative equality to relative inequality)
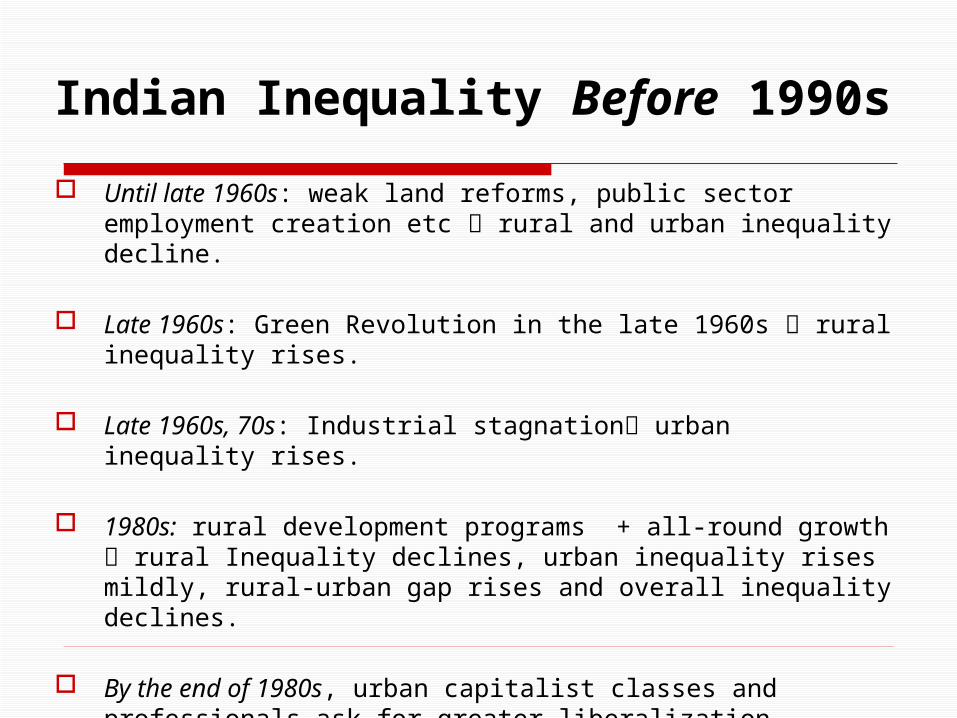
Indian Inequality Before 1990s
Until late 1960s: weak land reforms, public sector employment creation etc rural and urban inequality decline.
Late 1960s: Green Revolution in the late 1960s rural inequality rises.
Late 1960s, 70s: Industrial stagnation urban inequality rises.
1980s: rural development programs + all-round growth rural Inequality declines, urban inequality rises mildly, rural-urban gap rises and overall inequality declines.
By the end of 1980s, urban capitalist classes and professionals ask for greater liberalization.
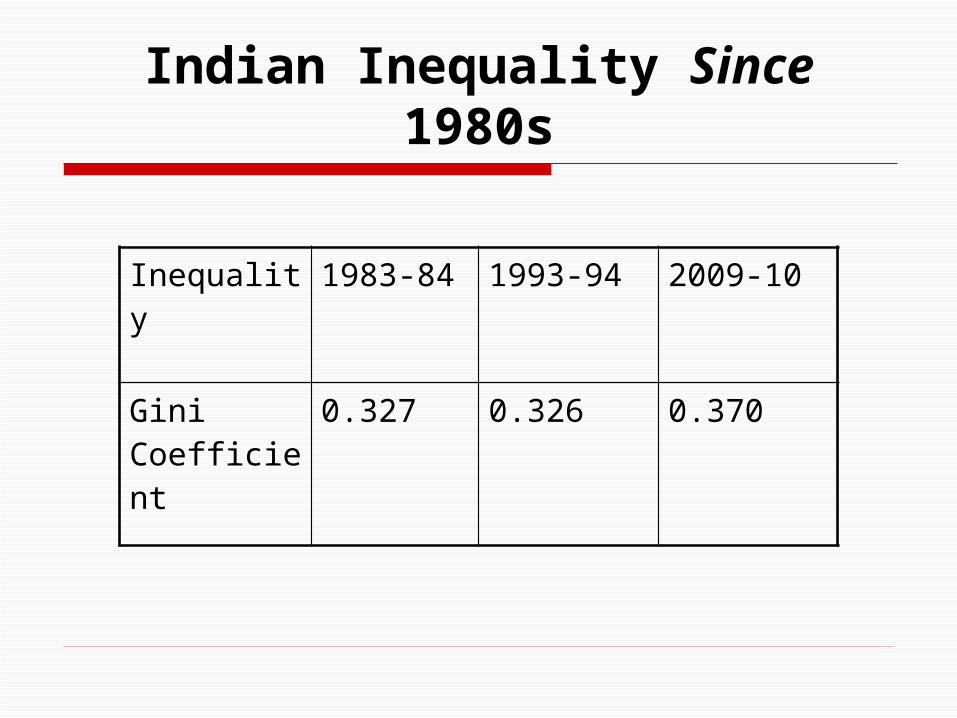
Indian Inequality Since 1980s
Inequality 1983-84 1993-94 2009-10
Gini Coefficient
0.327 0.326 0.370
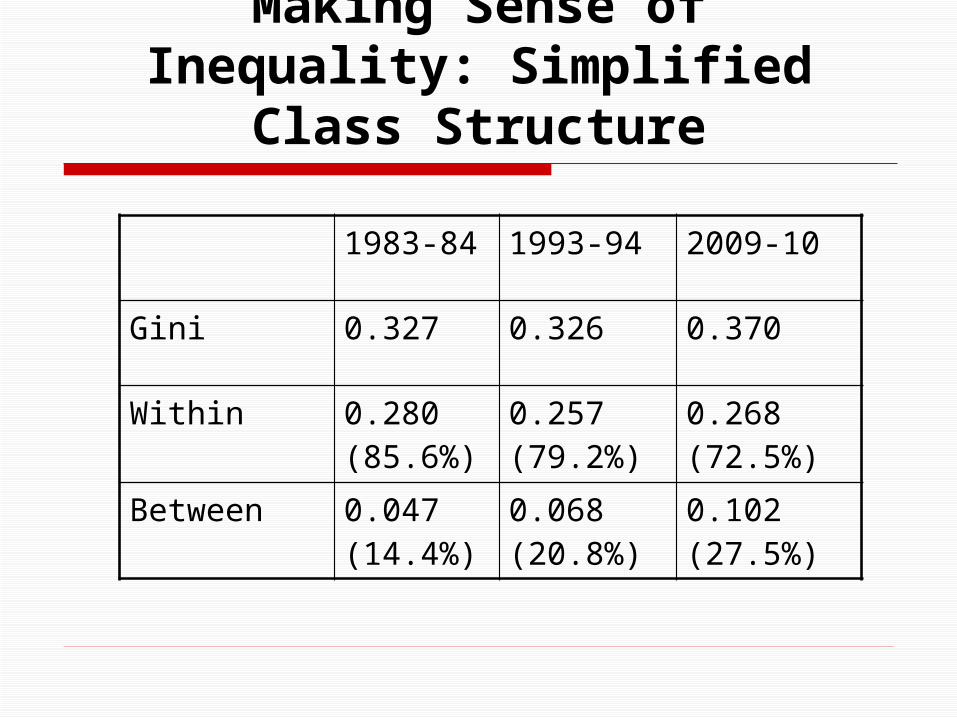
Making Sense of Inequality: Simplified Class Structure
1983-84 1993-94 2009-10
Gini 0.327 0.326 0.370
Within 0.280 (85.6%)
0.257(79.2%)
0.268(72.5%)
Between 0.047(14.4%)
0.068(20.8%)
0.102(27.5%)
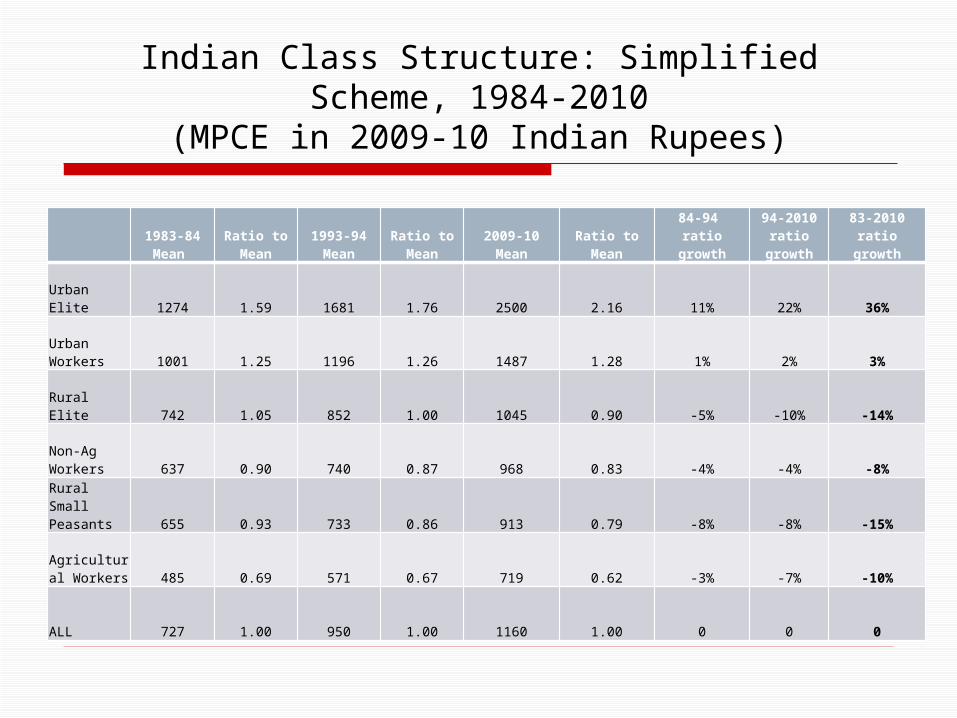
Indian Class Structure: Simplified Scheme, 1984-2010(MPCE in 2009-10 Indian Rupees)
1983-84Mean
Ratio to Mean
1993-94Mean
Ratio to Mean
2009-10 Mean
Ratio to Mean
84-94 ratio growth
94-2010 ratio
growth83-2010
ratio growth
Urban Elite 1274 1.59 1681 1.76 2500 2.16 11% 22% 36%
Urban Workers 1001 1.25 1196 1.26 1487 1.28 1% 2% 3%
Rural Elite 742 1.05 852 1.00 1045 0.90 -5% -10% -14%
Non-Ag Workers 637 0.90 740 0.87 968 0.83 -4% -4% -8%
Rural Small Peasants 655 0.93 733 0.86 913 0.79 -8% -8% -15%
Agricultural Workers 485 0.69 571 0.67 719 0.62 -3% -7% -10%
ALL 727 1.00 950 1.00 1160 1.00 0 0 0
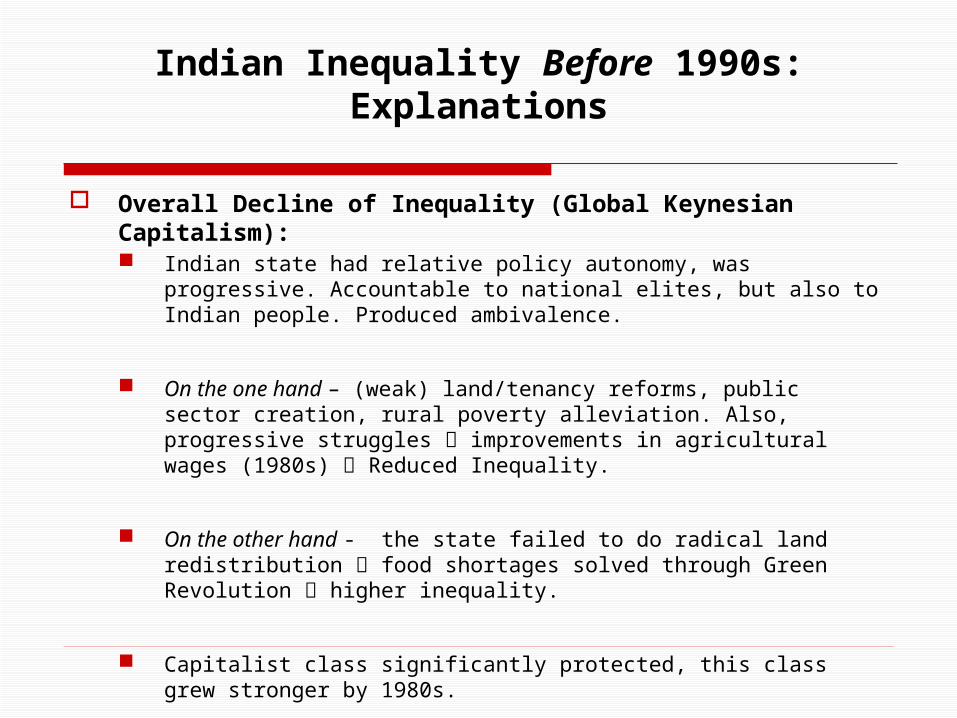
Indian Inequality Before 1990s: Explanations
Overall Decline of Inequality (Global Keynesian Capitalism): Indian state had relative policy autonomy, was progressive. Accountable to
national elites, but also to Indian people. Produced ambivalence.
On the one hand – (weak) land/tenancy reforms, public sector creation, rural poverty alleviation. Also, progressive struggles improvements in agricultural wages (1980s) Reduced Inequality.
On the other hand - the state failed to do radical land redistribution food shortages solved through Green Revolution higher inequality.
Capitalist class significantly protected, this class grew stronger by 1980s.
Dominant Classes: Rural elites, Urban Capitalist Classes and the Urban Professionals. State balanced these interests and those of people.
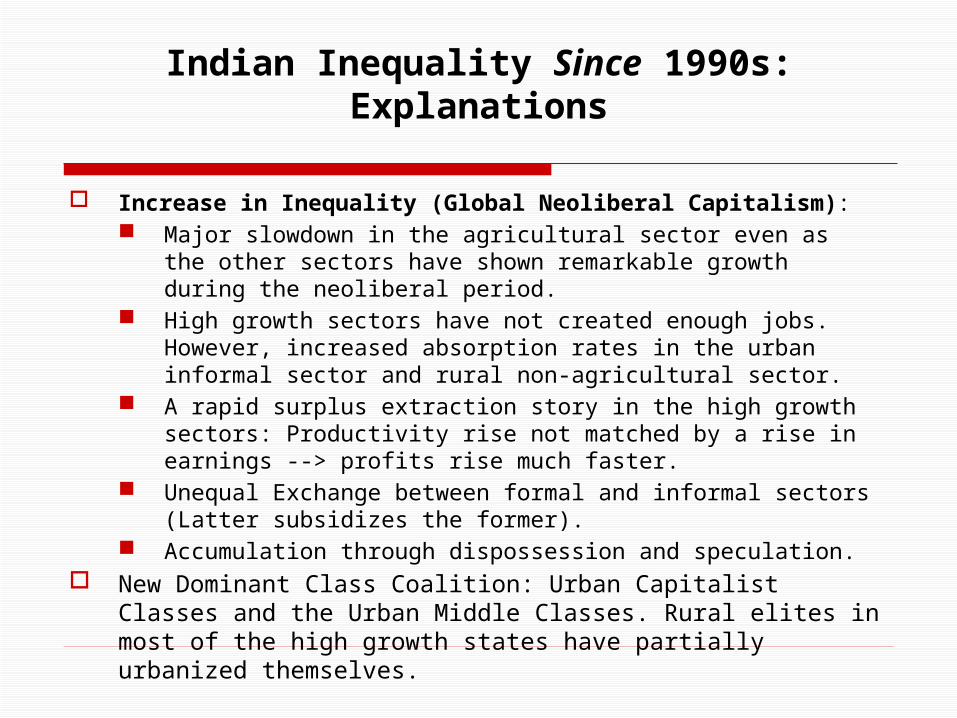
Indian Inequality Since 1990s: Explanations
Increase in Inequality (Global Neoliberal Capitalism): Major slowdown in the agricultural sector even as the other sectors
have shown remarkable growth during the neoliberal period. High growth sectors have not created enough jobs. However,
increased absorption rates in the urban informal sector and rural non-agricultural sector.
A rapid surplus extraction story in the high growth sectors: Productivity rise not matched by a rise in earnings --> profits rise much faster.
Unequal Exchange between formal and informal sectors (Latter subsidizes the former).
Accumulation through dispossession and speculation. New Dominant Class Coalition: Urban Capitalist Classes and the Urban
Middle Classes. Rural elites in most of the high growth states have partially urbanized themselves.
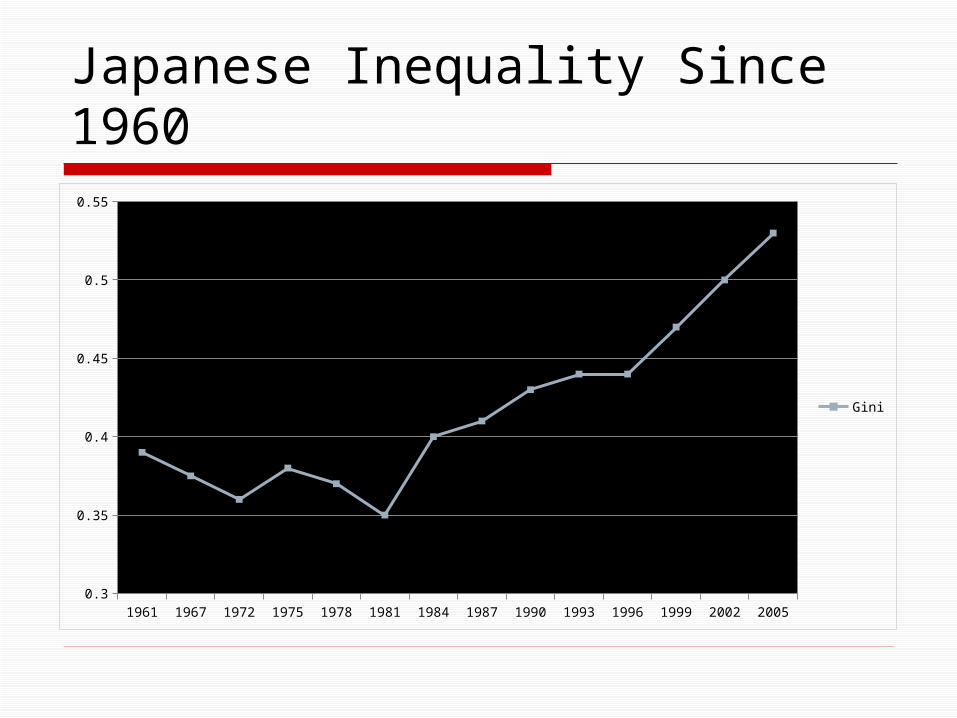
Japanese Inequality Since 1960
1961 1967 1972 1975 1978 1981 1984 1987 1990 1993 1996 1999 2002 20050.3
0.35
0.4
0.45
0.5
0.55
Gini
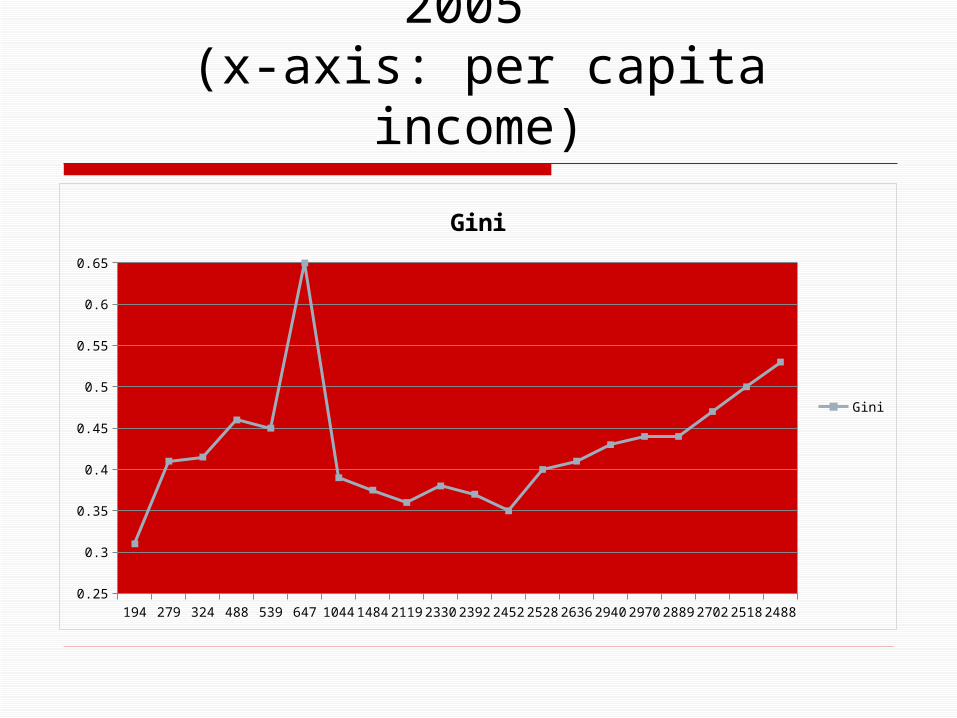
Japanese Inequality 1890-2005 (x-axis: per capita income)
194 279 324 488 539 647 1044 1484 2119 2330 2392 2452 2528 2636 2940 2970 2889 2702 2518 24880.25
0.3
0.35
0.4
0.45
0.5
0.55
0.6
0.65
Gini
Gini
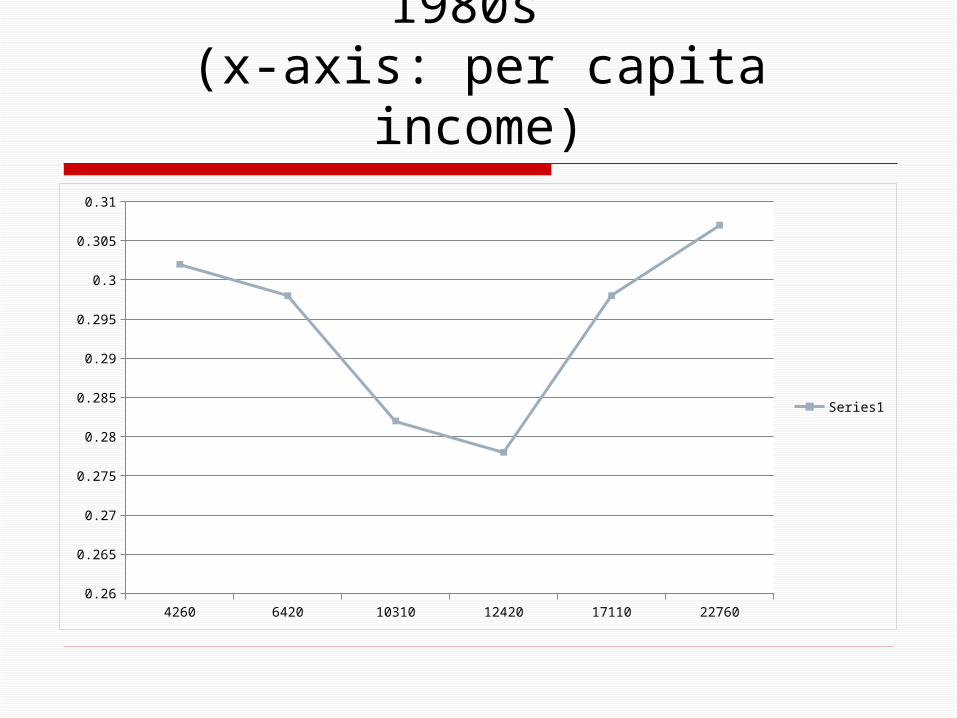
Korean Inequality Since 1980s (x-axis: per capita income)
4260 6420 10310 12420 17110 227600.26
0.265
0.27
0.275
0.28
0.285
0.29
0.295
0.3
0.305
0.31
Series1
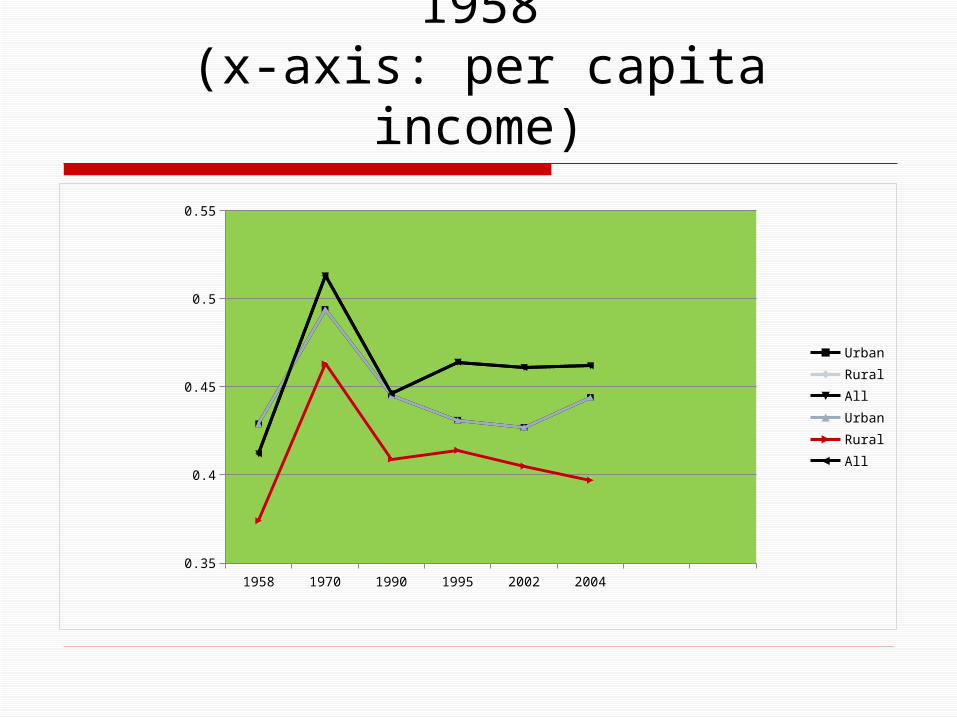
Malaysian Inequality Since 1958(x-axis: per capita income)
1958 1970 1990 1995 2002 20040.35
0.4
0.45
0.5
0.55
Urban
Rural
All
Urban
Rural
All
Summary: Asian Experience Since 1950s
Not entirely homogenous, but there are strong similarities.
Japan, South Korea, Malaysia, China and India witnessed something like a U (or V) shaped evolution of inequality since 1950s.
How to make sense of this? Local Political Economy (Already discussed in the Chinese and
Indian cases). Global Political Economy.
Explanations (continued) – Global Political Economy (1)
Within-country inequality, governed by deep crises in capitalist regimes.
Deep crises switches (until now) in inequality dynamics.
Long Depression, 1873-1896 (Inequality rose) Great Depression of 1930s (Inequality declined) Stagflation of 1970s (Inequality rose) Great Recession of 2008 (Inequality ?)
Explanations (continued) – Global Political Economy (2)
A Crisis produces a moulting process, a different regime, and a macroeconomic theory that is suitable.
One hypothesis: Crises over the last 150 years are oscillating between lack of
profitability and/or effective demand. Circuit of Capital: M-C-C’-M’; M-C’: Profitability, and C’-M’:
Realization (or broadly effective demand) Solving M-C’ produces a crisis in C’-M’ and vice-versa. Moulting after profitability crises typically produces an
inequality-inducing regime and effective demand crises produce inequality declining dynamics.
Examples: Post-1930s and post-1970s.
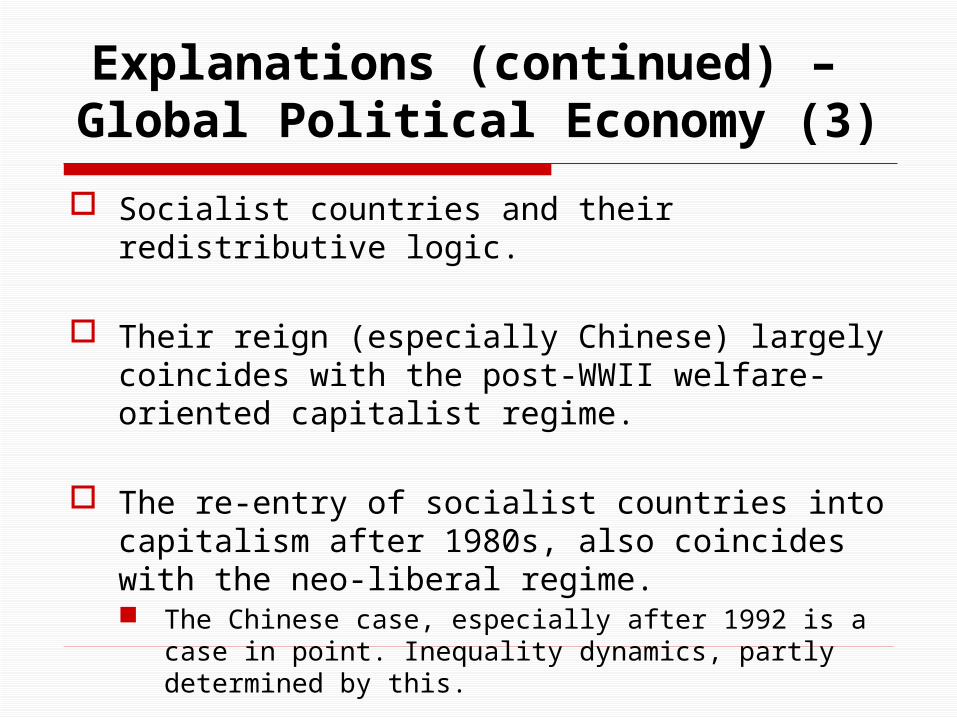
Explanations (continued) – Global Political Economy (3)
Socialist countries and their redistributive logic.
Their reign (especially Chinese) largely coincides with the post-WWII welfare-oriented capitalist regime.
The re-entry of socialist countries into capitalism after 1980s, also coincides with the neo-liberal regime. The Chinese case, especially after 1992 is a case in point.
Inequality dynamics, partly determined by this.
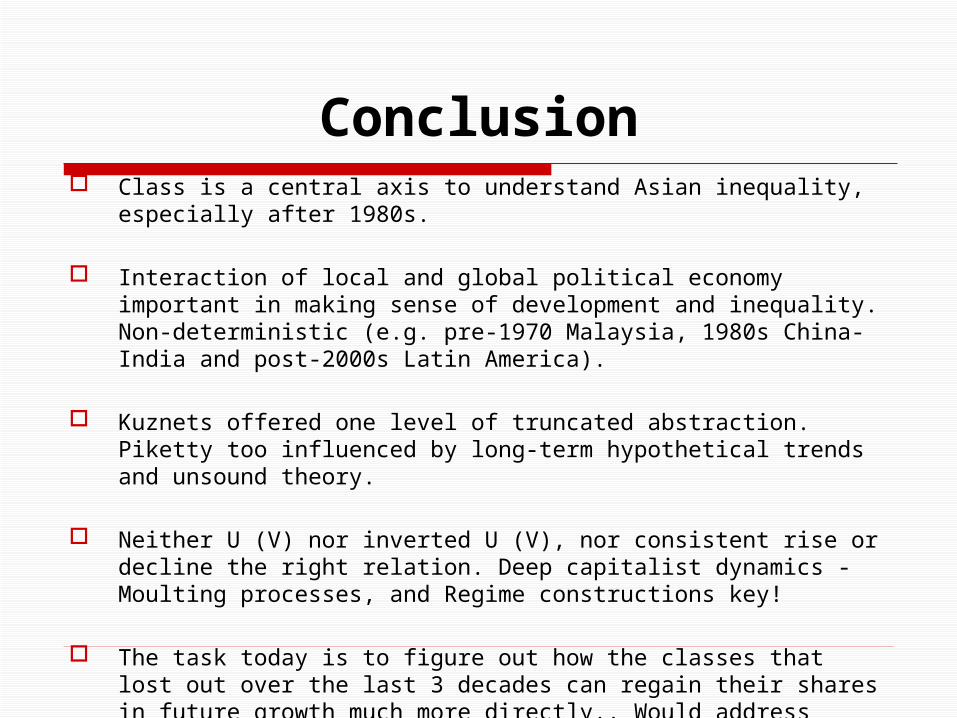
Conclusion Class is a central axis to understand Asian inequality, especially after 1980s.
Interaction of local and global political economy important in making sense of development and inequality. Non-deterministic (e.g. pre-1970 Malaysia, 1980s China-India and post-2000s Latin America).
Kuznets offered one level of truncated abstraction. Piketty too influenced by long-term hypothetical trends and unsound theory.
Neither U (V) nor inverted U (V), nor consistent rise or decline the right relation. Deep capitalist dynamics - Moulting processes, and Regime constructions key!
The task today is to figure out how the classes that lost out over the last 3 decades can regain their shares in future growth much more directly.. Would address effective demand as well as the rising inequality trends.