Embed Size (px)
Citation preview

NBER WORKING PAPER SERIES
VALUING THE VOTE: THE REDISTRIBUTION OF VOTING RIGHTS AND STATE FUNDS FOLLOWING
THE VOTING RIGHTS ACT OF 1965
Elizabeth U. CascioEbonya L. Washington
Working Paper 17776http://www.nber.org/papers/w17776
NATIONAL BUREAU OF ECONOMIC RESEARCH1050 Massachusetts Avenue
Cambridge, MA 02138January 2012
We thank Bill Fischel, Alan Gerber, Claudia Goldin, Naomi Lamoreaux, Ethan Lewis, Sendhil Mullainathan,Gavin Wright and seminar participants at Dartmouth College, Hunter College and the University ofMiami for helpful conversations in preparation of this draft. Cascio gratefully acknowledges researchsupport from Dartmouth College, and Washington gratefully acknowledges research support fromthe National Science Foundation. All errors are our own. The views expressed herein are those of theauthors and do not necessarily reflect the views of the National Bureau of Economic Research.
NBER working papers are circulated for discussion and comment purposes. They have not been peer-reviewed or been subject to the review by the NBER Board of Directors that accompanies officialNBER publications.
© 2012 by Elizabeth U. Cascio and Ebonya L. Washington. All rights reserved. Short sections of text,not to exceed two paragraphs, may be quoted without explicit permission provided that full credit,including © notice, is given to the source.
Valuing the Vote: The Redistribution of Voting Rights and State Funds Following the Voting RightsAct of 1965Elizabeth U. Cascio and Ebonya L. WashingtonNBER Working Paper No. 17776January 2012JEL No. D72,H7,I2,J15,N32
ABSTRACT
The Voting Rights Act of 1965 (VRA) has been called one of the most effective pieces of civil rightslegislation in US history, having generated dramatic increases in black voter registration and blackvoter turnout across the South. We show that the expansion of black voting rights in some southernstates brought about by one requirement of the VRA – the elimination of literacy tests at voter registration– was accompanied by a shift in the distribution of state aid toward localities with higher proportionsof black residents, who held newfound power to affect the reelection of state officials, a finding thatis consistent with models of distributive politics. Our estimates imply an elasticity of state transfersto counties with respect to turnout in presidential elections – the closest available measure of enfranchisement– of roughly one.
Elizabeth U. CascioDepartment of EconomicsDartmouth College6106 Rockefeller HallHanover, NH 03755and [email protected]
Ebonya L. WashingtonYale UniversityBox 826437 Hillhouse, Room 36New Haven, CT 06520and [email protected]

I. INTRODUCTION
The Voting Rights Act of 1965 (VRA) has been called one of the most effective pieces of
civil rights legislation in United States history (Grofman and Handley 1998). By 1967, black
voter registration rates in all southern states exceeded 50 percent, compared with less than eight
percent in Mississippi just prior to the legislation’s passage.1 Black voter turnout increased
commensurately (United States Commission on Civil Rights 1968). Academic research supports
the contention that the federal government’s forcible removal of voter registration barriers, in
particular literacy tests, causally increased black registration relatively and absolutely (Alt 1994),
and increased county turnout by an increasing function of the county’s black population share
(Filer, Kenny, and Morton 1991).
While the initial increases in black voting and later increases in black office holding are
noteworthy (Grofman and Handley 1998, Washington 2011), the VRA was predicted to do much
more than allow blacks entrée to voting booths or even elected offices. The franchise was viewed
as the gateway to equality in other aspects of life (Button 1989). “If Negroes could vote,” Rev.
Dr. Martin Luther King said just months before the Act’s passage, “there would be no oppressive
poverty directed against Negroes, our children would not be crippled by segregated schools and
the whole community might live together in harmony” (Herbers 1965). While harmony may be a
nebulous concept, public funding for education, transportation, and other services to improve the
quality of life in local communities is quantifiable. Longitudinal case studies of Tuskegee, AL
and Durham, NC (Keech 1968) and six Florida communities (Button 1989) document, following
passage of the Act, an improvement in public services (e.g., street paving, garbage collection,
fire and police services) in black neighborhoods that is suggestive of an effect of
1 We define the South to include the 11 states of the former Confederacy: Alabama, Arkansas, Florida, Georgia, Louisiana, Mississippi, North Carolina, South Carolina, Tennessee, Texas, and Virginia.
1

enfranchisement. We examine whether the case study evidence is reflective of a causal impact of
voting rights on public resource receipt more generally.
More specifically, we exploit the federal removal of a state barrier to black voting, the
literacy test, in order to estimate the impact of enfranchisement on the receipt of public
resources. In accordance with models of distributive politics described in the next section, the
removal of literacy tests should have strengthened incentives for state elected officials to direct
funding toward blacks, who held newfound power to affect their reelection. We therefore test for
shifts in the distribution of state transfers toward localities with larger black population shares in
states that had literacy tests prior to passage of the VRA. To account for the possibility that both
voting rights and state funds would have been redistributed toward blacks in the absence of the
legislation, we use southern states without literacy tests – but with histories of slavery and black
disenfranchisement – as a comparison group. The treatment and comparison counties show
similar pre-trends in the gradients of both voter turnout and state transfers in black share,
pointing to the credibility of our research design.2 Our findings are also robust to controlling for
correlates of state transfers to localities identified by previous research, like budgetary lags and
local need, as well as for correlates of state transfers specific to our setting, related to court-
ordered school desegregation, black political activism, and legislative redistricting.
We find shifts in state transfers toward localities with larger black populations after the
VRA in states where literacy tests were removed as a result of the Act. We estimate that the
mean county in a literacy test state saw an increase in per-capita transfers of 12.4 percent more in
the decade and a half following the VRA than a comparison county with the same black
population share. More generally, the elimination of the literacy test generated an additional five
2 Results further withstand trimming to create common support in 1) black share and 2) propensity to be located in a literacy test state, as well as inverse propensity score weighting.
2

percent increase in per-capita state transfers for each additional ten percentage point increase in a
county’s 1960 black population share. Consistent with previous work and with an effect on
enfranchisement, we also see relatively large increases in voter turnout in areas with higher black
population shares in treated states over this time period. We cannot reject the null hypothesis that
the elasticity of state transfers with respect to voter turnout is one. Moreover, the relatively large
changes in the distribution of state aid and voter turnout in treated states are closely timed with
the introduction of the legislation, further supporting interpretation of our estimates as the causal
impact of enfranchisement on state resource receipt. This impact, we should be clear, is not
through the channel of black representation, as the large increase in black elected officials lagged
the passage of the Voting Rights Act by about two decades.
Our focus on the impact of enfranchisement may put some readers in the mind of Husted
and Kenny (1997) and Kenny and Lott (1999), who find that the expansion of the franchise to
lower income voters and to women tilted policy toward greater welfare spending. Similarly,
Miller (2008) finds that women’s suffrage led to increased public health spending. We differ
from this line of work in that our interest lies not in the impact of enfranchisement on the level of
spending, but on the distribution of that spending.3 That is, we ask, holding size constant, do
increased voting rights lead to an increase in the share of government funding? Our paper is also
related to work showing an association between local turnout and government transfers. For
example, Strömberg (2004) demonstrates a causal relationship between county radio ownership
and New Deal dollars received; he estimates that about 10 percent of the effect is through radio-
driven turnout increases.4 The crucial distinction between this line of work and our own is that
3 The geography-based approach that we use here could not be used to study the distributional impacts of the constitutional amendments that enfranchised women and 18-21 year olds, two groups whose spatial distribution is more equal across localities. 4 See also Fleck (1999) and Martin (2003).
3

their focus is on the impact of the decision to exercise the franchise, while our focus is on the
impact of gaining it.
Our findings suggest a causal link between electoral participation and the geographic
distribution of state funds. These findings are of both historical and modern-day significance.
The lion’s share of these state grants was targeted for public education – one of those aspects of
life Dr. King and other civil rights activists hoped would improve once blacks regained the right
to vote. Southern black disenfranchisement following Reconstruction was in fact accompanied
by sharp declines in school expenditures per black pupil (Margo 1990, Naidu 2010). Our
findings suggest that black re-enfranchisement in the 1960s generated an influx of state funds to
enable a reversal in those declines. The impact of voting rights on public funding may also be a
modern-day policy concern. In recent years, states have passed legislation increasing
requirements for voter registration, for example by requiring the presentation of government-
issued photo identification at polling places. These laws are expected to have their greatest
impact on young, poor, and minority voters, and have recently been called “the most concerted
effort to restrict the right to vote since before the Voting Rights Act of 1965” (Lewis 2011).
We proceed with the paper as follows. In Section II, we provide theoretical motivation. In
Section III, we describe the history of voting rights in the South, and in Section IV, we discuss
our main data sources. We present graphical results in Section V, followed by regressions,
robustness checks, and investigations of mechanisms in Section VI. In Section VII, we provide
evidence against black elected officials as a potential channel. In Section VIII, we conclude.
II. THEORETICAL MOTIVATION
The theoretical distributive politics literature (see, for example, Cox and McCubbins
(1986), Lindbeck and Weibull (1987), Dixit and Londregan (1996 and 1998)) suggests that black
4

enfranchisement following the VRA should have weakly increased public resources flowing to
black communities. In these models, politicians or parties distribute resources to clearly
identifiable constituent groups in order to maximize votes. Whether the politician should direct
more resources to her core supporters or to swing voters is of ongoing debate. The answer to the
question depends on the modeler’s assumptions about the politician’s risk aversion and the
efficiency of targeting various groups and on the various groups’ marginal voting response
(turnout, choice) to political resource receipt. But whether the politician should direct resources
to the enfranchised or unenfranchised is not in question.
Blacks in the South, following the passage of the VRA, were theoretically an attractive
and easily targeted interest group for political patronage. Blacks were both geographically
identifiable and tended to vote cohesively (Keech 1968). Given the relative deprivation of black
neighborhoods, black voters also likely had a high marginal utility of school, road, or other
neighborhood improvements. And although blacks did not comprise a majority of the electorate,
this would not have precluded a causal relation between their voting eligibility and their public
goods receipt. Unlike in legislative voting in which politicians must take a single side of the
issue thereby disappointing voters with the opposing view, politicians may distribute resources
such as school and road improvements to several constituent groups in order to build a winning
coalition. We examine empirically the extent to which black voters were so targeted.
III. HISTORY OF BLACK VOTING RIGHTS IN THE SOUTH
Following Reconstruction, legislatures in the states of the former Confederacy began to
curtail the voting rights granted to black men by the 15th amendment.5 Beginning in 1890, each
of these states enacted a combination of grandfather clauses, all-white primaries, poll taxes, and
5 Initially, these rights were limited extra-legally, through violence, intimidation, and voter fraud.
5

literacy tests among other creative legislation to prevent blacks from participating in local, state,
and federal elections.
While in a few cases a state eventually removed one of these voting obstacles by its own
volition, in the vast majority of cases, these laws were removed by federal intervention.
Grandfather clauses, limiting the franchise to those men who held it before the Civil War and
their male descendants, were declared unconstitutional by the Supreme Court in 1915. In 1944,
the court outlawed all white primaries, which were held to varying extents in all 11 southern
states (Key 1949). The ratification of the 24th amendment in 1964 ended poll taxes in federal
elections6 in the four southern states that had not previously ceased the practice. All of the states
of the former Confederacy adopted poll taxes initially. However, Key (1949) argues that upon
the adoption of the all-white primary the poll tax was no longer a binding constraint on black
voting: “It became simply a tax on voting by whites and nothing more” (p. 579).
Our identification strategy exploits the exogenous end to the use of the literacy test—a
registration requirement that from its conception to its termination in 1965 was aimed primarily
at disenfranchising black voters (Key 1949). In fact, by the time of the passage of the VRA, the
literacy test was the key obstacle to black voter registration. All seven of the former confederate
states that ever adopted literacy tests – Alabama, Georgia, Louisiana, Mississippi, North
Carolina, South Carolina and Virginia – kept these laws on their books until the VRA forbade
the practice in 1965.7 While de jure these tests, which often required an applicant to read and/or
write a section of the United States Constitution, applied equally to potential voters of all races,
de facto these laws were more likely and more strictly enforced against black applicants (Key
6 The Supreme Court Case Harper v. Board of Elections ended poll taxes for state elections in 1966. 7 The initial passage of the VRA forbade literacy tests in Alabama, Georgia, Louisiana, Mississippi, South Carolina, Virginia and forty counties in North Carolina. These jurisdictions were singled out because they 1) used an illegal registration device (literacy test) and 2) had voter registration or turnout of under 50 percent. With the renewal of the law in 1970, Congress outlawed literacy tests nationwide.
6

1949). Suggestive of this, we find in the 1960 cross section of counties in states with a literacy
test that a ten percentage point increase in county black population share is associated with a four
percentage point decrease in county turnout for the presidential election, even controlling for the
county’s high school graduation rate. By comparison, the association is a ten percentage point
increase in black share and a one percentage point decrease in turnout in the non-literacy test
southern states of Arkansas, Florida, Tennessee and Texas.8
Following the March 1965 televised beating of civil rights activists peacefully marching
from Selma to Montgomery in what would come to be known as “Bloody Sunday,” President
Johnson was able to introduce, secure passage in Congress, and sign into law the VRA in just
five months. In addition to outlawing literacy tests, the VRA ended discriminatory practices that
were prevalent throughout the South, such as redrawing districts to prevent blacks from attaining
elected office. 9 The nondiscrimination requirements, like the vast majority of the VRA, apply to
all southern states – in fact all states across the nation – not just those that made use of literacy
tests in the registration process. Where the law differs by jurisdiction is in regards to Section V,
which mandates preclearance by the United States Department of Justice for any change in
electoral procedure. The seven former literacy test states as well as Florida and Texas are subject
to preclearance.10
We next describe the data and methodology we will employ to ascertain how the VRA’s
elimination of literacy tests impacted black enfranchisement and consequently, we argue, the
distribution of public resources across communities of varying racial composition.
8 Regressions are weighted by 1960 county population. 9 The prohibition included all levels of political jurisdictions, including school districts. 10 Jurisdictions are subject to Section V preclearance because of past use of an illegal device (in the case of Florida and Texas, failure to provide Spanish language voting materials) and low turnout. There are also several areas outside of the South that are subject to preclearance, primarily because of failure to provide foreign language voting materials.
7

IV. DATA
A. Data on State Transfers to Localities
We examine within-state shifts in the distribution of voting rights and public resource
receipt in the South from the 1950s to the early 1980s, a period surrounding the passage and
enforcement of the VRA. As described above, we focus on whether the new mandate resulted in
state governors and legislators, who control state finances, directing more of those funds to black
communities, who held newfound power to affect their reelection.
Thus, our key dependent variable is per-capita state transfers to localities. This
information has been collected by the Census of Governments (COG) every five fiscal years for
decades. We focus on the years 1957 through 1982. During this sample period, state transfers to
localities made up about one-third of state expenditures nationwide and in the South. The
strength of state transfers to localities as an outcome variable is that the recipients of these
transfers are geographically identifiable; it is hard to tell which state residents are benefitting
from the remaining two-thirds of spending (Ansolabehere, Gerber, and Snyder 2002).
Throughout the sample period, the vast majority of state transfers to localities (73 percent in the
South and 60 percent nationwide) were for education. General spending and highway funds each
constituted 10 percent of these transfers in the South. The pattern of transfers by funding type
does not vary significantly over the sample period (United States Department of Commerce
1957, 1962, 1977 and 1982).
The COG files that we use report state intergovernmental transfers to local jurisdictions
(e.g., counties, municipalities, townships, school districts, and special districts) aggregated to the
county (and year) level. An advantage to using the county as our unit of analysis is that counties
8
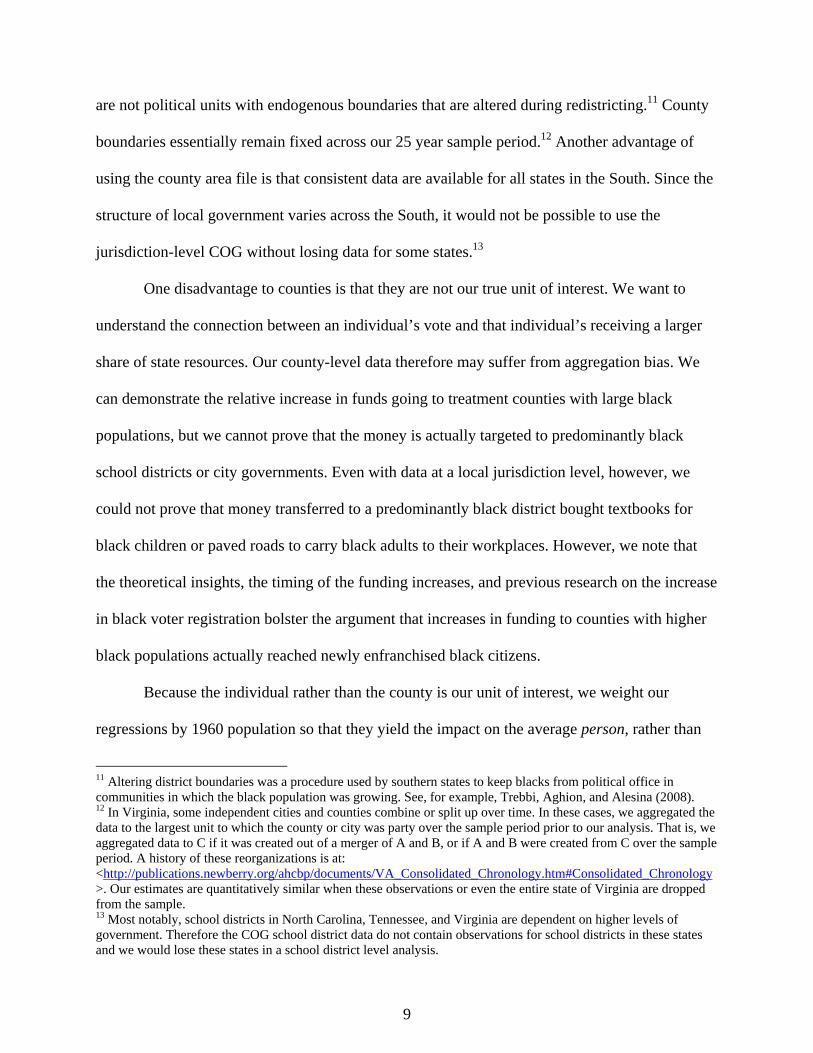
are not political units with endogenous boundaries that are altered during redistricting.11 County
boundaries essentially remain fixed across our 25 year sample period.12 Another advantage of
using the county area file is that consistent data are available for all states in the South. Since the
structure of local government varies across the South, it would not be possible to use the
jurisdiction-level COG without losing data for some states.13
One disadvantage to counties is that they are not our true unit of interest. We want to
understand the connection between an individual’s vote and that individual’s receiving a larger
share of state resources. Our county-level data therefore may suffer from aggregation bias. We
can demonstrate the relative increase in funds going to treatment counties with large black
populations, but we cannot prove that the money is actually targeted to predominantly black
school districts or city governments. Even with data at a local jurisdiction level, however, we
could not prove that money transferred to a predominantly black district bought textbooks for
black children or paved roads to carry black adults to their workplaces. However, we note that
the theoretical insights, the timing of the funding increases, and previous research on the increase
in black voter registration bolster the argument that increases in funding to counties with higher
black populations actually reached newly enfranchised black citizens.
Because the individual rather than the county is our unit of interest, we weight our
regressions by 1960 population so that they yield the impact on the average person, rather than
11 Altering district boundaries was a procedure used by southern states to keep blacks from political office in communities in which the black population was growing. See, for example, Trebbi, Aghion, and Alesina (2008). 12 In Virginia, some independent cities and counties combine or split up over time. In these cases, we aggregated the data to the largest unit to which the county or city was party over the sample period prior to our analysis. That is, we aggregated data to C if it was created out of a merger of A and B, or if A and B were created from C over the sample period. A history of these reorganizations is at: <http://publications.newberry.org/ahcbp/documents/VA_Consolidated_Chronology.htm#Consolidated_Chronology >. Our estimates are quantitatively similar when these observations or even the entire state of Virginia are dropped from the sample. 13 Most notably, school districts in North Carolina, Tennessee, and Virginia are dependent on higher levels of government. Therefore the COG school district data do not contain observations for school districts in these states and we would lose these states in a school district level analysis.
9

the average county. As shown in the upper panel of Table 1, the weighted mean per-capita state
transfer to local governments in states that had literacy tests prior to the VRA was $356 (2009
dollars) in the pre-period (the average of the 1957 and 1962 figures) and $763 in the post-period
(the average of the 1977 and 1982 figures). The figures are $317 and $674 in the other southern
states.14 Because we are interested in within-state changes in the distribution of this aid and states
vary in their average aid levels, we use the natural log of per-capita state transfers in our
regression estimation. The growth rate of per-capita state transfers over the twenty-year period is
on average 82 percent in states with literacy tests and 76 percent in the remainder of the South.
One complication to the state transfer data is that not all funds that the state reports
transferring originate with the state. Some federal “pass through” money – funds that the federal
government provides to localities through states – is included, though it is estimated to be less
than 15 percent of the total in most states (Ansolabehere, Gerber, and Snyder 2002). To the
extent that state governments have discretion over how to distribute these federal funds, their
inclusion in transfer totals does not bias our estimates of the amount that state officials decide to
transfer to each locality. Rather, the concern is that the nondiscretionary dollars may be
correlated with increases in enfranchisement following the VRA.15 We know, for example, that
predominantly black areas were more likely to be allocated federal funds for education due to the
Elementary and Secondary Education Act of 1965 (ESEA). We address this issue by controlling
in our preferred specifications for the 1960 child poverty rate, the primary determinant of county
ESEA formula amounts.
B. Data on the Local Electorate
14 Our estimation sample includes all counties in the 11 southern states (aggregated to account for the consolidations and splits in Virginia), save two for which we are missing control variables. 15 The degree of state discretion over federal pass-through funds was curtailed during this period by the non-discrimination clause in the Civil Rights Act, which required either nondiscrimination or nonparticipation in federal programs.
10

Ideally, we would start with a “first stage” demonstrating the impact of literacy tests on
voter enfranchisement, or potential voter turnout. However, we do not have a measure of
enfranchisement. As a substitute, we consider actual voter turnout as a share of the voting age
population at the county level, drawing on data spanning the years 1952 to 1980.16 Turnout in
presidential elections is higher than in any other electoral contest. Therefore the presidential
turnout rate gives us our best measure of potential turnout. Nonetheless, given our focus on state
transfers, which are controlled by state elected officials, we also consider turnout rates for
gubernatorial elections. The limitation of gubernatorial elections as an outcome is their
variability. Because these elections vary across states and years in their timing, their procedures,
and their competitiveness, they are more difficult to compare across localities than presidential
elections, in which the whole country chooses from the same two candidates on the same day.
Our focus will thus be on presidential turnout, though results for gubernatorial turnout under all
specifications presented below are available on request.
The top panel of Table 1 presents summary statistics on voter turnout by presence of a
literacy test, again weighting by 1960 county population. As expected, turnout is lower and more
variable in gubernatorial elections. Consistent with the impacts of literacy tests previously
estimated applying differences-in-differences to state-by-year data (e.g., Besley and Case 2003),
states with literacy tests saw relatively large gains in voter turnout over time. Voter turnout in
states with literacy tests converged with, if not surpassed, that elsewhere in the South by the end
of the period. Our empirical approach will illuminate how those gains in turnout varied by
county racial makeup within states.
16 Turnout data come from Matt Gentzkow and Jim Snyder and from various editions of America Votes. An alternative proxy for enfranchisement would be voter registration by race. We employ turnout in this analysis because registration data are both infrequent and missing for a large number of southern counties (mainly entire states), particularly in the post-VRA period.
11

C. Other County Characteristics
We draw from a number of other data sources (described in the Appendix) to construct
controls for the analysis to follow. These variables are summarized in Panel B of Table 1, again
weighting by 1960 county population. Counties in states with literacy tests on average had both
higher black population shares (29 percent versus 15.3 percent elsewhere in the South) and
higher child poverty rates in 1960 (24.3 percent versus 17.5 percent). At that time, counties in
literacy test states were also more likely to be under court order to desegregate (51.4 percent
versus 43.8 percent), although counties in the two types of states saw similar receipt of funds
under the Emergency School Aid Act of 1972 (39 percent versus 37.6 percent), a federal
program intended to facilitate racial integration of schools. As for proxies for black political
activism, counties in both states were equally likely to be home to black colleges. However,
NAACP chapters were more often located in counties in states without literacy tests, while other
black organizations were more frequently found in counties in states with literacy tests. The
population growth rate over the 1950s was relatively low in literacy test states, though the two
regions experienced similar changes in the demographic composition of their populations over
the next two decades.
V. EVENT-STUDY ESTIMATES
Recall that the elimination of literacy tests following the VRA should have had a larger
impact on voting rights in counties where a higher fraction of the voting age population would
have been denied the franchise through their enforcement. In principle, literacy tests should have
been administered to all applicant registrants, but the historical record suggests that they were
applied disproportionately – if not solely – to blacks. A transparent approach to estimating the
impact of literacy tests on the within-state distribution of state transfers is therefore to explore
12
how the gradient of transfers in pre-existing county black share changed over time within states
where literacy tests were forcibly removed by the VRA. If literacy tests had an impact, we would
expect to see a change in this gradient around 1965, i.e., a shift in the distribution of state
transfers toward areas with larger black population shares. We should also observe a similar shift
in voter turnout to reflect the change in the distribution of the electorate, as has been documented
in previous work (Filer, Kenny, and Morton 1991).
One problem with this approach is that both state aid and voter turnout may have been
redistributed toward areas with larger black shares even in the absence of literacy tests being
removed by the VRA. For example, black activism during the civil rights movement, either
directly or through an impact on black voter turnout, may have yielded rewards in the form of
more state aid for localities with higher black shares. School desegregation in the South, which
began in earnest after passage of the Civil Rights Act of 1964 (Cascio, et al. 2008), was also
associated with larger state funding increases for school districts with higher black enrollment
shares (Reber 2011, Johnson 2011).
We therefore combine the strategy described at the start of this section with the use of a
comparison group. That is, we test whether there were larger shifts in the distribution of state
transfers toward counties with larger black population shares in treated states than in a group of
comparison states, around 1965. Likewise, we should document larger gains in turnout for
counties with larger black population shares in treated states before and after the legislation was
passed, reflecting enfranchisement.17 As described above, we limit the comparison group to
counties in the four states in the South that did not have literacy tests prior to the VRA –
Arkansas, Florida, Tennessee, and Texas. Each of these states has a history of slavery and of
17 We also control for proxies for black political activism and school desegregation within this framework below and find that our estimates are little affected.
13

disenfranchising blacks after Reconstruction: as earlier discussed, all had all-white primaries
until they were outlawed in 1944, and all had poll taxes at some point; indeed, Arkansas and
Texas charged poll taxes in federal elections until 1964, and Texas kept poll taxes for state
elections on the books until 1965.18 While the comparison counties on average had lower black
population shares in 1960 (Table 1), there is significant variation in the geographic distribution
of the black population within each region that can be leveraged for identification. Notably, our
findings are robust to trimming the sample to create greater common support in both black share
and in propensity to be located in a literacy test state and to inverse propensity score weighting.
To set ideas, Figure 1 uses the full sample and shows population-weighted estimates of
the gradients of county voter turnout and per-capita state transfers to the county in 1960 county
black population share, separately by year and treatment status, from models that also include
state indicators. Consider first the estimates for voter turnout rates for presidential elections,
shown in Panel A. The solid circle at about -0.01 for 1952 indicates that, in states with literacy
tests, each percentage point increase in county black share was associated with a one percent
decrease in the turnout rate for the 1952 presidential election. In comparison states (hollow
circles), the gradient of turnout in black share is also negative in 1952, but not as steep. These
relationships remain quite stable through the 1960 election, but flatten out in the treatment and
comparison regions alike in 1964, the last election before the VRA. The change in the black
share gradient in both treatment and comparison counties in 1964 may be due to black voter
registration drives across the South19 or to unusually high interest in the Goldwater-Johnson
18 Poll taxes for state level elections in Alabama, Mississippi, and Virginia were also repealed after the VRA. Below, we test whether elimination of the poll tax can explain our findings. We find that it cannot. 19 Wright (2011) notes that beginning in 1962 the Voter Education Project (VEP), a coalition of five major civil rights organizations coordinated by the Southern Regional Council, supported local groups in a mass registration effort throughout the South that registered 700,000 new voters in two-and-a-half years. Thus one might wonder whether activist groups alone would have eventually closed the gap in black voter registration between literacy and non-literacy test states. This seems unlikely given the violent resistance that hampered the organization’s registration
14

face-off in counties with higher black shares. Regardless, what is clear from the co-movement of
gradients is the need for comparison counties in our estimation strategy.
Our “first stage” result is then seen starkly as we move from the 1964 to the 1968
presidential election, the first held after the passage of VRA. The convergence in average turnout
in counties in treatment states to that in the comparison counties, shown in Table 1, thus appears
to have been driven by relatively large increases in turnout in treatment counties with higher
black population shares. While in the elections prior to the passage of the Act, the treatment
group dots consistently fell 0.005 log points below those for the comparison group, after the
passage of the Act, the solid and hollow circles are nearly atop one another; once literacy tests
are removed, the difference in the black share turnout gradient between treatment and
comparison states is removed as well.
We demonstrate the statistical significance of the closing of this gap in Panel A of Figure
2. Here, we plot estimates of the coefficients θj (with 95 percent confidence intervals) from the
following event-study model:20
(1) cstj
jtcsj
j
jtcjstccst DbllitDbly
19601960
%%ln
where ycst represents the presidential election turnout rate in county c in state s in year t; %blc
represents percent black in c’s 1960 population; lits is an indicator variable set to one if state s
had a literacy test that was removed following the VRA, zero else; and Dtj is an indicator
variable set to one if t = j, zero else. The model also includes county fixed effects, δc, and state-
by-year fixed effects, γst. The former account for fixed differences in turnout across counties,
while the latter account for time-varying, state-specific shocks to turnout including those related
efforts in the Deep South and led the Johnson administration to contemplate federal voting rights legislation even before Bloody Sunday. 20 Standard errors are clustered on county, and the regressions are weighted by 1960 population.
15
to state economic conditions or institutions, such as state rules regarding redistricting.21 The state
fixed effects will also capture the impacts of the VRA on aggregate state turnout.22 Because the
model includes these two sets of fixed effects, we omit the interactions with the indicator for one
pre-VRA election year (e.g., interactions with Dt1960), so that the model is identified. 23 The
coefficient µj then captures the change in the gradient of turnout in black population share
between 1960 and year j for comparison states. Likewise, the sum µj + θj captures that change for
treatment states.
Figure 2 thus presents estimates of the difference in the black share gradients in the
treatment and comparison states shown in Figure 1, relative to the difference observed in some
pre-VRA year. That is, the estimates presented in Figure 2 re-normalize the estimates presented
in Figure 1 so that the difference in the black share gradients between the treatment and
comparison states is zero for some specified year prior to the VRA, e.g., 1960 in the case of
presidential turnout in Panel A. As the pre-VRA (1952, 1956 and 1964) circles indicate, the
treatment-comparison differences in the black share gradients remained almost unchanged (and
statistically indistinguishable) in the elections prior to the passage of the Act. Thus, even though
the comparison counties have some different observable characteristics from the treatment
counties, trends in turnout with respect to black population share are almost identical in the two
groups of states prior to the VRA being passed, suggestive of the validity of the comparison
group. There is a sharp change beginning in 1968, however, reflecting the relatively large
21 The state-by-year fixed effects would also account for any changes in state level political competition. Besley, Persson, and Sturm (2010) argue that the removal of voting barriers increased state political competition and therefore state economic growth. 22 In the analogous regression for per-capita state transfers, they will capture the impacts of the VRA on aggregate state transfers to local governments. We know of no study that has estimated this relationship. Husted and Kenny (1997) document increases in state welfare expenditures following the removal of literacy tests, but the vast majority of state transfers to counties in the South during our sample period (roughly 83 percent) were for either education or highways. 23 The models for gubernatorial turnout and per-capita state transfers differ only in the omitted year.
16

increases in turnout in the highly black counties in states that were no longer allowed to employ
literacy tests as a barrier to registration. The 95 percent confidence interval bars indicate that the
narrowing of the gap in turnout within treatment states is highly statistically significant, and it
remains so over the remainder of our sample period.
In the second panel of each of Figures 1 and 2, we present analogous estimates for
gubernatorial turnout. For tractability, we bin gubernatorial elections into four year periods.
Thus, 1953 includes the first gubernatorial election in the state on or after after January 1,
1953.24 We omit the interactions with the indicator for the 1957-60 period so that the model is
identified. Although these estimates are noisier, they follow a pattern similar to our findings for
presidential turnout. The pre-VRA (1953, 1957 and 1961) trend is similar in treatment and
comparison counties. Between 1961 and 1965, both series show a steep increase; however, the
jump in the treatment series is larger, indicating the relative increase in the black share turnout
gradient in treatment states in 1965. This change is statistically significant, as shown in Figure 2.
Thus, consistent with the findings of Filer, Kenny and Morton (1991), the first two panels
of Figure 1 and Figure 2 provide evidence that outlawing literacy tests increased county turnout
as an increasing function of the county’s initial black population share. In the final panel of the
figures, we ask whether this increase in eligibility-driven turnout was accompanied by an
increase in state transfers received per capita. In these figures, the years are marked in five-
(fiscal) year intervals beginning with 1957, to match the availability of the COG data. Although
we have only two pre-VRA observations, they are quite suggestive of a similar trend: in Figure
1, the treatment and comparison circles are almost exactly on top of one another. Again, this
suggests the validity of the comparison group, as it appears to be capturing what would have
24 That is, in the few states with biennial gubernatorial elections, we use the election closest to the beginning of the interval beginning January 1 of the specified year.
17

happened in the treatment states if literacy tests had remained legal. Having a comparison group
is also again critical: the gradient of state transfers in black population share moves from
negative to positive in both series from 1957 to 1962, reflecting civil rights era gains – in this
case in terms of funding rather than voting rights – that accrued in predominantly black areas
throughout the South.25
The impact of the removal of literacy tests with the VRA on funding patterns can then be
seen in comparing the post-1965 treatment and comparison series. Because of lags in budgeting
and funding, we do not necessarily expect a sharp break in the relative treatment and comparison
patterns in 1967, our first post-treatment year. However, a marked divergence between the two
series does emerge. The difference intensifies in the 1970s, as state aid becomes sharply
redistributive toward areas with higher black populations in the treatment states. Because of the
noisiness of the data, the difference is only significant in 1977, as shown in Figure 2. However,
the coefficients clearly point to an increase in state transfers to accompany the increase in
enfranchisement.
VI. LONG-DIFFERENCE ESTIMATES
A. Baseline Estimates
The graphical evidence is consistent with the elimination of literacy tests having an
impact on both enfranchisement and state transfers. To summarize the event-study results, to
provide a concise means of subjecting the estimates to a number of specification and robustness
checks, and to establish magnitudes, we now move to the long-difference specification.
25 This is likely the continuation of a much longer run trend. Starting in the 1940s, school districts with higher black population shares in the South began to benefit relatively more from increases in state aid for education, which as earlier noted constitutes three-quarters of state transfers to local governments in the South. Initially, these gains in state aid resulted from increases in black teacher salaries associated with NAACP victories in teacher salary equalization cases and tight black teacher labor markets in the South, but they were also undertaken by states in an effort to stave off racial integration of schools (Margo 1990; Donohue, Heckman, and Todd 2002; Ashenfelter, Collins, and Yoon 2006).
18
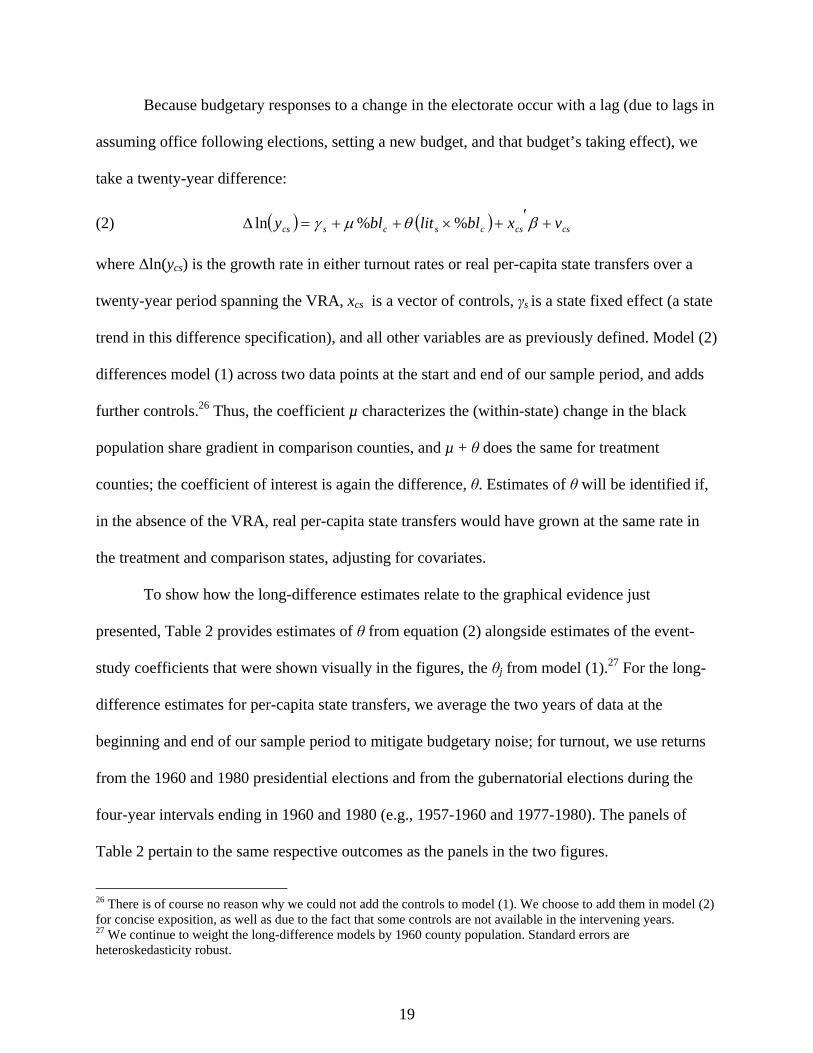
Because budgetary responses to a change in the electorate occur with a lag (due to lags in
assuming office following elections, setting a new budget, and that budget’s taking effect), we
take a twenty-year difference:
(2) cscscscscs vxbllitbly %%ln
where Δln(ycs) is the growth rate in either turnout rates or real per-capita state transfers over a
twenty-year period spanning the VRA, xcs is a vector of controls, γs is a state fixed effect (a state
trend in this difference specification), and all other variables are as previously defined. Model (2)
differences model (1) across two data points at the start and end of our sample period, and adds
further controls.26 Thus, the coefficient µ characterizes the (within-state) change in the black
population share gradient in comparison counties, and µ + θ does the same for treatment
counties; the coefficient of interest is again the difference, θ. Estimates of θ will be identified if,
in the absence of the VRA, real per-capita state transfers would have grown at the same rate in
the treatment and comparison states, adjusting for covariates.
To show how the long-difference estimates relate to the graphical evidence just
presented, Table 2 provides estimates of θ from equation (2) alongside estimates of the event-
study coefficients that were shown visually in the figures, the θj from model (1).27 For the long-
difference estimates for per-capita state transfers, we average the two years of data at the
beginning and end of our sample period to mitigate budgetary noise; for turnout, we use returns
from the 1960 and 1980 presidential elections and from the gubernatorial elections during the
four-year intervals ending in 1960 and 1980 (e.g., 1957-1960 and 1977-1980). The panels of
Table 2 pertain to the same respective outcomes as the panels in the two figures.
26 There is of course no reason why we could not add the controls to model (1). We choose to add them in model (2) for concise exposition, as well as due to the fact that some controls are not available in the intervening years. 27 We continue to weight the long-difference models by 1960 county population. Standard errors are heteroskedasticity robust.
19
Consider first the estimates for voter turnout rates. The significant 0.00458 in column 2
of Panel A indicates that each one percentage point increase in black population share is
associated with a 0.46 percent increase in presidential turnout in treatment counties relative to
comparison counties. This amounts to a 13.3 percent increase at the mean of 1960 black
population share in treatment counties (29 percent, given in Panel B of Table 1). Over the twenty
year period, presidential turnout in treatment counties increased by about ten percentage points
(Panel A, Table 1), to nearly close the gap with comparison counties. Our estimates suggest that
half of the relative gain in turnout in treatment states can be attributed to the removal of literacy
tests.28 The removal of literacy tests in treatment counties served not only to increase turnout
significantly in presidential elections, but in state level gubernatorial elections as well, as shown
in Panel B.
These findings suggest that following the VRA, enfranchisement significantly increased
in black share at an increasing rate at both the federal and state levels, providing new incentives
for state officials to distribute state resources to counties with larger black shares. Consistent
with this, the significant 0.00429 coefficient in the final column of the table indicates that each
one percentage point increase in black population share is associated with a 0.43 percent increase
in per-capita state transfers in treatment counties relative to the comparison counties, an effect
that is the average of the 1977 and 1982 coefficients shown in the event-study specification.29
This estimate implies that each additional ten percentage point increase in 1960 black share was
associated with an additional five percent increase in relative transfers, or a 12.4 percent relative
28 The percent black main effects are about the same size and are statistically significant, shown in Table A2. As treatment counties have a higher black share on average, the general increase in voting access for blacks throughout the South during this time period is also likely a factor in narrowing the gap. 29 While we chose a 20 year difference in part because of the ease with which one can obtain decennial controls at the county level, one can see from comparing the 1972 and 1982 state transfer event study coefficients, that our results would be nearly identical if we chose to average 1972 and 1977 for our post period instead of 1977 and 1982.
20

increase over the twenty-year period at the mean of 1960 black population share in treatment
counties.
Because we are interested in the impact of enfranchisement on state transfers, ideally we
would normalize this estimate by the increase in voter eligibility in these counties. As we
explained earlier, our best proxy for voter eligibility is presidential voter turnout. Normalizing
our transfer results by our turnout results using a two-stage least squares (2SLS) model, where
we instrument for the growth in presidential turnout with lits x %blc, we estimate that a one
percent increase in turnout increased county residents’ state resources by 0.94 percent. We
cannot rule out that the elasticity of transfers with respect to turnout is one.30
We show this 2SLS estimate in the first column of Table 3, after repeating the estimates
of θ from model (2) for presidential turnout and real per-capita state transfers, respectively. As a
point of comparison, the final row in the first column gives the OLS relationship between
transfers and turnout. This relationship is close to zero and statistically insignificant. There is
great variation in turnout from election to election, much of which is explained by state-year
swings in competitiveness in the election. We posit an impact on a county’s share of resources
through permanent changes in eligibility, not through transitory swings in interest. The OLS
estimate is significantly lower than 2SLS, suggesting that swings in turnout within counties over
time do indeed contain a great deal of variation that is orthogonal to the distribution of state
resources.31 Our instrument (lits x %blc) explains only one percent of the variation in turnout
30 We can compare our elasticity to Strömberg (2004) and Fleck (1999) who estimate elasticities of New Deal Funds received with respect to turnout of 0.57 and 0.66 respectively. These authors’ variation in turnout is driven by cross-county differences in the decision to exercise the franchise, rather than by county-by-time variation in enfranchisement. (Whether one exercises that power or not, the initial receipt of the franchise grants citizens a measure of power over the politician). Given the different time period, geographic focus, and source of variation in turnout, it is not surprising that our estimates differ from previous studies. 31 An alternative interpretation is that OLS is biased downward because turnout is higher when state resource receipt is lower.
21

growth. But this variation, stemming from eligibility, is precisely the variation that should impact
resource distribution.
B. Sensitivity to Basic Controls and Specification Checks
The remainder of Table 3 examines the sensitivity of the results of Table 2 to variations
on the specification. We begin by adding some basic controls. As described above, state
education agencies had limited discretion to deviate from the formula amounts allocated to
counties by the federal government under Title I of the ESEA, which are included in our state
transfer measure and are positively correlated with black enrollment share.32 More specifically,
the formula amounts were the product of two factors: (1) the county’s eligibility rate, determined
principally on the basis of the share of its school-aged children living in poverty as of the
previous Census (a strong correlate of %blc); and (2) one half of average spending on education
in the state per pupil (net of federal transfers) two years before (the “state factor”), which was
slightly higher in the comparison region.33 The formula amounts are thus negatively correlated
with the explanatory variable of interest, lits x %blc. Failure to account for this will therefore
make it appear that state politicians were less responsive to changes in the distribution of the
electorate following the removal of literacy tests than they actually were.
To remove this bias, in the second column of Table 3 we add to our baseline specification
the 1960 child poverty rate used in the Title I formula, individually and interacted with lits.34 The
32 The role of the state education agency was mainly to approve applications for Title I funds submitted by school districts. Approval was mostly a rubber stamp, as the vast majority of school districts receiving any money received their full allocation. A number of school districts did not receive the Title I funds at all because they failed to comply with the nondiscrimination provisions of Title VI of the 1964 Civil Rights Act. See Cascio, at al. (2010). 33 In the third year of the program (fiscal year 1968), the state factors for states spending below the national average were leveled up to that average, but variation in state factors remained for higher-spending states (see U.S Department of Health, Education, and Welfare 1969; Cascio, et al. 2010, Cascio, Gordon, and Reber 2011). In fiscal year 1977, Florida and Virginia had state factors above the minimum. 34 Our estimates are substantively similar when we use the 1970 poverty rate, which would have been used in allocating grants in fiscal years 1977 and 1982, in lieu of the 1960 poverty rate. We choose not to use the 1970 property rate in our main specification since it would have been determined after implementation of the VRA.
22
new controls enter with the expected signs. As shown in Table A1, the relationship between
1960 child poverty and per-capita state transfers is positive: the federal government’s allocation
formula for Title I was an increasing function of child poverty.35 The interaction with lits is
negative, reflecting the fact that another component of the allocation formula was based on
matching state efforts, and states with literacy tests on average spent less on education.
Consistent with expectations, the 2SLS estimates increase in magnitude, reflecting an increase in
the magnitude of the reduced-form estimate for state transfers. In the third column of the table
we allow child poverty to enter more flexibly, interacting it with state dummies rather than with
lits. The increased flexibility leaves our estimates more precise, but does not affect their
magnitudes. In the remainder of the paper, we treat the simpler specification (column 2) as our
base model.
The remainder of Table 3 is devoted to specification checks. The differences in mean
characteristics of treatment and comparison counties (Table 1) may raise the concern that
counties in states without literacy tests are not valid comparisons for counties in states with such
tests. Our pre-trend analyses in Figures 1 and 2 support the validity of our comparison group. We
provide further support for our identification assumption in the remaining columns of Table 3 in
which we investigate the possibility of bias due to a lack of common support using three
different approaches. First, in column 4, we restrict the sample to counties with a 1960 black
share at least as great as the 10th percentile of the distribution for comparison counties (2.2
percent) and no more than the 90th percentile of the distribution for treatment counties (49.9
percent). This restriction eliminates about a quarter of our sample but narrows the difference in
35 While Table A1 provides the coefficients on controls for the state transfer specifications, Table A2 provides the coefficients on controls for presidential turnout specifications.
23

average black population share across the two groups.36 Second, in column 5, we trim the sample
following a more standard propensity matching approach. We estimate the propensity score
using a logit regression of an indicator for a literacy test prior to the VRA on 1960 black share,
1960 child poverty, and the interaction of the two variables.37 We then restrict the sample to
counties with propensity scores above the minimum in the literacy test counties and below the
maximum in the non-literacy test counties. Using this method we retain more than 95 percent of
our sample. Third, in the final column of the table we use the propensity scores both to trim our
sample as in the previous column and to weight our regressions.38 Reweighting eliminates
significant differences in all but three39 of 13 county characteristics summarized in Table 1.
Results are robust to the three approaches. Based on the evidence of Table 3 coupled with the
trends presented in Figures 1 and 2, it therefore does not appear that a lack of common support is
biasing our estimates.
C. Alternative Mechanisms
We have found robust evidence that the removal of literacy tests increased the growth in
per-capita state transfers to localities with higher black population shares. Recall that our
empirical strategy was designed to account for other reasons, besides black enfranchisement, that
southern state governments may have redistributed aid toward black communities over our
analysis period. Thus we postulate that the mechanism by which these tests impacted funding
was voting eligibility. However, we recognize that other changes in state funding of local
governments with higher black shares may have occurred during this time period – changes
36 In the restricted sample, the mean 1960 black population share is 26.2 percent in the treatment and 16.1 percent in the comparison states. 37 We weight the logit by 1960 population. 38 More specifically we assign treatment counties weights of 1*(1960 population), and we assign comparison counties weights of the odds ratio of the propensity score multiplied by 1960 population. 39 They are presence of another black organization and changes in percent 5-17 and percent unemployed.
24

beyond the introduction of Title I. We now explore a number of alternative explanations for our
findings related first to our particular setting and second to the distribution of state transfers more
generally.
C.1. Setting-Specific Predictors of State Transfers
Rather than reflecting an effort to court newly-enfranchised black voters, politicians in
treatment states may have been motivated to direct more state aid to counties with higher black
population shares to “hold harmless” whites in the wake of school desegregation (Reber 2011),
which occurred over roughly the same time period (Cascio et al. 2008). When black and white
schools were separate and blacks were disenfranchised, white school boards tended to
expropriate money allocated by the state for black pupils for white schools. Where there were
more black students relative to whites, there was greater scope for white pupils to profit. As a
result, racial gaps in school resources prior to school desegregation – and the funding necessary
to “level up” spending on black students afterward (Reber 2011) – tended to be larger the higher
a district’s black enrollment share (Bond 1934; Margo 1990). If a desire to equalize spending on
black and white students without decreasing spending on whites motivated redistribution toward
counties with higher black population shares, this motivation may have been stronger in states
with literacy tests, which on average had larger black-white gaps in school quality prior to 1965
(Card and Krueger 1992).
That said, there were states with literacy tests removed as a result the VRA that had
largely eliminated racial gaps in school quality by the mid-1960s. If our findings hold for this
subset of states, it would help to rule out this alternative explanation for our findings. Columns 2
and 3 of Table 4 define this subset of states in two different ways. (Column 1 repeats our
preferred specification for comparison.) In column 2, we limit the sample to the five southern
25

states – two with literacy tests (Alabama and Georgia) and three without (Florida, Tennessee,
and Texas) – reported by Card and Krueger (1992) to have eliminated black-white gaps in pupil
teacher ratios, teacher salaries, and term lengths by 1966, at which point black and white schools
were still largely separate (Cascio et al. 2008). In column 3, we drop the four treatment states
that consistently exhibit the largest black-white gaps in pupil-teacher ratios over the early 1960s
– Mississippi, Arkansas, South Carolina, and Louisiana.40 The reduced-form estimates for
turnout are higher for these subsets of states. The reduced-form estimates for state transfers are
as well, and the 2SLS estimates are in fact larger than at baseline.
These findings suggest that efforts to appease white families in the face of school
desegregation do not explain our findings. But school desegregation may be affecting our
estimates through another channel: southern districts with higher black enrollment shares were
more likely to desegregate under court order (Cascio et al. 2008), and school districts that
desegregated under court order appear to have received more state education aid (Johnson 2011).
While we have no reason to believe that either of these relationships was stronger in treatment
states, we examine the possibility in column 4 of Table 4, where we control for both the percent
of the county’s school enrollment in districts under court order to desegregate and the percent of
the county’s enrollment in districts receiving federal funds under the ESAA, both measured as of
fall 1976.41 The controls enter with positive coefficients in the state transfer specification, though
40 Each of these four states reportedly had equal term lengths for black and white schools in the early 1960s. Mississippi and Louisiana exhibit teacher salary differences, but Arkansas and South Carolina do not. Louisiana is the state examined by Reber (2011). Column 3 results are robust to dropping only Arkansas and Mississippi, states in which the pupil-teacher ratio is higher than predicted by a linear model relating pupil-teacher to state black share. 41 This is the school year closest to the end of our sample period in which the Office for Civil Rights in the Department of Health, Education, and Welfare obtained this information for all school districts in the country.
26

only the coefficient on the ESAA variable is statistically significant (Table A1).42 Adding these
controls does not substantively alter our findings.
It is also possible that our estimates are confounded by black political activism, if
activists had been more likely to target counties with higher black shares in literacy test states.
We investigate this possibility in column 5. As proxies for black activism, we control for
indicators for whether the county had an NAACP, whether the county had some other black
organization, and whether the county had a black college, all measured in 1960. Our basic result
is robust to the inclusion of these controls. The presence of the NAACP, another black
organization, and a black college are all positive and significant predictors of the change in state
transfers (Table A1). In other words, predominantly black counties with greater black activism
saw a larger increase in their share of state resources relative to predominantly black counties
with lesser activism. However, controlling for such social movements does not substantively
change the reduced-form coefficient of interest in either the state transfer or the presidential
turnout specification.
There are three other potential contemporaneous explanations for our findings, all
political in nature. First, the 1962 Supreme Court decision in Baker v. Carr required equalization
of legislative district populations, both at the state and federal level. Using the same COG data
that we use here but for the entire country, Ansolabehere, Gerber, and Snyder (2002) show that
counties underrepresented in state legislatures as of 1960 saw relatively large increases in state
transfers between 1957/62 and 1977/82, as the representation gap was corrected. We reproduce
this finding (Table A1) when we control for the same measure of initial county representation as
Ansolabehere, Gerber, and Snyder (2002) – the “relative representation index” (RRI), defined as
42 The coefficient on the court order variable is positive and statistically significant only when we do not also control for the ESAA variable.
27

the number of legislative seats per person in the county, divided by that same figure for the state
as of 1960 (David and Eisenberg 1961). However, adding this control for the redistributive
effects of mandatory redistricting leaves our estimates little changed, as shown in column 6 of
Table 4.
Second, as explained in Section III, poll taxes were eliminated in three treatment states
and two comparison states almost contemporaneously with literacy tests. We focus on the
removal of literacy tests under the VRA because previous literature has not found that poll taxes
had a disproportionate effect on black voting.43 In the seventh column of Table 4, we account for
possible omitted variables bias stemming from failure to account for elimination of the poll tax
by adding to the regression the interaction between an indicator for having a poll tax in the pre-
period and 1960 black population share. Our results are substantively unchanged.
Finally, not only were there events concurrent with the VRA that may have impacted
state funding to localities, but the VRA itself consisted of more than just a mandate to cease the
use of literacy tests. As described earlier, localities subject to Section V of the VRA must request
permission from the United States Department of Justice to change any of their voting rules.44
All of the treatment states are subject to Section V,45 so another alternative mechanism for the
increase in funding is increased fairness of electoral rules, rather than enfranchisement. We test
for this possibility by noting that two comparison states, Florida and Texas, are also subject to
43 Filer, Kenny and Morton (1991) find no significant association between poll tax*nonwhite and county turnout. Alt (1994) shows that poll tax*black is associated with a significant decrease in the ratio of county white to black voter registration. 44 For example, states under Section V must receive clearance on their redistricting plans before they can use them for state or federal legislative elections. States or localities would also have to receive permission to change the dates of election, the location of polling places or the term of an electoral office. 45 Only half of the counties in North Carolina are subject to Section V but if any part of a jurisdiction is subject, the whole jurisdiction is subject. Thus, North Carolina must seek preclearance for state, as well as federal, legislative redistricting.
28

Section V.46 Thus, to account for the impact of pre-clearance, we simply drop Arkansas and
Tennessee from our sample, relying on only Florida and Texas as the comparison states and
thereby limiting the sample to counties in states subject to Section V. As shown in the final
column of Table 4, the reduced-form coefficient of interest in both the turnout and state transfer
specifications nearly doubles in this restricted sample. Our 2SLS estimate of the impact of
enfranchisement-induced turnout is however unchanged. We cannot reject an elasticity of one.47
C.2. General Predictors of State Transfers
The literature on the distribution of public goods acknowledges a role for political
considerations in the distribution decision. But this literature has also identified a number of
determinants of local public goods receipt aside from politics. For example, counties with higher
population growth may see less growth in per-capita funding if budgeting lags population
growth. Ansolabehere, Gerber, and Snyder (2002) find such a phenomenon in examining the
same data used here, but for the entire country. We allow for this possibility by controlling for
the population growth rate during the 1950s in column 2 of Table 5. (As in Table 4, the first
column repeats our preferred specification from Table 3 column 2 for ease of comparison.) The
coefficient on population growth in the model for state transfers is negative (Table A1),
46 These states became subject to the section in 1975 when Congress added failure to provide electoral materials in a language spoken by more than five percent of the population to the list of criterion for inclusion. 47 Another voting rule change that for some states was caused by (but not concurrent with) the passage of the Voting Rights Act was the move from multi- to single-member districts in state legislative elections. Six of our 11 sample states, either because of preclearance or a court challenge, were forced to move from multi-member to single-member districts in the 1970s. Arkansas was forced to move from at-large to small multi member districts. Georgia was forced to move to mostly single member districts, with a few small multi-member districts. The remaining three states—Florida, North Carolina and Virginia—were forced to move to single member districts in the early 1980s. Snyder and Ueda (2011) find using the same COG data we employ that counties represented by at-large delegations receive smaller transfers per capita from their state governments. But just as blacks were not systematically located in underrepresented districts according to the RRI measure, blacks were not systematically located in multi-member districts. And in fact, controlling for whether a state moved from multi to single member districts during our sample period interacted with initial percent black in our state transfer regressions only serves to increase the magnitude of our results.
29

consistent with expectations.48 However, controlling for population growth does not substantially
change our findings.
The bureaucratic model of decision-making hypothesizes that public goods are
distributed to the neediest communities based on bureaucratic formulas, not politics. Consistent
with this theory, the literature finds that population age and poverty status are correlates of public
good receipt.49 While we do not want to control for county demographics in our basic
specification because of a concern that these characteristics may be endogenous to increases in
state aid, we test the possibility that bureaucratic rules explain our findings by controlling for
changes in the shares of the county population that is school-aged (5 to 17), elderly (65 and
over), in poverty, or unemployed between 1960 and 1980. These variables enter the state transfer
regressions with the expected signs (Table A1): increases in school aged children,
unemployment and poverty, all markers of greater need, are significantly associated with growth
in state transfers.50 Because treated counties with larger 1960 black shares experienced
significantly larger increases in the school-aged and low-income shares over the 20 year period,
it is not surprising that the reduced-form coefficients in both our turnout and state transfer
specifications fall in magnitude with the addition of these controls. Nonetheless, even controlling
for need, our 2SLS estimates, shown in column 3 of Table 5, remain close in magnitude to and
statistically indistinguishable from one.
A final model of public goods distribution posits that resources are distributed in
proportion to tax contributions (Boyle and Jacobs 1982). In this framework, treatment counties
48 Because of a concern that residential mobility subsequent to 1965 could be endogenous to the Voting Rights Act, we measure population growth across the 1950s. However, we note that the results of Table 5 column 2 are robust to measuring population growth from 1960 to 1980, contemporaneously with our study period. Population growth is negative and significant in the state transfer model. The coefficient on presidential vote turnout in the 2SLS model is 0.866 with a standard error of 0.478, significant at the 7 percent level. 49 See for example Boyle and Jacobs (1982), Cingranelli (1981), Koehler and Wrightson (1987), Lee (1994), Miranda and Tunyavong (1994), and Mladenka and Hill (1978). 50 The coefficient on share elderly is negative, but insignificant.
30

with higher black population shares would have seen relatively large increases in state transfers
if they saw relatively large increases in their tax burdens. To examine this possibility, we
estimate models like equation (2) that substitute (the natural log of) per-capita local tax revenue
as the dependent variable. This variable includes all taxes paid to localities within the county, the
largest share of which are property taxes. Whether we consider total taxes paid or property taxes
alone, the gradient of tax revenues in black population share decreases significantly more in
treatment states than in comparison states following the removal of literacy tests (final columns
of Table 5). In other words, the same counties that saw larger percent increases in transfers from
the state saw less growth (or greater percent reductions) in their tax bills.51 Thus, an increased tax
burden does not seem to be a likely explanation for our findings.
VII. ENFRANCHISEMENT OR BLACK REPRESENTATIVES?
We have produced robust evidence of shifts in state transfers toward more heavily black
counties in states where literacy tests were outlawed by the VRA, following the Act’s passage.
We have provided evidence against several alternative explanations for these funding patterns
drawn from the public goods literature generally and from contemporaneous historical events
more specifically. We have further shown that these shifts in state funding align with increases in
enfranchisement-driven turnout over the same period. But are we finding that black voting
eligibility altered the incentives for politician behavior? Or that black voters elected black
officials who were more likely to share ideology with black constituents?
Following the VRA, there was an immediate, stark increase in black voter registration
and turnout. And while the number of black elected officials was on an upward trajectory
throughout our sample period, sizable increases in their ranks were slower in coming. In fact,
51 Of course, this could reflect changes in tax rates, not just changes in the tax base. Local politicians may have crowded out the inflows of state aid by reducing local tax rates. We discuss this possibility in the conclusion.
31

gains in black office holding have been more often attributed to redistricting rule changes that
lagged the passage of the VRA by as much as 25 years than to increases in black voter turnout
(Handley and Grofman 1994).52 Consistent with this, there were no black governors in the South
over our sample period and a very limited presence of black state legislators.53 This alone
suggests that the election of black representatives cannot explain our results.
We provide further evidence in Table 6 that the election of black state legislators is not
the mechanism for the change in the distribution of state transfers. Here, we run state-level long
difference models where the outcome is the change in the share of black elected officials in the
upper (lower) legislative house normalized by the state’s black population share. The
independent variable is an indicator for having a literacy test. These specifications thus ask how
the rate of black elected officials per black population evolved differently in southern states with
and without a history of literacy tests. If black elected officials are the cause of the shift in state
transfers to more heavily black counties in treatment states, then we would expect to see a
positive coefficient on our literacy test indicator. But in fact the coefficient in the upper house
specification is essentially zero, and in the lower house specification, the coefficient is negative.
While the coefficients are unsurprisingly noisy, there is little evidence to support the idea that the
gains to black counties came via black elected officials.
VIII. DISCUSSION AND CONCLUSION
The VRA removed literacy tests as a barrier to black citizens’ political participation in
seven of 11 southern states. As a result, black voter registration and turnout increased markedly.
52 Handley and Grofman (1994) argue that the move to single member districts during the 1970s and 1980s increased the number of minorities in state legislatures. However, the authors contend, that 1982 renewal of the Voting Rights Act, which required states to draw districts so as to not fragment black voters, had a much larger impact on black descriptive representation. 53 The ratio of the share of black elected officials in the upper house at the end of our sample period (average of 1977 and 1982) to the state’s 1980 black population share is on average 0.13 in treated states and 0.11 in comparison states. For the lower house, these figures are 0.28 and 0.48, respectively. (These figures are weighted by 1960 state population for consistency with the regression estimates.)
32

Because of residential segregation, changes in the share of county residents who were newly
enfranchised varied within state across localities, spatial variation that we exploit to examine the
impact of enfranchisement on the distribution of state resources. We test for post-VRA shifts in
the relative distribution of state transfers toward localities with larger black populations in
literacy test versus non literacy test southern states. We demonstrate that not only did turnout in
higher black share localities increase disproportionately in treatment states following the Act’s
passage, but that state transfers to these localities increased as well. In other words, the same
black communities that saw an increase in enfranchisement-driven turnout saw an increase in
their share of the state resource pie. We rule out competing explanations – drawn both from the
public resource distribution literature and from contemporaneous historical events – for the
change in state transfers. We posit that the causal link runs from enfranchisement to resource
receipt, a conclusion that is consistent with theoretical models of distributive politics in which
politicians target resources to identifiable, targetable, and politically persuadable interest groups
to earn their political support. That enfranchisement was accompanied by increased resource
receipt suggests that that the Voting Rights Act provided substantive, rather than merely
symbolic, political gains to southern blacks.
However, as is recognized widely in the political economy literature, political gains do
not equate to welfare gains. In the case of the results presented above there are two key reasons
that these increases in spending may not have increased black welfare: 1) crowd out and 2)
inefficient spending. State aid targeted toward investments with high marginal returns for blacks,
like education, may have been crowded out by local tax reductions. And in fact we see some
evidence of crowd out in Table 5, which shows that the same areas that saw increased transfers
saw decreases in their tax bill. Of course decreases in average taxes paid per capita could be
33

composed of decreases in the tax base and/or changes in the tax rate. To the extent that each
individual’s tax burden decreased, given blacks’ lower wealth, these decreases, though smaller
for blacks than whites, may have resulted in greater welfare gains for black taxpayers, assuming
no change in services received or state tax burdens.
The welfare impact of the remaining state transfers, not set off by tax decreases, is also
impossible to quantify given the preceding evidence. Using COG data on education expenditures
at the county level, we estimate an elasticity of per-capita county education expenditures with
respect to presidential turnout rates of 0.58 in our preferred specification (from Table 3, column
2). Combined with the corresponding estimate of the elasticity of per-capita state transfers with
respect to presidential turnout, this estimate implies a 48 cent increase in education spending for
every dollar increase in state transfers.54,55 However, we lack the power to reject either complete
crowd out or a dollar for state dollar transferred increase in spending at conventional levels of
significance.56 Our results for transportation and health expenditures are also noisy.57 But even if
we could precisely estimate that all transferred dollars were spent on black citizens we could still
not conclude that these transfers increased black citizens’ welfare, as government funds may be
54 The implied elasticity of education spending with respect to state transfers is the ratio of their turnout elasticities (0.469=0.58/1.125 in our preferred specification). We convert this elasticity into a dollar-for-dollar figure using treatment group means of the education spending and state transfers variables. We cannot account for every cent of each additional dollar of state transfers through increased education spending and reduced taxes alone, though we can account for most. Our estimates imply a 34 cent reduction in real per-capita total tax revenues for each dollar increase in real per-capita state transfers, which coupled with the 48 cent increase in education spending accounts for 82 cents of each transfer dollar. We cannot do a complete accounting of each transfer dollar because we do not have data for all counties (and in some cases for any county) for the remaining spending categories. 55 Note that the resulting 48 cent figure is a lower bound on the increase in education spending for each additional dollar of education aid from the state. If we instead assume that 73 percent of the average increase in state transfers was targeted for education, as is true on average in the South, the elasticity estimate implies a 66 cent increase in education spending for every additional dollar of state education aid received. As a point of comparison, Cascio, Gordon, and Reber (2011) find that a dollar increase in Title I funding in the South over the second half of the 1960s was associated with about a 50 cent increase in school spending. 56 The (robust) standard error on the estimated elasticity of education spending with respect to presidential turnout is 0.341, yielding a t-statistic of 1.71. 57 Because we lack data on transportation and health expenditures for some localities we deemphasize these results.
34

spent ineffectively.58 We therefore conclude by noting our principle finding – that black
enfranchisement following the Voting Rights Act led to political gains to black communities in
terms of the share of state resources received – and by recognizing that quantifying how these
state transfers impacted black economic welfare is an important topic for future research.59
58 Cascio, Gordon and Reber (2011), for example, show that increases in school budgets resulting from Title I decreased high school dropout rates for whites, but not for blacks. 59 We are not the first to assert the importance of this question. Noting the surge in voter registration following the VRA, Wright (1999) urged economic historians to examine the connection between enfranchisement and economic advancement.
35
APPENDIX A. State Transfers Data Our analysis uses data on transfers from state governments to local jurisdictions. These data were drawn from the Census of Governments (COG) Historical Data Base on County Area Finances Since 1957, which we downloaded from ftp://ftp2.census.gov/pub/outgoing/govs/special60/. The variable that we use is Total State IG (intergovernmental) Revenue, which is reported every five years starting in 1957 and continuing through 1982. In a robustness check (Table 5), we also use the variables Total Taxes and Property Tax. Real per-capita figures were created by dividing by these figures by population from the same year as reported by the same source, then converting to real 2009 dollars using the CPI-U. B. Voter Turnout Data The majority of the presidential and gubernatorial turnout data were provided by Matthew Gentzkow and James Snyder. The remaining observations were hand-entered or scanned using various volumes of America Votes (Washington, DC: Elections Research Center, Congressional Quarterly). We converted these figures to county voter turnout rates by dividing them by the voting age population in the county (ages 21+ in 1970 and prior and ages 18+ in 1971 and later). We obtained the county-level voting age populations for 1950 and 1960 from National Historical Geographic Information System (NHGIS) (Minnesota Population Center 2004) and for 1970 and 1980 from special tabulations of county population by race, gender, and age that we obtained directly from the Census Bureau. We linearly interpolated voting age population in the intercensal years. C. Data on 1960 County Characteristics
1. 1960 Black Population Share: Percent black in the 1960 county population is from the 1960 City and County Data Book Consolidated File, County Data 1947-1977 (U.S. Department of Commerce 1978).
2. 1960 Child Poverty Rate: The numerator of the 1960 child poverty rate is the 1960 Census report of the number of 5 to 17 year olds in the county living in families with incomes less than $2000 in 1959, which were hand-entered from U.S. Senate (1965). This was the primary determinant of a county’s Title I eligibility in the 1960s.1 The denominator is the number of 5 to 17 year olds in the county as of 1960, which we downloaded from the National Historical Geographic Information System (Minnesota Population Center 2004).
3. 1960 Relative Representation Index (RRI): The 1960 RRI was hand-entered from a table in David and Eisenberg (1961) titled, “Index Values of the Right to Vote for Members of
1There was an additional category of Title I eligibility in 1965: children in families receiving AFDC in excess of $2000 in 1962. Other categories of eligibility were introduced over time (e.g., foster children, neglected children, and delinquent children), but the main determinant of Title I eligibility over our sample period remained the census-based child poverty count.
36
the Legislature, by Counties, 1910, 1930, 1950, and 1960, as Percentage of the State-Wide Average.” In our analysis, we divided the number reported by 100.
D. Data on Changes in County Characteristics
1. Population Growth Rate, 1950-1960: We constructed the 1950s county population growth rate using county population figures reported by NHGIS (Minnesota Population Center 2004).
2. Change in the Percents of the Population School-Aged and Elderly, 1960-1980: The 1960 population percentages of school age (ages 5-17) and elderly (ages 65 and over) were constructed using data on population by age from NHGIS (Minnesota Population Center 2004). Values for 1980 were constructed using data on population by age from the 1980 City and County Data Book, downloaded from the University of Virginia library (http://www2.lib.virginia.edu/ccdb/).
3. Change in the Percent of Families below the Poverty Line, 1960-1980: For 1960, the poverty rate is the percentage of families in the county reporting incomes less than $3000 in 1959, drawn from the 1960 City and County Data Book. For 1980, we construct the poverty rate using data on the number of families below the poverty line and the number of families from the 1980 City and County Data Book, downloaded from the University of Virginia library.
4. Change in the Unemployment Rate, 1960-1980: We use the 1960 unemployment rate reported in the 1960 City and County Data Book. The unemployment rate for 1980 was constructed using the BLS report of the number unemployed and the number in the civilian labor force from the 1980 City and County Data Book, downloaded from the University of Virginia library.
E. Proxies for Black Political Activism We constructed our proxies for black political activism – indicators for the presence of an NAACP chapter, another black race organization, and a black college in the county – from data used in Matthews and Prothro (1963): http://www.rochester.edu/College/psc/signorino/courses/. This data set provides neither FIPS county codes nor county names, but rather numbers counties consecutively within state. To ascertain the identity of each observation, we obtained a county list from the 1950 Census and numbered counties consecutively exactly as they fell with a sort on county FIPS code. All counties merged, and the 1950 black population shares reported in the Matthews and Prothro data matched those that we drew from county population figures reported by NHGIS (Minnesota Population Center 2004) in nearly all instances. F. Data on School Desegregation We constructed the fraction of county enrollment in school districts under court order to desegregate or receiving Emergency School Aid Act (ESAA) funds using school district level data from the Fall 1976 Elementary and Secondary School Civil Rights Survey (Office for Civil
37
Rights 1978). We used a version of the data housed at UCLA and converted from binary to ascii format by Ben Denckla and Sarah Reber. A district was classified as being under court order if it answered yes (=1) to the question “School System under Court Order to Desegregate,” and as receiving ESAA funds if it answered “yes” (=1) to the question “Is this an ESAA district?” County level figures are the weighted averages of these dummy variables, where the weights are the sum of total male and female pupils in membership in the district. While the survey includes all school systems in the South, we lose several observations where we were unable to match on county names; county FIPS codes were not reported.
G. Data on Black State Legislators The data on black state legislators, used in Table 6, were drawn from several sources. For the pre-VRA observation, we construct counts of black state senators and representatives elected in 1964 or prior from Appendix VI (“Negroes Holding Public Office in the South (as of February 1, 1968)”) in US Commission on Civil Rights (1968). For the post-VRA observation, we average counts of black state senators and representatives as of 1977 and 1982 from the National Roster of Black Elected Officials (Joint Center for Political Studies 1977, 1982).
38

REFERENCES
Alt, James E. 1994. “The impact of the voting rights act on black and white voter registration in the South." In Chandler Davidson and Bernard Grofman (eds.) Quiet Revolution in the South: The Impact of The Voting Rights Act 1965 – 1990. (pp. 351 – 377). Princeton, NJ: Princeton University Press.
Ansolabehere, Stephen, Alan Gerber, and Jim Snyder. 2002. "Equal Votes, Equal Money: Court
Ordered Redistricting and Public Expenditures in the American States." American Political Science Review, 96 (4): 767 – 777.
Ashenfelter, Orley, William J. Collins, and Albert Yoon. 2006. "Evaluating the Role of Brown
V. Board of Education in School Equalization, Desegregation, the Income of African Americans." American Law and Economics Review, 8(2): 213-248.
Besley, Timothy and Anne Case. 2003. "Political Institutions and Policy Choices: Evidence from
the United States." Journal of Economic Literature, 41(1): 7– 73. Besley, Timothy, Torsten Persson and Daniel Sturm. 2010. “Political Competition, Policy and
Growth: Theory and Evidence from the United States.” Review of Economic Studies, 78, 1-34.
Bond, Horace Mann. 1934. The Education of the Negro in the American Social Order. New
York: Prentice Hall. Boyle, John, and David Jacobs. 1982. "The Intracity Distribution of Services: A Multivariate
Analysis." American Political Science Review, 76 (June): 371-9. Button, James. 1989. Blacks and Social Change. Princeton, NJ: Princeton University Press. Cascio, Elizabeth, Nora Gordon, Ethan Lewis, and Sarah Reber. 2008. "From Brown to Busing."
Journal of Urban Economics, 64(2): 296 – 325. Cascio, Elizabeth, Nora Gordon, Ethan Lewis, and Sarah Reber. 2010. "Paying For Progress:
Conditional Grants and the Desegregation of Southern Public Schools." Quarterly Journal of Economics, 125(1): 445 – 482.
Cascio, Elizabeth U., Nora E. Gordon, and Sarah J. Reber. 2011. "Federal Aid and Equality of
Educational Opportunity: Evidence from the Introduction of Title I in the South." NBER Working Paper 17155. Cambridge, MA: National Bureau of Economic Research.
Cingranelli. David L. 1981. “Race, Politics and Elites: Testing Alternative Models of Municipal
Service Distribution.” American Journal of Political Science, 25(4): 664-692. Cox, Gary W. and Matthew D. McCubbins. 1986. “Electoral Politics as a Redistributive Game.”
The Journal of Politics, 48(2): 370-389.
39
David, Paul T. and Ralph Eisenberg. 1961. Devaluation of the Urban and Suburban Vote. Charlottesville: University of Virginia Press.
Dixit, Avinash and John Londregan. 1996. “The Determinants of Success of Special Interests in
Redistributive Politics.” The Journal of Politics, 58(4): 1132-1155. Dixit, Avinash and John Londregan. 1998. “Fiscal Federalism and Redistributive Politics.”
Journal of Public Economics, 68(2): 153-180. Donohue, John J. III, James J. Heckman, and Petra E. Todd. 2002. "The Schooling of Southern
Blacks: The Roles of Legal Activism and Private Philanthropy, 1910 – 1960." Quarterly Journal of Economics, 117(1): 225-268.
Filer, John E., Lawrence W. Kenny, and Rebecca B. Morton. 1991. "Voting Laws, Educational
Policies, and Minority Turnout." Journal of Law and Economics, 34(2): 371-393. Fleck, Robert K. 1999. “The Value of the Vote: A Model and Test of the Effects of Turnout on
Distributive Policy.” Economic Inquiry, 37(4): 609-623. Grofman, Bernard and Lisa Handley. 1998. “Voting Rights in the 1990s: An Overview” in Race
and Redistricting in the 1990s Ed. Bernard Grofman. New York, NY: Agathon Press. Handley, Lisa and Bernard Grofman. 1994. “The Impact of the Voting Rights Act on Minority
Representation: Black Officeholding in Southern State Legislatures and Congressional Delegations.” In Chandler Davidson and Bernard Grofman (eds.) Quiet Revolution in the South: The Impact of The Voting Rights Act 1965 – 1990. (pp. 335 – 350). Princeton, NJ: Princeton University Press.
Herbers, John. 1965. “Dr. King and 770 Others Seized in Alabama Protest.” The New York
Times, February 2. Husted, Thomas A. and Lawrence W. Kenny. 1997. "The Effect of the Expansion of the Voting
Franchise on the Size of Government." The Journal of Political Economy, 105(1): 54 – 82.
Johnson, Rucker. 2011. “Long-run Impacts of School Desegregation and School Quality on
Adult Attainments.” National Bureau of Economic Research Working Paper 16664. Cambridge, MA: NBER.
Joint Center for Political Studies. 1977, 1982. National Roster of Black Elected Officials,
Volumes 6 and 12. Washington, DC: Joint Center for Political Studies. Kenny, Lawrence W. and John Lott. 1999. “Did Women’s Suffrage Change the Size and Scope
of Government?” The Journal of Political Economy, 107(6): 1163-1198.
40

Keech, William R. 1968. The Impact of Negro Voting: The Role of the Vote in the Quest for Equality. Chicago: Rand McNally.
Key, V.O. 1949. Southern Politics in State and Nation. New York: Knopf. Koehler, David H. and Margaret T. Wrightson. 1987. “Inequality in the Delivery of Urban
Services: A Reconsideration of the Chicago Parks.” The Journal of Politics 49(1): 80-99. Lee, Seung Jong. 1994. "Policy Type, Bureaucracy, and Urban Policies: Integrating Models of
Urban Service Distribution." Policy Studies Journal, 22 (Spring): 87-108. Lewis, John. 2011. “A Poll Tax by Another Name.” The New York Times, August 26. Lindbeck, Assar and Jörgen W. Weibull. 1987. “Balanced-Budget Redistribution as the
Outcome of Political Competition.” Public Choice 52(3): 273-297. Margo, Robert A. 1990. Race and Schooling in the South, 1880 – 1950: An Economic History.
Chicago: University of Chicago Press. Martin, Paul. 2003. “Voting’s Rewards: Voter Turnout, Attentive Publics and Congressional
Allocation of Federal Money.” American Journal of Political Science, 47(1): 110-127. Matthews, Donald R. and James W. Prothro. 1963. “Social and Economic Factors and Negro
Voter Registration in the South.” The American Political Science Review 57(1): 24-44. Miller, Grant. 2008. “Women’s Suffrage, Political Responsiveness, and Child Survival in
American History.” The Quarterly Journal of Economics 123(3): 1287-1327. Minnesota Population Center. 2004. National Historical Geographic Information System: Pre-
release Version 0.1. Minneapolis, MN: University of Minnesota. http://www.nhgis.org/ Miranda, Rowan A., and Ittipone Tunyavong. 1994. "Patterned Inequality?: Reexamining the
Role of Distributive Politics in Urban Service Delivery." Urban Affairs Review, 29 (June): 509-34.
Mladenka, Kenneth R., and Kim Quaile Hill. 1978. "The Distribution of Urban Police Services."
Journal of Politics, 40 (February): 112-33. Naidu, Suresh. 2010. “Suffrage, Schooling, and Sorting in the Post-Bellum U.S. South.”
Manuscript, Columbia University. Office for Civil Rights. 1978. Fall 1976 Elementary and Secondary School Civil Rights Survey.
Washington, DC: United States Department of Health, Education and Welfare [producer]. Los Angeles, CA: Sarah Reber [distributor, computer file], 2006.
41

Reber, Sarah J. 2011. "From Separate and Unequal to Integrated and Equal? School Desegregation and School Finance in Louisiana." Review of Economics and Statistics, 93(2): 416 – 435.
Snyder, James and Michiko Ueda (2011). “Do Multimember Districts Lead to Free Riding?”
Legislative Studies Quarterly, 32(4), 649-678. Strömberg, David. 2004. “Radio’s Impact on Public Spending.” The Quarterly Journal of
Economics, 119(1): 189-221. Trebbi, Francesco, Philippe Aghion, and Alberto Alesina. 2008. "Electoral rules and Minority
Representation in US Cities." Quarterly Journal of Economics 123(1): 325 – 358. U.S. Commission on Civil Rights.1968. Political Participation: A Study of the Participation of
Negroes in the Electoral and Political Processes in 10 Southern States Since Passage of the Voting Rights Act of 1965. Washington DC: US Government Printing Office.
U.S. Department of Commerce, Bureau of the Census, 1957, 1962, 1977 and 1982. State
Payments to Local Governments. Washington DC: US Government Printing Office. http://www.census.gov/govs/pubs/year.html
U.S. Department of Commerce, Bureau of the Census. 1978. County and City Data Book
[United States] Consolidated File: County Data, 1947-1977 [Computer file]. ICPSR version. Washington, DC: U.S. Department of Commerce, Bureau of the Census [producer], 1978. Ann Arbor, MI: Inter-university Consortium for Political and Social Research [distributor], 1999.
U.S. Department of Health, Education, and Welfare, Office of Education. 1969. History of Title I
ESEA. Washington DC: US Government Printing Office. U.S. Senate. Committee on Labor and Public Welfare. Subcommittee on Education. 1965.
Maximum Basic Grants—Elementary and Secondary Education Act of 1965 (Public Law 81-874, Title II and Public Law 89-10, Title I). Washington, DC: U.S. Government Printing Office.
Washington, Ebonya. 2011. “Do Majority Black Districts Limit Blacks’ Representation? The
Case of the 1990 Redistricting.” Journal of Law and Economics, forthcoming. Wright, Gavin. 1999. “The Civil Rights Revolution as Economic History.” Journal of Economic
History, 59(2), 267-289. Wright, Gavin. 2011. Economics of the Civil Rights Evolution. Book Manuscript.
42

-.01
-.00
50
1952 1956196019641968 197219761980election year
A. ln(Presidential Election Turnout Rate)
-.00
8-.0
06-.
004-
.002
0.0
02
1953 1957 1961 1965 1969 1973 1977first election on or after
B. ln(Gubernatorial Election Turnout Rate)
-.00
20
.002
.004
.006
1957 1962 1967 1972 1977 1982fiscal year
C. ln(Per-Capita State Transfers ($2009))
Solid Circles: With Literacy Test. Hollow Circles: Without Literacy TestNote: Each graph shows coefficients on county % black in 1960 by year, separately for states with literacy tests (AL, GA, LA, MS, NC, SC, VA) and for statesin the South without literacy tests (AR, FL, TN, TX), prior to the VRA. The unit of observation is a county. Regressions also include state fixed effects and areweighted by 1960 county population. The dotted vertical line is at 1965, the year that the VRA was passed.
Figure 1. Trends in the Gradients of Voter Turnout Rates and Per-Capita State Transfersin 1960 County Percent Black, by Presence of a Literacy Test prior to the VRA
43
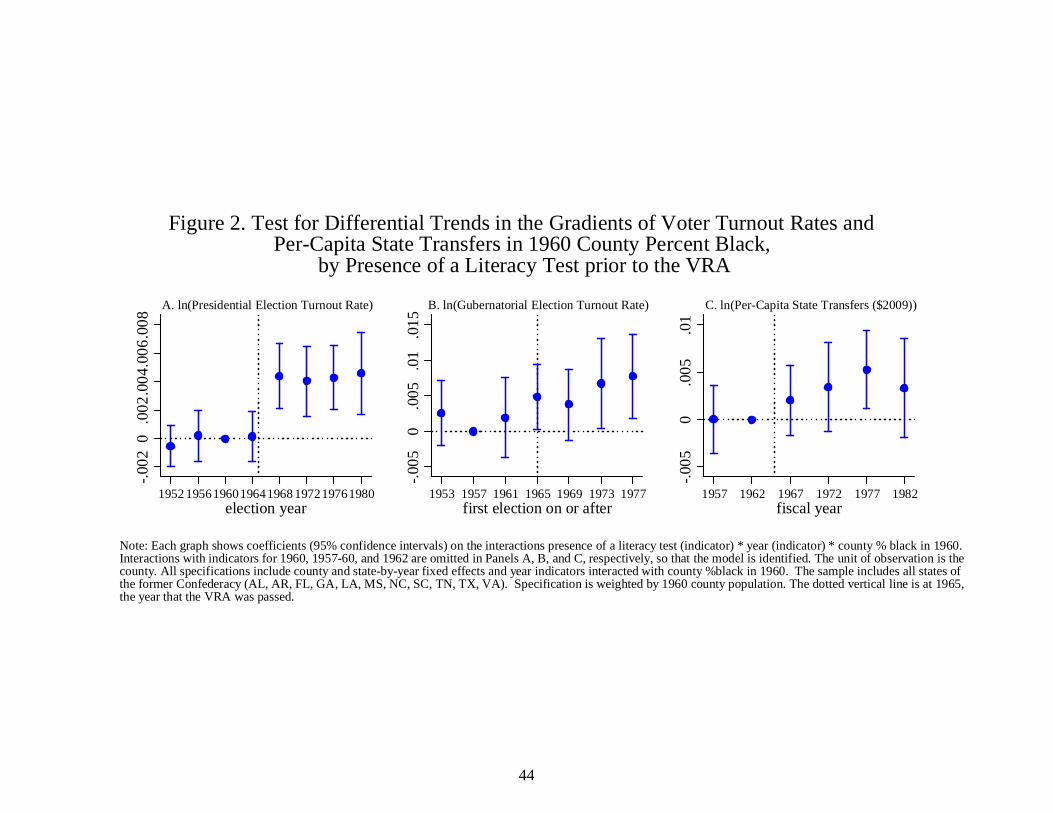
-.00
20
.002
.004
.006
.008
1952 1956196019641968 197219761980election year
A. ln(Presidential Election Turnout Rate)
-.00
50
.005
.01
.015
1953 1957 1961 1965 1969 1973 1977first election on or after
B. ln(Gubernatorial Election Turnout Rate)
-.00
50
.005
.01
1957 1962 1967 1972 1977 1982fiscal year
C. ln(Per-Capita State Transfers ($2009))
Note: Each graph shows coefficients (95% confidence intervals) on the interactions presence of a literacy test (indicator) * year (indicator) * county % black in 1960.Interactions with indicators for 1960, 1957-60, and 1962 are omitted in Panels A, B, and C, respectively, so that the model is identified. The unit of observation is thecounty. All specifications include county and state-by-year fixed effects and year indicators interacted with county %black in 1960. The sample includes all states ofthe former Confederacy (AL, AR, FL, GA, LA, MS, NC, SC, TN, TX, VA). Specification is weighted by 1960 county population. The dotted vertical line is at 1965,the year that the VRA was passed.
Figure 2. Test for Differential Trends in the Gradients of Voter Turnout Rates andPer-Capita State Transfers in 1960 County Percent Black,
by Presence of a Literacy Test prior to the VRA
44

Table 1. Descriptive Statistics
Mean SD Mean SD(1) (2) (3) (4)
Per-Capita State Transfers ($2009), 1957/62 356.4 116.0 317.2 91.4Per-Capita State Transfers ($2009), 1977/82 762.6 192.3 674.0 197.2 Δ ln(Per-Capita State Transfers) 0.82 0.33 0.76 0.34
Presidential Election Turnout Rate, 1960 0.372 0.132 0.448 0.083Presidential Election Turnout Rate, 1980 0.469 0.081 0.478 0.061 Δ ln(Presidential Election Turnout Rate) 0.27 0.34 0.08 0.20
Gubernatorial Election Turnout Rate, 1957-60 0.223 0.186 0.245 0.140Gubernatorial Election Turnout Rate, 1977-80 0.351 0.122 0.312 0.075 Δ ln(Gubernatorial Election Turnout Rate) 0.77 0.83 0.37 0.46
Percent Black, 1960 29.0 16.2 15.3 11.3Child Poverty Rate, 1960 24.3 14.6 17.5 11.1
Percent of County Enrollment in Districts:
With Literacy Test Without Literacy Test
A. Funding and Election Turnout Outcomes
B. County Characteristics
Under Court Order to Desegregate, 1976 51.4 47.2 43.8 42.8 Receiving ESAA funds, 1976 39.0 45.5 37.6 38.6=1 if Has NAACP Chapter, 1960 (x100) 53.8 49.9 65.5 47.6=1 Has Other Black Organization, 1960 (x100) 6.2 24.1 0.1 3.8=1 Has Black College, 1960 (x100) 24.1 42.8 24.2 42.9Relative Representation Index, 1960 1.0 0.6 1.0 0.8
Δ ln(Population), 1950-60 0.15 0.22 0.29 0.331960 to 1980 Change in: Percent of Population Ages 5 to 17 -5.2 1.9 -4.1 1.5 Percent of Population Ages 65 and over 3.2 1.5 3.2 2.6 Percent of Families below Poverty Line -23.1 11.3 -20.0 10.9 Percent Unemployed 5.4 3.2 3.4 3.4
Observations (counties)† 491638
Notes: The estimation sample includes all but two counties in the South (AL, AR, FL, GA, LA, MS, NC, SC, TN, TX, and VA). States with literacy tests still in place immediately prior to the VRA are AL, GA, LA, MS, NC, SC, and VA. Gubernatorial turnout is for the election within the stated four-year interval closest to the interval's starting point. Statistics are weighted by 1960 county population. See Appendix for sources. † For the school desegregation variables, there are 625 and 489 observations for the literacy test and non-literacy test subsamples, respectively.
45

Table 2. Baseline Event-Study and Long-Difference Estimates
County XLong Diff.
1960 to County XLong Diff. 1957-60 to County X
Long Diff. 1957/62 to
Year 1980 Year 1977-80 Year 1977/82(1) (2) (3) (4) (5) (6)
1960 percent black 1960 percent black 1960 percent black X literacy test indicator X literacy test indicator X literacy test indicator X indicator for: X indicator for: X indicator for:
year=1952 -0.000537(0.000735)
year=1956 0.000194 1953>=year>1957 0.00255 year=1957 1.34e-05(0.000900) (0.00232) (0.00181)
year=1960 - 1957>=year>1961 - year=1962 -
year=1964 0.000121 1961>=year>1965 0.00194 year=1967 0.00203(0.000890) (0.00283) (0.00184)
year=1968 0.00439*** 1965>=year>1969 0.00486** year=1972 0.00345(0.00116) (0.00230) (0.00237)
year=1972 0.00403*** 1969>=year>1973 0.00376 year=1977 0.00527**(0.00124) (0.00252) (0.00208)
year=1976 0.00428*** 1973>=year>1977 0.00672** year=1982 0.00332(0.00114) (0.00321) (0.00265)
*** ***
C. ln(Per-Capita State Transfers)A. ln(Presidential Election Turnout Rate) B. ln(Gubernatorial Election Turnout Rate)
year=1980 0.00458*** 1977>=year>1980 0.00775***(0.00147) (0.00297)
1960 percent black 0.00458*** 1960 percent black 0.00775*** 1960 percent black 0.00429** X literacy test indicator (0.00137) X literacy test indicator (0.00275) X literacy test indicator (0.00176)
Observations 9,032 1,129 7,902 1,129 6,774 1,129R-squared 0.894 0.708 0.920 0.788 0.869 0.425
Controls:1960 percent black X X X X X X X year indicators X X XState indicators X X X X X X X year indicators X X XCounty fixed effects X X X
Notes: The estimation sample includes all but two counties in the South (AL, AR, FL, GA, LA, MS, NC, SC, TN, TX, and VA). The literacy test indicator is set to one for states with literacy tests still in place immediately prior to the VRA (AL, GA, LA, MS, NC, SC, and VA). Regressions are weighted by 1960 county population. Standard errors in columns (1), (3), and (5) are robust for heteroskedasticity and for correlation of error terms within county over time. Standard errors in columns (2), (4) , and (6) are heteroskedasticity robust. ***, **, and * indicate statistical significance at the 1, 5, and 10 percent levels, respectively.
46

Table 3. Long-Difference Estimates: Sensitivity to Specification
Interacted with literacy test
dummy
Interact child poverty with state
dummies 1960 black sharepropensity to be in literacy test state
(1) (2) (3) (4) (5) (6)
1960 percent black 0.00458*** 0.00468*** 0.00458*** 0.00612*** 0.00497*** 0.00343*** X literacy test indicator (0.00137) (0.00153) (0.00164) (0.00209) (0.00146) (0.00122)R-squared 0.708 0.708 0.741 0.674 0.703 0.715
1960 percent black 0.00429** 0.00583*** 0.00546*** 0.00735** 0.00661*** 0.00520** X literacy test indicator (0.00176) (0.00208) (0.00197) (0.00291) (0.00213) (0.00203)R-squared 0.425 0.429 0.460 0.444 0.435 0.532
Δ ln (pres. election turnout rate) 0.937** 1.245** 1.257*** 1.200** 1.331** 1.518**(0.434) (0.560) (0.423) (0.546) (0.531) (0.757)
Reduced-form
Two-stage Least Squares
Add child poverty: Common support in: Common support in p-score +
inverse p-score weighting
A. Δ ln (Presidential Election Turnout Rate)Reduced-form
B. Δln (Per-Capita State Transfers)
Δ ln (pres. election turnout rate) 0.0658 0.0694 0.0482 0.0347 0.0734 0.139*(0.0809) (0.0811) (0.0777) (0.104) (0.0879) (0.0736)
R-squared 0.420 0.421 0.539 0.434 0.424 0.528
Observations (counties) 1,129 1,129 1,129 822 1,090 1,090Controls:
1960 child poverty rate X X X X X " X literacy test indicator X X X X " X state indicators X
=1 Has Black College, 1960 (=1)
Ordinary Least Squares
Notes: All models include state indicators and 1960 percent black. The full estimation sample includes all but two counties in the South (AL, AR, FL, GA, LA, MS, NC, SC, TN, TX, and VA). The literacy test indicator is set to one for states with literacy tests still in place immediately prior to the VRA (AL, GA, LA, MS, NC, SC, and VA). The sample in column (4) consists of counties with 1960 percent black at least as high as the 10th percentile of the percent black distribution for states without literacy tests and no more than the 90th percentile of the percent black distribution for states with literacy tests. The sample in column (5) drops counties in treatment states with propensity scores above the maximum propensity score in comparison states and counties in comparison states with propensity scores below the minimum for treatment states. Regressions are weighted by 1960 county population (x p/(1-p), where p represents the estimated propensity score, for comparison counties in column (6)). Standard errors (in parentheses) are heteroskedasticity robust. ***, **, and * indicate statistical significance at the 1, 5, and 10 percent levels, respectively.
47

Table 4. Long Difference Estimates: Robustness to Setting-Specific Predictors of State Transfers
BaselineBlack political
activismMandatory redistricting
Elimination of the poll tax
Preclearance Provision
(1) (2) (3) (4) (5) (6) (7) (8)
1960 percent black 0.00468*** 0.00665*** 0.00539*** 0.00501*** 0.00439*** 0.00471*** 0.00464*** 0.00905*** X literacy test indicator (0.00153) (0.00217) (0.00180) (0.00150) (0.00155) (0.00155) (0.00149) (0.00243)R-squared 0.708 0.609 0.692 0.713 0.710 0.709 0.709 0.738
1960 percent black 0.00583*** 0.00927*** 0.00707*** 0.00516*** 0.00560*** 0.00499*** 0.00576*** 0.0123*** X literacy test indicator (0.00208) (0.00317) (0.00265) (0.00196) (0.00196) (0.00178) (0.00202) (0.00328)R-squared 0.429 0.211 0.379 0.475 0.476 0.506 0.431 0.394
Δ ln (pres. election turnout rate) 1.245** 1.394** 1.310** 1.030** 1.276** 1.059** 1.241** 1.361**(0.560) (0.632) (0.585) (0.443) (0.556) (0.452) (0.564) (0.532)
Δ ln (pres. election turnout rate) 0.0694 0.00934 0.0386 0.0702 0.0616 0.0778 0.0652 0.0554(0.0811) (0.137) (0.113) (0.0716) (0.0793) (0.0741) (0.0802) (0.0967)
R-squared 0.421 0.186 0.366 0.469 0.468 0.501 0.423 0.367
Observations (counties) 1 129 642 863 1 114 1 129 1 129 1 129 959
School Desegregation
B. Δln (Per-Capita State Transfers)
Two-stage Least Squares
Ordinary Least Squares
A. Δ ln (Presidential Election Turnout Rate)Reduced-form
Reduced-form
Observations (counties) 1,129 642 863 1,114 1,129 1,129 1,129 959
Sample: Full States w/ No Drop States with Counties Full Full Full Drop states B-W School Qual. Large B-W Sch. w/ Desegregation not subject to
Gaps by 1966† Quality Gaps in Data in 1976 Section V ††Early 1960s‡
Additional Controls:% enr. under court order, 1976 X% enr. receiving ESAA funds, 1976 X=1 if NAACP chapter, 1960 X=1 if other black org, 1960 X=1 if black college, 1960 Xrelative representation index, 1960 Xpoll tax indicator X % black, 1960 X
Notes: All models include state indicators, 1960 percent black, and the 1960 child poverty rate, entered directly and interacted with the literacy test indicator. The poll tax indicator is set to one for states with poll taxes eliminated subsequent to ratification of the 24th amendment in 1964 (AL, AR, FL, MS, TX, and VA). † AL, FL, GA, TN, and TX. ‡ AR, LA, MS, and SC. †† AR and TN. Regressions are weighted by 1960 county population. Standard errors (in parentheses) are heteroskedasticity robust. ***, **, and * indicate statistical significance at the 1, 5, and 10 percent levels, respectively.
48
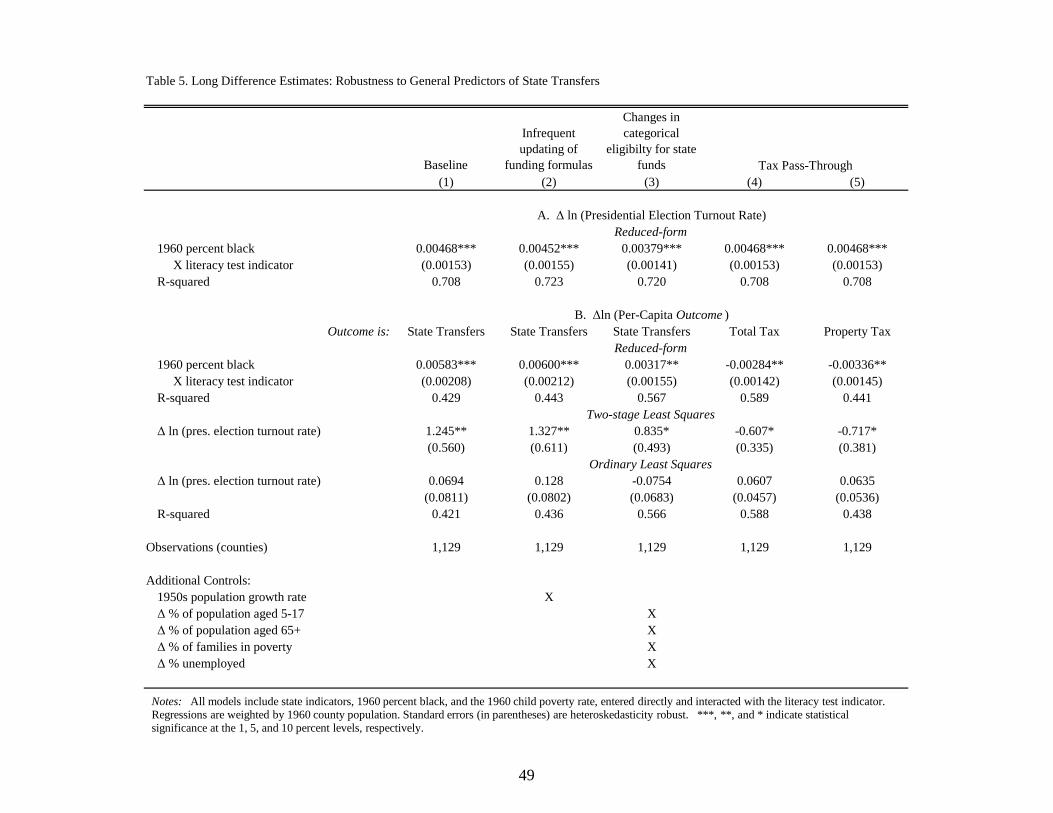
Table 5. Long Difference Estimates: Robustness to General Predictors of State Transfers
Baseline
Infrequent updating of
funding formulas
Changes in categorical
eligibilty for state funds
(1) (2) (3) (4) (5)
1960 percent black 0.00468*** 0.00452*** 0.00379*** 0.00468*** 0.00468*** X literacy test indicator (0.00153) (0.00155) (0.00141) (0.00153) (0.00153)R-squared 0.708 0.723 0.720 0.708 0.708
Outcome is: State Transfers State Transfers State Transfers Total Tax Property Tax
1960 percent black 0.00583*** 0.00600*** 0.00317** -0.00284** -0.00336** X literacy test indicator (0.00208) (0.00212) (0.00155) (0.00142) (0.00145)R-squared 0.429 0.443 0.567 0.589 0.441
Δ ln (pres. election turnout rate) 1.245** 1.327** 0.835* -0.607* -0.717*(0.560) (0.611) (0.493) (0.335) (0.381)
Tax Pass-Through
A. Δ ln (Presidential Election Turnout Rate)
B. Δln (Per-Capita Outcome )
Reduced-form
Reduced-form
Two-stage Least Squares
( ) ( ) ( ) ( ) ( )
Δ ln (pres. election turnout rate) 0.0694 0.128 -0.0754 0.0607 0.0635(0.0811) (0.0802) (0.0683) (0.0457) (0.0536)
R-squared 0.421 0.436 0.566 0.588 0.438
Observations (counties) 1,129 1,129 1,129 1,129 1,129
Additional Controls:1950s population growth rate XΔ % of population aged 5-17 XΔ % of population aged 65+ XΔ % of families in poverty XΔ % unemployed X
Ordinary Least Squares
Notes: All models include state indicators, 1960 percent black, and the 1960 child poverty rate, entered directly and interacted with the literacy test indicator. Regressions are weighted by 1960 county population. Standard errors (in parentheses) are heteroskedasticity robust. ***, **, and * indicate statistical significance at the 1, 5, and 10 percent levels, respectively.
49

Table 6. Black Representatives?
Dependent variable: Δ(% Black in Upper House/ Δ(% Black in Lower House/% Black in Pop) % Black in Pop)
(1) (2)
literacy test indicator -0.001 -0.182(0.119) (0.119)
R-squared 0.000 0.100
Observations 11 11Unit of observation state state
Notes: The dependent variable is the difference between the ratio of the 1977 and 1982 average percent black in the state legislature to the 1980 percent black in the population and the ratio of the 1964 average percent black in the state legislature to the 1960 percent black in the population. The estimation sample includes all states in the South (AL, AR, FL, GA, LA, MS, NC, SC, TN, TX, and VA). The literacy test indicator is set to one for states with literacy tests still in place immediately prior to VRA (AL, GA, LA, MS, NC, SC, and VA). Regressions are weighted by 1960 state population. Standard errors (in parentheses) are heteroskedasticity robust. ***, **, and * indicate statistical significance at the 1, 5, and 10 percent levels, respectively.
50
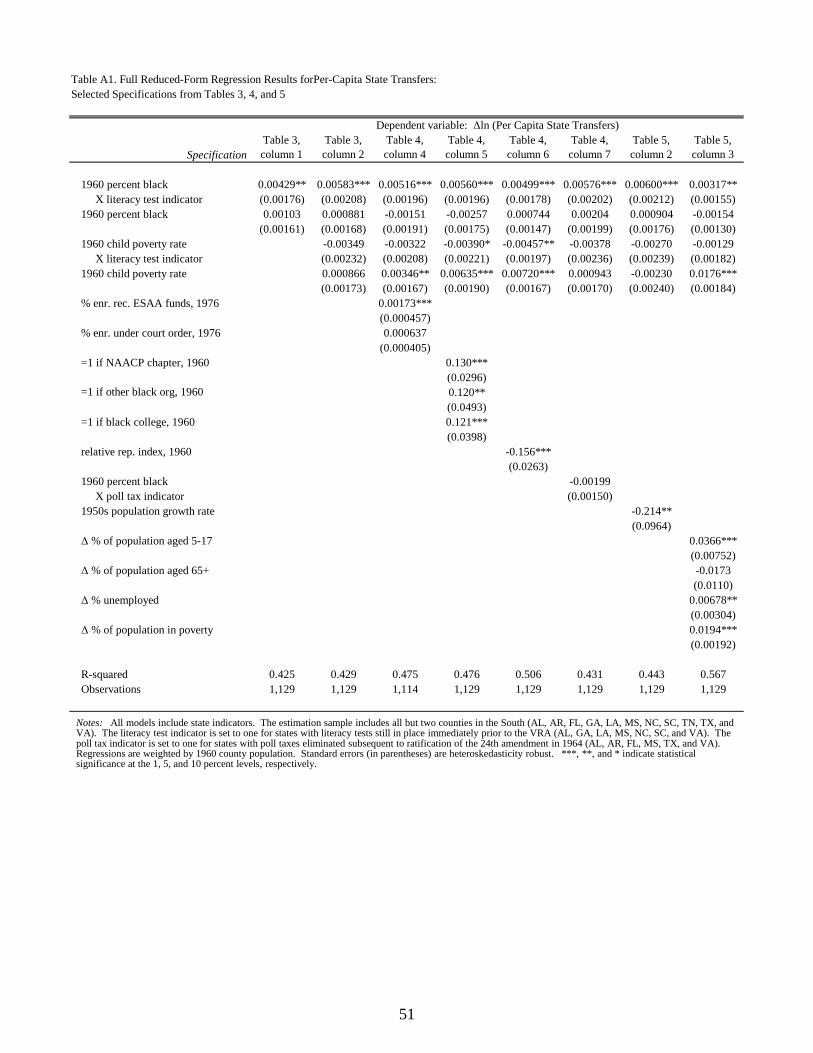
Table A1. Full Reduced-Form Regression Results forPer-Capita State Transfers: Selected Specifications from Tables 3, 4, and 5
SpecificationTable 3, column 1
Table 3, column 2
Table 4, column 4
Table 4, column 5
Table 4, column 6
Table 4, column 7
Table 5, column 2
Table 5, column 3
1960 percent black 0.00429** 0.00583*** 0.00516*** 0.00560*** 0.00499*** 0.00576*** 0.00600*** 0.00317** X literacy test indicator (0.00176) (0.00208) (0.00196) (0.00196) (0.00178) (0.00202) (0.00212) (0.00155)1960 percent black 0.00103 0.000881 -0.00151 -0.00257 0.000744 0.00204 0.000904 -0.00154
(0.00161) (0.00168) (0.00191) (0.00175) (0.00147) (0.00199) (0.00176) (0.00130)1960 child poverty rate -0.00349 -0.00322 -0.00390* -0.00457** -0.00378 -0.00270 -0.00129 X literacy test indicator (0.00232) (0.00208) (0.00221) (0.00197) (0.00236) (0.00239) (0.00182)1960 child poverty rate 0.000866 0.00346** 0.00635*** 0.00720*** 0.000943 -0.00230 0.0176***
(0.00173) (0.00167) (0.00190) (0.00167) (0.00170) (0.00240) (0.00184)% enr. rec. ESAA funds, 1976 0.00173***
(0.000457)% enr. under court order, 1976 0.000637
(0.000405)=1 if NAACP chapter, 1960 0.130***
(0.0296)=1 if other black org, 1960 0.120**
(0.0493)=1 if black college, 1960 0.121***
(0.0398)relative rep. index, 1960 -0.156***
(0.0263)1960 percent black -0.00199 X poll tax indicator (0.00150)1950s population growth rate -0.214**
(0.0964)Δ % of population aged 5-17 0.0366***
(0.00752)
Dependent variable: Δln (Per Capita State Transfers)
Δ % of population aged 65+ -0.0173(0.0110)
Δ % unemployed 0.00678**(0.00304)
Δ % of population in poverty 0.0194***(0.00192)
R-squared 0.425 0.429 0.475 0.476 0.506 0.431 0.443 0.567Observations 1,129 1,129 1,114 1,129 1,129 1,129 1,129 1,129
Notes: All models include state indicators. The estimation sample includes all but two counties in the South (AL, AR, FL, GA, LA, MS, NC, SC, TN, TX, and VA). The literacy test indicator is set to one for states with literacy tests still in place immediately prior to the VRA (AL, GA, LA, MS, NC, SC, and VA). The poll tax indicator is set to one for states with poll taxes eliminated subsequent to ratification of the 24th amendment in 1964 (AL, AR, FL, MS, TX, and VA). Regressions are weighted by 1960 county population. Standard errors (in parentheses) are heteroskedasticity robust. ***, **, and * indicate statistical significance at the 1, 5, and 10 percent levels, respectively.
51

Table A2. Full Reduced-Form Regression Results for Voter Turnout in Presidential Elections: Selected Specifications from Tables 3, 4, and 5
SpecificationTable 3, column 1
Table 3, column 2
Table 4, column 4
Table 4, column 5
Table 4, column 6
Table 4, column 7
Table 5, column 2
Table 5, column 3
1960 percent black 0.00458*** 0.00468*** 0.00501*** 0.00439*** 0.00471*** 0.00464*** 0.00452*** 0.00379*** X literacy test indicator (0.00137) (0.00153) (0.00150) (0.00155) (0.00155) (0.00149) (0.00155) (0.00141)1960 percent black 0.00459*** 0.00454*** 0.00424*** 0.00452*** 0.00454*** 0.00522*** 0.00451*** 0.00437***
(0.00118) (0.00131) (0.00128) (0.00128) (0.00130) (0.00138) (0.00134) (0.00114)1960 child poverty rate -0.000379 -0.000986 0.000133 -0.000337 -0.000548 -0.00113 0.000820 X literacy test indicator (0.00212) (0.00216) (0.00219) (0.00211) (0.00217) (0.00211) (0.00214)1960 child poverty rate 0.000281 0.000700 0.000147 3.04e-05 0.000327 0.00330* 0.00321
(0.00194) (0.00184) (0.00168) (0.00193) (0.00194) (0.00194) (0.00199)% enr. rec. ESAA funds, 1976 -0.000300
(0.000238)% enr. under court order, 1976 0.000356
(0.000224)=1 if NAACP chapter, 1960 -0.0148
(0.0176)=1 if other black org, 1960 0.0501
(0.0507)=1 if black college, 1960 0.0168
(0.0380)relative rep. index, 1960 0.00617
(0.0122)1960 percent black -0.00118 X poll tax indicator (0.00124)1950s population growth rate 0.204***
(0.0508)Δ % of population aged 5-17 0.0215***
(0.00707)
Dependent variable: Δln (Presidential Election Turnout)
Δ % of population aged 65+ 0.00284(0.00463)
Δ % unemployed -0.000409(0.00330)
Δ % of population in poverty 0.00278*(0.00163)
R-squared 0.708 0.708 0.713 0.710 0.709 0.709 0.723 0.720Observations 1,129 1,129 1,114 1,129 1,129 1,129 1,129 1,129
Notes: All models include state indicators. The estimation sample includes all but two counties in the South (AL, AR, FL, GA, LA, MS, NC, SC, TN, TX, and VA). The literacy test indicator is set to one for states with literacy tests still in place immediately prior to the VRA (AL, GA, LA, MS, NC, SC, and VA). The poll tax indicator is set to one for states with poll taxes eliminated subsequent to ratification of the 24th amendment in 1964 (AL, AR, FL, MS, TX, and VA). Regressions are weighted by 1960 county population. Standard errors (in parentheses) are heteroskedasticity robust. ***, **, and * indicate statistical significance at the 1, 5, and 10 percent levels, respectively.
52