Embed Size (px)
Citation preview

NBER WORKING PAPER SERiES
VALUING THE VOTE:THE REDISTRIBUTION OF VOTING RIGHTS AND STATE FUNDS FOLLOWING
THE VOTING RIGHTS ACT OF 1965
Elizabeth U. CascioEbonya L. Washington
Working Paper 17776http://www.nber. orgl paperslw 17 7 7 6
NATIONAL BUREAU OF ECONOMIC RESEARCH1050 Massachusetts Avenue
Cambridge, MA 02138January 2012
We thank Bill Fischel, Alan Gerber, Claudia Goldin, Naomi Lamoreaux, Ethan Lewis, Sendhil Mullainathan,Gavin Wright a¡d seminar partícipants at Dartmouth College, Hunter College and the University ofMiami for helpful conversations in preparation of this draft. Cascio gratefully acknowledges researchsupport from Dartmouth College, and Washington gratefully acknowledges research support fromthe National Science Foundation. All errors are our own. The views expressed herein are those of theauthors and do not necessarily reflect the views of the National Bureau of Economic Resea¡ch.
NBER working papers are circulated for discussíon and comment purposes. They have not been peer-reviewed or been subject to the review by the NBER Board of Directors that accompanies officialNBER publications.
a 2012 by Elizabeth U. Cascio and Ebonya L. Washington. All rights reserved. Short sections of text,not to exceed two paragraphs, may be quoted without explicit permission provided that full credit,including O notice, is given to the source.

Valuing the Vote: The Redistribution of Voting Rights and State Funds Following the Voting RightsAct of 1965Elizabeth U. Cascio and Ebonya L. WashingtonNBER Working Paper No. 17776
lanuary 2012JEL No. D72,H7,I2,J I 5,N32
ABSTRACT
The Voting Rights Act of 1965 (VRA) has been called one ofthe most effective pieces of civil rightslegislation in US history, having generated dramatic increases in black voter registration and blackvoter turnout across the South. We show that the expansion of black voting rights in some southernstates brought about by one requirement of the VRA - the elimination of literacy tests at voter registration
- was accompanied by a shift in the distribution of state aid toward localities with higher proportionsof black resldents, who held newfound power to affect the reelection of state officials, a finding thatis consistent with models of distributíve politics. Our estimates imply an elasticity of state transfersto counties with respect to turnout in presídential elections - the closest available measure of enfranchisement
- of roughly one.
Elizabeth U. CascioDepartment of EconomicsDartmouth College6106 Rockefeller HallHanover, NH 03755and [email protected]
Ebonya L. WashingtonYale UniversityBox 826437 Hillhouse, Room 36New Haven, CT 06520and NBERebonya.washington @yale.edu

I. INTRODUCTION
The Voting Rights Act of 1965 (VRA) has been called one of the most effective pieces of
civil rights legislation in United States history (Grofman and Handley 1998). By 1967, black
voter registration rates in all southern states exceeded 50 percent, compared with less than eight
percent in Mississippijust prior to the legislation's passage.t Black voter turnout increased
commensurately (United States Commission on Civil Rights 1968). Academic research supports
the contention that the federal government's forcible removal ofvoter registration barriers, in
particular literacy tests, causally increased black registration relatively and absolutely (Alt 1994),
and increased county turnout by an increasing function of the county's black population share
(Filer, Kenny, and Morton 1991).
While the initial increases in black voting and later increases in black office holding are
noteworthy (Grofman and Handley 1998, Washington 2011), the VRA was predicted to do much
more than allow blacks entrée to voting booths or even elected offices. The franchise was viewed
as the gateway to equality in other aspects of life (Button 1989). "If Negroes could vote," Rev.
Dr. Martin Luther King saidjust months before the Act's passage, "there would be no oppressive
poverty directed against Negroes, our children would not be crippled by segregated schools and
the whole community might live together in harmony" (Herbers 1965). While harmony may be a
nebulous concept, public funding for education, Íansportation, and other services to improve the
quality of life in local communities is quantifiable. Longitudinal case studies ofTuskegee, AL
and Durham, NC (Keech 1968) and six Florida communities (Button 1989) document, following
passage of the Act, an improvement in public services (e.g., street paving, garbage collection,
fire and police services) in black neighborhoods that is suggestive of an effect of
t We define the South to include the 11 states of the former Confederacy: Alabama, Arkansas, Florida, Georgia,Louisianâ, Mississippi, North Carolina, South Carolina, Tennessee, Texas, and Virginia,

enfranchisement. We examine whether the case study evidence is reflective of a causal impact of
voting rights on public resource receipt more generally.
More specifically, we exploit the federal removal ofa state barrier to black voting, the
literacy test, in order to estimate the impact of enfranchisement on the receipt ofpublic
resources. In accordance with models of distributive politics described in the next section, the
removal of literacy tests should have strengthened incentives for state elected officials to direct
funding toward blacks, who held newfound power to affect their reelection. We therefore test for
shifts in the distribution of state transfers toward localities with larger black populatíon shares in
states that had líteracy tests prior to passage of the VRA. To account for the possibility that both
voting rights and state funds would have been redistributed toward blacks in the absence ofthe
legislation, we use southern states without líteracy tests - but with histories ofslavery and black
disenfranchisement - as a comparison group. The treatment and comparison counties show
similar pre{rends in the gradients ofboth voter turnout and state transfers in black share,
pointing to the credibility of our research design.2 Our findings are also robust to controlling for
correlates of state transfers to localities identified by previous research, like budgetary lags and
local need, as well as for correlates of state transfers specific to our setting, related to court-
ordered school desegregation, black political activism, and legislative redistricting.
We find shifts in state transfers toward localities with larger black populations after the
VRA in states where literacy tests were removed as a result of the Act. We estimate that the
mean county in a literacy test state saw an increase in per-capita transfers of 12.4 percent more in
the decade and a half following the VRA than a comparison county with the same black
population share. More generally, the elimination ofthe literacy test generated an additional five
2 Results further withstand trimming to create common support in 1) black shafe and 2) propensity to be located in a
literacy test state, as well as inverse propensity score weiShting.
percent increase in per-capita state hansfers for each additional ten percentage point increase in a
county's 1960 black population share. Consistent with previous work and with an effect on
enfranchisement, we also see relatively large increases in voter turnout in areas with higher black
population shares in treated states over this time period. We cannot reject the null hypothesis that
the elasticity of state transfers with respect to voter turnout is one. Moreover, the relatively large
changes in the distribution ofstate aid and voter turnout in treated states are closely timed with
the introduction of the legislation, further supporting interpretation of our estimates as the causal
impact of enfranchisement on state resource receipt, This impact, we should be clear, is not
through the channel of black representation, as the large increase in black elected officials lagged
the passage of the Voting Rights Act by about two decades.
Our focus on the impact of enfranchisement may put some readers in the mind of Husted
and Kenny (1997) and Kenny and Lott (1999), who find that the expansion ofthe franchise to
lower income voters and to women tilted policy toward greater welfare spending. Similarly,
Miller (2008) finds that women's suffrage led to increased public health spending. We differ
from this line of work in that our interest lies not in the impact of enfranchisement on the level of
spending, but on the distribution ofthat spending.3 That is, we ask, holding size constant, do
increased voting rights lead to an increase in the share of government funding? Our paper is also
relâted to work showing an association between local turnout and government transfers. For
example, Strömberg (2004) demonstrates a causal relationship between county radio ownership
and New Deal dollars received; he estimates that about 10 percent ofthe effect is through radio-
driven turnout increases.4 The crucial distinction between this líne of work and our own is that
3 The geography-based âpproach that we use here could not be used to study the distributlonal impacts of theconstitutional amendments that enfranchised women and l8-21 year olds, tlvo groups whose spatial distribution ismore equal across localities.a See also Fleck (1999) and Martin (2003).

thei¡ focus is on the impact ofthe decision to exercise the franchise, while our focus is on the
impact of gaining it.
Our findings suggest a causal link between electoral participation and the geographic
distribution ofstate funds. These findings are ofboth historical and modern-day significance.
The lion's share of these state grants was targeted for public education - one of those aspects of
life Dr. King and other civil rights activists hoped would improve once blacks regained the right
to vote. Southern black disenfranchisement following Reconstruction was in fact accompanied
by sharp declines in school expenditures per black pupil (Margo 1990, Naidu 2010). Our
findings suggest that black re-enfranchisement in the 1960s generated an influx ofstate funds to
enable a reversal in those declines. The impact of voting rights on public funding may also be a
modern-day policy concern. In recent years, states have passed legislation increasing
requirements for voter registration, for example by requiring the presentation of government-
issued photo identification at polling places. These laws are expected to have their greatest
impact on young, poor, and minority voters, and have recently been called "the most concerted
effort to restrict the right to vote since before the Voting Rights Act of 1965" (Lewis2011).
We proceed with the paper as follows. In Section II, we provide theoretical motivation. In
Section III, we describe the history of voting rights in the South, and in Section IV, we discuss
our main data sources. We present graphical results in Section V, followed by regressions,
robustness checks, and investigations of mechanisms in Section VI. In Section VII, we provide
evidence against black elected officials as a potential channel, In Section VIII, we conclude.
II. THEORETiCALMOTIVATION
The theoretical distributive politics literature (see, for example, Cox and McCubbins
(1986), Lindbeck and Weibull (1987), Dixit and Londregan (1996 and 1998)) suggests that black

enfranchisement following the VRA should have weakly increased public resources flowing to
black communities, In these models, politicians or parties distribute resources to clearly
identifiable constituent groups in order to maximize votes. Whether the politician should direct
more resources to her core supporters or to swing voters is of ongoing debate. The answer to the
question depends on the modeler's assumptions about the politician's risk aversion and the
efficiency of targeting various groups and on the various groups' marginal voting response
(turnout, choice) to political resource receipt. But whether the politician should direct resources
to the enfranchised or unenfranchised is not in question.
Blacks in the South, following the passage ofthe VRA, were theoretically an attractive
and easily targeted interest group for political patronage. Blacks were both geographically
identifiable and tended to vote cohesively (Keech 1968), Given the relative deprivation ofblack
neighborhoods, black voters also likely had a high marginal utility ofschool, road, or other
neighborhood improvements. And although blacks did not comprise a majority of the electorate,
thís would not have precluded a causal relation between their voting eligibility and their public
goods receipt. Unlike in legislative voting in which politicians must take a single side ofthe
issue thereby disappointing voters with the opposing view, politicians may distribute resources
such as school and road improvements to several constituent groups in order to build a winning
coalition. We examine empirically the extent to which black voters were so targeted.
III, HISTORY OF BLACK VOTING RIGHTS IN THE SOUTH
Following Reconstruction, legislatures in the states ofthe former Confederacy began to
curtail the voting rights granted to black men by the 15th amendment.s Beginning in 1890, each
of these states enacted a combination of grandfather clauses, all-white primaries, poìl taxes, and
s lnitially, these rights were Iimited extraJegally, through violence, intimidation, and voter fraud

literacy tests among other creative legislation to prevent blacks from participating in local, state,
and federal elections.
While in a few cases a state eventually removed one of these voting obstacles by its own
volition, in the vast majority ofcases, these laws were removed by federal intervention.
Grandfather clauses, limiting the franchise to those men who held it before the Civil War and
their male descendants, were declared unconstitutional by the Supreme Court in 1915. In 1944,
the court outlawed all white primaries, which were held to varying extents in all 1 1 southern
states (Key 1949). The ratification ofthe 24th amendment in 1964 ended poll taxes in federal
elections6 in the four southern states that had not previously ceased the practice. All of the states
ofthe former Confederacy adopted poll taxes initially. However, Key (1949) argues that upon
the adoption ofthe all-white primary the poll tax was no longer a binding constraint on black
voting: "lt became simply a tax on voting by whites and nothing more" (p. 579).
Our identification strategy exploits the exogenous end to the use ofthe literacy test-a
registration requirement that from its conception to its termination in 1965 was aimed primarily
at disenfranchising black voters (Key 1949). In fact, by the time of the passage of the VRA, the
literacy test was the key obstacle to black voter registration. All seven of the former conlederate
states that ever adopted literacy tests - Alabama, Georgia, Louisiana, Mississippi, North
Carolina, South Carolina and Virginia - kept these laws on their books until the VRA forbade
the practice in 1965.7 While dejure these tests, which often required an applicant to read and/or
write a section of the United States Constitution, applied equally to potential voters of all races,
de facto these laws were more likely and more strictly enforced against black applicants (Key
6 The Supreme CourL Case Harper v. Board ofElections ended poll taxes for state elections in 1966./ The initial passage of the VRA forbade literacy tests in Alabama, Georgia, Louisiana, Mississippi, South Carolina,
Virginia and forty counties in North Carolina. Thesejurisdictions were singled out because they l) used an illegalregistration device (literacy test) and 2) had voter registration or turnout of under 50 percent. With the renewâl of the
law in 1970, Congress outlawed literacy tests nationwide,

1949). Suggestive ofthis, we find in the 1960 cross section of counties in states with a literacy
test that a ten percentage point increase in county black population share is associated with a four
percentage point decrease in county turnout for the presidential election, even controlling for the
county's high school graduation rate, By comparison, the association is a ten percentage point.
increase in black share and a one percentage point decrease in turnout in the non-literacy test
southern states of Arkansas, Florida, Tennessee and Texas.s
Following the March 1965 televised beating of civil rights activists peacefully marching
from Selma to Montgomery in what would come to be known as "Bloody Sunday," President
Johnson was able to introduce, secure passage in Congress, and sign into law the VRA injust
five months. In addition to outlawing literacy tests, the VRA ended discriminatory practices that
were prevalent throughout the South, such as redrawing districts to prevent blacks from attaining
elected office. s The nondiscrimination requirements, like the vast majority of the VRA, apply to
all southern states - in fact all states across the nation - notjust those that made use of literacy
tests in the registration process. Where the law differs byjurisdiction is in regards to Section V,
which mandates preclearance by the United States Department ofJustice for any change in
electoral procedure. The seven former literacy test states as well as Florida and Texas are subject
to preclearance.lo
' We next describe the data and methodology we will employ to ascertain how the VRA's
elimination of literacy tests impacted black enfranchisement and consequently, we argue, the
distribution of public resources across communities of varying racial composition.
I Regressions are weighted by 1960 county populâtion.
'g The prohibition included all levels of political jurisdictions, including school distrjcts,¡0
Jurisdíctions are subject to Section V preclearance because ofpast use of an illegâl device (in the case ofFloridaand Texas, failure to provide Spanlsh language voting materials) and low turnout, There are also several areas
outside of the South that are subject to preclearance, primarily because of failure to provide foreign language votingmaterlals.

IV. DATA
A. Data on State Transfers to Localities
We examine within-state shifts in the distribution of voting rights and public resource
receipt in the South from the 1950s to the early 1980s, a period surrounding the passage and
enforcement of the VRA. As described above, we focus on whether the new mandate resulted in
state governors and legislators, who control state finances, directing more of those funds to black
communities, who held newfound power to affect their reelection.
Thus, our key dependent variable is per-capita state transfers to localities. This
information has been collected by the Census of Governments (COG) every five fiscal years for
decades. We focus on the years 1957 through 1982. During this sample period, state transfers to
localities made up about one-third of state expenditures nationwide and in the South. The
strength ofstate transfers to localities as an outcome variable is that the recipients of these
transfers are geographically identifìable; it is hard to tell which state residents are benefitting
from the remaining two-thirds ofspending (Ansolabehere, Gerber, and Snyder 2002).
Throughout the sample period, the vast majority of state transfers to localities (73 percent in the
South and 60 percent nationwide) were for education. General spending and highway funds each
constituted 10 percent of these transfers in the South. The pattern of transfers by funding type
does not vary signifícantly over the sample period (United States Department of Commerce
1957, 1962, 1977 and 1982).
The COG files that we use report state intergovernmental transfers to local jurisdictions
(e.g., counties, municípalities, townships, school districts, and special dishicts) aggregated to the
county (and year) level. An advantage to using the county as our unit of analysis is that counties

are not political units with endogenous boundaries that are altered during redistricting.rr County
boundaries essentially remain fixed across our 25 year sample period.rz Another advantage of
using the county area fìle is that consistent data are available for all states in the South. Since the
structure of local government varies across the South, it would not be possible to use the
jurisdiction-level COG without losing data for some states.r3
One disadvantage to counties is that they are not our true unit ofinterest. We want to
understand the connection between an individual's vote and that individual's receiving a larger
share ofstate resources. Our county-level data therefore may suffer from aggregation bias. We
can demonstrate the relative increase in funds going to treatment counties with large black
populations, but we cannot prove that the money is actually targeted to predominantly black
school districts or city governments. Even with data at a local jurisdiction level, however, we
could not prove that money transferred to a predominantly black district bought textbooks for
black children or paved roads to carry black adults to their workplaces, However, we note thât
the theoretical insights, the timing of the funding increases, and previous research on the increase
in black voter registration bolster the argument that increases in funding to counties with higher
black populations actually reached newly enfranchised black citizens.
Because the individual rather than the county is our unit of interest, we weight our
regressions by 1960 population so that they yield the impact on the average person, rather than
rr Altering district boundaries wâs a procedure used by southern states to keep blacks from political offìce inc^ommunities in which the black population was growing. See, for example, Trebbi, Aghion, and Alesina (2008),'" In Virginia, some independent cities and counties combine or split up over time, In these cases, we aggregated thedata to the largest unit to which the county or city wâs party over the sample period prior to our analysis. That is, weaggregated data to C if it was created out of a merger of A and B, or if A and B were created from C over the sampleperlod. A history of these reorganizations is âtl<http://publications.newberr.v.ory/ahcllp/docunìenls^,/A Consolidated CIìÌonologv.htnì#Co¡tsolidared Chronolop),>. Our estimates are quantitatively similar when these observations or even the entire state of Virginia are droppedfrom the samDle.r3 Most notabìy, school districts in North Carolina, Tennessee, and Virginia are dependent on higher levels ofgovernment, Therefore the COG school district data do not contain observations for school districts in these statesand we would lose these states in a school district level analysis.

the average county. As shown in the upper panel ofTable 1, the weighted mean per-capita state
transfer to local governments in states that had literacy tests prior to the VRA was $356 (2009
dollars) in the pre-period (the average of the 1957 and 1962 fígures) and $763 in the post-period
(the average ofthe 1977 and 1982 figures). The figures are $317 and $674 in the other southern
states.14 Because we are interested in within-state changes in the distribution of this aid and states
vary in their average aid levels, we use the natural log of per-capita state transfers in our
regression estimation. The growth rate of per-capita state transfers over the twenty-year period is
on average 82 percent in states with literacy tests and 76 percent in the remainder of the South.
One complication to the state transfer data is that not all funds that the state reports
transferring originate with the state. Some federal "pass through" money - funds that the federal
government provides to localities through states - is included, though it is estimated to be less
than 15 percent of the total in most states (Ansolabehere, Gerber, and Snyder 2002). To the
extent that state governments have discretion over how to distribute these federal funds, their
inclusion in t¡ansfer totals does not bias our estimates ofthe amount that state officials decide to
transfer to each locality, Rather, the concern is that the nondiscretionary dollars may be
correlated with increases in enfranchisement following the VRA,t5 We know, for example, that
predominantly black areas were more likely to be allocated federal funds for education due to the
Elementary and Secondary Education Act of 1965 (ESEA). We address this issue by controlling
in our preferred specifications for the 1960 child poverty rate, the primary determinant ofcounty
ESEA formula amounts.
B. Data on the Local Electorate
ra Our estimation sample includes all counties in the 11 southern states (aggregated to account for the consolidationsa.nd splits in Virginia), save two for which we are missing control variables.
'" The degree of state discretion over federal pass{hrough funds was curtailed du ng this period by the non-discriminâtion clause in the Civil Rights Act, which required either nondiscrimination or nonparticipation in federalprograms.
10

Ideally, we would start with a "fìrst stage" demonstrating the impact ofliteracy tests on
voter enfranchisement, or potential voter turnout. However, we do not have a measure of
enfranchisement. As a substitute, we consider actual voter turnout as a share of the voting age
population at the county level, drawing on data spanning the years 1952 to 1980.16 Turnout in
presidential elections is higher than in any other electoral contest, Therefore the presidential
turnout rate gives us our best measure of potential turnout. Nonetheless, given our focus on state
transfers, which are controlled by state elected officials, we also consíder turnout rates for
gubernatorial elections. The limitation of gubernatorial elections as an outcome is their
variability. Because these elections vary across states and years in their timing, their procedures,
and their competitiveness, they are more difficult to compare across localities than presidential
elections, in which the whole country chooses from the same two candidates on the same day.
Our focus will thus be on presidential turnout, though results for gubernatorial turnout under all
specifications presented below are available on request.
The top panel ofTable 1 presents summary statistics on voter turnout by presence ofa
literacy test, again weighting by 1960 county population. As expected, turnout is lower and more
variable in gubernatorial elections. Consistent with the impacts of literacy tests previously
estimated applying differences-in-differences to state-by-year data (e.g., Besley and Case 2003),
states with literacy tests saw relatively large gains in voter turnout over time. Voter turnout in
states with literacy tests converged with, ifnot surpassed, that elsewhere in the South by the end
ofthe period, Our empiricai approach will illuminate how those gains in turnout varied by
county racial makeup within states.
ro Turnout data come from Matt Gentzkow and Jim Snyder and from various editions of Amet icq l/otes. Analternative proxy for enfranchisement would be voter registration by race. We employ turnout in this analysisbecause registration data are both infrequent and missing for a large number ofsouthern counties (mainly entirestates), particularly in the post-VRA period.
ll

C. Other County Characteristics
We draw from a number of other data sources (described in the Appendix) to construct
controls for the analysis to follow. These variables are summarized in Panel B ofTable 1, again
weighting by 1960 county population. Counties in states with literacy tests on average had both
higher black population shares (29 percent versus 15,3 percent elsewhere in the South) and
higher child poverty rates in 1960 (24.3 percent versus 17.5 percent). At that time, counties in
literacy test states were also more likely to be under court order to desegregate (51.4 percent
versus 43.8 percent), although counties in the two types ofstates saw similar receipt of funds
under the Emergency School Aid Act of 1972 (39 percent versus 37.6 percent), a federal
program intended to facilitate racial integration ofschools. As for proxies for black political
activism, counties in both states were equally likely to be home to black colleges. However,
NAACP chapters were more often located in counties in states without literacy tests, while other
black organizations were more frequently found in counties in states with literacy tests. The
population growth rate over the 1950s was relatively low in literacy test states, though the two
regions experienced similar changes in the demographic composition of their populations over
the next two decades.
V, EVENT-STUDYESTIMATES
Recall that the elimination of literacy tests following the VRA should have had a larger
impact on voting rights in counties where a higher fraction of the voting age population would
have been denied the franchise through their enforcement. In princlple, literacy tests should have
been administered to all applicant registrants, but the historical record suggests that they were
applied disproportionately - ifnot solely - to blacks. A transparent approach to estimating the
impact of literacy tests on the within-state distribution ofstate transfers is therefore to explore

how the gradient of transfers in pre-existing county black share changed over time within states
where literacy tests were forcibly removed by the VRA. If literacy tests had an impact, we would
expect to see a change in this gradient around 1965, i.e., a shift in the distribution of state
transfers toward areas with larger black population shares. We should also observe a similar shift
in voter turnout to reflect the change in the distribution ofthe electorate, as has been documented
in previous work (Filer, Kenny, and Morton 1991).
One problem with this approach is that both state aid and voter turnout may have been
redistributed toward areas with larger black shares even in the absence of literacy tests being
removed by the VRA. For example, black activism during the civil rights movement, either
directly or through an impact on black voter turnout, may have yielded rewards in the form of
more state aid for localities with higher black shares. School desegregation in the South, which
began in earnest after passage of the Civil Rights Act of 1964 (Cascio, et al. 2008), was also
associated with larger state funding increases for school districts with higher black enrollment
shares (Reber 2011, Johnson 2011).
We therefore combine the strategy described at the start of this section witl the use ofa
comparison group. That is, we test whether there were larger shifts in the distribution ofstate
transfers toward counties with larger black population shares in treated states than in a group of
comparison states, around 1965. Likewise, we should document larger gains in turnout for
counties with larger black population shares in treated states before and after the legislation was
passed, reflecting enfranchisement. rT As described above, we limit the comparison group to
counties in the four states in the South that did not have literacy tests prior to the VRA -
Arkansas, Florida, Tennessee, and Texas. Each of these states has a history of slavery and of
r7 We also control for proxies for black political activism and school desegregation within this framework below and
find that our estimates are little âffected.
l3

disenfranchising blacks after Reconstruction: as earlier discussed, all had all-white primaries
until they were outlawed in 1944, and all had poll taxes at some point; indeed, Arkansas and
Texas charged poll taxes in federal elections until 1964, and Texas kept poll taxes for state
elections on the books until 1965.18 While the comparison counties on average had lower black
population shares in 1960 (Table 1), there is significant variation in the geographic distribution
of the black population within each region that can be leveraged for identification. Notably, our
findings are robust to trimming the sample to create greater common support in both black share
and in propensity to be located in a literacy test state and to inverse propensity score weighting.
To set ideas, Figure 1 uses the full sample and shows population-weighted estimates of
the gradients of county voter turnout and per-capita state transfers to the county in 1960 county
black population share, separately by year and treatment status, from models that also include
state indicators. Consider first the estimates for voter turnout rates for presidential elections,
shown in Panel A. The solid circle at about -0.01 for 1952 indicates that, in states with literacy
tests, each percentage point increase in county black share was associated with a one percent
decrease in the turnout rate for the 1952 presidential election. In comparison states (hollow
circles), the gradient ofturnout in black share is also negative in 1952, but not as steep. These
relationships remain quite stable through the 1960 election, but flatten out in the treatment and
comparison regions alike in 1964, the last election before the VRA. The change in the black
share gradient in both treatment and comparison counties in 1964 may be due to black voter
registration drives across the Southre or to unusually high interest in the Goldwater-Johnson
r8 Poll taxes for stâte level elections in Alabama, Mississippi, and Virginia were also repealed after the VRA. Below,we test whether eìimination of the poll tax can explaln our fìndings. We find that it cannot.
'v Wright (201 l) notes that beginning in 1962 the Voter Education Project (VEP), a coalition of five major civilrights organizations coordinated by the Southern Regional Council, supported local groups in a mass registrationeffort throughout the South that registered 700,000 new voters in two-and-a-half years, Thus one might wonderwhether activist groups alone would have eventually closed the gap in black voter registration between literacy andnonliteracy test states. This seems unlikely given the violent resistance that hampered the organization's registrallon
t4
face-off in counties with higher black shares. Regardless, what is clear from the co-movement of
gradients is the need for comparison counties in our estimation strategy.
Our " first stage" result is then seen starkly as we move from the 1964 to the 1968
presidential election, the first held after the passage ofVRA, The convergence in average turnout
in counties in treatment states to that in the comparison counties, shown in Table 1, thus appears
to have been driven by relatively large increases in turnout in treatment counties with higher
black population shares. While in the elections prior to the passage ofthe Act, the treatment
group dots consistently fell 0.005 log points below those for the comparison group, after the
passage ofthe Act, the solid and hollow circles are nearly atop one another; once literacy tests
are removed, the difference in the black share turnout gradient between treatment and
comparison states is removed as well.
We demonstrate the statistical significance of the closing of this gap in Panel A of Figure
2. Here, we plot estimates ofthe coefficients d¡ (with 95 percent confidence intervals) from the
following event-study model: 20
(1) tn$ "",)
= a "
+ y ",
+ | p,(nnt "
x ni ) + Ze,Qu " x o/obt
" x D l ) + e
",,j+1960 l+1960
where y",, represents the presidential election turnout rate in county c in state s in yeat r, %oblc
represents percent black in c's 1960 population; /i/" is an indicator variable set to one ifstate s
had a literacy test that was removed following the VRA, zero else; and D/ is an indicator
variable set to one ift =/, zero else. The model also includes county fìxed effects, á", and state-
by-year fixed effects, /"r. The former account for fixed differences in turnout across counties,
while the latter account for time-varying, state-specific shocks to turnout including those related
efforts in the Deep South and led the Johnson administration to contemplate federal voting rights legislation evenbefore Bloodv Sundav.20 Standard eirors are"clustered on county, and the regressions are weighted by 1960 population.
15

to state economic conditions or institutions, such as state rules regarding redistricting.2r The state
fixed effects will also capture the impacts ofthe VRA on aggregate state turnout.2z Because the
model includes these two sets of fixed effects, we omit the interactions with the indicator for one
pre-VRA election year (e.g., interâctions with D,re60), so that the model is identified.23 The
coefficient p; then captures the change in the gradient of turnout in black population share
between 1960 and yearj for comparison states. Likewise, the sum p; + d¡ captures that change for
treatment states.
Figure 2 thus presents estimates of the dffirence in the black share gradients in the
treatment and comparison states shown in Figure 1, relative ¡o the difference observed in some
pre-VRA year. That is, the estimates presented in Figure 2 re-normalize the estimates presented
in Figure 1 so that the difference in the black share gradients between the treatment and
comparison states is zero for some specified year prior to the VRA, e.g., 1960 in the case of
presidential turnout in Panel A. As the pre-VRA (1952, 1956 and 1964) circles indicate, the
treatment-comparison differences in the black share gradients remained almost unchanged (and
statistically indistinguishable) in the elections prior to the passage of the Act. Thus, even though
the comparison counties have some different observable characteristics from the treatment
counties, trends in turnout with respect to black population share are almost identical in the two
groups ofstates prior to the VRA being passed, suggestive of the validity ofthe comparison
group, There is a sharp change beginning in 1968, however, reflecting the relatively large
2r The state-by-year fixed effects would also account for any chânges in state level political competition, Besley,
Persson, and Stu¡m (2010) argue that the removal ofvoting barriers increased state politicâl competition and
therefore state economic growth.22 In the analogous regression for per-capita state transfers, they will capture the impacts of the VRA on aggregate
state transfers to local governments. We know of no study that has estimated this relationship, Husted and Kenny(1997) document increases in stâte welfare expenditures following the removal of literacy tests, but the vast majorityofstate tmnsfers to counties in the South during our sample period (roughly 83 percent) were for either education orh_ighways.
'J The models for gubernatorial turnout and per-capita state transfers differ only in the omitted year,
16

increases in turnout in the highly black counties in states that were no longer allowed to employ
literacy tests as a barrier to registration. The 95 percent confidence interval bars indicate that the
narrowing of the gap in turnout within treatment states is highly statistically significant, and it
remains so over the remainder of our sample period.
In the second panel ofeach of Figures 1 and 2, we present analogous estimates for
gubernatorial turnout. For tractability, we bin gubernatorial elections into four year periods.
Thus, 1953 includes the first gubernatorial election in the state on or after after January 1,
1953.24 We omit the interactions with the indicator for the 1957-60 period so that the model is
identified. Although these estimates are noisier, they follow a pattern similar to our findings for
presidential turnout. The pre-VRA (1953, 1957 and 1961) trend is similar in treatment and
comparison counties. Between 1961 and 1965, both series show a steep increase; however, the
jump in the treatment series is larger, indicating the relative increase in the black share turnout
gradient in treatment states in 1965. This change is statistically significant, as shown in Figure 2.
Thus, consistent with the findings ofFiler, Kenny and Morton (1991), the first two panels
of Figure I and Figure 2 provide evidence that outlawing literacy tests increased county turnout
as an increasing function ofthe county's initial black population share. In the final panel ofthe
figures, we ask whether this increase in eligibility-driven turnout was accompanied by an
increase in state transfers received per capita. In these figures, the years are marked in five-
(fiscal) year intervals beginning with 1957, to match the availability ofthe COG data. Although
we have only two pre-VRA observations, they are quite suggestive ofa similar trend: in Figure
1, the treatment and comparison circles are almost exactly on top ofone another. Again, this
suggests the validity of the comparison group, as it appears to be capturing what would have
z{ That is, in the few states with biennial gubernatorial elections, we use the election closest to the beginning of the
interval beginning Jânuary I of the specifìed year,
t7

happened in the treatment states ifliteracy tests had remained legal. Having a comparison group
is also again critical: the gradient ofstate transfers in black population share moves from
negative to positive in both series from 1957 to 1962, reflecting civil rights era gains - in this
case in terms of funding rather than voting rights - that accrued in predominantly black areas
throughout the South.25
The impact of the removal of literacy tests with the VRA on funding patterns can then be
seen in comparing the post-1965 treatment and comparison series. Because of lags in budgeting
and funding, we do not necessârily expect a sharp break in the relative treatment and comparison
patterns in 1967, our first post-treatment year. However, a marked divergence between the two
series does emerge. The difference intensifies in the 1970s, as state aid becomes sharply
redistributive toward areas with higher black populations in the treatment states. Because of the
noisiness of the data, the difference is only significant in 1977, as shown in Figure 2. However,
the coefficients clearly point to an increase in state transfers to accompany the increase in
enfranchisement.
VI. LONG-DIFFERENCEESTIMATES
A. Baseline Estimcttes
The graphical evidence is consistent with the elimination of literacy tests having an
impact on both enfranchisement and state transfers, To summarize the event-study results, to
provide a concise means ofsubjecting the estimates to a number ofspecification and robustness
checks, and to establish magnitudes, we now move to the long-difference specification.
25 This is Iikely the continuation of a much longer run trend. Starting in the 1940s, school dishicts with higher black
populâtion shares in the South began to benefit relatively more from increases in state aid for education, which as
earlier noted constitutes three-quarters of state transfers to local governments in the South. Initially, these gains in
state aid resulted from increases in black teacher salaries associated with NAACP victories in teacher salaryequalization cases and tight black teacher labor markets in the South, but they were also undertaken by states in an
effort to stave off racial lntegratlon of schools (Margo 1990i Donohue, Heckman, and Todd 2002; Ashenfelter,Collins, and Yoon 2006).
18

Because budgetary responses to a change in the electorate occur with a lag (due to lags in
assuming office following elections, setting a new budget, and that budget's taking effect), we
take a twenty-year difference:
(2) ahþ"")= ¡" + po/obl" + 0Qit",o/obl")+ *",' B *r""
where Àlnþ"") is the growth rate in either turnout rates or real per-capita state transfers over a
twenty-year period spanning the VRA, x"" is a vector of controls, 7s is a state fixed effect (a state
trend in this difference specification), and all other variables are as previously defined. Model (2)
differences model (1) across two data points at the start and end ofour sample period, and adds
further controls.26 Thus, the coefficient p characterizes the (within-state) change in the black
population share gradient in comparison counties, and p + d does the same for treatment
counties; the coefficient of interest is again the difference, d. Estimates of d will be identified if,
in the absence ofthe VRA, real per-capita state transfers would have grown at the same rate in
the treatment and comparison states, adjusting for covariates.
To show how the long-difference estimates relate to the graphical evidencejust
presented, Table 2 provides estimates of d from equation (2) alongside estimates of the event-
study coefficients that were shown visually in the figures, the d; from model (1).27 For the long-
difference estimates for per-capita state transfers, we average the two years of data at the
beginning and end ofour sample period to mitigate budgetary noise; for turnout, we use retu¡ns
from the 1960 and 1980 presidential elections and from the gubernatorial electíons during the
four-year intervals ending in 1960 and 1980 (e.g., 1957-1960 and 1977-1980). The panels of
Table 2 pertain to the same respective outcomes as the panels in the two figures.
26 There is ofcourse no reason why we could not add the controls to model (1). We choose to add them in model (2)
for concise exposition, as well as due to the fact that some controls are not available in the intervening years.27 We continue to weight the long-difference models by 1960 county population. Standard errors are
heteroskedasticity robust.
19

Consider first the estimates for voter turnout rates. The significant 0.00458 in column 2
of Panel A indicates that each one percentage point increase in black population share is
associated with a 0.46 percent increase in presidential turnout in treatment counties relative to
comparison counties, This amounts to a 13.3 percent increase at the mean of 1960 black
population share in Íeatment counties (29 percent, given in Panel B of Table 1). Over the twenty
year period, presidential turnout in treatment counties increased by about ten percentage points
(Panel A, Table 1), to nearly close the gap with comparison counties. Our estimates suggest that
halfofthe relative gain in turnout in treatment states can be attributed to the removal of literacy
tests,28 The removal of literacy tests in treatment counties served not only to increase turnout
significantly in presidential elections, but in state level gubernatorial elections as well, as shown
in Panel B.
These findings suggest that following the VRA, enfranchisement significantly increased
in black share at an increasing rate at both the federal and state levels, providing new incentives
for state officials to distribute state resources to counties with larger black shares. Consistent
with this, the significant 0.00429 coefficient in the final column of the table indicates that each
one percentage point increase in black population share is associated with a 0.43 percent increase
in per-capita state transfers in treatment counties relative to the comparison counties, an effect
that is the average ofthe 1977 and,l982 coefficients shown in the event-study specification.2e
This estimate implies that each additional ten percentage point increase in 1960 black share was
associated with an additional five percent increase in relative transfers , or a 12.4 percent relative
2E The percent black main effects are âbout the same slze and are statistically significant, shown in Table 42, Astreatment counties have a higher black share on average, the general increase in voting access for blacks throughoutthe South during this time period is also likely a factor in naüowing the gâp.
" While we chose a 20 year difference in part because of the ease with which one can obtain decennial controls atthe county level, one can see f¡om comparing the 1972 and 1982 state transfer event study coefficients, thât ourresults would be nearly identical lf we chose to average 1972 and 1977 fot our post period instead of 1977 and 1982,
20

increase over the twenty-year period at the mean of 1960 black population share in treatment
counties.
Because we are interested in the impact of enfranchisement on state transfers, ideally we
would normalize this estimate by the increase in voter eligibility in these counties. As we
explained earlier, our best proxy for voter eligibility is presidential voter turnout. Normalizing
our transfer results by our turnout results using a two-stage least squares (ZSLS) model, where
we instrument for the grówth in presidential turnout with Iit, x o/6bl",we estimate that a one
percent increase in turnout increased county residents' state resources by 0.94 percent. We
cannot rule out that the elasticity of transfers with respect to turnout is one.30
We show this 2SLS estimate in the first column of Table 3, after repeating the estimaies
of d from model (2) for presidential turnout and real per-capita state transfers, respectively. As a
point of comparison, the final row in the first column gives the OLS relationship between
transfers and turnout. This relationship is close to zero and statistically insignificant. There is
great variation in turnout from election to election, much of which is explained by state-year
swings in competitiveness in the election. We posit an impact on a county's share of resources
through permanent changes in eligibility, not through transitory swings in interest. The OLS
estimate is significantly lower than 2SLS, suggesting that swings in turnout within counties over
time do indeed contain a great deal ofvariation that is orthogonal to the distribution ofstate
resources.3t Our instrument (lit" x %bt) explains only one percent of the variation in turnout
30 We can compare our elasticity to Strömberg (2004) and Fleck (1999) who estimate elasticitles of New Deal Funds
received with respect to turnout of 0.57 and 0.66 respectively. These authors' variation in turnout is driven by cross-county differences in the decision to exercise the franchfse, rather than by county-by-time variation inenfrânchlsement. (lvhether one exercises that power or not, the initlal receipt of the franchise grants citizens a
measure of power over the politician). Given the different time period, geographic focus, and source of variation in
turnout, it is not surprising that our estimates dlffer from previous studies.3r An alternative interpretation is that OLS is biased downward becâuse turnout is hlgher when state resource receiptis lower.
2l

growth. But this variation, stemming from eligibility, is precisely the variation that should impact
resource distribution.
B. Se sitivity to Basic Controls and Specifcation Checks
The remainder of Table 3 examines the sensitivity ofthe results ofTable 2 to variations
on the specifícation. We begin by adding some basic controls. As described above, state
education agencies had limited discretion to deviate from the formula amounts allocated to
counties by the federal government under Title I of the ESEA, which are included in our state
transfer measure and are positively correlated with black enrollment share.32 More specifically,
the formula amounts were the product of two factors: (1) the county's eligibility rate, determined
principally on the basis of the share of its school-aged children living in poverty as ofthe
previous Census (a strong correlate of %bl")', and (2) one half of average spending on education
in the state per pupil (net of federal transfers) two years before (the "state factor"), which was
slightly higher in the comparison region.33 The formula amounts are thus negatively correlated
with the explanatory variable ofinterest, lit,x oÁbL". Failure to account for this will therefore
make it appear that state politicians were /ess responsive to changes in the distribution of the
electorate following the removal of literacy tests than they actually were.
To remove this bias, in the second column ofTable 3 we add to our baseline specification
the 1960 child poverty rate used in the Title I formula, individually and interacted with /r¡".34 The
32 The role of the state education agency was mainly to approve applications for Title I funds submitted by school
districts. Approval was mostly a rubber stamp, as the vast majority of school dishicts receivÌng any money received
their full allocatlon. A number ofschool districts did not receive the Title I funds at all because they failed tocomply with the nondiscrimination provisions of Title VI of the 1964 Civil Rights Act, See Cascio, at al, (2010).33 In the third year of the program (fìscal year 1968), the state factors for states spending below the national averâge
were leveled up to that average, but vâriation in state factors remained for higher-spending states (see U.S
Department of Health, Education, and Welfare 1969; Cascio, et al. 2010, Cascio, Gordon, and Reber 201l). In fiscalyear 1977, Florida and Virginia had state factors above the mlnimum.3a Our estimates are substanlively similar when we use the 1970 poverty rate, which would have been used inallocating grants in fiscal years 1977 and 1982, in lieu of the 1960 poverty rate. We choose not to use the 1970
property rate in our main specification since it would have been determined after implementation of the VRA.
22
new controls enter with the expected signs. As shown in Table 41, the relationship between
1960 child poverty and per-capita state transfers is positive: the federal government's allocation
formula for Title I was an increasing function of child poverty.3s The interaction with /i¡, is
negative, reflecting the fact that another component ofthe allocation formula was based on
matching state efforts, and states with literacy tests on average spent less on education.
Consistent with expectations, the 2SLS estimates increase in magnitude, reflecting an increase in
the magnitude of the reduced-form estimate for state transfers. In the third column ofthe table
we allow child poverty to enter more flexibly, interacting it with state dummies rather than with
/l¡". The increased flexibility leaves our estimates more precise, but does not affect their
magnitudes. In the remainder of the paper, we treat the simpler specification (column 2) as our
base model.
The remainder ofTable 3 is devoted to specification checks. The differences in mean
characteristics of treatment and comparison counties (Table 1) may raise the concern that
counties in states without literacy tests are not valid comparisons for counties in states with such
tests. Our pre{rend analyses in Figures 1 and 2 support the validity ofour comparison group. We
provide further support for our identification assumption in the remaining columns ofTable 3 in
which we investigate the possibility of bias due to a lack of common support using three
different approaches. First, in column 4, we restrict the sample to counties with a 1960 black
share at least as great as the 10th percentile of the distribution for comparison counties (2.2
percent) and no more than the 90th percentile ofthe distribution for treatment counties (49.9
percent). This restriction eliminates about a quarter ofour sample but narrows the difference in
35 While Table Al provides the coeffìcients on controls for the state transfer specifications, Table A2 provides thecoeffìcients on controls for presidential turnout specifications,
23

average black population share across the two groups.36 Second, in column 5, we trim the sample
following a more standard propensity matching approach. We estimate the propensity score
using a logit regression ofan indicator for a literacy test prior to the VRA on 1960 black share,
1960 child poverty, and the interaction ofthe two variables.3T We then restrict the sample to
counties with propensity scores above the minimum in the literacy test counties and below the
maximum in the non-literacy test counties. Using this method we retain more than 95 percent of
oui sample. Third, in the final column ofthe table we use the propensity scores both to trim our
sample as in the previous column and to weight our regressions.3s Reweighting eliminates
significant differences in all but three3s of 13 county characteristics summarized in Table 1.
Results are robust to the three approaches. Based on the evidence ofTable 3 coupled with the
trends presented in Figures 1 and 2, it therefore does not appear that a lack ofcommon support is
biasing our estimates.
C. AlternativeMechanisms
We have found robust evidence that the removal of literacy tests increased the growth in
per-capita state transfers to localities with higher black population shares. Recall that our
empirical strategy was designed to account for other reasons, besides black enfranchisement, that
southern state governments may have redistributed aid toward black communities over our
analysis period. Thus we postulate that the mechanism by which these tests impacted funding
was voting eligibility. However, we recognize that other changes in state funding oflocal
governments with higher black shares may have occurred during this time period I changes
30In the restricted sample, the meân 1960 blâck population share is 26.2 percent in the treatment and 16,1 percent inthe comDarison states.
" We w'eight the logit by 1960 population.38 More specifically we assign treatment counties weights of I *(1960 population), ând we assign comparisonc^ounties weights of the odds ratio of the propensity score multiplied by 1960 population.
" They are presence of another black organization and changes in percent 5-17 and percent unemployed.

beyond the introduction of Title I. We now explore a number of alternative explanations for our
findings related first to our particular setting and second to the distribution of state transfers more
generally.
C.1. Setting-Specific Predictors ofState Transfers
Rather than reflecting an effort to court newly-enfranchised black voters, politicians in
treatment states may have been motivated to direct more state aid to counties with higher black
population shares to "hold harmless" whites in the wake of school desegregation (Reber 2011),
which occurred over roughly the same time period (Cascio et al. 2008). When black and white
schools were separate and blacks were disenfranchised, white school boards tended to
expropriate money allocated by the state for black pupils for white schools. Where there were
more black students relative to whites, there was greater scope for white pupils to profit. As a
result, racial gaps in school resources prior to school desegregation - and the funding necessary
to "level up" spending on black students afterward (Reber 2011) - tended to be larger the higher
a district's black enrollment share (Bond 1934; Margo 1990). If a desire to equalize spending on
black and white students without decreasing spending on whites motivated redistribution toward
counties with higher black population shares, this motivation may have been stronger in states
with literacy tests, which on average had larger black-white gaps in school quality prior to 1965
(Card and Krueger 1992).
That said, there were states with literacy tests removed as a result the VRA that had
largely eliminated racial gaps in school quality by the mid-1960s. If our findings hold for this
subset of states, it would help to rule out this alternative explanation for our findings. Columns 2
and 3 ofTable 4 define this subset ofstates in two different ways. (Column 1 repeats our
preferred specification for comparison.) In column 2, we limit the sample to the five southern
25

states - two with literacy tests (Alabama and Georgia) and three without (Florida, Tennessee,
and Texas) - reported by Card and Krueger (1992) to have eliminated black-white gaps in pupil
teacher ratios, teacher salaries, and term lengths by 1966, at which point black and white schools
were still largely separate (Cascio et al, 2008). In column 3, we drop the four treatment states
that consistently exhibit the largest black-whíte gaps in pupil-teacher ratios over the early 1960s
- Mississippi, Arkansas, South Carolina, and Louisiana.a0 The reduced-form estimates for
turnout are higher for these subsets of states. The reduced-form estimates for state transfers are
as well, and the 2SLS estimates are in fact larger than at baseline.
These findings suggest that efforts to appease white families in the face ofschool
desegregation do not explain our findings. But school desegregation may be affecting our
estimates through another channel: southern districts with higher black enrollment shares were
more likely to desegregate under court order (Cascio et al. 2008), and school distrícts that
desegregated under court order appear to have received more state education aid (Johnson 201 1).
While we have no reason to believe that either ofthese relationships was stronger in treatment
states, we examine the possibility in column 4 ofTable 4, where we control for both the percent
of the county's school enrollment in districts under court order to desegregate and the percent of
the county's enrollment in districts receiving federal funds under the ESAA, both measured as of
fall 1976.41The controls enter with positive coefficients in the state transfer specification, though
a0 Each of these four states reportedly had equal term lengths for black and whlte schools in the early 1960s.
Mississippi and Louisiana exhibit teacher salary differences, but Arkansas and South Carolina do not. Louisiana is
the state examined by Reber (201l). Column 3 results are robust to dropping only Arkansas and Mississippi, statesin which the pupil-teâcher râtio is higher than predicted by a linear model relating pupil-teâcher to state black sharear This is the school yeâr closest to the end of our sample period in which the Office for Civil Rights in theDepartment of Health, Education, and Welfare obtained this information for all school districts in the country.
26

only the coefficient on the ESAA variable is statistically significant (Table A1).42 Adding these
controls does not substantively alter our findings,
It is also possible that our estimates are confounded by black political activism, if
activists had been more likely to target counties with higher black shares in literacy test states.
We investigate this possibility in column 5. As proxies for black activism, we control for
indicators for whether the county had an NAACP, whether the county had some other black
organization, and whether the county had a black college, all measured in 1960. Our basic result
is robust to the inclusion of these controls. The presence ofthe NAACP, another black
organization, and a black college are all positive and significant predictors of the change in state
transfers (Table Al). in other words, predominantly black counties with greater black activism
saw a larger increase in their share of state resources relative to predominantly black counties
with lesser activism. However, controlling for such social movements does not substantively
change the reduced-form coefficient of interest in either the state transfer or the presidential
turnout specification.
There are three other potential contemporaneous explanations for our findings, all
political in nature. First, the 1962 Supreme Court decision in Baker v . Carr required equalization
of legislative district populations, both at the state and federal level. Using the same COG data
that we use here but for the entire country, Ansolabehere, Gerber, and Snyder (2002) show that
counties underrepresented in state legislatures as of 1960 saw relatively large increases in state
transfers between 1957162 and 1977/82, as the representation gap was corrected. We reproduce
this fìnding (Table A1) when we control for the same measure of initial county representation as
Ansolabehere, Gerber, and Snyder (2002) - the "relative representation index" (RRI), defined as
az The coefficient on the court order variable is positive and statistically significant only when we do not also controlfor the ESAA variable.
F
l
z7

the number of legislative seats per person in the county, divided by that same figure for the state
as of 1960 (David and Eisenberg 19ô1). However, adding this control for the redistributive
effects of mandatory redistricting leaves our estimates little changed, as shown in column 6 of
Table 4.
Second, as explained in Section III, poll taxes were eliminated in three treatment states
and two comparison states almost contemporaneously with literacy tests. We focus on the
removal of literacy tests under the VRA because previous literature has not found that poll taxes
had a disproportionate effect on black voting.a3 In the seventh column ofTable 4, we account for
possible omitted variables bias stemming from failure to account for elimination of the poll tax
by adding to the regression the interaction between an indicator for having a poll tax in the pre-
period and 1960 black population share. Our results are substantively unchanged.
Finally, not only were there events concurrent with the VRA that may have impacted
state funding to localities, but the VRA itself consisted of more thanjust a mandate to cease the
use of literacy tests, As described earlier, localities subject to Section V ofthe VRA must request
permission from the United States Department ofJustice to change any of their voting rules.aa
All of the heatment states are subject to Section V,as so another alternative mechanism for the
increase in funding is increased fairness of electoral rules, rather than enfranchisement. We test
for this possibility by noting that two comparison states, Florida and Texas, are also subject to
{3 Filer, Kenny and Morton (1991) find no significant association between poll tax*nonwhite and county turnout, Alt(1994) shows that poll tax*black is associated with a significant decrease in the ratio ofcounty white to black voterregistration,aa For example, states under Section V must receive clearance on their redistricting plans before they can use themfor state or federal legislative elections, States or localities would also have to receive permission to change the dates
o_f election, the location o[ polllng places or the term of an electoral office." Only halfofthe counties ¡n North Carolina are subject to Section V but ifany part ofajurlsdiction is subject, the
wholejurisdiction is subject, Thus, North Carolina must seek preclearance for state, as well as federal, Iegislativeredistricting.
28

Section V.46 Thus, to account for the impact of pre-clearance, we simply drop Arkansas and
Tennessee from our sample, relying on only Florida and Texas as the comparison states and
thereby limiting the sample to counties in states subject to Section V. As shown in the final
column ofTable 4, the reduced-form coeffícient of interest in both the turnout and state transfer
specifications nearly doubles in this restricted sample. Our 2SLS estimate ofthe impact of
enfranchisement-induced turnout is however unchanged. We cannot reject an elasticity ofone.aT
C.2. General Predictors of State Transfers
The literature on the distribution ofpublic goods acknowledges a role for political
considerations in the distribution decision. But this literature has also identified a number of
determinants oflocal public goods receipt aside from politics. For example, counties with higher
population growth may see less growth in per-capita funding ifbudgeting lags population
growth. Ansolabehere, Gerber, and Snyder (2002) fínd such a phenomenon in examining the
same data used here, but for the entire country. We allow for this possibility by controlling for
the population growth rate during the 1950s in column 2 ofTable 5. (As in Table 4, the first
column repeats our preferred specification from Table 3 column 2 for ease of comparison,) The
coefficient on population growth in the model for state transfers is negative (Table A1),
a6 These states became subject to the section in 19?5 when Congress added failure to provide electoral materials in a
language spoken by more than five percent of the population to the list of criterion for inclusion.a/ Another voting rule change that for some states was caused by (but not concurrent with) the passage of the VotingRights Act was the move from multi- to single-member districts in state legislative elections. Six of our I I samplestates, either because of preclearance or a court challenge, were forced to move from multi-member to single-member distrlcts in the 1970s. Arkansas was forced to move from at-large to small multl member districts. Georgiawas forced to move to mostly single member districts, with a few small multi-member districts, The remaining threestates-Florida, North Carolina and Virginia-were forced to move to single member districts in the early 1980s.
Snyder and Ueda (2011) find using the same COG data we employ that counties represented by at-large delegationsreceive smaller transfers per capita from their state governments. Butjust as blacks were not systematically locatedin underrepresented districts according to the RRI measure, blâcks were not systematically located in multi-member'districts. And in fact, controlling for \,vhether a state moved from multi to single member districts during our sampleperiod interacted with initial percent black in our state transfer regressions only serves to increase the magnitude ofour results.
29

consistent with expectations.4s However, controlling for population growth does not substantially
change our findings.
The bureaucratic model of decision-making hypothesizes that public goods are
distributed to the neediest communities based on bureaucratic formulas, not politics. Consistent
with this theory, the literature finds that population age and poverty status are correlates of public
good receipt.as While we do not want to control for county demographics in our basic
specification because of a concern that these characteristics may be endogenous to increases in
state aid, we test the possibility that bureaucratic rules explain our findings by controlling for
changes in the shares ofthe county population that is school-aged (5 to 17), elderly (65 and
over), in poverty, or unemployed between 1960 and 1980. These variables enter the state transfer
regressions with the expected signs (Table A1): increases in school aged children,
unemployment and poverty, all markers of greater need, are significantly associated with growth
in state transfers.5o Because treated counties with larger 1960 black shares experienced
significantly larger increases in the school-aged and low-income shares over the 20 year period,
it is not surprising that the reduced-form coefficients in both our turnout and state transfer
specifications fall in magnitude with the addition ofthese controls. Nonetheless, even controlling
for need, our 2SLS estimates, shown in column 3 ofTable 5, remain close in magnitude to and
statisticâlly indistinguishable from one.
A final model of public goods distribution posits that resources are distributed in
proportion to tax contributions (Boyle and Jacobs 1982). In this framework, treatment counties
" "aar"ra "" -"..r" ,r"*.ñ*ial mobility subsequent to 1965 could be endogenous to the Voting Rights Act,
we measure population growth across the 1950s. However, we note that the results ofTable 5 column 2 are robust tomeasuring population growth from 1960 to 1980, contemporaneously with our study period, Population growth is
negative and significant in the state transfer model. The coefficient on presidential vote turnout in the 2SLS model is0.866 with a standard error of 0.478, significant at the 7 percent level.as See for example Boyle and Jacobs (1982), Cingranelli (1981), Koehler and Wrightson (1987), Lee (1994),
Miranda and Tunyavong (1994), and Mladenka and Hill (1978).5u The coefficient on share elderly is negative, but insigni[icant.
30

with higher black population shares would have seen relatively large increases in state transfers
if they saw relatively large increases in their tax burdens. To examine this possibility, we
estimate models like equation (2) that substitute (the natural log of) per-capita local tax revenue
as the dependent variable. This variable includes all taxes paid to localities within the county, the
largest share of which are property taxes. Whether we consider total taxes paid or property taxes
alone, the gradient of tax revenues in black population sharc deueases significantly more in
treatment states than in comparison states following the removal of literacy tests (final columns
ofTable 5). In other words, the same counties that saw larger percent increases in transfers from
the state saw less growth (or greater percent reductions) in their tax bills.st Thus, an increased tax
burden does not seem to be a likely explanation for our findings.
VII. ENFRANCHISEMENTORBLACKREPRESENTATIVES?
We have produced robust evidence ofshifts in state transfers toward more heavily black
counties in states where literacy tests were outlawed by the VRA, following the Act's passage.
We have provided evidence against several alternative explanations for these funding patterns
drawn from the public goods literature generally and from contemporaneous historical events
more specifically. We have further shown that these shifts in state funding align with increases ín
enfranchisement-driven turnout over the same period. But are we finding that black voting
eligibility altered the incentives for politician behavior? Or that black voters elected black
officials who were more likely to share ideology with black constituents?
Following the VRA, there was an immediate, stark increase in black voter registration
and turnout. And while the number ofblack elected officials was on an upward trajectory
throughout our sample period, sizable increases in their ranks were slower in coming. In fact,
5r Of course, thls could reflect changes in tax rates, notjust changes in the tax base. Local politicians mây have
crowded out the inflows of state aid by reducing local tax rates, We discuss this possibility in the conclusion.
31

gains in black office holding have been more often attributed to redistricting rule changes that
lagged the passage ofthe VRA by as much as 25 years than to increases in black voter turnout
(Handley and Grofman 1994).52 Consistent with this, there were no black governors in the South
over our sample period and a very limited presence of black state legislators.s3 This alone
suggests that the election of black representatives cannot explain our results.
We provide further evidence in Table 6 that the election of black state legislators is not
the mechanism for the change in the distribution of state transfers. Here, we run state-level long
difference models where the outcome is the change in the share of black elected officials in the
upper (lower) legislative house normalized by the state's black population share. The
independent variable is an indicator for having a literacy test. These specifications thus ask how
the rate of black elected officials per black population evolved differently in southern states with
and without a history of literacy tests. If black elected officials are the cause of the shift in state
transfers to more heavily black counties in treatment states, then we would expect to see a
positive coefficient on our literacy test indicator. But in fact the coefficient in the upper house
specification is essentially zero, and in the lower house specification, the coefficient is negative.
While the coefficients are unsurprisingly noisy, there is little evidence to support the idea that the
gains to black counties came via black elected offícials.
VN, DISCUSSION AND CONCLUSION
The VRA removed literacy tests as a barrier to black citizens' political participation in
seven of 11 southern states. As a result, black voter registration and turnout increased markedly.
52 Handley and Grofman (1994) argue that the move to single member districts during the 1970s and 1980sincreased the number of minorities in state legislatures, However, the authors contend, that 1982 renewal of theVoting Rights Act, which required states to draw districts so âs to not fragment black voters, had a much largerimpact on black descriptive representation,5r The ratio of the share of black elected officials ln the upper house at the end ofour sample period (average of1977 and 1982) to the state's 1980 black population share is on average 0.13 Ín treated states and 0.11 in comparisonstates, For the lower house, these fígures are 0.28 and 0.48, respectively. (Ihese fìgures are weighted by 1960 state
populatÍon for consistency with the regression estimates,)
a2

Because of residential segregation, changes in the share of county residents who were newly
enfranchised varied within state across localities, spatial variation that we exploit to examine the
impact of enfranchisement on the distribution of state resources. We test for posI-VRA shifts in
the relative distribution ofstate transfers toward localities with larger black populations in
literacy test versus non literacy test southern states. We demonstrate that not only did turnout in
higher black share localities increase disproportionately in treatment states following the Act's
passage, but that state transfers to these localities increased as well. In other words, the same
black communities that saw an increase in enfranchisement-driven turnout saw an increase in
their share ofthe state resource pie. We rule out competing explanations - drawn both from the
public resource distribution literature and from contemporaneous historical events - for the
change in state transfers. We posit that the causal link runs from enfranchisement to resource
receipt, a conclusion that is consistent with theoretical models of distributive politics in which
politicians target resources to identifiable, targetable, and politically persuadable interest groups
to earn their political support. That enfranchisement was accompanied by increased resource
receipt suggests that that the Voting Rights Act provided substantive, rather than merely
symbolic, political gains to southern blacks.
However, as is recognized widely in the political economy literature, political gains do
not equate to welfare gains, In the case of the results presented above there are two key reasons
that these increases in spending may not have increased black welfare: 1) crowd out and 2)
inefficient spending. State aid targeted toward investments with high marginal returns for blacks,
like education, may have been crowded out by local tax reductions. And in fact we see some
evidence of crowd out in Table 5, which shows that the same areas that saw increased transfers
saw decreases in their tax bill. Of course decreases in average taxes paid per capita could be
'J

composed of decreases in the tax base and/or changes in the tax rate. To the extent that each
individual's tax burden decreased, given blacks' lower wealth, these decreases, though smaller
for blacks than whites, may have resulted in greater welfare gains for black taxpayers, assuming
no change in services received or state tax burdens.
The welfare impact ofthe remaining state transfers, not set off by tax decreases, is also
impossible to quantify given the preceding evidence, Using COG data on education expenditures
at the county level, we estimate an elasticity of per-capita county education expenditures with
respect to presidential tumout rates of0.58 in our preferred specification (from Table 3, column
2). Combined with the corresponding estimate ofthe elasticity of per-capita state transfers with
respect to presidential turnout, this estimate implies a 48 cent increase in education spending for
every dollar increase in state transfers.5a'55 However, we lack the power to reject either complete
crowd out or a dollar for state dollar transferred increase in spending at conventional levels of
significance.56 Our results for transportation and health expenditures are also noisy.57 But even if
we could precisely estimate that all transferred dollars were spent on úlack citizens we could still
not conclude that these transfers increased black citizens' welfare, as government funds may be
5{ The implied elasticity of education spending with respect to state transfers is the ratio oftheir turnout elasticlties(0.469=0.58/1.125 in our preferred specification). We convert this elasticity into a dollar-for-dollar figure usingtreatment group means of the education spending ând state transfers variables, We cannot account fot every cent ofeach additional dollar ofstate transfers through increased education spending and reduced taxes alone, though we
can account for most. Our estlmates imply a 34 cent reduction in real per-câpfta total tax revenues for each dollarincrease in real per-capita state transfers, which coupled with the 48 cent increase in education spending accounts
for 82 cents of each transfer dollar. We cannot do a complete accounting of each transfer dollar because we do nothave data for all counties (and in some cases for any county) for the remaining spending categories,55 Note that the resulting 48 cent figure is a lower bound on the increase in education spending for each additionaldollar of educqtion aid from the state, If we insteâd assume that 73 percent of the average increase in state transfers
was targeted for education, as is true on average in the South, the elasticity estimate implies a 66 cent increase ineducation spending for every additional dollar of state education aid received. As a point of comparison, Cascio,
Gordon, and Reber (201 1) find that a dollar increase in Title I funding in the South over the second half of the 1960s
wâs associated with about a 50 cent increase ln school spending.56 The (robust) standârd error on the estimated elasticity of education spending with respect to presidentiâl turnout is
0.341, yieldinq a t-statistic of 1.71.5? Because we-lack data on transportation and health expenditures for some localities we deemphasize these results.
34

spent ineffectively.5s We therefore conclude by noting our principle finding - that black
enfranchisement following the Voting Rights Act led to political gains to black communities in
terms ofthe share ofstate resources received - and by recognizing that quantifying how these
state transfers impacted black economic welfare is an important topic for future research.se
sE Cascio, Gordon and Reber (2011), for example, show that increases in school budgets resulting from Title Idecreased high school dropout rates for whites, but not for blacks.5s We are not the first to assert the importance of this question. Noting the surge in voter registration following theVRA, Wright (1999) urged economiihistorians to examine the connection benreen enfranðhisement and economicadvancement.
35

APPENDIX
A. State Transfers Data
Our analysis uses data on transfers from state governments to localjurisdictions. These data weredrawn from the Census of Governments (COG) Historical Data Base on County Area FinancesSince 1957, which we downloaded from ftp://f'tp2.census. r¡ov/pub/outgoing/govs/special60/.The variable that we use is Total State lG (intergovernmsntal) Revenue, which is reported everyfive years starting in 1957 and continuing through 1982. ln a robustness check (Table 5), wealso use the variables Total Taxes and Property Tax. Real per-capita figures were created bydividing by these figures by population from the same year as reported by the same source, thenconverting to real 2009 dollars using the CPI-U.
B. Votet Turnout Data
The majority ofthe presidential and gubernatorial turnout data were provided by MatthewGentzkow and James Snyder. The remaining observations were hand-entered or scanned usingvarious volumes of America l/ores (Washington, DC: Elections Research Center, Congressional
Quarterly). We converted these figures to county voter turnout rates by dividing them by the
voting age population in the county (ages 2l+ in 1970 and prior and ages l8+ in 1971 and later).We obtained the county-level voting age populations for 1950 and 1960 from National HistoricalGeographic Information System (NHGIS) (Minnesota Population Center 2004) and for 1970 and
1980 from special tabulations ofcounty population by race, gender, and age that we obtaineddirectly from the Census Bureau. We linearly interpolated voting age population in theintercensal years.
C. Data on 1960 County Characteristics
1. 1960 Black Population Share: Percent black in the 1960 county population is from the1960 City and County Data Book Consolidated File, County Data 1947-1977 (U.5.Department of Commerce 1978).
2. 1960 Child Poverty Ral¿. The numerator ofthe 1960 child poverty rate is the 1960
Census report of the number of 5 to 17 year olds in the county living in families withincomes less than $2000 in 1959, which were hand-entered from U.S. Senate (1965).This was the primary determinant of a county's Title I eligibility in the 1960s.r Thedenominator is the number of 5 to l7 year olds in the county as of I 960, which wedownloaded from the National Historical Geographic Information System (MinnesotaPopulation Center 2004).
3. 1960 Relative Representation Index (RN); The 1960 RRI was hand-entered from a tablein David and Eisenberg (1961) titled, "lndex Values of the Right to Vote for Members of
IThere was an additional category of Title t eligibility in 1965: children in families receiving AFDC in excess of$2000 in 1962. Other categories ofeligibility were introduced over time (e.g., foster children, neglected children,and delinquent children), but the main determinant of Title I eligibility over our sample period remained the census-based child poverty count.
36

the Legislature, by Counties, 1910, 1930, 1950, and 1960, as Percentage ofthe State-Wide Average." In our analysis, we divided the number reported by 100.
D. Data on Changes in County Characteristics
l. Population Growth Rate, 1950-1960: We constructed the 1950s county populationgrowth rate using county population figures reported by NHGIS (Minnesota PopulationCenter 2004).
2. Change in the Percents oÍthe Population School-Aged and Elderly, 1960-1980: The1960 population percentages of school age (ages 5-17) and elderly (ages 65 and over)were constructed using data on population by age from NHGIS (Minnesota PopulationCenter 2004). Values for 1980 were constructed using data on population by age fromthe 1980 City and County Data Book, downloaded from the University of Virginia library(trtto:¡¡wwwZ.I¡U.vl ).
3. Change in the Percent of Families below the Poverty Line, 1960-1980: For 1960, thepoverty rate is the percentage of families in the county reporting incomes less than $3000in 1959, drawn from the 1960 City and County Data Book. For 1980, we construct thepoveÉy rate using data on the number of families below the poverty line and the numberof families from the 1980 City and County Data Book, downloaded from the Universityof Virginia library.
4. Change in the Unemployment Rate, 1960-1980: We use the 1960 unemployment ratereported in the 1960 City and County Data Book. The unemployment rate for 1980 wasconstructed using the BLS report ofthe number unemployed and the number in thecivilian labor force from the 1980 City and County Data Book, downloaded from theUniversity of Virginia library.
E. Proxies for Black Political Activism
We constructed our proxies for black political activism - indicators for the presence ofanNAACP chapter, another black race organization, and a black college in the county - from dataused in Matthews and Prothro (1963): http://www.rochester.edr¡/Coller¡e/psc/signori¡ro/courses/.This data set provides neither FIPS county codes nor county names, but rather numbers countiesconsecutively within state. To ascertain the identity ofeach observation, we obtained a countylist from the 1950 Census and numbered counties consecutively exactly as they fell with a sorton county FIPS code, All counties merged, and the 1950 black population shares reported in theMatthews and Prothro data matched those that we drew from county population figures reportedby NHGIS (Minnesota Population Center 2004) in nearly all instances.
F. Dsta on School Desegregation
We constructed the fraction of county enrollment in school districts under court order todesegregate or receiving Emergency School Aid Act (ESAA) funds using school district Ieveldata from the Fall 1976 Elementary and Secondary School Civil Rights Survey (Offrce for Civil
37

Rights 1978). We used a version ofthe data housed at UCLA and converted from binary to asciiformat by Ben Denckla and Sarah Reber. A district was classified as being under court order if itanswered yes (:1) to the question "School System under Court Order to Desegregate," and as
receiving ESAA funds if it answered'¡yes" (=I) to the question "Is this an ESAA district?"County level figures are the weighted averages ofthese dummy variables, where the weights arethe sum of total male and female pupils in membership in the district. While the survey includesall school systems in the South, we lose several observations where we were unable to match oncounty names; county FIPS codes were not reported.
G. Data on Black State Legislators
The data on black state legislators; used in Table 6, were drawn from several sources. For thepre-VRA observation, we construct counts of black state senators and representatives elected in1964 or prior from Appendix VI ("Negroes Holding Public Office in the South (as of February l,1968)") in US Commission on Civil Rights (1968). For the post-VI{A observation, we averagecounts ofblack state senators and representatives as of 1977 and 1982 from fhe National Rosterof Black Elected Offcials (Joint Center for Political Studies 1977, 1982).
38

REFERENCES
Alt, James E. 1994. "The impact ofthe voting rights act on black and white voter registration inthe South." In Chandler Davidson and Bernard Grofman (eds.) Quiet Revolution in theSouth: The Impact ofThe Voting Rights Act 1965 * 1990. (pp.35l -377). Princeton, NJ:Princeton University Press.
Ansolabehere, Stephen, Alan Gerber, and Jim Snyder.2002. "Equal Votes, Equal Money: CourtOrdered Redistricting and Public Expenditures in the American StaIes." AmericanPolitical Science Review,96 (4):767 - 777.
Ashenfelter, Orley, William J. Collins, and Albert Yoon. 2006. "Evaluating the Role of BrownV. Board ofEducation in School Equalization, Desegregation, the Income of AfricanAmericans." American Law and Economics Review, S(2):213-248.
Besley, Timothy and Anne Case. 2003. "Political Institutions and Policy Choices: Evidence fromthe United Stafes." Journal of Economic Literature, 41(l): 7- 73.
Besley, Timothy, Torsten Persson and Daniel Sturm.20l0. "Political Competition, Policy andGrowth: Theory and Evidence from the United States." Review of Economic Studies,78,t-34.
Bond, Horace Mann. 1934. The Education ofthe Negro in the American Social Order. NewYork: Prentice Hall.
Boyle, John, and David Jacobs. 1982. "The Intracity Distribution of Services: A MultivariateAnalysis." American Political Science Review,76 (June): 371-9.
Button, James. 1989. Blacks and Social Change. Princeton, NJ: Princeton University Press.
Cascio, Elizabeth, Nora Gordon, Ethan Lewis, and Sarah Reber. 2008. "From Brown to Busin- "Journal of Urban Economics,64(2):296 - 325.
Cascio, Elizabeth, Nora Gordon, Ethan Lewis, and Sarah Reber. 2010. "Paying For Progress:Conditional Grants and the Desegregation of Southern Public Schools." QuarterlyJournal of Econonics, 125(l): 445 - 482.
Cascio, Elizabeth U., Nora E. Gordon, and Sarah J, Reber. 201 1 . "Federal Aid and Equality ofEducational Opportunity: Evidence from the Introduction of Title I in the South." NBERWorking Paper 17155. Cambridge, MA: National Bureau of Economic Research.
Cingranelli. David L. 1981. "Race, Politics and Elites: Testing Alternative Models of MunicipalServiceDistribution;'AmericanJournalofPoliticalScience,25(4):664-692.
Cox, Gary W. and Matthew D. McCubbins. 1986. "Electoral Politics as a Redistributive Game."The Journal of Politics, 48(2):370-389.
39

David, Paul T. and Ralph Eisenberg. 1961. Devaluation of the Urban and Suburban Vote.Charlottesville: University of Virginia Press.
Dixit, Avinash and John Londregan. 1996. "The Determinants of Success ofSpecial Interests inRedistributive Polilics;' The Journal of Politics,5 8(4): 1132-1155.
Dixit, Avinash and John Londregan. 1998. "Fiscal Federalism and Redistributive Politics."Journal of Public Economics,6S(2): 153-180.
Donohue, John J. III, James J. Heckman, and Petra E. Todd. 2002. "The Schooling ofSouthernBlacks: The Roles ofLegal Activism and Private Philanthropy, l9l0 - 1960." QuarterlyJournal of Economics, I 17 (l): 225 -268.
Filer, John E., Lawrence W. Kenny, and Rebecca B. Morton. 1991. "Voting Laws, EducationalPolicies, and Minority Turnout." Journal of Law and Economics,34(2): 371-393.
Fleck, Robert K. 1999. "The Value ofthe Vote: A Model and Test ofthe Effects ofTurnout onDistributive Policy." Economic Inquiry,3T (4): 609-623.
Grofman, Bernard and Lisa Handley. 1998. "Voting Rights in the 1990s: An Overview" in Rac¿and Redistricting in the 1990s8d. Bernard Grofman. New York, NY: Agathon Press.
Handley, Lisa and Bernard Crofman. 1994. "The Impact of the Voting Rights Act on MinorityRepresentation: Black Officeholding in Southern State Legislatures and CongressionalDelegations." In Chandler Davidson and Bernard Grofman (eds.) Quiet Revolution in theSouth: The Impact ofThe Voting Rights Act 1965 - 1990. þp. 335 - 350). Princeton, NJPrinceton University Press.
Herbers, John. 1965. "Dr. King and 770 Others Seized in Alabama Protest;'The New YorkTimes, February 2.
Husted, Thomas A. and Lawrence W. Kenny. 1997. "The Effect ofthe Expansion ofthe VotingFranchise on the Size of Government." The Journal of Political Economy,l05(1): 54 -82.
Johnson, Rucker. 201l. "Long-run Impacts ofSchool Desegregation and School Quality onAdult Attainments." National Bureau of Economic Research Working Paper 16664.Cambridge, MA: NBER.
Joint Center for Political Studies. 1977, 1982. National Roster of Black Elected Offcials,Volumes 6 and 12. Washington, DC: Joint Center for Political Studies.
Kenny, Lawrence W. and John Lott. 1999. "Did Women's Suffrage Change the Size and Scopeof Government?" The Journal of Political Economy, 107(6): 1163-1198.

Keech, William R. 1968. The Impact of Negro Voting: The Role of the Vote in the QuestforEquality. Chicago: Rand McNally.
Key, V.O. 1949. Southern Politics in State and Nation.New York: Knopf.
Koehler, David H. and Margaret T. Wrightson. 1987. "lnequality in the Delivery of UrbanServices: A Reconsideration ofthe Chicago Parks." The Journal of Politics 49(l): 80-99
Lee, Seung Jong, 1994. "Policy Type, Bureaucracy, and Urban Policies: Integrating Models ofUrban Service Distribution." Policy Studies Journal,22 (Spring): 87-108.
Lewis, John. 20I l. "APoll Tax by Another Name;' The New York Times, August26.
Lindbeck, Assar and Jörgen W. Weibull. 1987. "Balanced-Budget Redistribution as theOutcome of Political Competition ;' Public Choice 52(3): 273-297 .
Margo, RobertA.1990. Race and Schooling in the South, 1880- 1950: An Economic History.Chicago: University of Chicago Press.
Martin, Paul. 2003. "Voting's Rewards: Voter Turnout, Attentive Publics and CongressionalAllocation of Federal Money;' American Journal of Political Science, 47 (1): 110-127.
Matthews, Donald R. and James W. Prothro. 1963. "Social and Economic Factors and NegroVoter Registration in the South." The American Political Science Review 57(l):24-44.
Miller, Grant. 2008. "Women's Suffrage, Political Responsiveness, and Child Survival inAmerican History." The Quarterly Journal of Economics 123(3): 1287-1327.
Minnesota Population Center. 2004. National Historical Geographic Information System: Pre-release Version 0.1. Minneapolis, MN: University of Minnesota. http://rvrvw.nh,¿is.orr¡/
Miranda, Rowan 4., and Ittipone Tunyavong. 1994. "Patterned Inequality?: Reexamining theRole of Distributive Politics in Urban Service Delivery." Urban Affairs Review,29(June): 509-34.
Mladenka, Kenneth R., and Kim Quaile Hill. 1978. "The Distribution of Urban Police Services."Journal of Politics, 40 (February): l12-33.
Naidu, Suresh.2010. "Suffrage, Schooling, and Sorting in the Post-Bellum U.S. South."Manuscript, Columbia University.
Office for Civil Rights. 1978. Fall 1976 Elementary and Secondary School Civil Rights Survey.Washington, DC: United States Department of Health, Education and Welfare
[producer]. Los Angeles, CA: Sarah Reber [distributor, computer file], 2006.

Reber, Sarah J. 201 l. "From Separate and Unequal to Integrated and Equal? SchoolDesegregation and School Finance in Louisiana." Review of Economics and Statistics,93(2):416 - 43s.
Snyder, James and Michiko Ueda (201l), "Do Muftimember Districts Lead to Free Riding?"Le gi s lat iv e S tud i e s Quar te r ly, 32(4), 649 - 67 L
Strömberg, David. 2004. "Radio's lmpact on Public Spending." The Quarterly Journal ofEconomics, I l9(l): I 89 -221.
Trebbi, Francesco, Philippe Aghion, and Alberto Alesina. 2008. "Electoral rules and MinorityRepresentation in US Cities." Quarterly Journal of Economics 123(1): 325 - 358.
U.S. Commission on Civil Rights.l968. Political Participation: A Study of the Participation ofNegroes in the Electoral and Political Processes in I0 Southern States Since Passage ofthe Voting Rights Act oÍ 1965. Washington DC: US Government Printing Office.
U.S. Department of Commerce, Bureau ofthe Census, 1957, 1962,1977 and 1982. State
Payments to Local Governmerts. Washington DC: US Government Printing Office.http ://www.census. gov/govs/pubs/year. htm I
U.S. Depariment of Commerce, Bureau of the Census. 1978. County and City Data Book
[United StatesJ Consolidated File: County Data, ]947-1977 [Computer file]. ICPSRversion. Washington, DC: U.S. Department of Commerce, Bureau of the Census
[producer], 1978. Ann Arbor, MI: Inter-university Consortium for Political and SocialResearch [distributor], I 999.
U.S. Department of Health, Education, and Welfare, Office of Education. 1969. History of Title Ið,SEl. Washington DC: US Government Printing Office.
U.S. Senate. Committee on Labor and Public Welfare. Subcommittee on Education. i965.Maximum Bssic Grants-Elementary and Secondary Education Act of 1965 (Public Law81-874, Title II and Public Law 89-10, Title I). Washington, DC: U.S. GovernmentPrinting Office.
Washington, Ebonya. 201L "Do Majority Black Districts Limit Blacks' Representation? TheCase of the t990 Redistricting," Journal of Law and Economics, forthcoming.
Wright, Gavin. 1999. "The Civil Rights Revolution as Economic Hisrory." Journal of EconomicHistory, 59(2), 267 -289.
Wright, Gavin. 2011. Economics of the Civil Rights Evolution. Book Manuscript.

Figureln
1. Trends in the Gradients of Voter Turnout Rates and Per-Capita State Transfers1960 County Percent Black, by Presence ofa Literacy Test prior to the VRA
A. ln(Pr€sidentialElcction TumoutRale) B.ln(GubemalorialEleclion Tumout Rale)
+
.ó8.'
1952 t95ó t%0 t964 t 968 t 9't2 t9761980election y€ar
1953 t957 t96t 1965 1969 1973 1911
first election on or after195'Ì 1962 1967 t972 t977 t982
fìscal year
Solid Circles: With Literacy Test. Hollow Circles: Without Literaay TestNote: Esch gmph shorvs coefficients on county %blâck in 1960 by year, separåtely fo¡srates wirh literåcy resrs (AL,GA, L,A, MS, NC, SC, VA) and forslalesin the Soulh wilhoul Iit€mcy lesls (AR, FL, TN, TX), priorto lhe VRA. The unil ofobs€rvalion is å county. Regr€ssions also include s(åle flxed effecls and ¡reweighlêd by 1960 county populalìon. The dotled velical line is ål 1965, tlrc )€år lhal thc vRA wås passed.

Fisure 2. Test for Differential Trends in the Gradients of Voter Turnout Rates and" Per-Capita State Transfers in 1960 County Percent Black,by Presence of a Literacy Test prior to the VRA
A. ln(Presidential Eleclion Tumout Rare) B- ln(cubemarorial Election lumoul Ralo) c.In(P€r-Capilâ SlåleTransfers (S2009))
l.1952195ó196019641968197219?61980 1953 195? 196l 1965 t969 1973 197',7 t9S1 1962 196',1 1972 1977 1982
election year first election on or after fiscal year
tnleråctionsliih indicatoß for 1960, I95?-60. and 1962 are omirted in Pancls A. B; and C, respeclively, so thsl the rnodel is identified. The unit ofobs€NalioI rs rlÉ
the foincr Cònfederacy (AL. AR, FL, dA, LA, MS,'Nt, Sc, TN, Tx, vA) 'Specificarion is weighred by 1960 counly population. The dol(ed venical lin€ is al 1965,
thevearlhåt lhe VRA was Þassed.
qi TT
1.llÌll

Table 1. Descriptive Statistics
With Literacy Test
Mean SD
Without Literacy Test
Mean SD(1) (2\ (3) (4)
A. Funding and Election Turnout Outcomes
Per-Capita State Transfers ($2009), 1957/62
Per-Capita State Transfers ($2009), 1977/82
A ln(Per-Capita State Transfers)
Presidential Election Turnout Rate, 1960
Presidential Election Turnout Rate, 1980
A ln(Presidential Election Turnout Rate)
Gubernatodal Election Turnout Rate, 1957-60
Gubernatorial Election Turnout Rate, 1977-80
A ln(Gubernatorial Election Turnout Rate)
Percent Black, 1960
Child Poverty Rate, 1960
Percent of County Enrollment in Districtslunder court order to Desegregate, 1976
Receiving ESAA funds, 1976
=l if Has NAACP Chapter, 1960 (xl00)
=1 Has Other Black Organization, 1960 (x100)
=1 Has Black College, 1960 (x100)
Relative Representatlon index, 1960
À ln(Population), 1950-60
1960 to 1980 Change in:Percent of Populatlon Ages 5 to 17
Percent of Population Ages 65 and over
Percent of Familles below Poverty LinePercent Unemployed
Observations (counttes)T
B. County Characteristics
356.4
762.6
0.82
0.372
0.469
0.27
0.223
0.351
0.77
,o n
24.3
5 t.439.0
53.8
6.2
24.1
1.0
0.15
qt
3.2-23.1
5.4
I16.0192.3
0.33
0.132
0.081
0.34
0.186
0,122
0.83
16.2
14.6
47.2
4 5.5
49.9
24.1
42.8
u.t
0.22
1.9
I 1.3
3.2
317 ,Z 91.4
67 4.0 tg7 .2
0.76 0,34
0.448 0,083
0.478 0.06r
0.08 0.20
0.245 0.140
0.312 0,075
0.37 0.46
15.3
17 .5
43.8
Jt.o65.5
0.t24.2
1.0
0.29
-4.1
5.¿
-20.0
3.4
I 1.3
I 1.1
42.8
38.6
47 .6
3.8
42.9
0.8
0.33
1.5
¿.r)
10.9
3.4
491638
¡y'olesr The estimation sample lncludes all but hvo counties in the South (AL, AR, FL, GA, LA, MS, NC, SC, TN,TX, and VA). States with literacy tests still inplace immediately prior to theVRAareAL, GA, LA, MS, NC, SC,and VA. Cubernatorial turnout is for the election within the stâted four-year interval closest to the interval'sstarting point. Statistlcs are weighted by 1960 county population. See Appendix for sources. I For the schooldesegregation variables, there are 625 and 489 observations for the literacy test and nonliteracy test subsamples,respectively,
45

Table 2. Bdellne EvetrGStudy and Lonß-D¡fÎerenc€ Brlnìales
1960 perc€ blaclX liter¡cy lèlt lndicaror
X ¡ndlcalo¡ tor:
yeaÈ1952
yee=t956
year=1960
year=196{
yee=¡968
yeaFlgT2
yFi¡=1976
ye =1980
1960 percenl black
X llleracy rest ¡ndlca{or
1960 percenl blâck
¡9õ0 pûc€ñ black
X llte¡acy lal indicalorX ¡ndlcalor lo¡l
lg53>=yeaÞ1957 0.00255(0.00232)
1957>=yeaÞ1901
l96l>=yeaÞ1965 0-00194(0.00283)
1965>=y€aÞ1969 0.004E6'¡(0.00230)
1969>=y€aÞ1973 0.00376(0.00252)
I9?3>=y€aÞ1977 0.00672"(0.00321)
l9?7>=year>1980 0.00775¡¡'(0.0029?)
1960 perc€n( black 0.00775"'X lll€¡¡cytsr indicåror (0.00275)
-0.000537
(0.000735)
0.000194(0.000900)
0-000 r2 r
(0.000890)
0.00439.r.(0.00r r6)
(0.00¡24)
(0.001r1)
(0.0011?)
(0.00137)
1.34e.05
(0.00181)
0.00203(0.00r84)
0.00315(0.002371
0.00527'.(0.00208)
0.00332(0.0026s)
0.00429¡.(0.00r76)
6,774 l,rzsn 86C 0.425
Xxxxx
xxxxX
X
X
X
XX
al rlp I,5, ¿nd l0 p€rcenr levets, respecr¡vely.
1900 perccnl black
X lircracy resr lDdicator
ye¿r=195?
yeal=l902
yeår-196?
ye =1972
year=107?
yee=1982
1900 perc€nl blackX lllemcy resr i¡rdlcaror
7,902 1,t290.920 0_788
9,032 I,1290.89{ 0.708

Table 3. Long-D¡[Ierence Eslimales: Sensilivily lo Specincârion
lnlemcted wlthllleracy tesl
dummy
pove(y:
Ìnteract chlldpoverty wilh state
dûmmles
supporlln:
propenslty to be In
Conmon supporl
in p-score +
we¡8htln81960 black share literacy test stat€
1960 percent blackX literacy lest lndlcalor
R-squared
1960 p€¡cent blâck
X lileracy lert indica(or
R-squared
^ ln (prer. elect¡on turnoul rate)
^ ln (pres. electton lurnoúl rate)
R-squared
Observations (countles)
Cont¡ols:l960 chlld pov€ly rale
" X litemcy tesl indic¿tor
" X slate indicators
(0.00137) (0.001s3)
0.708 0.708
0.00429**(0.00176) (0.00208)
0.425 0.429
0.937** t.245*+(0.434) (0.560)
0.0658 0.0691(0.0809) (0.0811)
i.120 0.421
'l vo-stqe Lce.tt SqÌercs1.200**
(0.423) (0.516)
O inai! L¿ûst Sqw'es0.0{82 0.0347(0.0777) (0.l0Ð
0 539 0.43{
1.331** L518+.(o.s3r) (0.757)
0.0734 0.139+(0.0879) (0.0736)
0.424 0.528
A, ^
ln (Prestdenlial Eleclion Turnout Rate)
Redrce¿-þn't0.00{97*** 0.00343***
(0.00164) (0.00209) (0.00146) (0.00122)
0.74t 0.6?4 0.703 0.715
B. ^ln
(Per Caplta Slate Transfers)
Iìe¿rce¿-fù"¡0.00546*+" 0.00735** 0.00661*** 0.00520.+(0.00197) (0.002s1) (0.00213) (0.00203)
0.460 0.444 0.435 0.532
1,129
X
X
¿/¿ri Allmodels includesrate lndlcalorsa¡d 1960 p€r.ent hlack. The fûlleslinlallon sampl€ lncludes allbul two counll€r ln th€ South (AL, AR, FL, GA, LA, MS, NC,
SC, TN. TX. and VÀ). The lileracy test indicato¡ is set to one for slåtes with literâcy tests sl¡ll ln pla€e ¡mnred¡aGly prlor to lhe VRA (AL, GÀ, LA, MS, NC, SC, and VA).
and no mor€ rhan rh€ gorh p€rc€ntll€ otrhe perc€nt black dlstrlbutlon ¡or lates witi lite.âcy tells. Thes¡mple lncolunì¡ (5)drops coun(lei tn lr€¿tment states wjth
Regrerslons a¡e w€¡Bhtêd by I s60 counly populallon (x /,/(l "),
wh€r€ p r€presenß rhe $timar€d propensily scorc, lo¡ comparison côunli€s ¡n €olumn (6)). Slandard eûoß(ln parenùerer) ùe hÊte¡dçtedaslicity robrsl. **+, **, arìd ' indLcate ratlrtcal s'gnlncanc€ at lhe l,5, and l0 percent levels, ¡elPecuv€ly.
4'7
822 1,030 1,090
XXXXXX
I,l2S I,129
XX
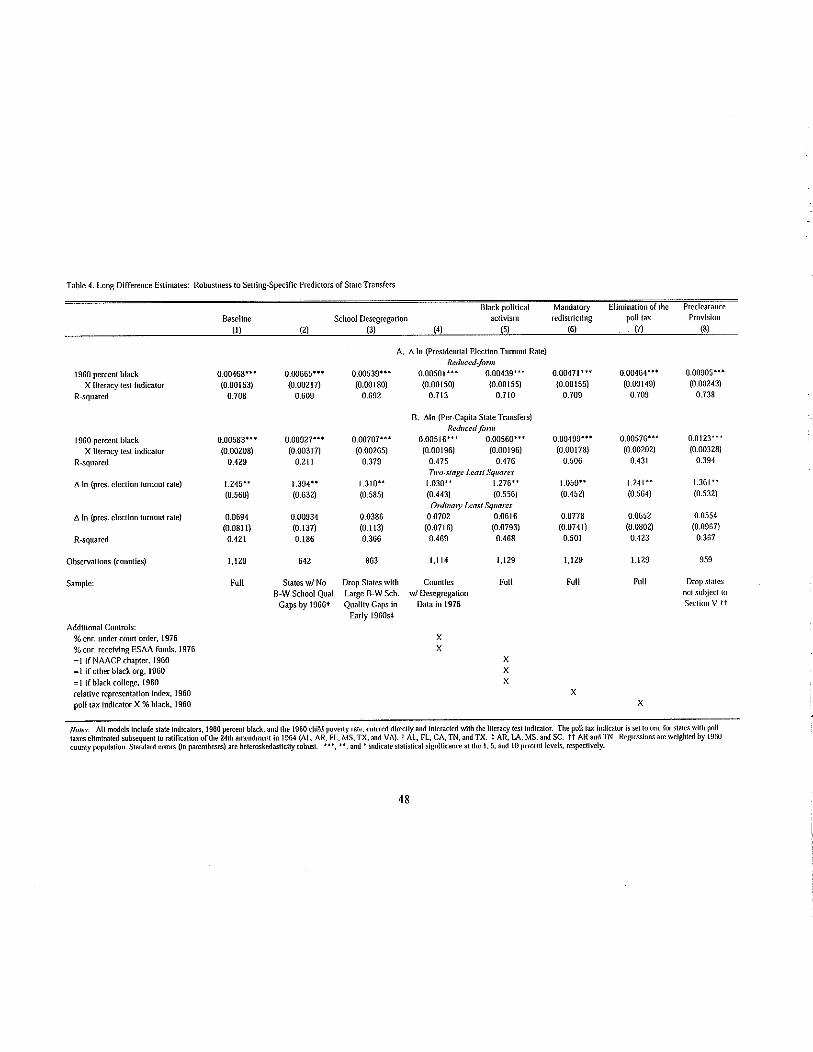
T¿ble,{. Long Djffercnc€ Esrlmal€s: Robùstn6s to sellin8-Spccifìc Prcdicloß olSlalelËnsl€ß
School Desegregar'on r€dlsrflcrlneLck polirlcaì
1960 perc€n( blackX l¡r€racy Gst lndlca{o¡
X lferåcy lesl lndlcãlo¡
Á In (pres. eledlon lumoul ßle)
^ ln (prcs. elecrlonlünou( ¡ãle)
obseryarloni (€ounùer)
San'ple:
%e r. ondercour o¡dù, 1976
% enr. rccelvhg ESAA lunds, I976
=l llNAÄCP €h¿plè¡, 1960
=l llorlìer black o¡8,1960
=l l¡bhck college, l9ô0rehllve reprcsenrarion lndex, 1960
polltax lndlcalor X % bl¿ck, 1960
0.00605...(0.00153) (0.00217)
0.708 0.609
(o.oo2o8) (0.00317)
0 {29 0.2ll
l'245'.¡.391}.1'310..(0.560) (0.ô32) (0.585)
0.0694 0.00931 0.0380(o.o8llÌ (0.137) (o.ll3)0.421 0.186 0.36ô
t,t29 612 863
A. À ln (P¡slde ialElecrion Tumout Rar€)
Re.t ce¿-Jo
0.00439¡+¡(0.01rr80) (0.00150) {0.00155) {0.00155)0.692 0.7t3 0.7¡0 0.709
B. Âln (Pet-Capxa Srare Toßteß)Re¿ ce¿-lot t
0'00707..i0'00560'''(0.00265) (0.00196) (0.00196) (0.00178)
0.379 0.175 0.476 0.506
Tr o-s ta se L. ast Sqùate s
¡'030}¡|'276|'(0.443) (0.556)
OftlinoD, Lcost Sq orcr0_0702 0.0616(o.o7lo) (0.0?93)
0.469 0.168
Lll4 I,129
t.05s¡.(0.4s2)
0.0778(0.074r)
0_501
L129
(0.00149) (0.00243)
0.709 0.738
0 0123"'(0.00202) (0.00328)
0.431 0.394
l'z4l''1.301'"(0.564) (0.532)
0.0652 0.055,t(0.0802) (0.0967)
0.423 0.367
t,129 959
Full D¡op slat6nor subjecr ro
Seclion V tt
Full Sl¿rès \!/ No Drop Slal$wlll Counll€s Full Full
B-w Scl@lQual. Lårye B.WSch. DsesresârionCsps by 1966t QualllyCaps in Dara h 1976
Early 1960s+
xX
Xxx
x
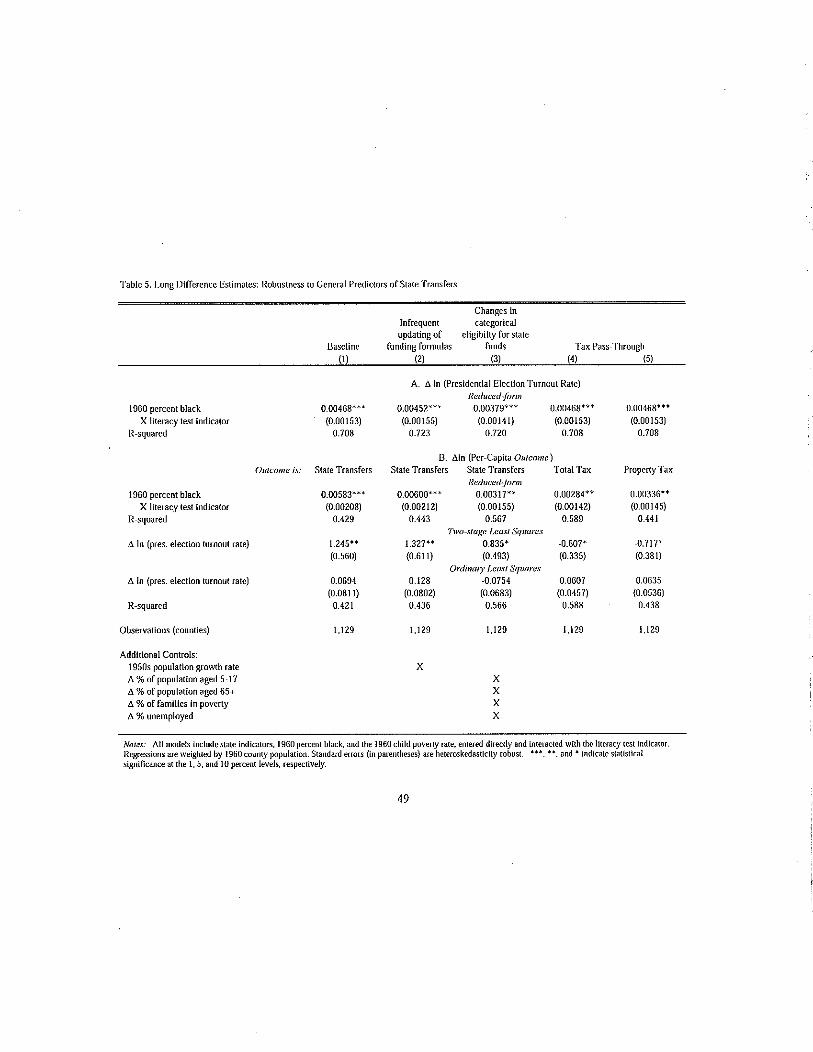
Table 5. Long Dlflercnce Estlmates: Robustness G General Predicloß ofSlat€ Trånsfers
Changes lnInfrequent ca(egoricalupdålingof €ligibihy for stâte
lundingfornìulas firnds Tåx Påss-Through
1960 percent blackX li(eracy t€sl lndicalor
R-sq!ared
1960 percent blackX llteracy lesl ¡ndlca(o¡
R-squared
^ ln (pres. elecllon (urnout rate)
^ ln (pres. e¡eclion turnout rale)
R squa.ed
Observatlons (countled
Add'tionel Conlrols:1950s populatlon groMh ¡ale
A % of populatlon aged 5-17
a % ofpopulatlon aged 65+
^ % offamllier in poverty
^ % unemployed
(0.00153)
0.708
B. Äln (PeFcapirå Orrcor¡¿)Or¡cor¡¿,rr Sråte Trânsf€rs Stal€ Translers State Transfers Tolal TÐr
A. ^
ln (Presidentjâl Election Turnout Rate)
Rc.t ce¿-lon0.00379¡** 0.00468*** 0 00468*++
(0.00155) (0.00141) (0.00153) (0.00rs3)
0723 0.720 0.708 0.?08
Proper(yTåx
R¿tttt.ctt-fotù¡0.00583*** 0.00600*** 0.00317** -0.00284*+ 0.00336*¡(0.00208) (0.00212) (0.00155) (0.00142) (0,0014s)
0.425 0.443 0.567 0.589 0.44r'lvo-s Ia Ee Le ast Sq üa rcs
1.245'+ 1.327+' 0.835* -0.60?* -0.717*
(0.560) (0.61l) (0.493) (0.33Ð (0.38r)
Ot.l¡truty Lcast Srtw, ¿s
0.0694 0.128 -0.0?54 0.0607 0.0635
(0.08rD (0.0802) (0.0683) (0.0457) (0.0536)
o12t 0.436 0.566 0_588 0.438
1.12S
Noreri All ¡nodels lnclüde rare lndlcaroß, 1960 perc€nt bl¿ck, ¿nd rhe 1960 child povsly raG. enr€red dlr€crly and lnr€mcl€d w¡lh lh€ lilerãcy tst indicatorRe8rssìons a¡e weighred by l960coûntypopùlatlon. Standa¡d eroß (ln par€nlheses) a.e hele¡osk€darici(y ¡obur. r**, *, sndi lndicâ(eratlsticalsi8¡lncånc€ at lhe l,5, and l0percent leveh, r€sp€cllvely.
r,l2sL129
XXX

Table 6. Black Representatives?
Dependent varíable: ^(%
Black in Upper House/
% Black in Pop)
A(% Black in Lower House/
% Black in Pop)
(1) (2)
literacy test indicator
R-squared
Observations
Unit of observation
-0.001
(0.i 1e)
0,000
11
staie
-0.182
(0.1 19)
0.100
1lstâte
,ly'otes: The dependent variable is the difference between the ratio of the 1977 and 1982 average percent
black in the state legislature to the 1980 percent black in the population and the ratio of the 1964 average
percent black in the state legislature to the 1960 percent black in the population, The estimation sample
includes all states in the South (AL, AR, FL, GA, LA, MS, NC, SC, TN, TX, and VA). The llteracy test
indicator is set to one for states with literacy tests still in place immediately prior to VRA (AL, GA, LA, MS,
NC,SC,andVA). Regressions are weighted by 1960 state population. Standard errors (in parentheses) are
heteroskedâsticity robust, ***, **, and * indicâte statistical signiffcance at the 1, 5, and l0 percent levels,
respectively.
50

Table Al. Full Reduced-Form RegÌession Results forPer-Capita State Transfers:
Selected Specifications from Tables 3, 4, and 5
Table 3,
côh,mn I
Dependent variable: ^ln
(Per Capita Stâte Transfèrs)
Table 3, Table 4, Table 4, Table 4, Table 4, Table 5, Table 5.
column 2 column 4 column 5 column 6 column 7 column 2 column 3
1960 percent blackX literacy test indicator
1960 percent black
I960 chlld poverty rate
X lite¡acy test indicator1960 child poverty râte
% enr. rec. ESAA funds, 1976
% eff. under court order, 1976
=l if NAACP chapter, 1960
=1 ifother black org, 1960
=l ifblack college, 1960
relative ¡ep. index, 1960
1960 percent blackX poll tax indicator
1950s population growth râte
^ 7o ofpopúlation aged 5-17
^ % ofpopulation aged 65+
^ % unemployed
^ % ofpopulation in poverty
R-squared
Observatlons
0.00429** 0,00583** 0.00560***(0.00r76) (0.00208) (0.00196) (0.00196)
0.00 r03 0.000881 -0.00r51 -0.00257
(0.0016r) (0.00168) (0.00191) (0,00r75)
-0.00349'0.00322 -0.00390*(0,00232) (0.00208) (0.00221)
0.000866 0.00346** 0,00635***(0.00173) (0.00167) (0.00190)
(0.000{57)
0.000637(0.000405)
0.130***(0.0296)
0.120**(o.o4s3)
0.121***(0.0398)
0.00499*** 0.00576*** 0.00600*** 0.00317**(0,00178) (0.00202) (0.002r 2) (0.0015s)
0.000744 0.00204 0.000904 -0,00154
(0.00147) (0.00r99) (0.00176) (0.00130)
-0.00457** -0.00378 -0,00270 -0.00129
(0.00197) (0.00236) (0.00239) (0.00r82)
0.00720*** 0.000943,0,00230 0.0176***(0.00167) (0.00r 70) (0,00240) (0.0018{)
_0.156***
(0.0263)
-0.00199
(0.00r50)
0.425 0.429 0.475 0.476
r.129 1.129 l.l 14 1.129
-0.214**(0.0964)
0.0366***(0,00752)
-0.0173
(0.01 10)
0,00678**(0.00304)
(0.00192)
0.431 0.443 0.567
I,t 29 I.lzS I,1290.506
|.t29
/V¿l¿rr All models include slate indicâtors. The eslimåtlon sâmple lnc¡udes all but two counlies in lhe South (AL, AR, FL, GA, LA, MS, NC, SC, TN, TX, andVA). Thellteücytestlndlcalorissertooneforslaleswilhl¡lerâiylesrsslllllnplaceimmedialelypriorlolheVRA(AL,GA,LA,MS,NC.SC,andVA). Theooli Lax indicatoíts set ro one for states wlth ooll laxes elim¡nârediubseouent to ratlflcarion of lhè 24th amendnìenl in 1964 (AL, AR, FL, MS, TX, and VA).hegressjonsareweightedbyl960countypoöulation.Slandarderrcrs(iirpârenlheses)åreheleroskedaslicllyrobusl.'¡',".and'lndlcâ(eslatis(icals¡gñilìcance al lhe 1, 5, ând l0 percent levels, reipecl¡vely.
51

Table ,{2. Full Reduced-Form Regression Results for Voter Turnout in President¡al Elections:
Selected Specifications from Tables 3, 4, and 5
Table 3,
column I
Dependent variâble: ^ln
(Presldential Election 'I urnout)
Table 3, Table 4, Table 4, Table 4, Table 4, Table 5, T¿ble 5,
column 2 column 4 column 5 column 6 column 7 column 2 column 3
1960 percent blackX literacy test indicator
1960 percent hlack
1960 child poverty rate
X literacy test indlcator1960 chtld poverty rate
% enr, rec. ESAA funds, 1976
% eff. under court order, 1976
=l lf NAACP chapter, 1960
=1 ifother black org, 1960
=l ifblack college, 1960
relative rep. lndex, l960
t 960 percent blackX polltax indicator
1950s population growth rate
^ % ofpopulation aged 5-17
^ % ofpopulation aged 65+
^ % unemployed
^ % ofpopulation in poverty
R-squared
Observatlons
0.00468*** 0.00501+*(0.00r53) (o.o0l5o) (0.00155)
0,00454*1* 0.00424**(0.00131) (0.00128) (0.00128)
-0.000379 -0.000986 0.000133(0.002r2) (0.00216) (0.0021s)
0.000281 0,000700 0.000r 47
(0.00194) (o.ool84) (0.00168)
-0.000300
(0.000238)
0.000356(0.000224)
'0.0148(0.0176)
0.0501(0.0507)
0 0168(0.0380)
0.00471*** 0,00464***(0.00r55) (0.00149)
0.00454*** 0.00522***(0.00r30) (0.00r38)
-0.000337 -0.000548(0.0021r) (0.002r 7)
3.04e 05 0.000327(0.00r 93) (0.00194)
(o.ool5s) (0.00141)
(0.00r 34) (0.001l4),0.00113 0,000820(o.oo2r r) (0.002r4)
0.00330* 0.0032 r
(0.001s4) (0.00r 99)
0.00458***(0.00137)
0.00459***(0,00r l8)
0.006r 7
(0.0t22)-0.001l8(0,00124)
0.708
I.1290.708 0.713 0.710
1,129 l.l 14 1.t290.709 0.70sI,129 I,t 29
0.204***(0.0508)
0.0215***(0.00707)
0.00284(0.00463)
0.000409(0.00330)
0.00278*(0.00163)
0.723 0.720
1,129 I,129
y'y'ol€ri AII models lnclüde state lndlcatoß. The est¡matlon sanple lncludes all but two counlies in the Soulh (AL, AR, FL, GA, LA, MS, NC, SC, TN, TX, ândVA) . The literacy lest ¡ndicålor is set to one for stares wlth ll(eraty tests sllll In place ¡m mediâlely prior lo lhe VRA (AL, GA, LA, MS, NC, SC. a nd VA). Tleooli tax indicåroiis sel to one lor ståtes wlth poll taxes ellnrlnated¡ubsequenr to ratincalion of lh¡ 2¡lrh åmendment In 1964 (AL, AR, FL, MS, TX, and VA).hegresslons are weighted by 1960 counry poirulålion. Slåndard enors (lå parentheses) are heleroskedalicity robusl. '", '¡, ând ' lndlcale slalislicalsign¡lìcance al rhe 1.5, and l0 percenl levels, respectively.
52