Embed Size (px)
Citation preview
Valued at 1 April, 2007
Matthew Lewis: [email protected] Tyler Page: [email protected]
Alex Segreti: [email protected] Andrea Spencer: [email protected]
Stephen Wiggins: [email protected]
1
Table of Contents Executive Summary 3 Business & Industry Analysis. 7
Five Forces Model 8 Rivalry Among Existing Firms 9 Threat of New Entrants 10 Threat of Substitute Products 11 Bargaining Power of Buyers 12 Bargaining Power of Suppliers 13 Competitive Advantage Analysis 14 Key Success Factors 14
Accounting Analysis 16 Key Accounting Policies 16 Accounting Flexibility 18 Accounting Strategy 20 Quality of Disclosure 21 Revenue Manipulation Diagnostics 23 Expense Manipulation Diagnostics 26 Potential “Red Flags” 29 Undo Accounting Distortions 30
Ratio Analysis Forecast Financials 31 Liquidity Analysis 31 Profitability Analysis 37 Capital Structure Analysis 44 Extended Ratio Analysis 46 SGR and IGR Analysis 47 Forecasting 47
Valuation Analysis 61 Cost of Equity 61 Cost of Debt 66 WACC 67 Method of Comparables 68 Intrinsic Valuation Models 72 Altman Z-Score 78 Analyst Recommendation 79
Appendix 80 Works Cited 84
2

3
Executive Summary Investment Recommendation: Overvalued, Sell 04/1/2007
BBBY – NASDAQ $40.40 52 week range $30.92 - $43.32 Revenue (2006) $5,809,562,000 Market Capitalization $11.75 Billion Shares Outstanding 283,380,000 3-month Avg. Daily Trading Volume 2,332,640 Institutional Ownership 83.40% Insider Ownership 3.70% Book Value Per Share (mrq) $9.35 ROE 25.99% ROA 17.90% Est. 5 year EPS Growth Rate 9.00% Cost of Capital Est. R2 Beta Ke Ke Estimated 13.01% 10-Year 37.4 2.28 15.87% 7-Year 37.4 2.28 12.56% 5-Year 37.5 2.29 12.62% 1-Year 37.8 2.30 12.71% 3-Month 37.8 2.31 13.01% Published 1.76 Kd BBBY: 5.74% Revised: 2.66% WACC BBBY: 12.03% Revised: 10.3% Altman Z-Score BBBY: 8.05
EPS Forecast FYE 03/03 2006(A) 2007(E) 2008(E) 2009(E) EPS 2.40 2.66 2.90 3.16 Ratio Comparison BBBY Industry Trailing P/E 16.81 18.49 Forward P/E 15.19 20.08 P/B 4.26 2.28 P/EBITDA 12.54 15.67 Valuation Estimates: Actual Price (04/01/2007) $40.40 Comparable Valuations Trailing P/E $44.38 Forward P/E $53.41 P/B $21.64 P/EBITDA $50.46 Intrinsic Valuations Actual Revised Discounted Dividends N/A N/A Free Cash Flows $60.42 $113.79 Residual Income $16.07 $15.22 Abnormal Earnings Growth $3.92 $4.54
4
Recommendation – Overvalued Firm – Sell Business, Industry Overview and Analysis Bed Bath & Beyond is one of the largest home furnishings and domestic
merchandise retailers in the country. They have expanded from two stores in
1971 to over 800 stores located in 46 states and Puerto Rico. This industry is
classified as highly competitive. The key players are Bed Bath & Beyond, Linens-
N-Things, Williams Sonoma, and Pier 1. The home furnishings industry is also
comprised of discount merchandise firms such as, Wal-Mart and Target. These
firms have the ability to steal some of the market share since a consumer can
find a variety of items in one store, and often at a lower price. However, the key
firms prosper since they have a greater variety of home furnishing products and
usually more knowledgeable associates. Overall, it is difficult to enter this
industry with a history of established firms. A firm must obtain a large amount of
capital and resources to be able to enter and compete with this developed
industry. Substitute products in this industry are a relatively moderate threat.
Firms in this industry usually carry similar products at similar prices, making it
easy for a consumer to switch back and forth between firms. Customers have a
lot of bargaining power in the industry. This means that firms in the industry
have to compete on price, resulting in smaller profit margins. Finally, suppliers
for the industry have a relatively low bargaining power over firms. Firms and
consumers both benefit from lower inventory costs, the result of an
overabundance of suppliers.
Accounting Analysis
An accounting analysis is performed to evaluate a firm’s accounting
practices in comparison to the realities of their current and prospective financial
position. The 10-k released each year by Bed Bath & Beyond contains vital
information identifying the firm’s key accounting policies. Bed Bath & Beyond
5
must be efficient managing operating costs, maintaining sufficient inventory
levels, and must possess strong expansion initiatives.
In keeping with generally accepted accounting principles (GAAP), Bed
Bath & Beyond follows aggressive accounting policies. The quality of disclosure
that a 10-k provides is of high importance to potential investors. Bed Bath &
Beyond inadequately discloses line item information within financial statements,
and fails to go beyond what is already there. This lack of disclosure appears to
be the industry standard, and requires a more meticulous evaluation of the
numbers presented in the financial statements.
Screening ratios are utilized to express any possible manipulations to
revenues or expenses. “Red flags” could be raised from negative trends in these
ratios that could possibly indicate inflated revenues or expenses being booked as
assets. Bed Bath & Beyond does not show any alarming trends in revenue
manipulation because they have the net income to support increases in sales.
However, Bed Bath & Beyond does have a declining CFFO/OI ratio. This is a
concern because operating expenses should increase with revenues. The
greatest concern about Bed Bath & Beyond’s accounting policies is their use of
operating leases. Operating Leases are a form of off-balance sheet transactions,
and expressed as only an operating expense. If these leases were capitalized,
Bed Bath & Beyond would be forced to include approximately 2.13 billion in long-
term liabilities and leased assets on the balance sheet.
Financial Analysis and Forecast
In valuing a firm, financial ratios can show how successful the firm
operates. Financial ratios can be broken down into three categories: liquidity,
profitability, and capital structure ratios. Liquidity ratios consist of seven ratios
that each explain Bed Bath & Beyond’s ability to pay back current liabilities and
debt. After compiling results, Bed Bath & Beyond’s overall liquidity appears to
have a declining trend. This could directly affect their financial position and
competitive advantages in the industry. Profitability ratios provide an idea about
6
the historical profitably, as well as, the ability to continue to efficiently generate
profits for the firm. The six ratios used in evaluating profitability, have steadily
increased over the past five years for Bed Bath & Beyond. Increases in net
income and efficient management practices have contributed to this steady
increase in profitability. Finally, the capital structure analysis examines the
percentage of the firm’s value that is comprised of debt and equity. We were
only able to utilize the debt to equity ratio because Bed Bath & Beyond does not
posses any notes payable or interest expense.
Forecasting Bed Bath & Beyond’s financial statements for ten years
allowed us to get an idea of where the company will be in the future. On the
income statement, sales and net earnings forecasts doubled which caused equity
to outgrow total assets. In order to account for this growth in the firm, total
assets had to be increased in proportion to equity. The firm was then forecasted
after the operating leases were capitalized and adjusted on the balance sheets.
Analysis Evaluations
In order to come up with an opinion on the value of the firm, we utilized
four intrinsic valuation models. The inconsistency of numbers in the financial
statements distorted the results from the valuation models. The residual income
ad AEG model resulted in the lowest intrinsic values, whereas the method of
comparables and free cash flow models were more accurate. The outcomes of
these ratios lead us to believe that Bed Bath & Beyond is an overvalued firm.
7
Five Year Inventory Summary
$-
$200.00
$400.00
$600.00
$800.00
$1,000.00
$1,200.00
$1,400.00
2002 2003 2004 2005 2006
Years
Mill
ions
Bed Bath and BeyondPier OneLinens-n-ThingsWilliams Sonoma
Business & Industry Analysis
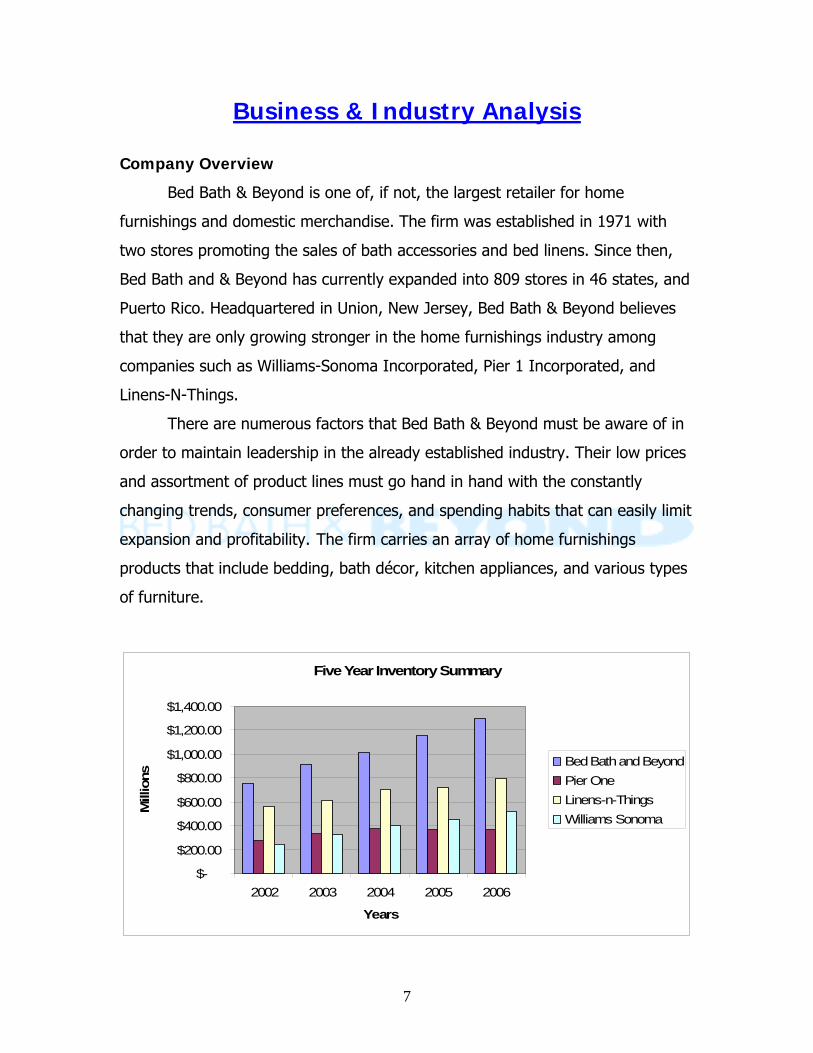
Company Overview
Bed Bath & Beyond is one of, if not, the largest retailer for home
furnishings and domestic merchandise. The firm was established in 1971 with
two stores promoting the sales of bath accessories and bed linens. Since then,
Bed Bath and & Beyond has currently expanded into 809 stores in 46 states, and
Puerto Rico. Headquartered in Union, New Jersey, Bed Bath & Beyond believes
that they are only growing stronger in the home furnishings industry among
companies such as Williams-Sonoma Incorporated, Pier 1 Incorporated, and
Linens-N-Things.
There are numerous factors that Bed Bath & Beyond must be aware of in
order to maintain leadership in the already established industry. Their low prices
and assortment of product lines must go hand in hand with the constantly
changing trends, consumer preferences, and spending habits that can easily limit
expansion and profitability. The firm carries an array of home furnishings
products that include bedding, bath décor, kitchen appliances, and various types
of furniture.
8
Bed Bath & Beyond has steadily increased its inventory over the past five
years, and attained an 11.63 billion dollar market capitalization. This is credited
primarily to new store expansion and efficiency of operations. Competitors in the
industry such as Williams-Sonoma Inc., and Pier 1 Inc., trail with the following
market caps: 3.84 billion, and 596 million. Comparable figures for Linens-N-
Things are unavailable since it is a privately held company. Over the past five
years, the total inventory of Bed Bath & Beyond has increased from 754 million
in 2002, to 1.3 billion dollars in 2006. These numbers support the company’s
goals to expand operations and store space. During fiscal 2006, the company is
planning on opening 80 new Bed Bath & Beyond stores. As a leader in the
industry, the company’s shares of stock have increased just over eight dollars
since March 2002, from 34 dollars in March 2002, to 40.40 dollars on April 1,
2007.
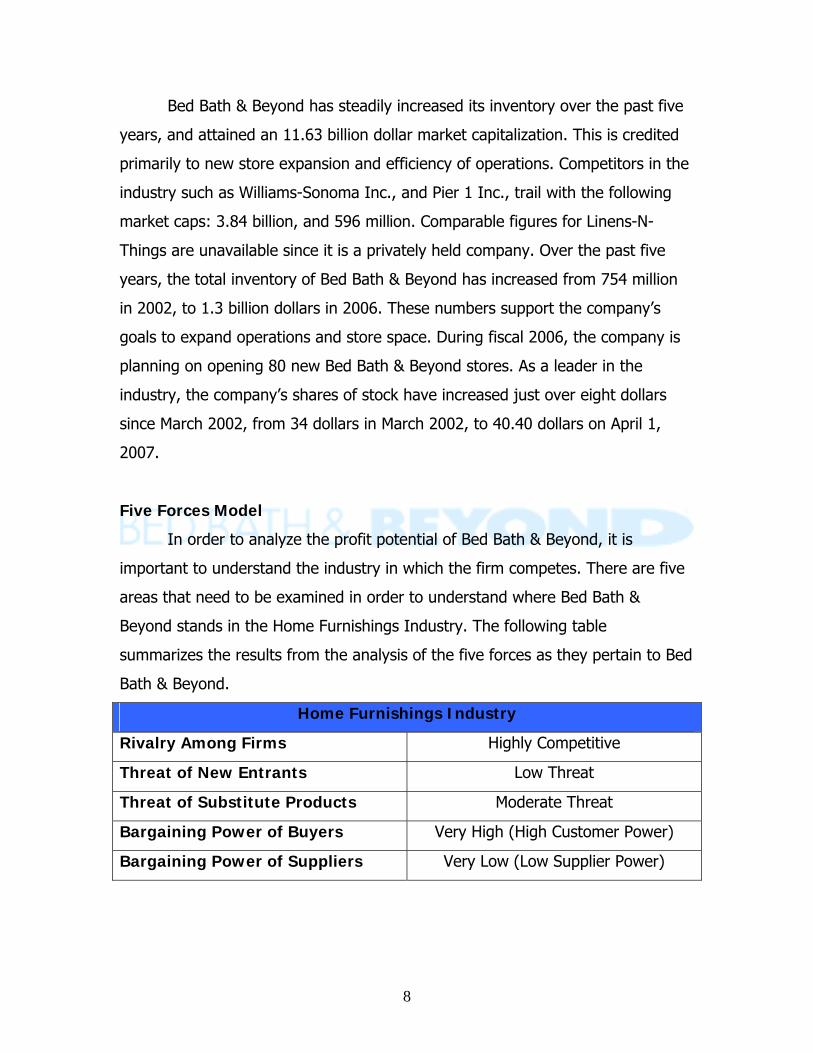
Five Forces Model
In order to analyze the profit potential of Bed Bath & Beyond, it is
important to understand the industry in which the firm competes. There are five
areas that need to be examined in order to understand where Bed Bath &
Beyond stands in the Home Furnishings Industry. The following table
summarizes the results from the analysis of the five forces as they pertain to Bed
Bath & Beyond.
Home Furnishings Industry
Rivalry Among Firms Highly Competitive
Threat of New Entrants Low Threat
Threat of Substitute Products Moderate Threat
Bargaining Power of Buyers Very High (High Customer Power)
Bargaining Power of Suppliers Very Low (Low Supplier Power)
9
Rivalry Among Existing Firms
Industry growth
A company’s profitability is directly related to the competition between
existing firms in the industry. The retail industry has always been known to be
extremely competitive. The home furnishings industry, which Bed Bath & Beyond
is classified under, is currently growing. Although the industry is expanding, firms
must still compete for market share among each other. The growth is steady in
this industry due to the constant demand for household products. This demand
gradually increases as consumer’s needs increase. This creates high competition
in price, customer service, and the market share of the company definitely plays
a role in its ability to compete.
Concentration
There are many different firms in the home furnishings industry. The big
competitors include Linens-N-Things, Pier 1, Williams Sonoma, and Bed Bath &
Beyond. Many other firms compete in this industry in an indirect manner;
examples include discount stores such as Target and Wal-Mart. The high level of
competition results in a largely fragmented industry, and severe price
competition.
Differentiation
“The extent to which firms in an industry can avoid head on competition
depends on the extent to which they can differentiate their products and
services” (Palepu 2-3). This is a challenge in this industry because many of the
products are undifferentiated. Market share and store image are extremely
important because consumers are going to shop at a place they recognize.
Fixed/Variable Costs
It is common in the industry to have high fixed costs. Many companies
rely on the use of operating leases for retail locations, merchandising, and
10
inventory. These are fixed rents for certain periods of time. The yearly operating
leases are discussed in detail in a later section, but the average rent was 340
million dollars per year. Variable costs in the industry generally come from
inventory. Many companies try to maintain large quantities of inventory, and are
vulnerable to the risk of excess volume if current consumer preferences were to
change.
Threat of New Entrants
Scale Economies
Growing industries tend to attract new entrants because they are seen as
having profit potential. In the home furnishings industry, the threat of new
entrants is classified as being very low because of economies of scale. The
industry growth is driving down the average price of products. New entrants
would have to be extremely large in order to gain market share due to the highly
concentrated industry. Bed Bath & Beyond is just one of many firms operating in
this industry. There are several other firms that can compete on the same level
of Bed Bath & Beyond like Linen-N-Things, and Williams-Sonoma. In addition,
they all must compete with all other major discount and department stores such
as Wal-Mart and Target. Economies of scale are clearly a deterrent for new firms
that attempt to enter the industry. If new firms were to enter, they would
probably suffer from the cost disadvantage, or face the choice of investing in a
large capacity.
11
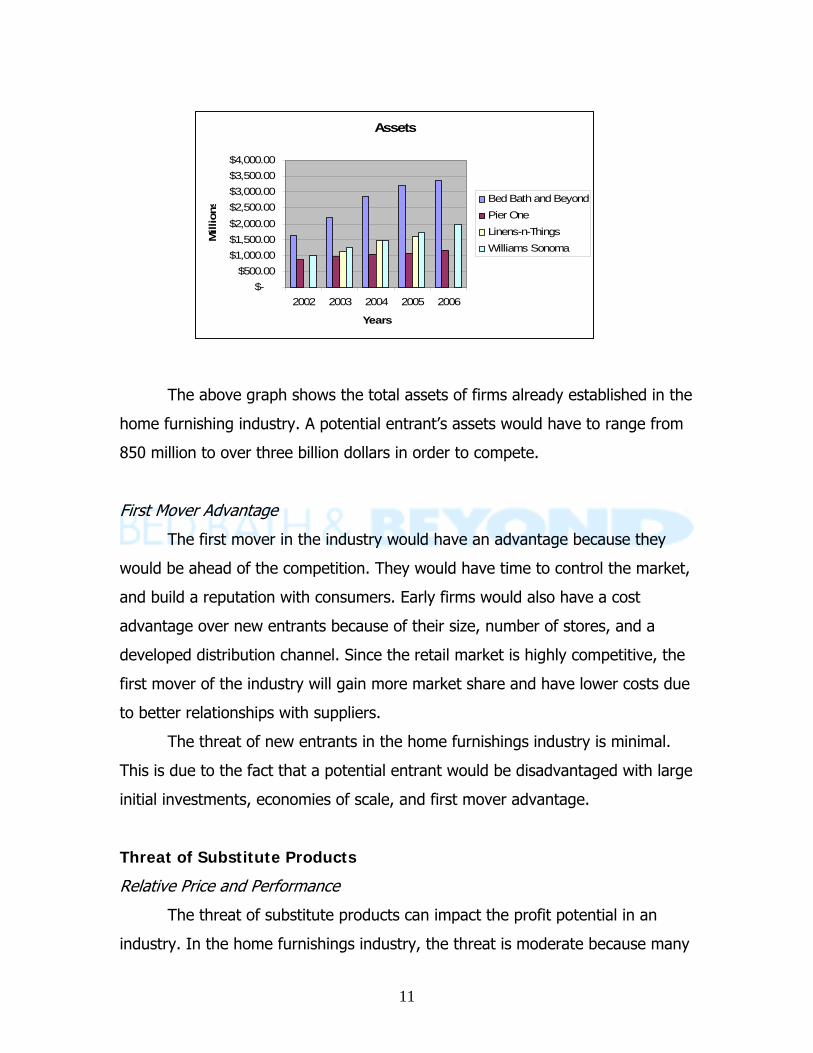
The above graph shows the total assets of firms already established in the
home furnishing industry. A potential entrant’s assets would have to range from
850 million to over three billion dollars in order to compete.
First Mover Advantage
The first mover in the industry would have an advantage because they
would be ahead of the competition. They would have time to control the market,
and build a reputation with consumers. Early firms would also have a cost
advantage over new entrants because of their size, number of stores, and a
developed distribution channel. Since the retail market is highly competitive, the
first mover of the industry will gain more market share and have lower costs due
to better relationships with suppliers.
The threat of new entrants in the home furnishings industry is minimal.
This is due to the fact that a potential entrant would be disadvantaged with large
initial investments, economies of scale, and first mover advantage.
Threat of Substitute Products
Relative Price and Performance
The threat of substitute products can impact the profit potential in an
industry. In the home furnishings industry, the threat is moderate because many
Assets
$-$500.00
$1,000.00$1,500.00$2,000.00$2,500.00$3,000.00$3,500.00$4,000.00
2002 2003 2004 2005 2006
Years
Mill
ions
Bed Bath and BeyondPier OneLinens-n-ThingsWilliams Sonoma
12
items perform the same functions and are priced similarly. There are many
discount stores which sell these items, but many consumers choose the specialty
stores. Access to distribution channels is easy to obtain. A new entrant would not
have difficulty establishing a relationship with a supplier, but a new entrant may
not be able to get favorable terms with a supplier. Therefore, their cost would be
too high, prices of their goods would be higher, and they would not be able to
compete in the industry.
Buyer’s Willingness to Switch
The consumers within this industry are focused on purchasing products at
the lowest possible price. For this reason, their willingness to switch between
firms in the industry is very high. The buyers have flexibility to choose between
firms in the industry, resulting in further depletion of prices.
Bargaining Power of Buyers
When considering customer power, two main factors come into play. One
of which is the bargaining power of the purchaser. In this industry, customers
have high bargaining power because of the intense concentration of similar
competitors. Bargaining power is developed when companies in the industry are
attempting to attract customers to purchase from them and not revert to other
retailers. The other factor would be price sensitivity. Bargaining power and price
sensitivity go hand in hand. The retailers in this industry must have some level of
price sensitivity in order to get those customers. This tends to be difficult
because home furnishing products are undifferentiated.
Differentiation
Retail firms in this industry all carry similar inventories, causing the
products and firms to be undistinguishable. This permits the customers to pit the
firms against each other in price competition. The firm that competes at the
lowest cost is going to gain the customer for the same product that they could
13
find elsewhere. In the home furnishings industry, it is hard to differentiate
products. This causes an industry-wide problem and many companies find it
difficult to prevent their consumer sales from going to their competitors.
Bargaining Power of Suppliers
Suppliers are considered to have power when there are few firms and
substitutes in the industry. Therefore, the supplier power is extremely low within
the home furnishings industry. The four major firms that exist in this
environment are able to intimidate the suppliers in order to achieve the lowest
cost on a product. Suppliers rely on the major companies in this industry to help
them generate profits. Therefore, suppliers prefer a retailer with a substantial
amount of customer traffic. The firms in this industry attempt to leverage
themselves against suppliers to get the lowest cost, which in turn will lower costs
to the consumer.
Switching costs
Since the industry contains many suppliers, the cost of switching suppliers
is affordable. Suppliers are constantly competing to have their products on the
shelves at these retailers. Therefore, suppliers do not have much bargaining
power. Since limited power exists on the suppliers’ behalf, switching costs for
firms in this industry are relatively non-existent.
Number of Suppliers
Suppliers are plentiful in the home furnishings industry. One firm
recorded having approximately 4,300 suppliers. The largest supplier accounted
for only 4% of total merchandise purchases. According to Bed Bath & Beyond’s
10-k, the top ten leading suppliers account for a minimal total of 18% for
merchandise purchases. If suppliers were to increase their costs, buyers have
the power and freedom to turn to other suppliers at lower costs.
14
Competitive Advantage Analysis
Industry Classification
The home furnishings and domestic merchandise retail industry is very
competitive. A person can go to almost any store and get items they need for
their home. Bed Bath & Beyond, Linens-N-Things, and Pier 1 tend to offer more
specialty items that are less likely found in discount stores like Target and Wal-
Mart. These home furnishing stores also provide many advantages beyond
specialty items, such as, limited crowds, and a timely shopping experience. As of
now, Bed Bath & Beyond leads the industry in sales followed by Linens-N-Things,
Williams-Sonoma, and Pier 1. Firms in this industry present their merchandise in
a distinct manner that maximizes the customers shopping experience; whereas,
stores such as Target and Wal-Mart, have domestic merchandise in select isles
throughout their stores.
Key success factors for the industry
Cost leadership
The main success factor in this industry is cost leadership. Since there are
many different competitors, the company that can supply name brand or similar
products for the lowest price will attract more customers. Most cities will contain
several home furnishing companies, expressing the ease of going to another
company to purchase the product.
Differentiation
Today the industry’s top goal is to maintain quality goods and everyday
low pricing. They do this by observing competitor’s prices often to ensure their
prices are matched, if not lower. Superior customer service also drives the
success of the industry. The firm with employees most knowledgeable about the
goods the store carries, and where they are located throughout the store, have
an advantage over the other competitors. Another goal is to have their isles set
15
up where customers can easily see the many goods that appeal to them and the
wide-selection the firms in the industry offers.
Merchandise assortment sets firms in the home furnishings industry apart
from department stores. Many home furnishing companies carry the same type
of goods as the department stores, but a wider variety of brands, gadgets, and
prices. Today the competitors of this industry carry linens, kitchen goods, beauty
care, furnishings, and other house wares. Having more of these goods drive
more customers to these stores for unique or hard to find products that you may
not find at a department store. Store personnel are encouraged to tailor each
store to the city in which it is located. This means that items will vary based on
demographics, climate, and constantly changing trends.
16
Accounting Analysis
Key Accounting Policies
An accounting analysis is performed to evaluate a firm’s accounting
practices in comparison to the realities of their current and prospective financial
position. In other words, do the firm’s accounting actions define or explain the
numbers represented in the financial statements? Before an analysis can begin,
one must first identify the firm’s key success factors and risks. Bed Bath &
Beyond operates in a highly competitive home furnishings industry and must
focus on managing operating costs, maintaining sufficient inventory levels in an
industry with changing customer preferences, and strong expansion initiatives.
“Judgment is used in areas such as the inventory valuation, impairment of long
lived assets, goodwill, stock-based compensation, and future operating lease
obligations” (BBBY 10-k). This freedom can lead management to more
aggressive accounting practices in order to meet the firm’s key success factors.
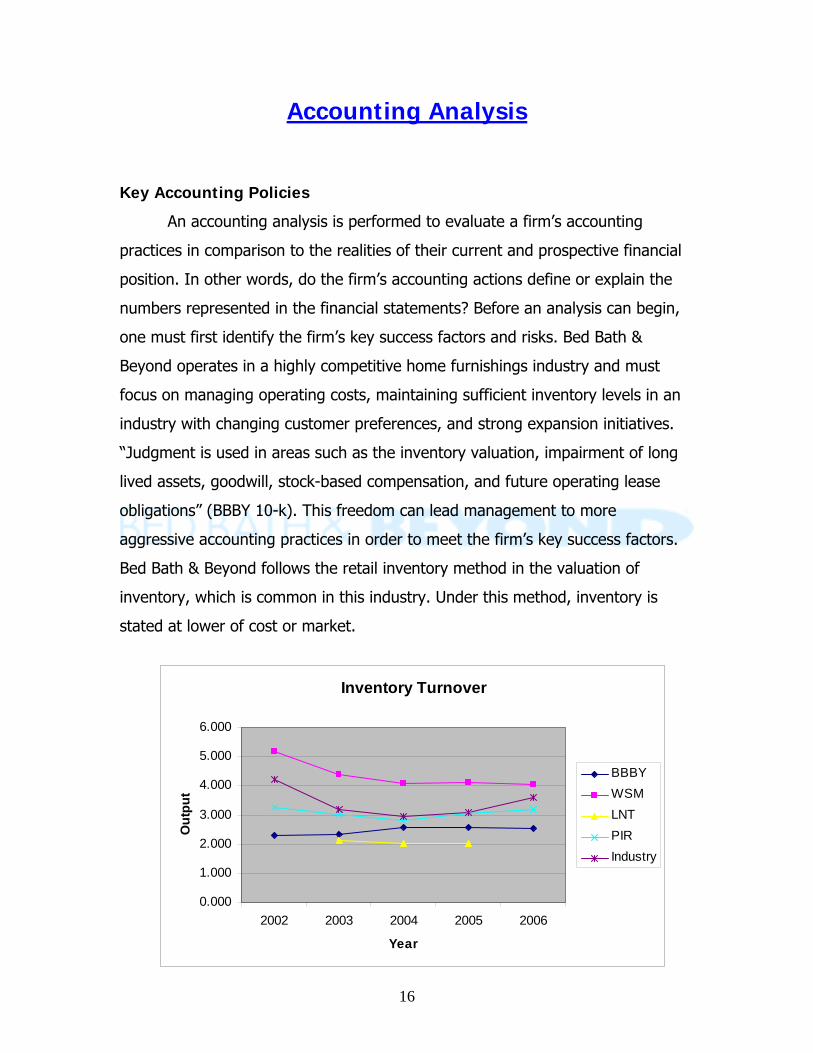
Bed Bath & Beyond follows the retail inventory method in the valuation of
inventory, which is common in this industry. Under this method, inventory is
stated at lower of cost or market.
Inventory Turnover
0.000
1.000
2.000
3.000
4.000
5.000
6.000
2002 2003 2004 2005 2006
Year
Out
put
BBBYWSMLNTPIRIndustry
17
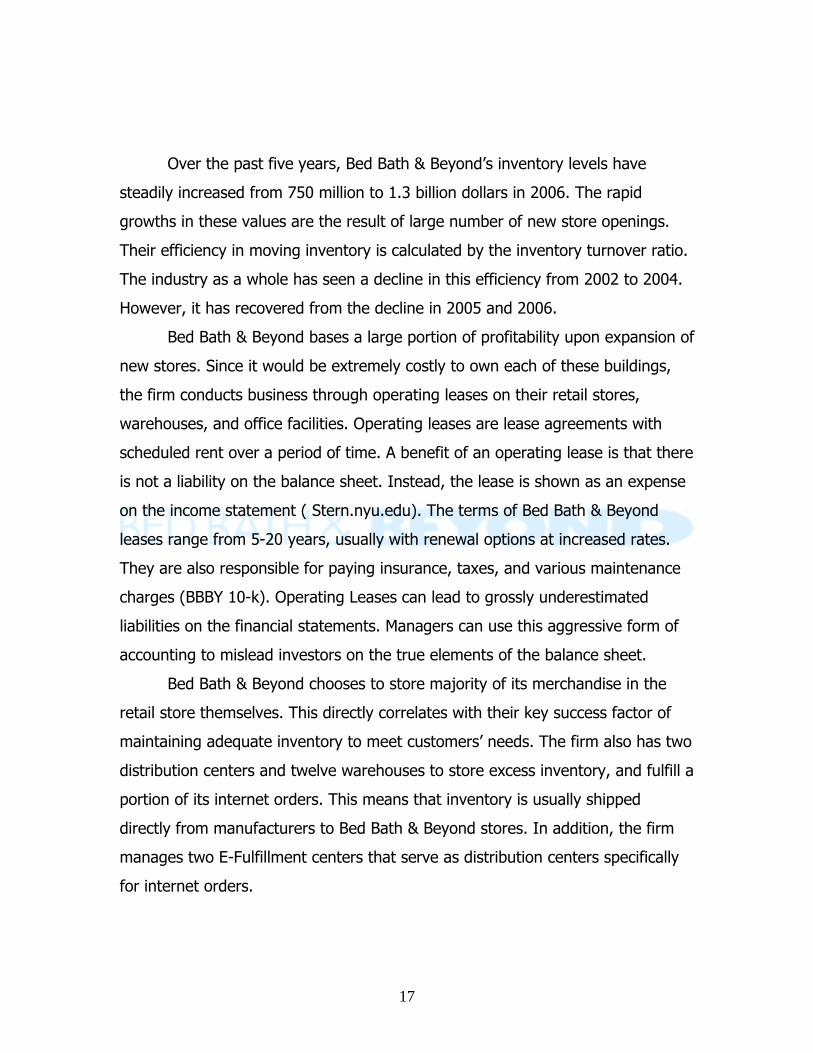
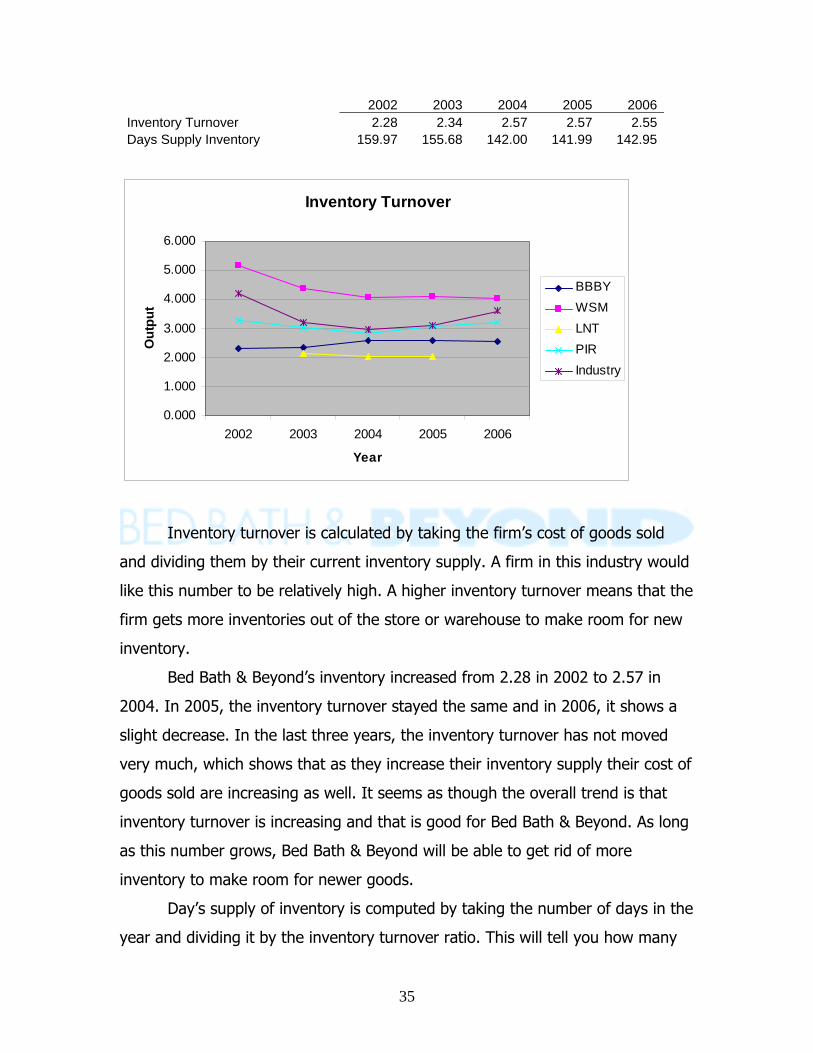
Over the past five years, Bed Bath & Beyond’s inventory levels have
steadily increased from 750 million to 1.3 billion dollars in 2006. The rapid
growths in these values are the result of large number of new store openings.
Their efficiency in moving inventory is calculated by the inventory turnover ratio.
The industry as a whole has seen a decline in this efficiency from 2002 to 2004.
However, it has recovered from the decline in 2005 and 2006.
Bed Bath & Beyond bases a large portion of profitability upon expansion of
new stores. Since it would be extremely costly to own each of these buildings,
the firm conducts business through operating leases on their retail stores,
warehouses, and office facilities. Operating leases are lease agreements with
scheduled rent over a period of time. A benefit of an operating lease is that there
is not a liability on the balance sheet. Instead, the lease is shown as an expense
on the income statement ( Stern.nyu.edu). The terms of Bed Bath & Beyond
leases range from 5-20 years, usually with renewal options at increased rates.
They are also responsible for paying insurance, taxes, and various maintenance
charges (BBBY 10-k). Operating Leases can lead to grossly underestimated
liabilities on the financial statements. Managers can use this aggressive form of
accounting to mislead investors on the true elements of the balance sheet.
Bed Bath & Beyond chooses to store majority of its merchandise in the
retail store themselves. This directly correlates with their key success factor of
maintaining adequate inventory to meet customers’ needs. The firm also has two
distribution centers and twelve warehouses to store excess inventory, and fulfill a
portion of its internet orders. This means that inventory is usually shipped
directly from manufacturers to Bed Bath & Beyond stores. In addition, the firm
manages two E-Fulfillment centers that serve as distribution centers specifically
for internet orders.
18
Accounting Flexibility
All publicly-traded firms are required to submit a variety of reports to the
SEC each year. Ideally, the numbers represented in the reports are in agreement
with GAAP (generally accepted accounting principles). However, some managers
have a certain degree of flexibility, or leniency in the disclosure of their financial
reports. For example, in the event of inventory valuation, the manager can use
methods such as LIFO, FIFO, or a weighted-average cost. As previously stated,
majority of the home furnishings industry uses lower of cost or market to value
their inventory. When Bed Bath & Beyond acquired Christmas Tree Stores in
2003, they chose to value CTS’s inventory using the FIFO method. This gives the
firm the opportunity to control inventory valuation of particular acquisitions
within the company. If the firm chooses to increase cost of goods sold, to lessen
income taxes, a LIFO valuation would be implemented. The FIFO method could
be implemented if the firm is focused on decreasing expenses. Alterations in
valuation must be monitored over the years because an inconsistency in policy
could raise concerns.
Managers within the industry also have the flexibility to report balance
sheet values in two separate books: one for financial reporting purposes, and
one for income tax purposes. There could easily be a difference between the
income reported to shareholders, and the income reported to the IRS. In 2006,
Bed Bath & Beyond claimed “a net current deferred income tax asset of 70.1
million dollars and a net non current deferred income tax liability of 16.3 million
dollars (BBBY 10-k). This aggressive accounting policy allows managers to stray
from the industry standard of straight-line-depreciation and use an accelerated
depreciation process to receive tax benefits.
The choice of using operating leases over capital leases is another area
which firms have flexibility. Firms often choose to lease long term assets rather
than purchase them as is the case with Bed Bath & Beyond; they choose to
operate using only operating leases. Operating leases are common among the
industry. This can lead to a deceptive view of the company’s financial position
19
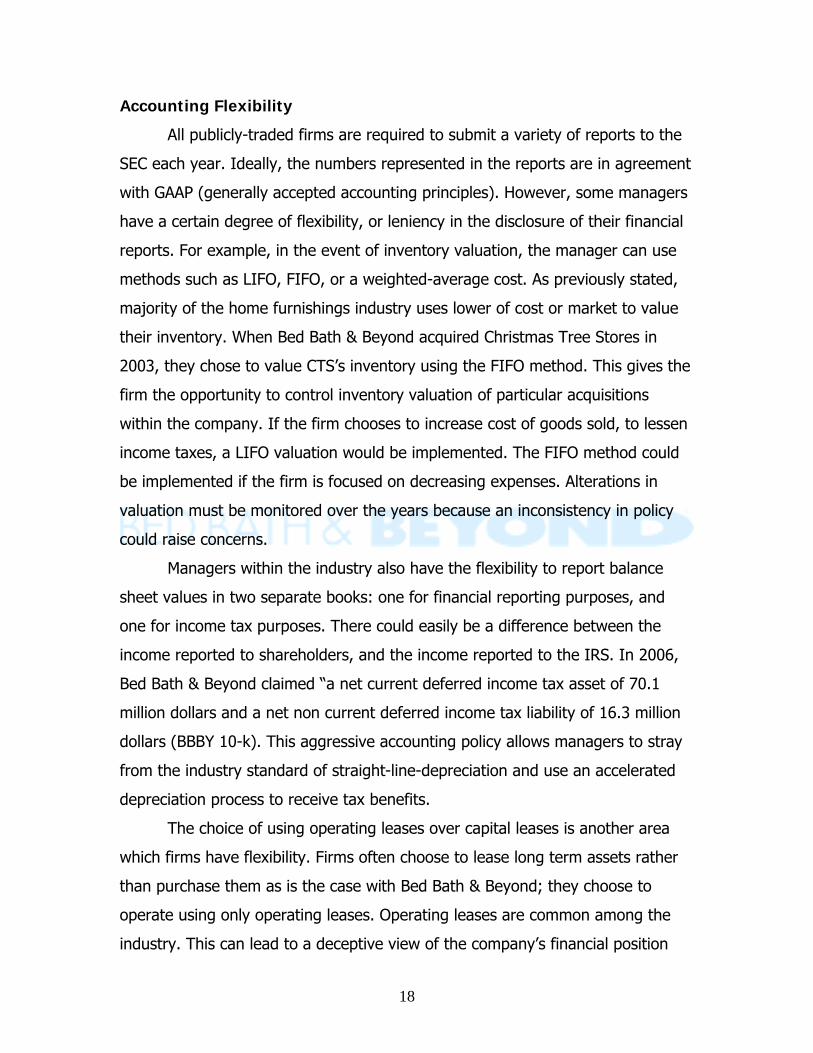
because this can greatly understate the balance sheet (Stern.nyu.edu). If Bed
Bath & Beyond and Linens-N-Things were to capitalize these leases it would
create liabilities of 2.13 and 1.7 billion dollars. Bed Bath & Beyond’s use of
operating leases classifies them as a firm that uses aggressive accounting
policies.
Bed Bath & Beyond Capitalization of Operating Leases
In thousands
Year Operating
Lease PV Factor* PV Capital Lease PV
2006 340806 0.9259 315,561 376,861 348,946
2007 347398 0.8573 297,838 362,996 311,211
2008 340131 0.7938 270,007 347,495 275,853
2009 322488 0.7350 237,038 331,335 243,541
2010 295050 0.6806 200,806 315,293 214,583
2011 284254 0.6302 179,128 300,163 189,154
2012 284254 0.5835 165,859 284,686 166,112
2013 284254 0.5403 153,574 267,971 144,777
2014 284254 0.5002 142,198 249,919 125,022
2015 284254 0.4632 131,665 230,423 106,731
Totals: 3067143 2,093,674 3,067,143 2,125,927*Values Discounted at 8%
The capitalization of Bed Bath & Beyond’s operating leases is shown
above, and Linens-N-Things are shown in the table below. The discount rate,
8%, was found to be the home furnishings industry standard. This discount rate
seems to accurately reflect the industry and the type of debt. By discounting the
capital leases payments, we found that to get a more accurate look at Bed Bath
& Beyond they should actually record liabilities of 2.13 billion dollars. This would
also alter earnings and ratios previously computed. In order to receive debt
financing, many lenders will require that the firm remain below a certain level of
total liabilities in order to control risk. The revised financial statements
20
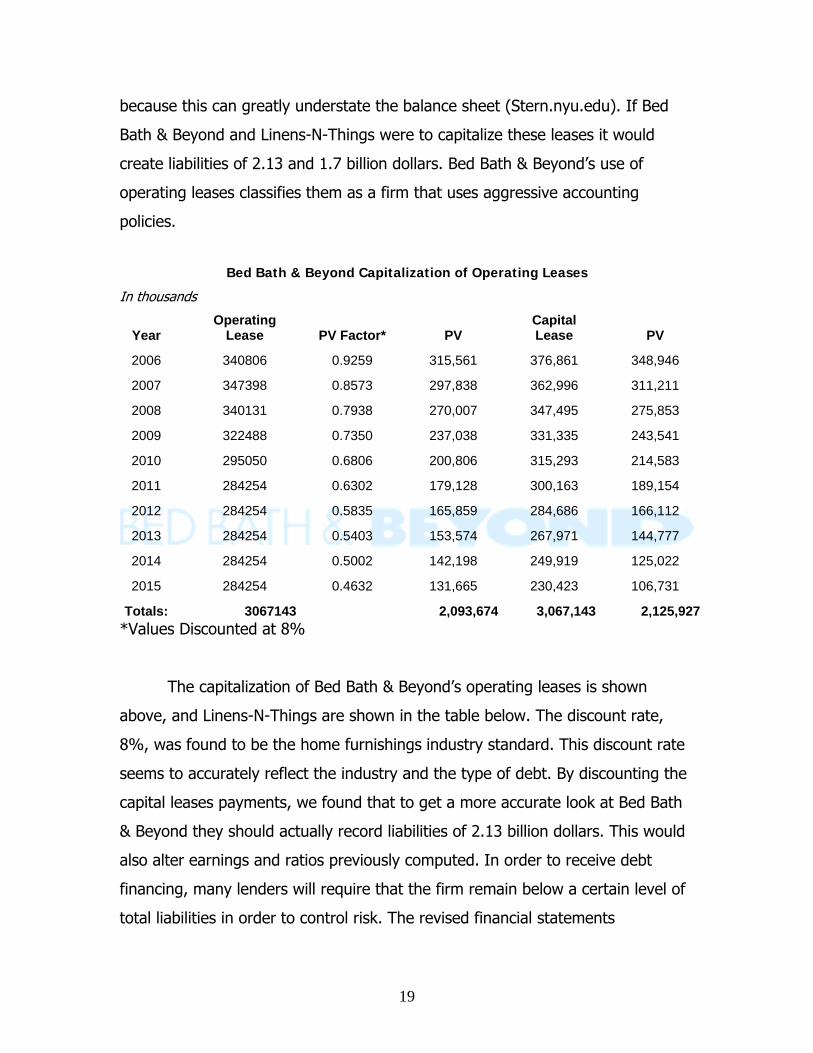
incorporating this change in liabilities are presented in the undo accounting
distortions section.
Linens-N-Things Capitalization of Operating Leases
In thousands
Year Operating
Lease PV Factor* PV Capital Lease PV
2006 263,469 0.9259 243,953 300,968 278,674
2007 262,630 0.8573 225,163 290,592 249,136
2008 259,830 0.7938 206,261 279,452 221,838
2009 257,041 0.7350 188,933 267,646 196,728
2010 237,713 0.6806 161,783 255,118 173,629
2011 237,713 0.6302 149,799 243,134 153,216
2012 237,713 0.5835 138,703 230,191 134,314
2013 237,713 0.5403 128,429 216,213 116,813
2014 237,713 0.5002 118,915 201,117 100,609
2015 237,713 0.4632 110,107 184,813 85,604
Totals: 2,469,245 1,672,046 2,469,245 1,710,561 *Values Discounted at 8%
Accounting Strategy
Bed Bath & Beyond strives to “offer quality merchandise at everyday low
prices; maintain a wide assortment of merchandise, and to emphasize dedication
to customer service and satisfaction” (BBBY 10-k). These objectives are closely
related to the business strategies of Linens-N-Things, Pier 1, and Williams-
Sonoma. Linens-N-Things hopes to “offer a broad selection of high quality brand
names at everyday values, provide knowledgeable sales assistance, and maintain
low operating costs” (Linens N Things 10-K). To maintain a high competitive
presence in the industry, each firm will adopt similar accounting strategies and
principles. Unfortunately, high levels of aggressive accounting in the industry,
force employers to reduce disclosure, therefore, lessen the firm’s transparency.
Managers attempt to stretch the limits of GAAP principles to
“communicate their firm’s economic situation or to hide true performance”
21
(Palepu 3-6). The use of operating leases in the industry provides off balance
sheet transactions that could easily go unnoticed by the average shareholder.
The home furnishings industry does not exhibit a great amount of
seasonality. However, there is a substantial increase in sales in the months of
August, November, and December (BBBY 10-k). This is why Bed Bath & Beyond
chooses their fiscal year to end on the last Saturday nearest February 28th. This
is a strategy they use in order to begin and end the accounting year in virtually
the same position, a month with a consistent level of sales from year to year.
Quality of Disclosure
Shareholders rely on the company’s 10-k to research information about
the firm, and to decide whether or not to invest in the company. The quality of
disclosure that a 10-k provides is of high importance. It can show the firm’s true
operations and value through financial statements, footnotes, and supplemental
disclosure. The quality of disclosure and transparency of the firm lie in the
managers’ hands of that company. This is because the managers have control
over what to disclose in their 10-k while following the guidelines of FASB, SEC
and GAAP.
In order to get a good idea of one company’s disclosure, one should
research the industry first. The home furnishings industry as a whole is very
aggressive when it comes to reporting the accounting. Aggressive accounting is
not always a good thing. Sometimes it can lead to inadequate disclosures to
make the company appear better financially. Also, overall the industry has an
extremely limited disclosure. The industry’s 10-ks are inadequate on the amount
of information disclosed, compared to companies in the technology and
manufacturing fields.
After having a general idea of the home furnishings industry, Bed Bath &
Beyond’s level of disclosure can be better understood when reviewing the 10-k.
Bed Bath & Beyond practices aggressive accounting along with their competitors;
and because of their large market share, they are often seen as being more
22
aggressive relative to other firms in the industry. When first looking at their 10-k,
one might think that the disclosure and information provided is efficient and
useful, but in reality it is not. The numbers represented in Bed Bath & Beyond’s
income statement, balance sheet, and statement of cash flows, are all extremely
vague. For example, there is no concise explanation of what makes up “other
assets” in the condensed balance sheet. It gives the basic points, but does not
go much deeper than surface level. There are many components on these
financial statements that are missing. An effective valuation of a firm is difficult
when the amount of information disclosed is limited.
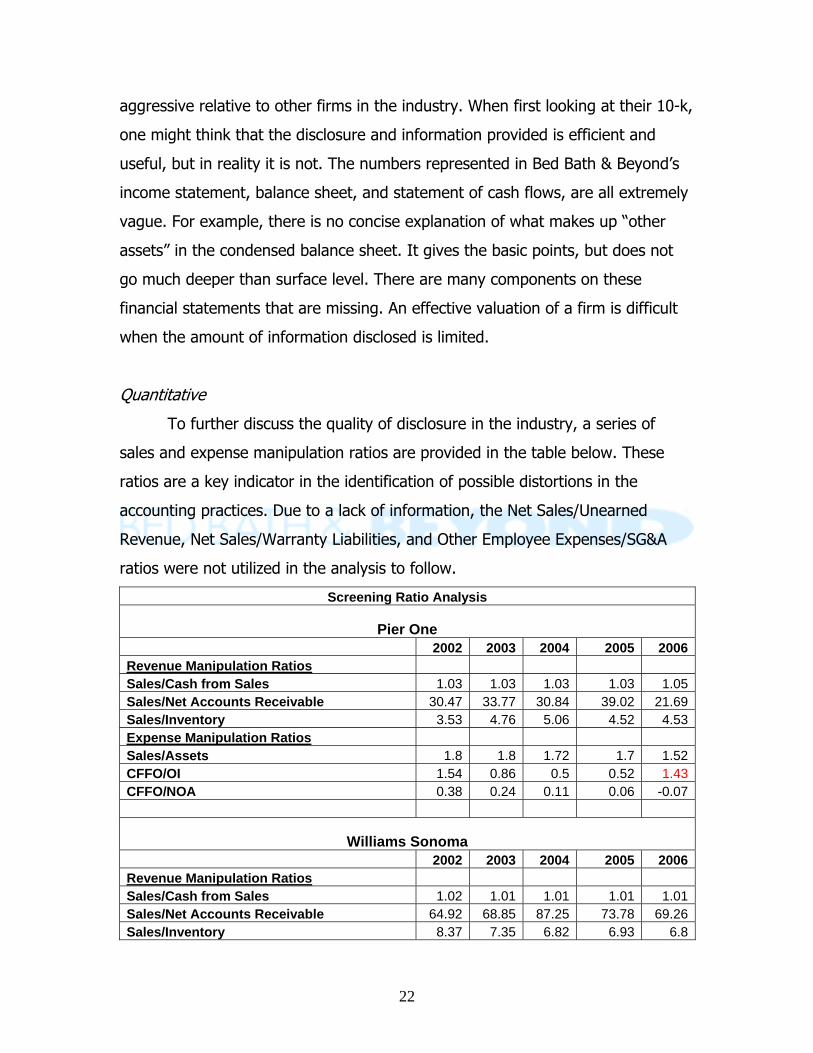
Quantitative
To further discuss the quality of disclosure in the industry, a series of
sales and expense manipulation ratios are provided in the table below. These
ratios are a key indicator in the identification of possible distortions in the
accounting practices. Due to a lack of information, the Net Sales/Unearned
Revenue, Net Sales/Warranty Liabilities, and Other Employee Expenses/SG&A
ratios were not utilized in the analysis to follow.
Screening Ratio Analysis
Pier One 2002 2003 2004 2005 2006Revenue Manipulation Ratios Sales/Cash from Sales 1.03 1.03 1.03 1.03 1.05Sales/Net Accounts Receivable 30.47 33.77 30.84 39.02 21.69Sales/Inventory 3.53 4.76 5.06 4.52 4.53Expense Manipulation Ratios Sales/Assets 1.8 1.8 1.72 1.7 1.52CFFO/OI 1.54 0.86 0.5 0.52 1.43CFFO/NOA 0.38 0.24 0.11 0.06 -0.07
Williams Sonoma 2002 2003 2004 2005 2006Revenue Manipulation Ratios Sales/Cash from Sales 1.02 1.01 1.01 1.01 1.01Sales/Net Accounts Receivable 64.92 68.85 87.25 73.78 69.26Sales/Inventory 8.37 7.35 6.82 6.93 6.8
23
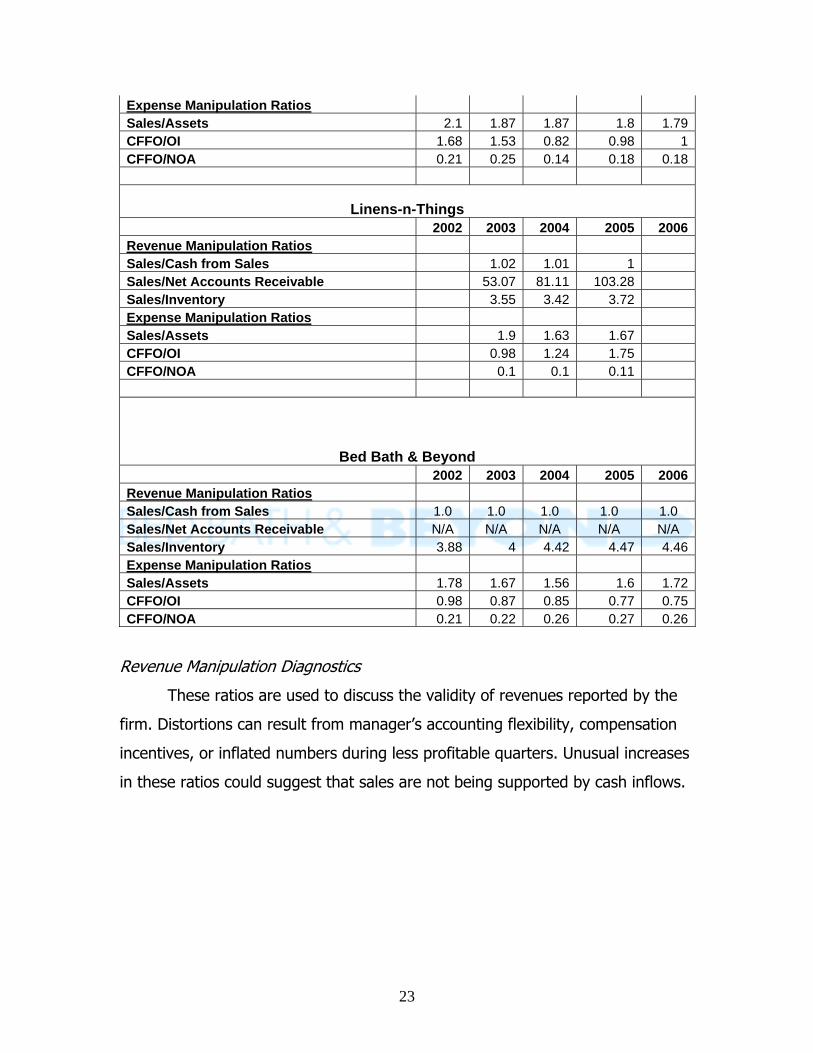
Expense Manipulation Ratios Sales/Assets 2.1 1.87 1.87 1.8 1.79CFFO/OI 1.68 1.53 0.82 0.98 1CFFO/NOA 0.21 0.25 0.14 0.18 0.18
Linens-n-Things 2002 2003 2004 2005 2006Revenue Manipulation Ratios Sales/Cash from Sales 1.02 1.01 1 Sales/Net Accounts Receivable 53.07 81.11 103.28 Sales/Inventory 3.55 3.42 3.72 Expense Manipulation Ratios Sales/Assets 1.9 1.63 1.67 CFFO/OI 0.98 1.24 1.75 CFFO/NOA 0.1 0.1 0.11
Bed Bath & Beyond 2002 2003 2004 2005 2006Revenue Manipulation Ratios Sales/Cash from Sales 1.0 1.0 1.0 1.0 1.0 Sales/Net Accounts Receivable N/A N/A N/A N/A N/A Sales/Inventory 3.88 4 4.42 4.47 4.46Expense Manipulation Ratios Sales/Assets 1.78 1.67 1.56 1.6 1.72CFFO/OI 0.98 0.87 0.85 0.77 0.75CFFO/NOA 0.21 0.22 0.26 0.27 0.26
Revenue Manipulation Diagnostics
These ratios are used to discuss the validity of revenues reported by the
firm. Distortions can result from manager’s accounting flexibility, compensation
incentives, or inflated numbers during less profitable quarters. Unusual increases
in these ratios could suggest that sales are not being supported by cash inflows.
24
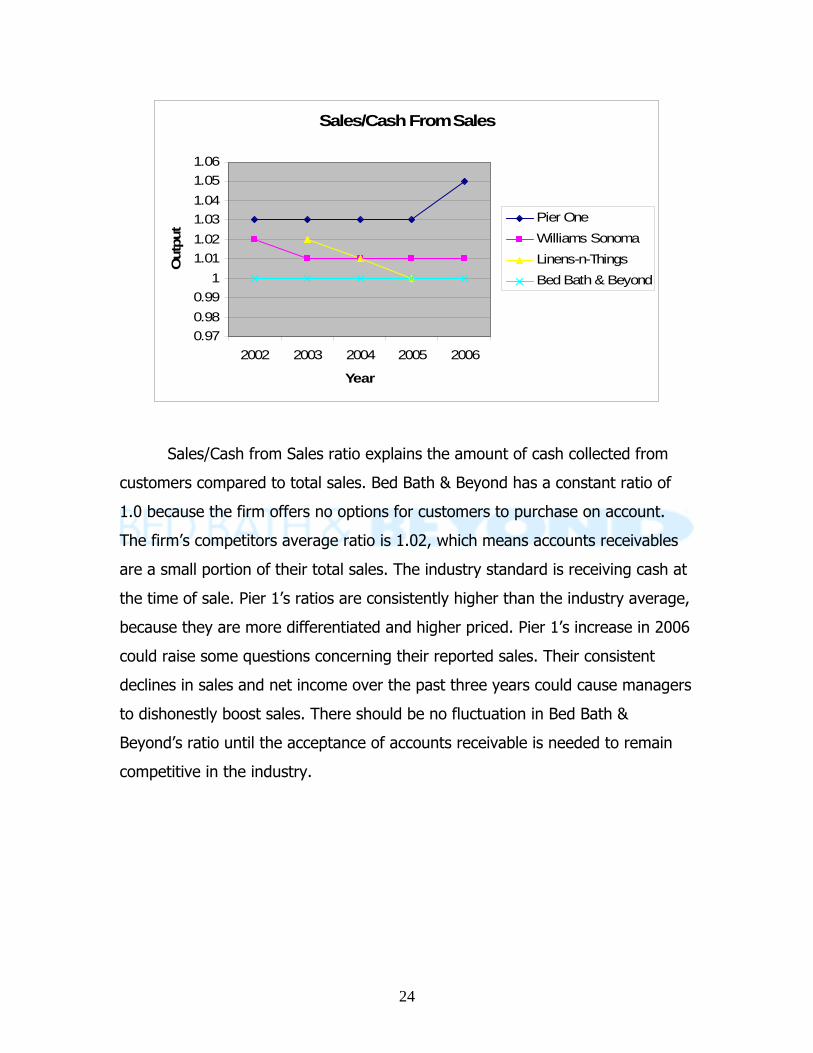
Sales/Cash From Sales
0.970.980.99
11.011.021.031.041.051.06
2002 2003 2004 2005 2006
Year
Out
put
Pier OneWilliams SonomaLinens-n-ThingsBed Bath & Beyond
Sales/Cash from Sales ratio explains the amount of cash collected from
customers compared to total sales. Bed Bath & Beyond has a constant ratio of
1.0 because the firm offers no options for customers to purchase on account.
The firm’s competitors average ratio is 1.02, which means accounts receivables
are a small portion of their total sales. The industry standard is receiving cash at
the time of sale. Pier 1’s ratios are consistently higher than the industry average,
because they are more differentiated and higher priced. Pier 1’s increase in 2006
could raise some questions concerning their reported sales. Their consistent
declines in sales and net income over the past three years could cause managers
to dishonestly boost sales. There should be no fluctuation in Bed Bath &
Beyond’s ratio until the acceptance of accounts receivable is needed to remain
competitive in the industry.
25
Sales/Net Accounts Receivables
0
20
40
60
80
100
120
2002 2003 2004 2005 2006Year
Out
put
Pier OneWilliams SonomaLinens-n-ThingsBed Bath & Beyond
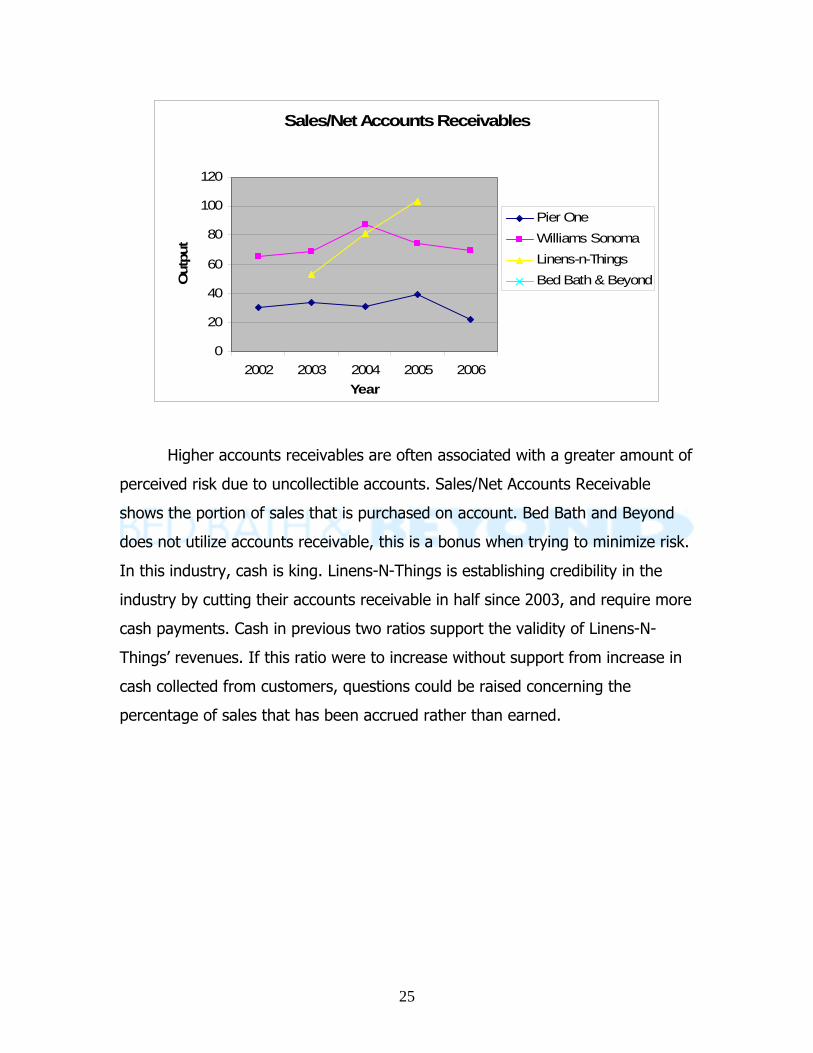
Higher accounts receivables are often associated with a greater amount of
perceived risk due to uncollectible accounts. Sales/Net Accounts Receivable
shows the portion of sales that is purchased on account. Bed Bath and Beyond
does not utilize accounts receivable, this is a bonus when trying to minimize risk.
In this industry, cash is king. Linens-N-Things is establishing credibility in the
industry by cutting their accounts receivable in half since 2003, and require more
cash payments. Cash in previous two ratios support the validity of Linens-N-
Things’ revenues. If this ratio were to increase without support from increase in
cash collected from customers, questions could be raised concerning the
percentage of sales that has been accrued rather than earned.
26
Sales/Inventory
0123456789
2002 2003 2004 2005 2006
Year
Out
put
Pier OneWilliams SonomaLinens-n-ThingsBed Bath & Beyond
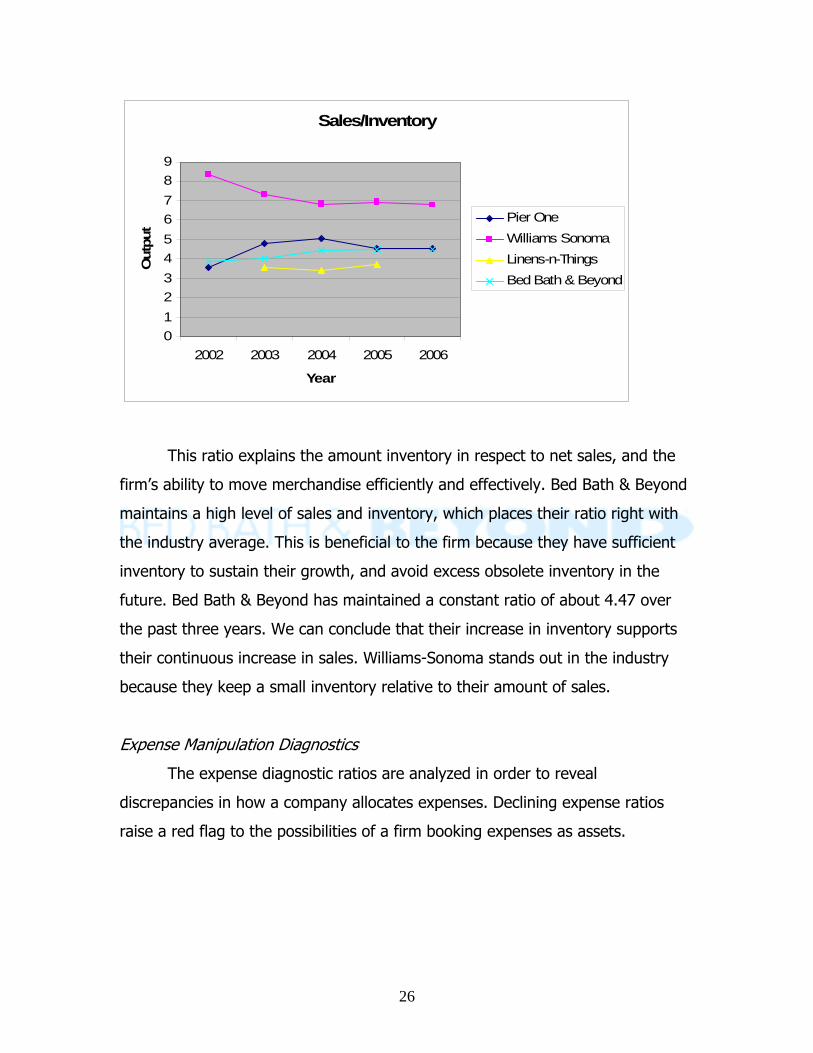
This ratio explains the amount inventory in respect to net sales, and the
firm’s ability to move merchandise efficiently and effectively. Bed Bath & Beyond
maintains a high level of sales and inventory, which places their ratio right with
the industry average. This is beneficial to the firm because they have sufficient
inventory to sustain their growth, and avoid excess obsolete inventory in the
future. Bed Bath & Beyond has maintained a constant ratio of about 4.47 over
the past three years. We can conclude that their increase in inventory supports
their continuous increase in sales. Williams-Sonoma stands out in the industry
because they keep a small inventory relative to their amount of sales.
Expense Manipulation Diagnostics
The expense diagnostic ratios are analyzed in order to reveal
discrepancies in how a company allocates expenses. Declining expense ratios
raise a red flag to the possibilities of a firm booking expenses as assets.
27
Sales/Assets
0
0.5
1
1.5
2
2.5
2002 2003 2004 2005 2006
Year
Out
put
Pier OneWilliams SonomaLinens-n-ThingsBed Bath & Beyond
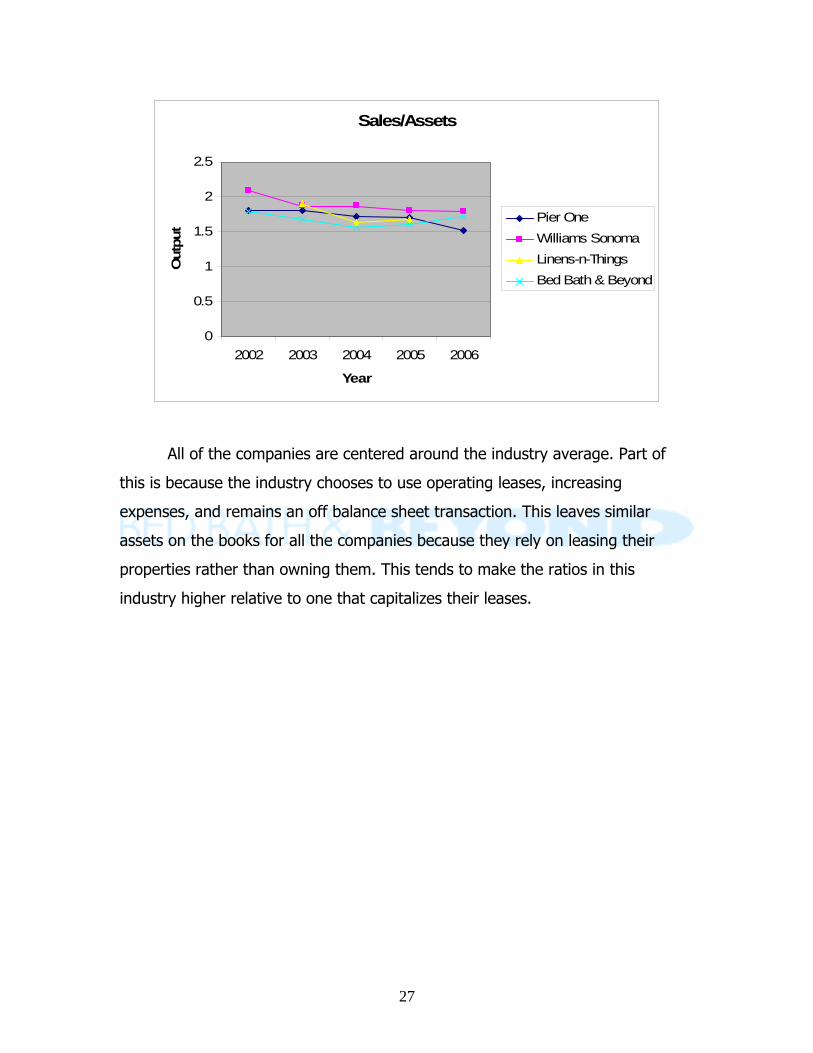
All of the companies are centered around the industry average. Part of
this is because the industry chooses to use operating leases, increasing
expenses, and remains an off balance sheet transaction. This leaves similar
assets on the books for all the companies because they rely on leasing their
properties rather than owning them. This tends to make the ratios in this
industry higher relative to one that capitalizes their leases.
28
CFFO/OI
00.20.40.60.8
11.21.41.61.8
2
2002 2003 2004 2005 2006
Year
Out
put
Pier OneWilliams SonomaLinens-n-ThingsBed Bath & Beyond
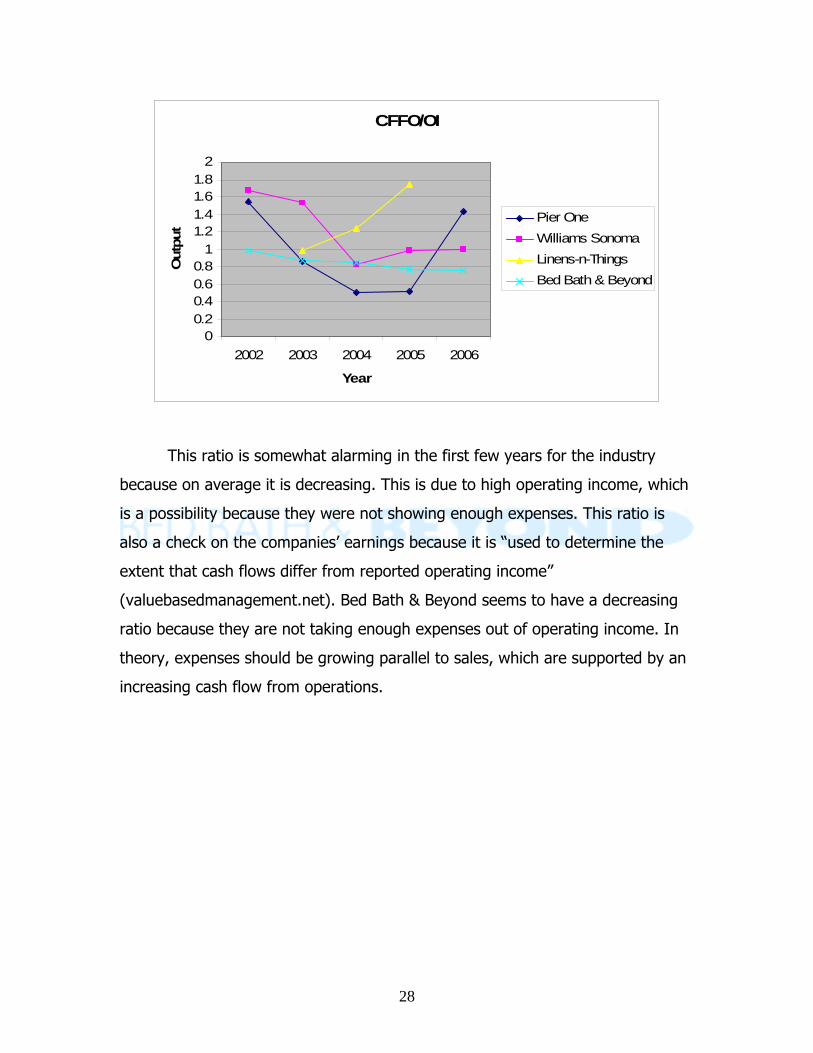
This ratio is somewhat alarming in the first few years for the industry
because on average it is decreasing. This is due to high operating income, which
is a possibility because they were not showing enough expenses. This ratio is
also a check on the companies’ earnings because it is “used to determine the
extent that cash flows differ from reported operating income”
(valuebasedmanagement.net). Bed Bath & Beyond seems to have a decreasing
ratio because they are not taking enough expenses out of operating income. In
theory, expenses should be growing parallel to sales, which are supported by an
increasing cash flow from operations.
29
CFFO/NOA
-0.1-0.05
00.050.1
0.150.2
0.250.3
0.350.4
0.45
2002 2003 2004 2005 2006
Year
Out
put
Pier OneWilliams SonomaLinens-n-ThingsBed Bath & Beyond
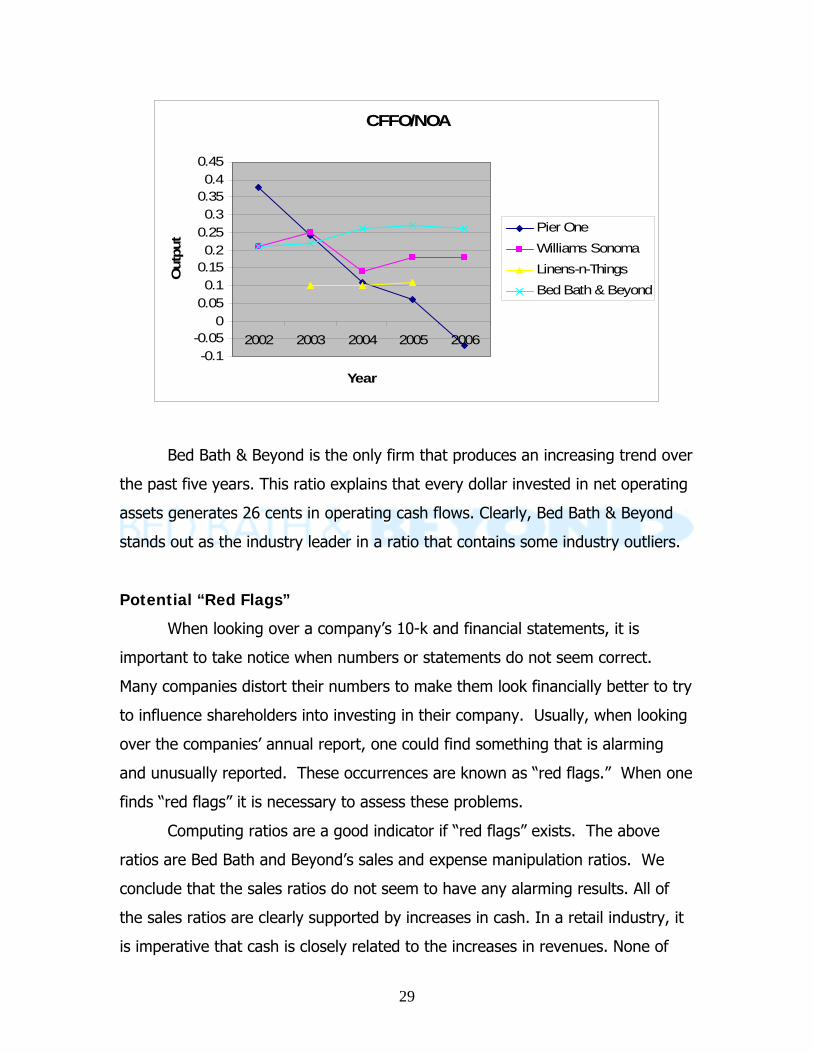
Bed Bath & Beyond is the only firm that produces an increasing trend over
the past five years. This ratio explains that every dollar invested in net operating
assets generates 26 cents in operating cash flows. Clearly, Bed Bath & Beyond
stands out as the industry leader in a ratio that contains some industry outliers.
Potential “Red Flags”
When looking over a company’s 10-k and financial statements, it is
important to take notice when numbers or statements do not seem correct.
Many companies distort their numbers to make them look financially better to try
to influence shareholders into investing in their company. Usually, when looking
over the companies’ annual report, one could find something that is alarming
and unusually reported. These occurrences are known as “red flags.” When one
finds “red flags” it is necessary to assess these problems.
Computing ratios are a good indicator if “red flags” exists. The above
ratios are Bed Bath and Beyond’s sales and expense manipulation ratios. We
conclude that the sales ratios do not seem to have any alarming results. All of
the sales ratios are clearly supported by increases in cash. In a retail industry, it
is imperative that cash is closely related to the increases in revenues. None of
30
the expense ratios seem to be decreasing in value with the exception of
CFFO/OI. This could raise concerns that expenses are not being recorded
accurately or correctly allocated with the growing revenues.
Another area for concern with the corporation’s accounting strategy is
their strict use of operating leases. At the end of 2005 Bed Bath & Beyond had a
total of around $3.1 billion dollars in current and future obligations, all of which
registered under operating lease agreements. According to their 10-k, offices,
warehouses, manufacturing facilities, and equipment are all capital items that are
being expensed as a part of an operating lease rather than being capitalized and
recorded in the corporation’s financial statements.
Undo Accounting Distortions
As mentioned in the accounting flexibility section as well as the red flags
section, Bed Bath & Beyond chose not use any capital leases. For comparison
purposes, we converted their operating leases over to capital leases, and
discounted the payments by 8% to find the present value. After discounting the
payments, we concluded that Bed Bath & Beyond should add about $2.13 billion
dollars to their value of long term liabilities, increasing the value from $1.12
billion to approximately $3 billion. Therefore, the current values of long term
liabilities are extremely understated. The financial statements reflecting this
increase in liabilities are included in the forecasting section that follows.
31
Ratio Analysis & Forecast Financials
Ratio Analysis
Profitability and growth are two key components in the valuation of a firm.
Ratio analysis offers a measure of financial performance and efficiency
management for a firm. After the ratios are reviewed, they can be utilized in
forecasting the financial statements. The critical analysis of these two measures
can help us better understand historically where the firm has been, and where
speculated trends will lead the firm in the future. Financial ratio analysis can be
categorized into liquidity, profitability, and capital structure analysis. The
relationships explained in the analysis of the financial statements will compare
Bed Bath & Beyond’s position to competitors in the home furnishing industry, as
well as, the firm’s past performance.
Trend and Cross Sectional Analysis
Once the ratios have been computed for the past five years, their results
are analyzed for any emerging trends. The trends are then used to logically
forecast various aspects of the firm’s financial statements. Since trends are
speculated, the firm’s future performance will be subject to the one that defines
the trends. A cross-sectional analysis is one that “facilitates examining the
relative performance of a firm within its industry, holding industry-level factors
constant” (Palepu 5-1). Bed Bath & Beyond’s performance will be compared to
other competitors in the industry to observe how established the firm is in the
industry.
Liquidity Ratios
Liquidity Ratios provide valuable insight on Bed Bath & Beyond’s ability to
meet its short-term liabilities. The ratios used in this analysis are the current
ratio, quick asset ratio, inventory turnover, and working capital turnover. Bed
Bath & Beyond does not have any accounts receivables, so the accounts
32
Current Ratio
0
0.5
1
1.5
2
2.5
3
3.5
2002 2003 2004 2005 2006
Year
Oup
ut
BBBYWSMLNTPIRIndustry
receivable turnover ratio must be omitted from the analysis. The current ratio
and quick asset ratio will explain if the firm needed to liquidate, would its current
assets cover the current liabilities in a timely manner. The other ratios will
explain the efficiency in sustaining comfortable levels of liquidity.
Liquidity Analysis
2002 2003 2004 2005 2006Current Ratio 2.40 2.34 2.56 2.40 2.04Quick Asset Ratio 0.84 0.91 1.13 0.97 0.66Inventory Turnover 2.28 2.34 2.57 2.57 2.55Days Supply Inventory 159.97 155.68 142.00 141.99 142.95Working Capital Turnover 4.09 3.75 3.73 4.21 5.65
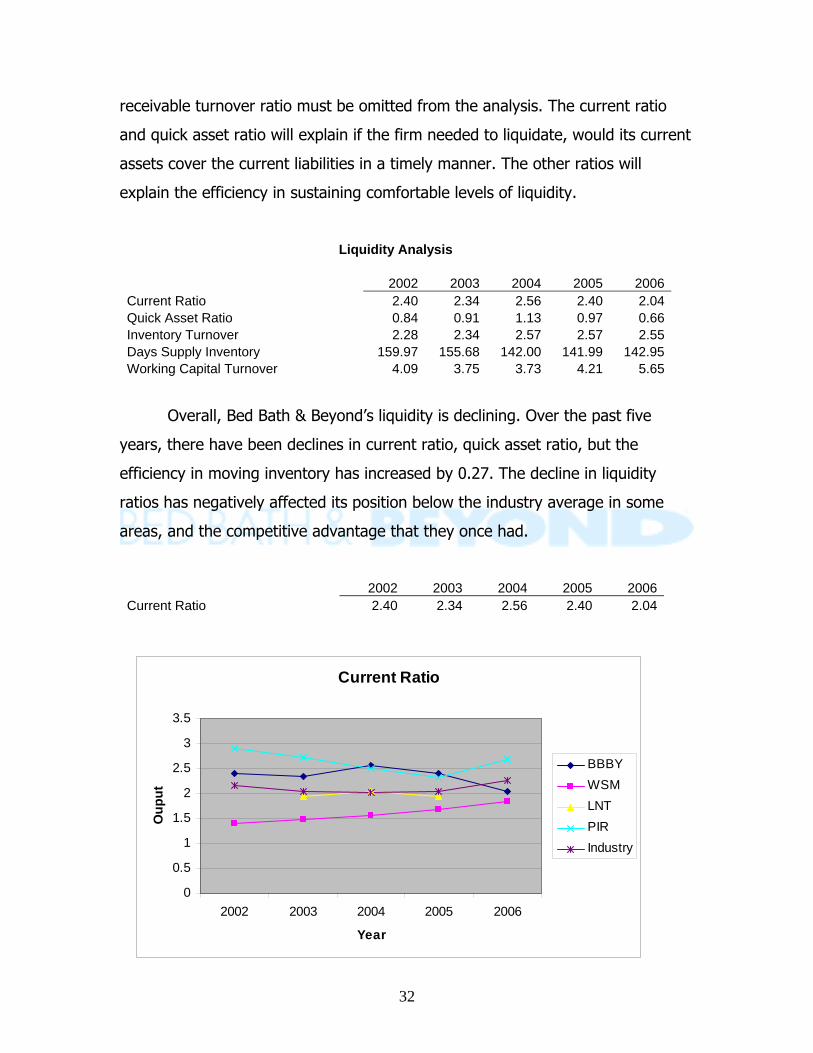
Overall, Bed Bath & Beyond’s liquidity is declining. Over the past five
years, there have been declines in current ratio, quick asset ratio, but the
efficiency in moving inventory has increased by 0.27. The decline in liquidity
ratios has negatively affected its position below the industry average in some
areas, and the competitive advantage that they once had.
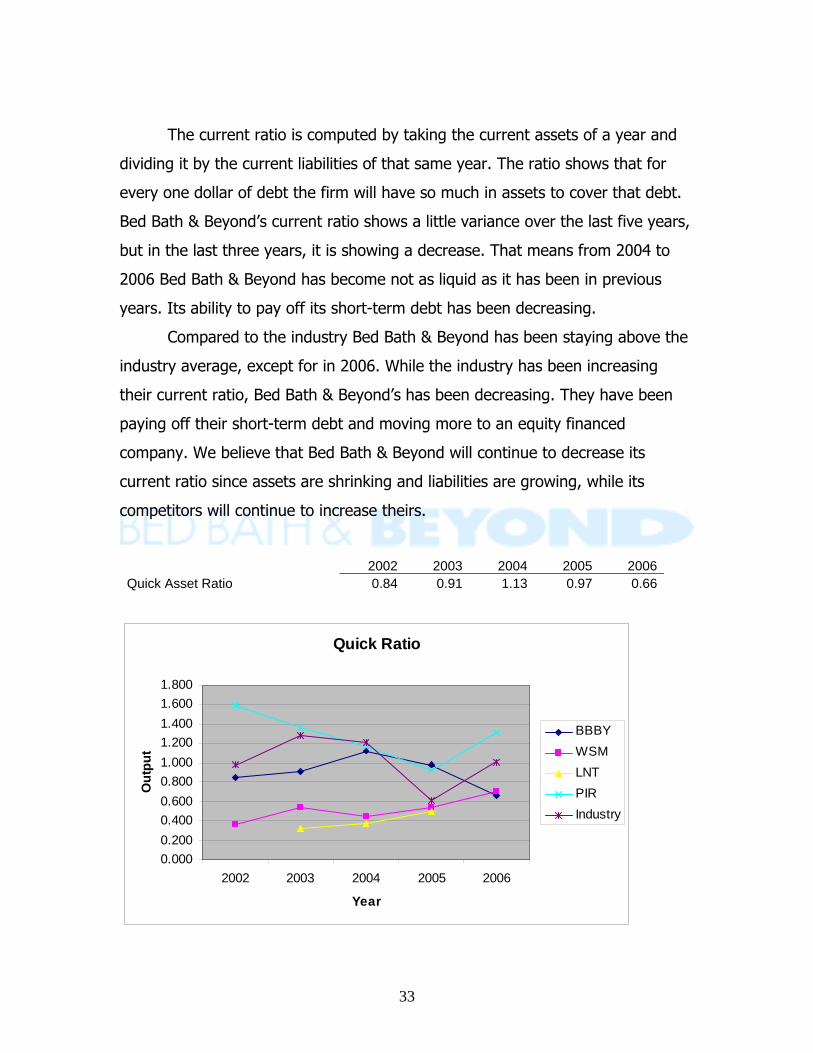
2002 2003 2004 2005 2006Current Ratio 2.40 2.34 2.56 2.40 2.04
33
The current ratio is computed by taking the current assets of a year and
dividing it by the current liabilities of that same year. The ratio shows that for
every one dollar of debt the firm will have so much in assets to cover that debt.
Bed Bath & Beyond’s current ratio shows a little variance over the last five years,
but in the last three years, it is showing a decrease. That means from 2004 to
2006 Bed Bath & Beyond has become not as liquid as it has been in previous
years. Its ability to pay off its short-term debt has been decreasing.
Compared to the industry Bed Bath & Beyond has been staying above the
industry average, except for in 2006. While the industry has been increasing
their current ratio, Bed Bath & Beyond’s has been decreasing. They have been
paying off their short-term debt and moving more to an equity financed
company. We believe that Bed Bath & Beyond will continue to decrease its
current ratio since assets are shrinking and liabilities are growing, while its
competitors will continue to increase theirs.
2002 2003 2004 2005 2006Quick Asset Ratio 0.84 0.91 1.13 0.97 0.66
Quick Ratio
0.0000.2000.4000.6000.8001.0001.2001.4001.6001.800
2002 2003 2004 2005 2006
Year
Out
put
BBBYWSMLNTPIRIndustry
34
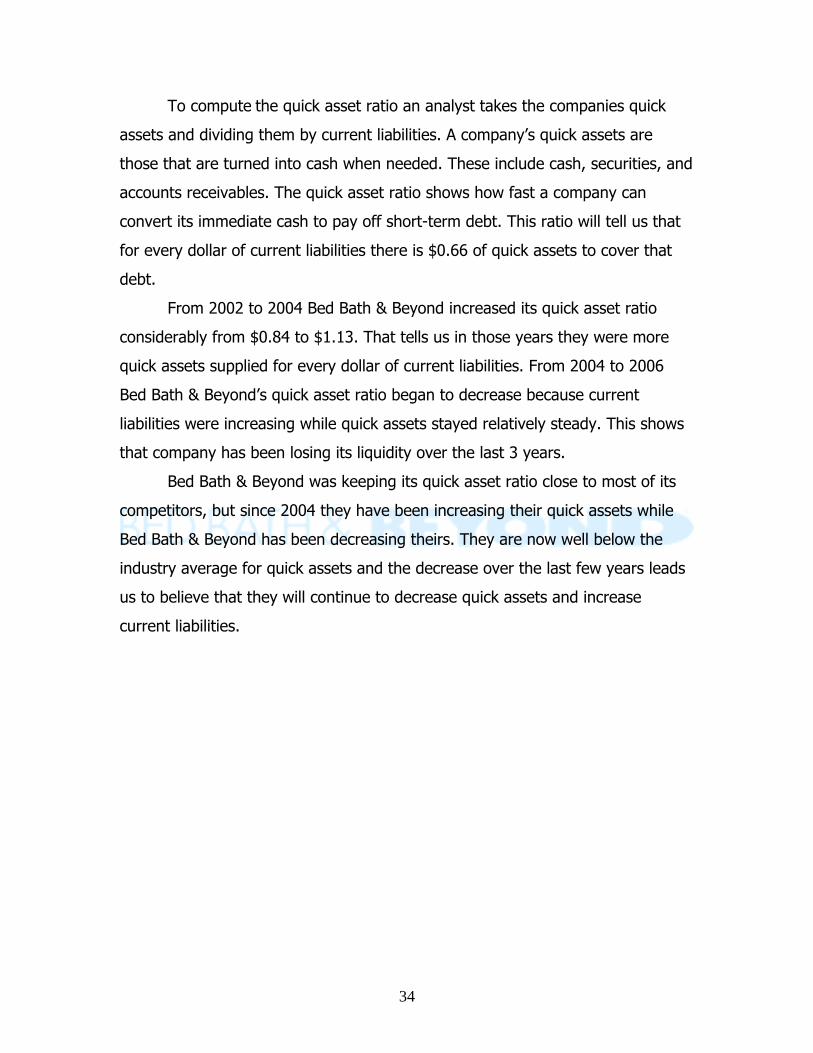
To compute the quick asset ratio an analyst takes the companies quick
assets and dividing them by current liabilities. A company’s quick assets are
those that are turned into cash when needed. These include cash, securities, and
accounts receivables. The quick asset ratio shows how fast a company can
convert its immediate cash to pay off short-term debt. This ratio will tell us that
for every dollar of current liabilities there is $0.66 of quick assets to cover that
debt.
From 2002 to 2004 Bed Bath & Beyond increased its quick asset ratio
considerably from $0.84 to $1.13. That tells us in those years they were more
quick assets supplied for every dollar of current liabilities. From 2004 to 2006
Bed Bath & Beyond’s quick asset ratio began to decrease because current
liabilities were increasing while quick assets stayed relatively steady. This shows
that company has been losing its liquidity over the last 3 years.
Bed Bath & Beyond was keeping its quick asset ratio close to most of its
competitors, but since 2004 they have been increasing their quick assets while
Bed Bath & Beyond has been decreasing theirs. They are now well below the
industry average for quick assets and the decrease over the last few years leads
us to believe that they will continue to decrease quick assets and increase
current liabilities.
35
2002 2003 2004 2005 2006Inventory Turnover 2.28 2.34 2.57 2.57 2.55Days Supply Inventory 159.97 155.68 142.00 141.99 142.95
Inventory Turnover
0.000
1.000
2.000
3.000
4.000
5.000
6.000
2002 2003 2004 2005 2006
Year
Out
put
BBBYWSMLNTPIRIndustry
Inventory turnover is calculated by taking the firm’s cost of goods sold
and dividing them by their current inventory supply. A firm in this industry would
like this number to be relatively high. A higher inventory turnover means that the
firm gets more inventories out of the store or warehouse to make room for new
inventory.
Bed Bath & Beyond’s inventory increased from 2.28 in 2002 to 2.57 in
2004. In 2005, the inventory turnover stayed the same and in 2006, it shows a
slight decrease. In the last three years, the inventory turnover has not moved
very much, which shows that as they increase their inventory supply their cost of
goods sold are increasing as well. It seems as though the overall trend is that
inventory turnover is increasing and that is good for Bed Bath & Beyond. As long
as this number grows, Bed Bath & Beyond will be able to get rid of more
inventory to make room for newer goods.
Day’s supply of inventory is computed by taking the number of days in the
year and dividing it by the inventory turnover ratio. This will tell you how many
36
days it takes a firm to sell its inventory. Bed Bath & Beyond has been decreasing
their days supply of inventory which is favorable to them. They are keeping
products on the shelves fewer days each year. From 2002 to 2006, they have
dropped their supply of inventory by more than Two weeks. That tells us
consumers are buying more of their products every year, which makes space for
newer inventory to be kept on hand.
Compared to the industry average Bed Bath & Beyond has been keeping a
slow pace with the rest of their competitors. That shows that they are moving
with the industry. While many of its competitors are increasing their days supply
of inventory Bed Bath & Beyond is not. Many of its competitors are keeping
products on hand a few days longer each year compared to their last year, while
Bed Bath & Beyond has been decreasing theirs at a slow pace. We believe that
this shows Bed Bath & Beyond has favorable improvements over its competitors
when it comes to inventory supply.
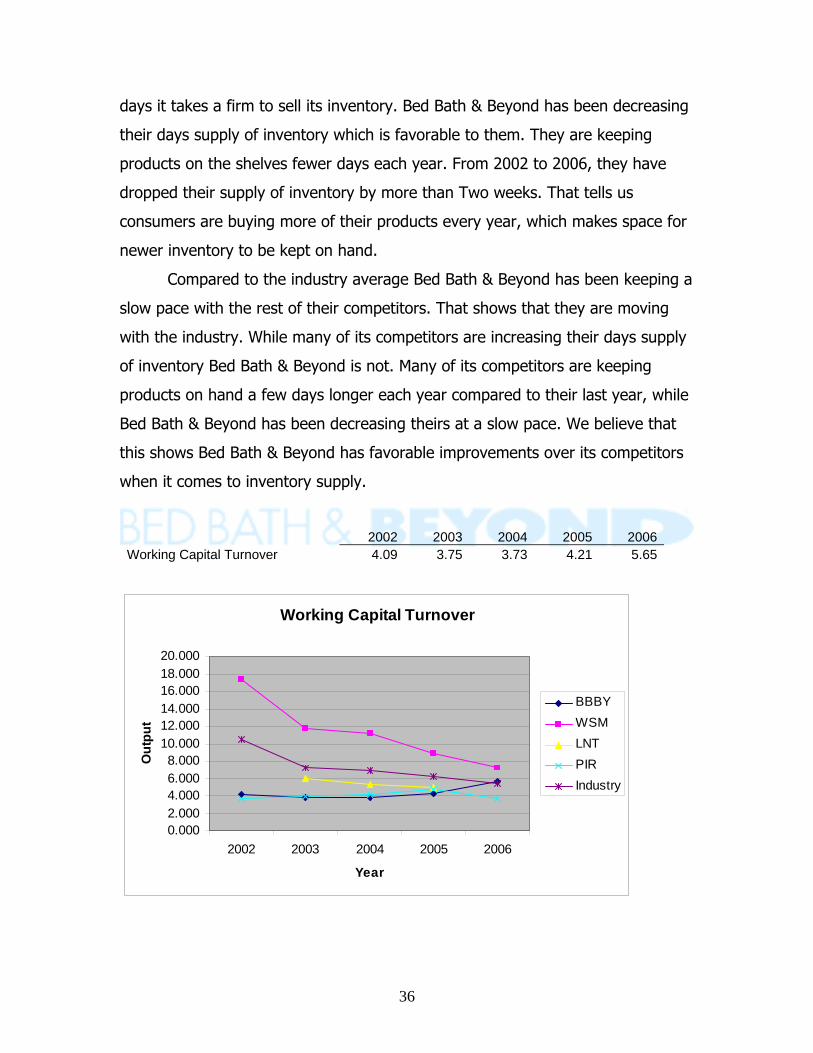
2002 2003 2004 2005 2006Working Capital Turnover 4.09 3.75 3.73 4.21 5.65
Working Capital Turnover
0.0002.0004.0006.0008.000
10.00012.00014.00016.00018.00020.000
2002 2003 2004 2005 2006
Year
Out
put
BBBYWSMLNTPIRIndustry
37
Computing working capital turnover is done by taking the company’s sales
and dividing it by its working capital. Working capital is current assets minus
current liabilities. This ratio shows how a firm uses its working capital to
generate sales. Companies want high working capital turnover because that
means their sales are increasing.
From 2002 to 2005, Bed Bath & Beyond’s working capital turnover stayed
relatively constant with not much movement, but in 2006, it jumped almost 1.5
points. That tells us that sales in 2006 increased while working capital decreased.
The industry has been showing a decline in working capital while Bed Bath
& Beyond has started to show an increase. Even though Bed Bath & Beyond has
been increasing they are only at the industry average and not above all of their
competitors.
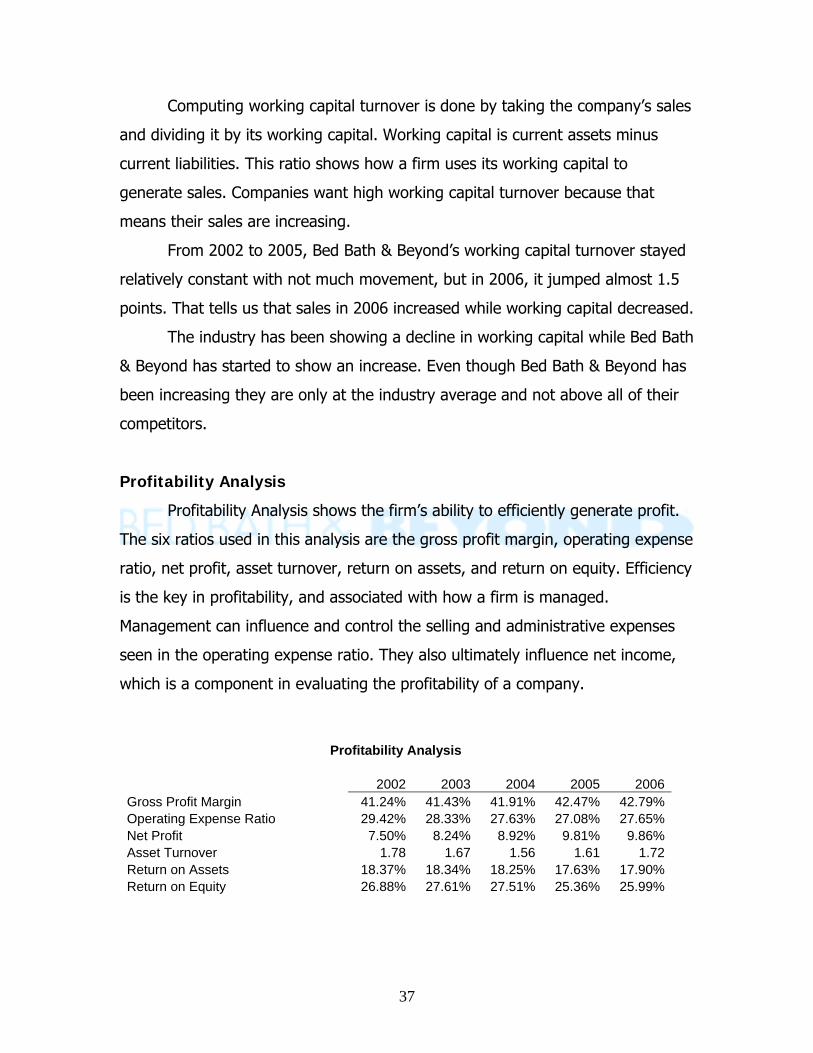
Profitability Analysis
Profitability Analysis shows the firm’s ability to efficiently generate profit.
The six ratios used in this analysis are the gross profit margin, operating expense
ratio, net profit, asset turnover, return on assets, and return on equity. Efficiency
is the key in profitability, and associated with how a firm is managed.
Management can influence and control the selling and administrative expenses
seen in the operating expense ratio. They also ultimately influence net income,
which is a component in evaluating the profitability of a company.
Profitability Analysis 2002 2003 2004 2005 2006
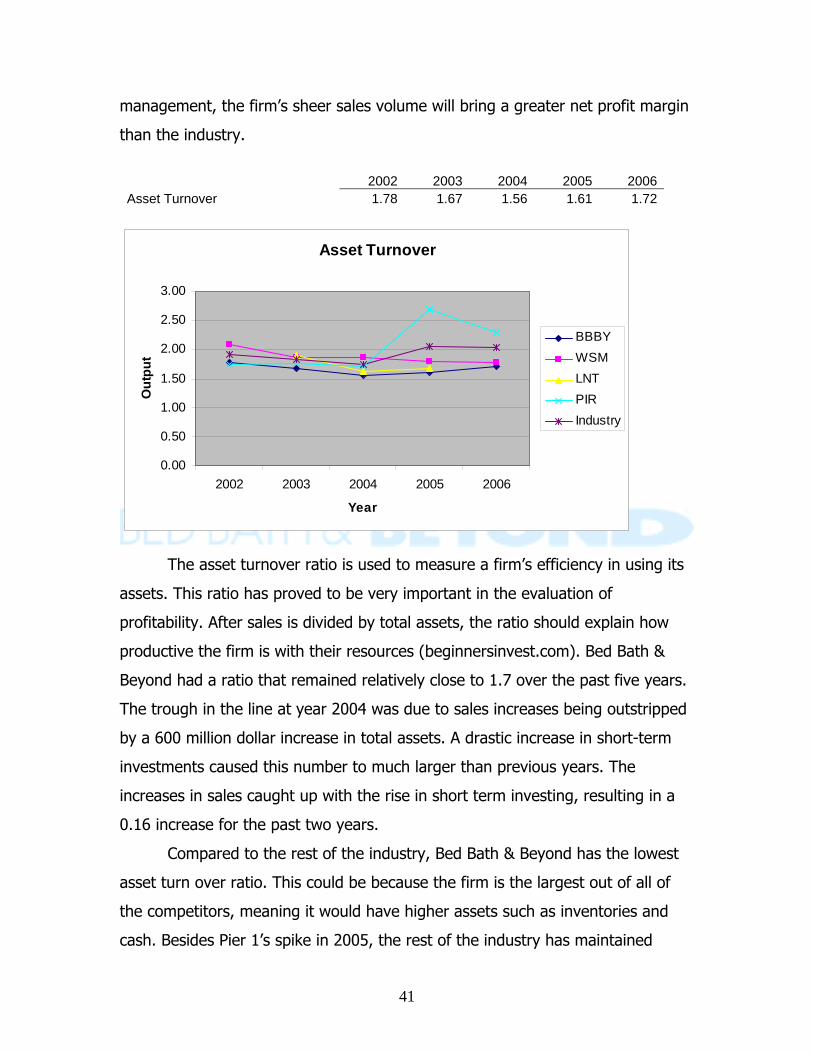
Gross Profit Margin 41.24% 41.43% 41.91% 42.47% 42.79%Operating Expense Ratio 29.42% 28.33% 27.63% 27.08% 27.65%Net Profit 7.50% 8.24% 8.92% 9.81% 9.86%Asset Turnover 1.78 1.67 1.56 1.61 1.72Return on Assets 18.37% 18.34% 18.25% 17.63% 17.90%Return on Equity 26.88% 27.61% 27.51% 25.36% 25.99%
38
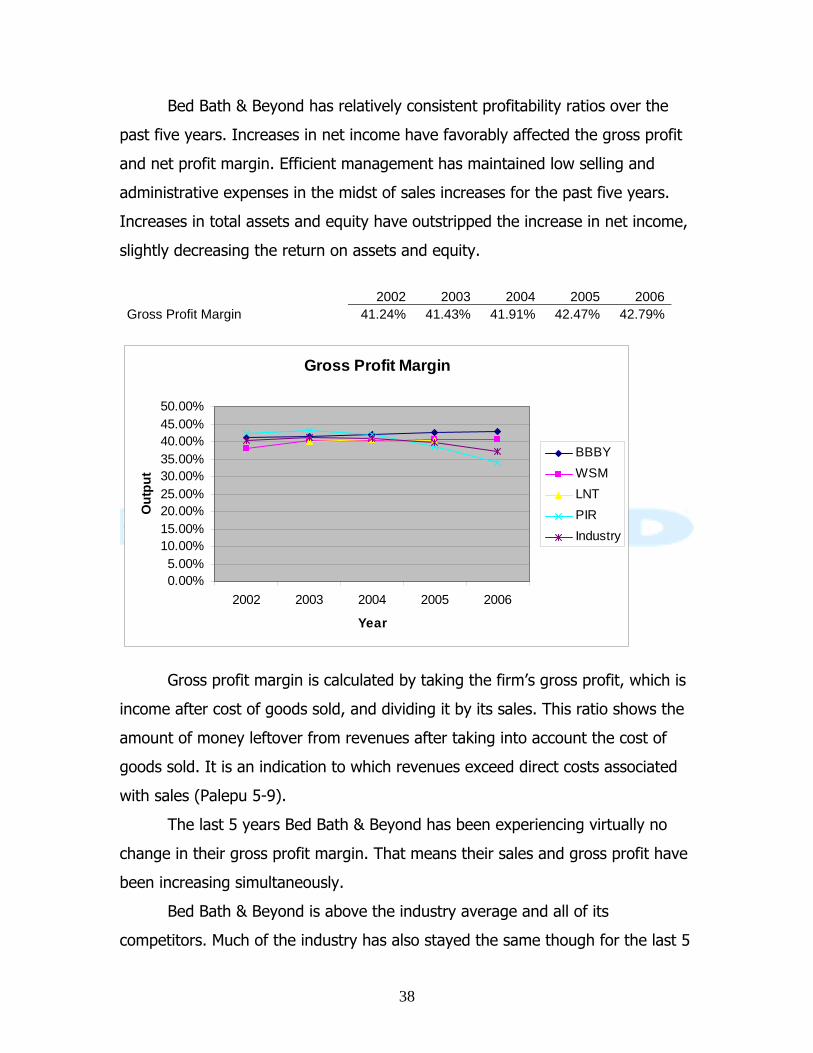
Bed Bath & Beyond has relatively consistent profitability ratios over the
past five years. Increases in net income have favorably affected the gross profit
and net profit margin. Efficient management has maintained low selling and
administrative expenses in the midst of sales increases for the past five years.
Increases in total assets and equity have outstripped the increase in net income,
slightly decreasing the return on assets and equity.
2002 2003 2004 2005 2006
Gross Profit Margin 41.24% 41.43% 41.91% 42.47% 42.79%
Gross Profit Margin
0.00%5.00%
10.00%15.00%20.00%25.00%30.00%35.00%40.00%45.00%50.00%
2002 2003 2004 2005 2006
Year
Out
put
BBBYWSMLNTPIRIndustry
Gross profit margin is calculated by taking the firm’s gross profit, which is
income after cost of goods sold, and dividing it by its sales. This ratio shows the
amount of money leftover from revenues after taking into account the cost of
goods sold. It is an indication to which revenues exceed direct costs associated
with sales (Palepu 5-9).
The last 5 years Bed Bath & Beyond has been experiencing virtually no
change in their gross profit margin. That means their sales and gross profit have
been increasing simultaneously.
Bed Bath & Beyond is above the industry average and all of its
competitors. Much of the industry has also stayed the same though for the last 5
39
years as well. Many of the competitors are experiencing the same growth in
sales and gross profit as Bed Bath & Beyond.
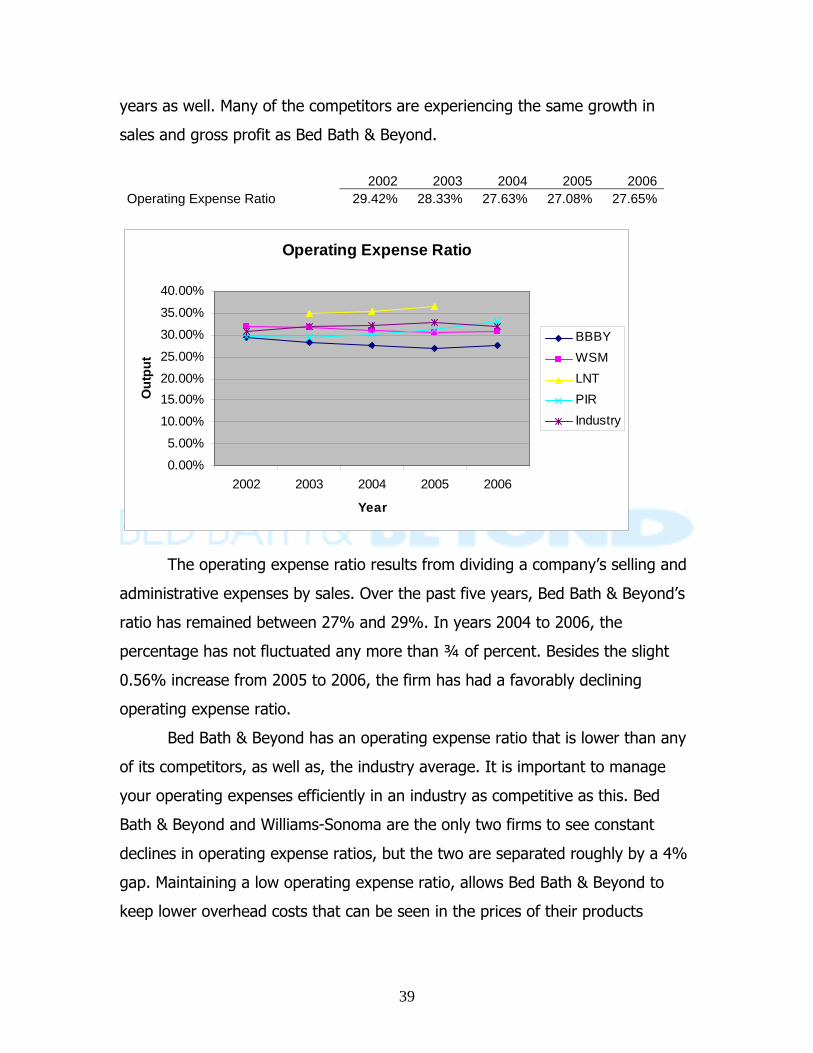
2002 2003 2004 2005 2006
Operating Expense Ratio 29.42% 28.33% 27.63% 27.08% 27.65%
Operating Expense Ratio
0.00%
5.00%
10.00%
15.00%20.00%
25.00%
30.00%
35.00%
40.00%
2002 2003 2004 2005 2006
Year
Out
put
BBBYWSMLNTPIRIndustry
The operating expense ratio results from dividing a company’s selling and
administrative expenses by sales. Over the past five years, Bed Bath & Beyond’s
ratio has remained between 27% and 29%. In years 2004 to 2006, the
percentage has not fluctuated any more than ¾ of percent. Besides the slight
0.56% increase from 2005 to 2006, the firm has had a favorably declining
operating expense ratio.
Bed Bath & Beyond has an operating expense ratio that is lower than any
of its competitors, as well as, the industry average. It is important to manage
your operating expenses efficiently in an industry as competitive as this. Bed
Bath & Beyond and Williams-Sonoma are the only two firms to see constant
declines in operating expense ratios, but the two are separated roughly by a 4%
gap. Maintaining a low operating expense ratio, allows Bed Bath & Beyond to
keep lower overhead costs that can be seen in the prices of their products
40
relative to the industry. The firm possesses the ability to increase sales without
seeing a drastic change in selling and administrative expenses.
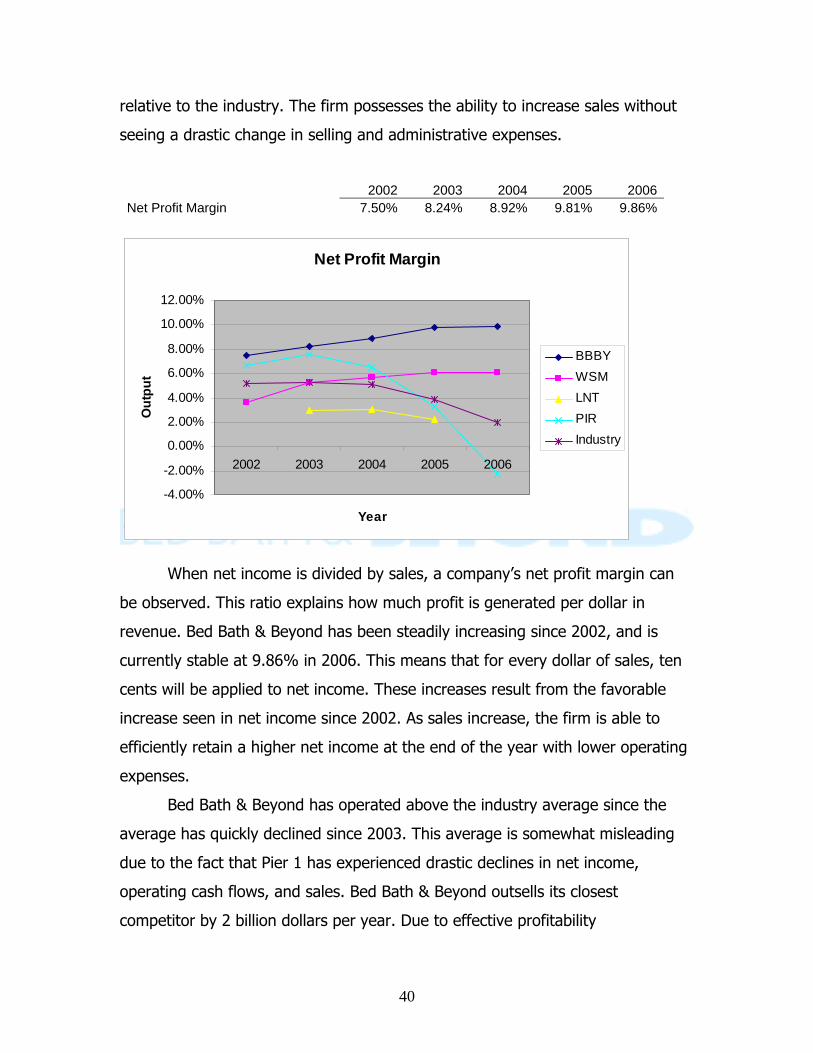
2002 2003 2004 2005 2006Net Profit Margin 7.50% 8.24% 8.92% 9.81% 9.86%
Net Profit Margin
-4.00%
-2.00%
0.00%
2.00%
4.00%
6.00%
8.00%
10.00%
12.00%
2002 2003 2004 2005 2006
Year
Out
put
BBBYWSMLNTPIRIndustry
When net income is divided by sales, a company’s net profit margin can
be observed. This ratio explains how much profit is generated per dollar in
revenue. Bed Bath & Beyond has been steadily increasing since 2002, and is
currently stable at 9.86% in 2006. This means that for every dollar of sales, ten
cents will be applied to net income. These increases result from the favorable
increase seen in net income since 2002. As sales increase, the firm is able to
efficiently retain a higher net income at the end of the year with lower operating
expenses.
Bed Bath & Beyond has operated above the industry average since the
average has quickly declined since 2003. This average is somewhat misleading
due to the fact that Pier 1 has experienced drastic declines in net income,
operating cash flows, and sales. Bed Bath & Beyond outsells its closest
competitor by 2 billion dollars per year. Due to effective profitability
41
management, the firm’s sheer sales volume will bring a greater net profit margin
than the industry.
2002 2003 2004 2005 2006
Asset Turnover 1.78 1.67 1.56 1.61 1.72
Asset Turnover
0.00
0.50
1.00
1.50
2.00
2.50
3.00
2002 2003 2004 2005 2006
Year
Out
put
BBBYWSMLNTPIRIndustry
The asset turnover ratio is used to measure a firm’s efficiency in using its
assets. This ratio has proved to be very important in the evaluation of
profitability. After sales is divided by total assets, the ratio should explain how
productive the firm is with their resources (beginnersinvest.com). Bed Bath &
Beyond had a ratio that remained relatively close to 1.7 over the past five years.
The trough in the line at year 2004 was due to sales increases being outstripped
by a 600 million dollar increase in total assets. A drastic increase in short-term
investments caused this number to much larger than previous years. The
increases in sales caught up with the rise in short term investing, resulting in a
0.16 increase for the past two years.
Compared to the rest of the industry, Bed Bath & Beyond has the lowest
asset turn over ratio. This could be because the firm is the largest out of all of
the competitors, meaning it would have higher assets such as inventories and
cash. Besides Pier 1’s spike in 2005, the rest of the industry has maintained
42
relatively consistent asset turnover ratios. Williams-Sonoma surpasses Bed Bath
& Beyond, as well as, the rest of the industry because its sales are primarily mail
order. This allows Williams-Sonoma to keep lower inventories on hand,
maintaining high levels of efficiency.
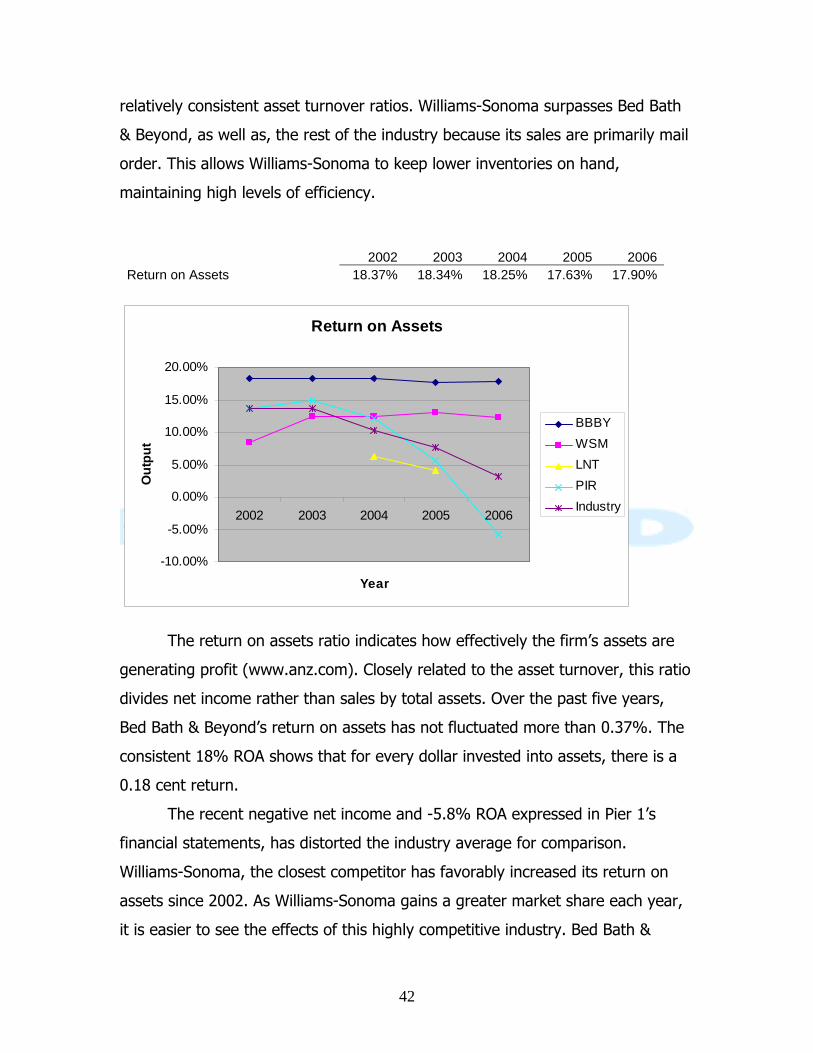
2002 2003 2004 2005 2006Return on Assets 18.37% 18.34% 18.25% 17.63% 17.90%
Return on Assets
-10.00%
-5.00%
0.00%
5.00%
10.00%
15.00%
20.00%
2002 2003 2004 2005 2006
Year
Out
put
BBBYWSMLNTPIRIndustry
The return on assets ratio indicates how effectively the firm’s assets are
generating profit (www.anz.com). Closely related to the asset turnover, this ratio
divides net income rather than sales by total assets. Over the past five years,
Bed Bath & Beyond’s return on assets has not fluctuated more than 0.37%. The
consistent 18% ROA shows that for every dollar invested into assets, there is a
0.18 cent return.
The recent negative net income and -5.8% ROA expressed in Pier 1’s
financial statements, has distorted the industry average for comparison.
Williams-Sonoma, the closest competitor has favorably increased its return on
assets since 2002. As Williams-Sonoma gains a greater market share each year,
it is easier to see the effects of this highly competitive industry. Bed Bath &
43
Beyond displays a slight decline in 2005 of 0.62% followed by a slight increase in
2006. This proves to be inversely related to Williams-Sonoma’s slight increase in
2005, and decrease in 2006. If Bed Bath & Beyond’s sales continue to dominate
the industry, the return on assets have the potential to grow stronger and
experience less fluctuation within the market.
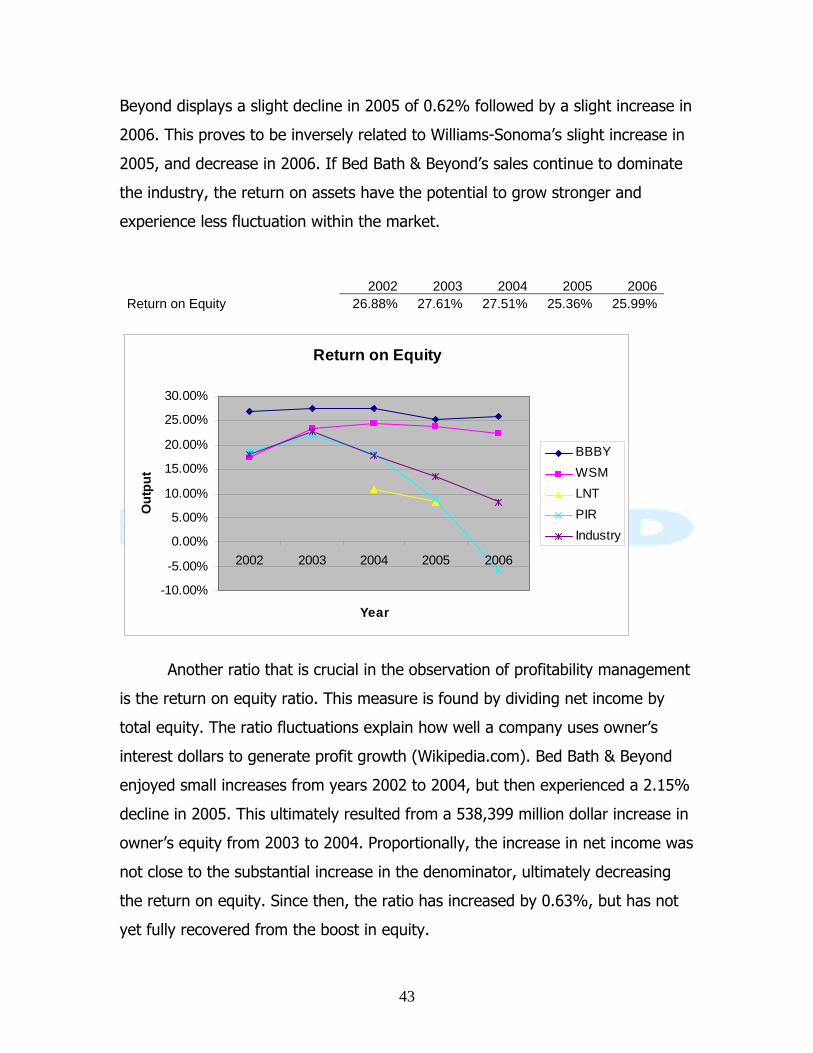
2002 2003 2004 2005 2006Return on Equity 26.88% 27.61% 27.51% 25.36% 25.99%
Return on Equity
-10.00%
-5.00%
0.00%
5.00%
10.00%
15.00%
20.00%
25.00%
30.00%
2002 2003 2004 2005 2006
Year
Out
put
BBBYWSMLNTPIRIndustry
Another ratio that is crucial in the observation of profitability management
is the return on equity ratio. This measure is found by dividing net income by
total equity. The ratio fluctuations explain how well a company uses owner’s
interest dollars to generate profit growth (Wikipedia.com). Bed Bath & Beyond
enjoyed small increases from years 2002 to 2004, but then experienced a 2.15%
decline in 2005. This ultimately resulted from a 538,399 million dollar increase in
owner’s equity from 2003 to 2004. Proportionally, the increase in net income was
not close to the substantial increase in the denominator, ultimately decreasing
the return on equity. Since then, the ratio has increased by 0.63%, but has not
yet fully recovered from the boost in equity.
44
Bed Bath & Beyond has maintained a high return on equity compared to
the industry, yet is closely followed by Williams-Sonoma. Williams-Sonoma had a
49.3 million dollar increase in net income from 2002 to 2003 with no increase in
equity, causing a 6% increase in ROE. Since 2004 their ratios have stabilized and
slightly declined. The industry average includes an extremely volatile Pier 1, and
exaggerates the declines shown by Bed Bath & Beyond and Williams-Sonoma
from 2004-2006.
Capital Structure Analysis
Equity and debt financing’s relationship on the purchase of assets is the
capital structure of a firm (Vann Handout). The three ratios that are normally
included in this analysis could not be utilized since Bed Bath & Beyond does not
have any notes payable or interest expense. Without those two components,
only the debt to equity ratio could be analyzed.
Capital Structure Analysis
2002 2003 2004 2005 2006Debt to Equity 0.49 0.51 0.44 0.45 0.49
Overall, the capital structure of Bed Bath & Beyond has resulted in
practically no change. The ratio from debt to equity is the same in 2006 that it
was in 2002. In the absence of notes payable, liabilities will continue to remain
around half of total equity.
45
Debt-Equity Ratio
0.000
0.200
0.400
0.600
0.800
1.000
1.200
2002 2003 2004 2005 2006
Year
Out
put
BBBYWSMLNTPIRIndustry
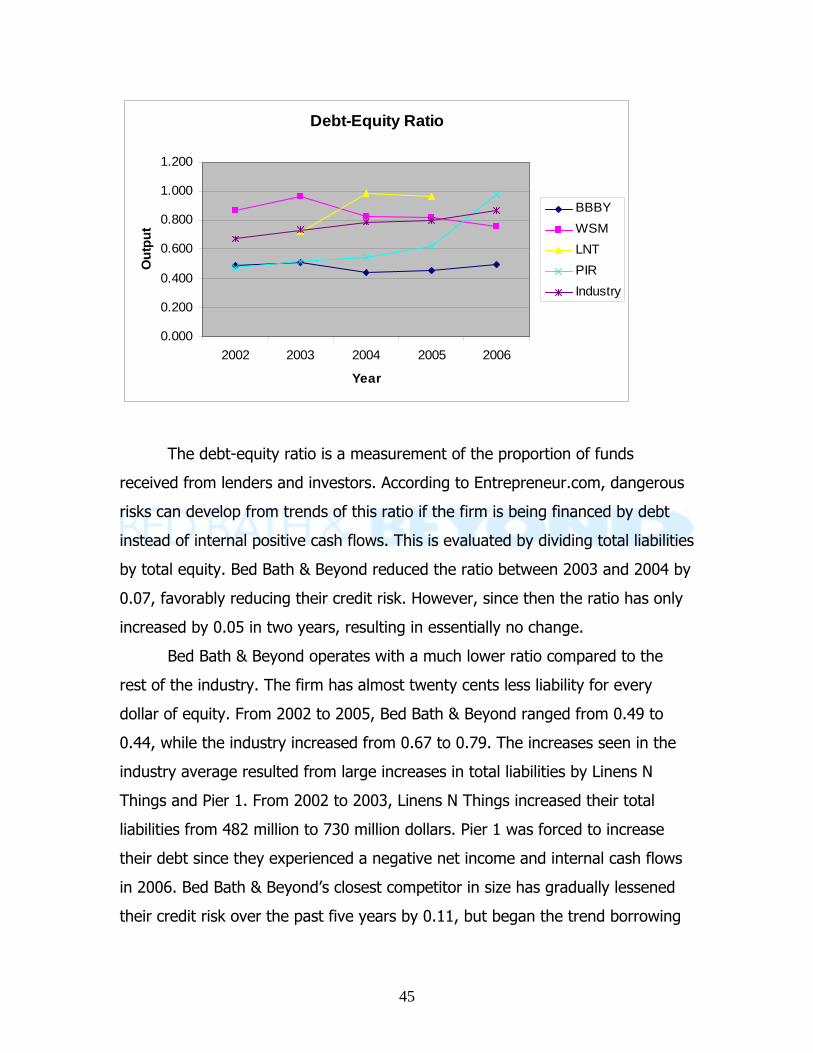
The debt-equity ratio is a measurement of the proportion of funds
received from lenders and investors. According to Entrepreneur.com, dangerous
risks can develop from trends of this ratio if the firm is being financed by debt
instead of internal positive cash flows. This is evaluated by dividing total liabilities
by total equity. Bed Bath & Beyond reduced the ratio between 2003 and 2004 by
0.07, favorably reducing their credit risk. However, since then the ratio has only
increased by 0.05 in two years, resulting in essentially no change.
Bed Bath & Beyond operates with a much lower ratio compared to the
rest of the industry. The firm has almost twenty cents less liability for every
dollar of equity. From 2002 to 2005, Bed Bath & Beyond ranged from 0.49 to
0.44, while the industry increased from 0.67 to 0.79. The increases seen in the
industry average resulted from large increases in total liabilities by Linens N
Things and Pier 1. From 2002 to 2003, Linens N Things increased their total
liabilities from 482 million to 730 million dollars. Pier 1 was forced to increase
their debt since they experienced a negative net income and internal cash flows
in 2006. Bed Bath & Beyond’s closest competitor in size has gradually lessened
their credit risk over the past five years by 0.11, but began the trend borrowing
46
almost 87 cents for every dollar received by investors. Bed Bath & Beyond proves
to have the best financial leverage and credit risk in its industry. Also, the firm’s
consistency over the past five years has proved to look appealing to potential
investors since Bed Bath & Beyond has the greatest amount of equity.
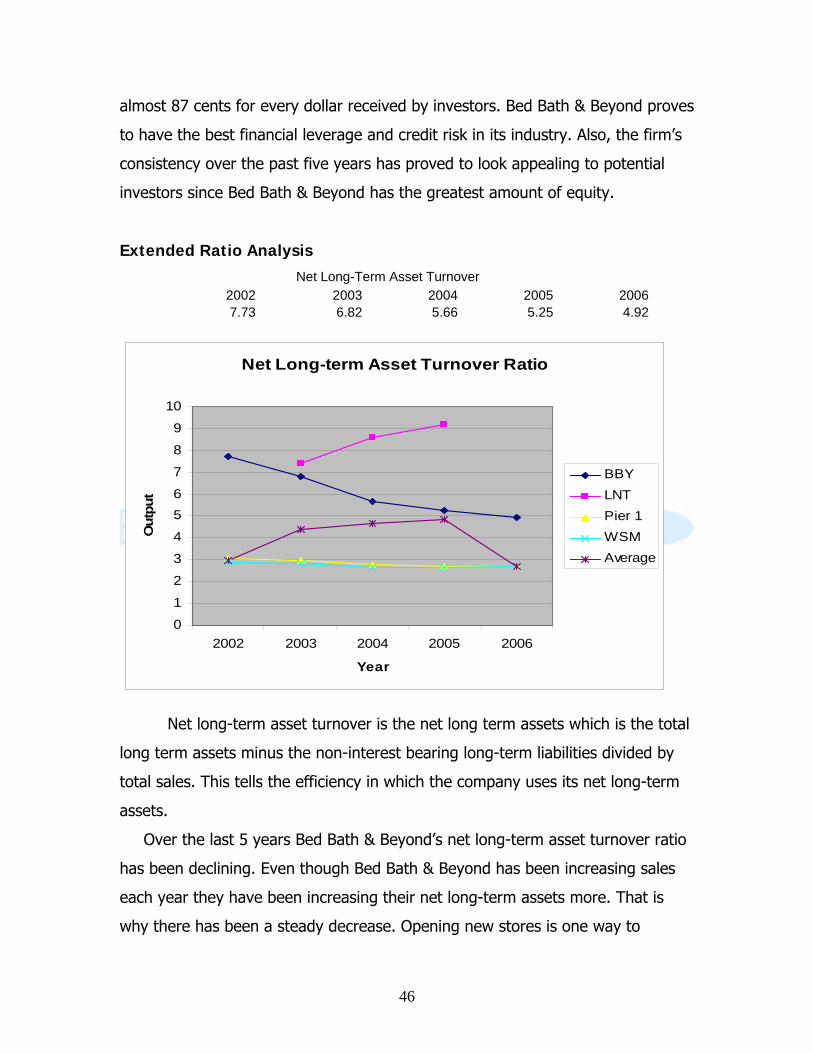
Extended Ratio Analysis Net Long-Term Asset Turnover
2002 2003 2004 2005 2006 7.73 6.82 5.66 5.25 4.92
Net Long-term Asset Turnover Ratio
0
1
2
3
4
56
7
8
9
10
2002 2003 2004 2005 2006
Year
Out
put
BBYLNTPier 1WSMAverage
Net long-term asset turnover is the net long term assets which is the total
long term assets minus the non-interest bearing long-term liabilities divided by
total sales. This tells the efficiency in which the company uses its net long-term
assets.
Over the last 5 years Bed Bath & Beyond’s net long-term asset turnover ratio
has been declining. Even though Bed Bath & Beyond has been increasing sales
each year they have been increasing their net long-term assets more. That is
why there has been a steady decrease. Opening new stores is one way to
47
decrease this ratio. Even though the new store is contributing to sales, it is not
doing enough to increase the net long-term asset ratio.
Compared to the industry Bed Bath & Beyond is doing the opposite. Their
main competitors have been constant or had an increasing net long-term asset
turnover ratio. This is an unfavorable condition for Bed Bath & Beyond since the
higher the ratio the more productive they are at using their net long term assets.
SGR & IGR Analysis
According to Investopedia.com, the internal growth rate explains “how
much a firm can grow without borrowing more money”. Growth is based solely
on the amount of cash flows that are retained by the firm. The return on equity
ratio is then multiplied by one minus the dividend payout ratio to find the
sustainable growth rate. Palpelu states that the SGR, “is the rate at which a firm
can grow while keeping its profitability and financial policies unchanged” (Palepu
5-19). A key component in both of these ratios is dividends. Currently, Bed Bath
& Beyond does not pay out any dividends to their shareholders. In result, the
multiplier in both of these ratios would be one. The internal growth rate would
equal the return on assets, and the sustainable growth rate would equal the
return on equity.
2002 2003 2004 2005 2006 IGR 18.37% 18.34% 18.25% 17.63% 17.90% SGR 26.88% 27.61% 27.51% 25.36% 25.99%
Forecasting
In order to determine the actual value of Bed Bath& Beyond, we began by
forecasting the financial statements ten years into the future. The key to
forecasting Bed Bath & Beyond was to examine current and expected
characteristics of the firm, as well as industry factors such as growth.
48
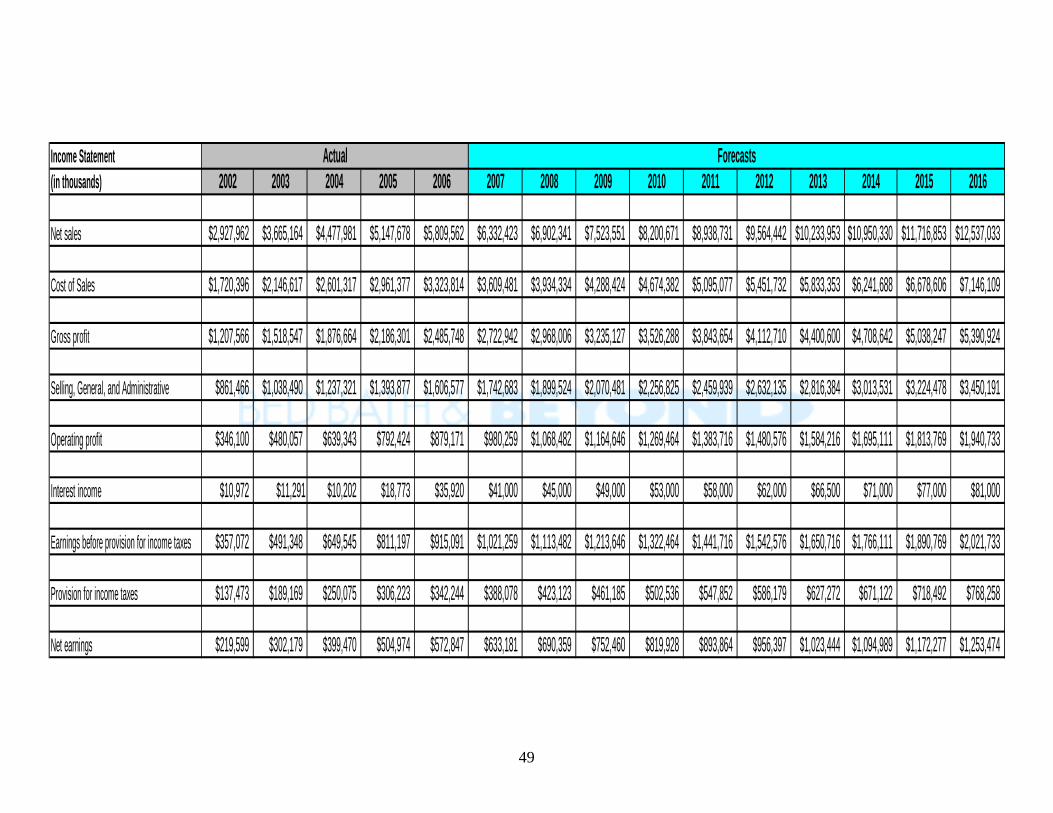
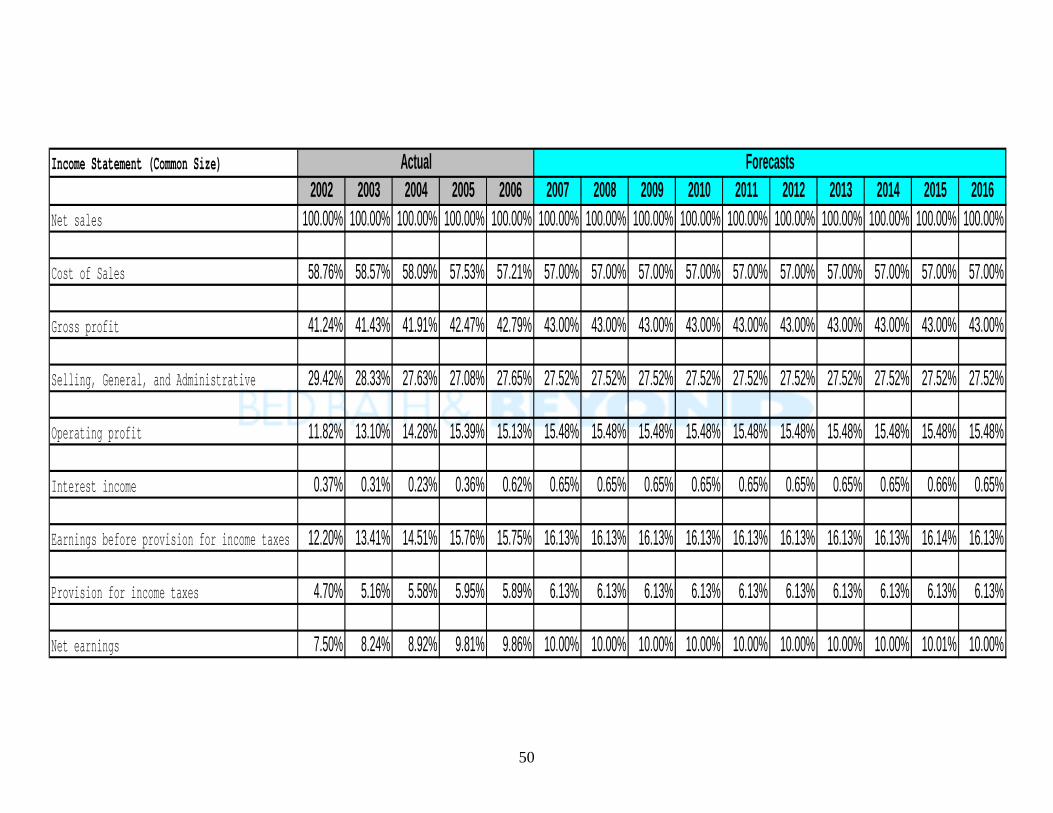
Income Statement
In order to forecast the income statement we had to look for trends in the
financial statements from the last five years. We determined that sales growth
was mean reverting which led us to believe that the yearly growth was going to
keep decreasing until it was back to the industry average. The growth rate for
2002 was 25% and gradually decreased yearly until 2006 when it was 12%. We
followed this trend and projected the growth from 2007 to 2011 to grow at 9%,
and 7% growth thereafter. The rest of the income statement was forecast from
trends found in the last five years. Cost of sales was forecasted as 57% of net
sales, selling, general, and administrative were forecasted as 64% of gross
profit, interest income was 4% of total earnings, and provision for income taxes
was 38% of total earnings.
49
Income Statement(in thousands) 2002 2003 2004 2005 2006 2007 2008 2009 2010 2011 2012 2013 2014 2015 2016
Net sales $2,927,962 $3,665,164 $4,477,981 $5,147,678 $5,809,562 $6,332,423 $6,902,341 $7,523,551 $8,200,671 $8,938,731 $9,564,442 $10,233,953 $10,950,330 $11,716,853 $12,537,033
Cost of Sales $1,720,396 $2,146,617 $2,601,317 $2,961,377 $3,323,814 $3,609,481 $3,934,334 $4,288,424 $4,674,382 $5,095,077 $5,451,732 $5,833,353 $6,241,688 $6,678,606 $7,146,109
Gross profit $1,207,566 $1,518,547 $1,876,664 $2,186,301 $2,485,748 $2,722,942 $2,968,006 $3,235,127 $3,526,288 $3,843,654 $4,112,710 $4,400,600 $4,708,642 $5,038,247 $5,390,924
Selling, General, and Administrative $861,466 $1,038,490 $1,237,321 $1,393,877 $1,606,577 $1,742,683 $1,899,524 $2,070,481 $2,256,825 $2,459,939 $2,632,135 $2,816,384 $3,013,531 $3,224,478 $3,450,191
Operating profit $346,100 $480,057 $639,343 $792,424 $879,171 $980,259 $1,068,482 $1,164,646 $1,269,464 $1,383,716 $1,480,576 $1,584,216 $1,695,111 $1,813,769 $1,940,733
Interest income $10,972 $11,291 $10,202 $18,773 $35,920 $41,000 $45,000 $49,000 $53,000 $58,000 $62,000 $66,500 $71,000 $77,000 $81,000
Earnings before provision for income taxes $357,072 $491,348 $649,545 $811,197 $915,091 $1,021,259 $1,113,482 $1,213,646 $1,322,464 $1,441,716 $1,542,576 $1,650,716 $1,766,111 $1,890,769 $2,021,733
Provision for income taxes $137,473 $189,169 $250,075 $306,223 $342,244 $388,078 $423,123 $461,185 $502,536 $547,852 $586,179 $627,272 $671,122 $718,492 $768,258
Net earnings $219,599 $302,179 $399,470 $504,974 $572,847 $633,181 $690,359 $752,460 $819,928 $893,864 $956,397 $1,023,444 $1,094,989 $1,172,277 $1,253,474
Actual Forecasts
50
Income Statement (Common Size)2002 2003 2004 2005 2006 2007 2008 2009 2010 2011 2012 2013 2014 2015 2016
Net sales 100.00% 100.00% 100.00% 100.00% 100.00% 100.00% 100.00% 100.00% 100.00% 100.00% 100.00% 100.00% 100.00% 100.00% 100.00%
Cost of Sales 58.76% 58.57% 58.09% 57.53% 57.21% 57.00% 57.00% 57.00% 57.00% 57.00% 57.00% 57.00% 57.00% 57.00% 57.00%
Gross profit 41.24% 41.43% 41.91% 42.47% 42.79% 43.00% 43.00% 43.00% 43.00% 43.00% 43.00% 43.00% 43.00% 43.00% 43.00%
Selling, General, and Administrative 29.42% 28.33% 27.63% 27.08% 27.65% 27.52% 27.52% 27.52% 27.52% 27.52% 27.52% 27.52% 27.52% 27.52% 27.52%
Operating profit 11.82% 13.10% 14.28% 15.39% 15.13% 15.48% 15.48% 15.48% 15.48% 15.48% 15.48% 15.48% 15.48% 15.48% 15.48%
Interest income 0.37% 0.31% 0.23% 0.36% 0.62% 0.65% 0.65% 0.65% 0.65% 0.65% 0.65% 0.65% 0.65% 0.66% 0.65%
Earnings before provision for income taxes 12.20% 13.41% 14.51% 15.76% 15.75% 16.13% 16.13% 16.13% 16.13% 16.13% 16.13% 16.13% 16.13% 16.14% 16.13%
Provision for income taxes 4.70% 5.16% 5.58% 5.95% 5.89% 6.13% 6.13% 6.13% 6.13% 6.13% 6.13% 6.13% 6.13% 6.13% 6.13%
Net earnings 7.50% 8.24% 8.92% 9.81% 9.86% 10.00% 10.00% 10.00% 10.00% 10.00% 10.00% 10.00% 10.00% 10.01% 10.00%
Actual Forecasts
51
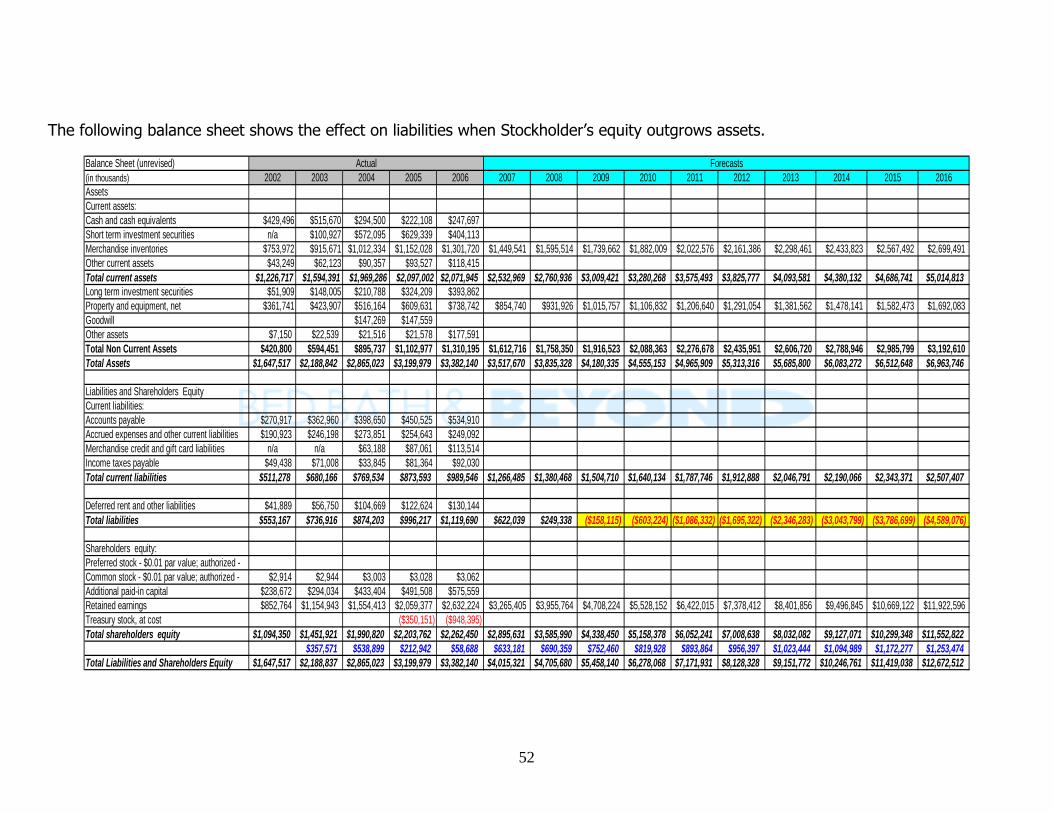
Balance Sheet
The balance sheet was forecasted using a combination of trends, ratios,
and averages. We computed total assets using the assets turnover ratio that was
held constant at 1.7. Total equity was computed by adding the current year’s net
income to the ending book value of equity. We then computed total liabilities.
Long term liabilities were equal to current liabilities, which were computed by
taking the difference between total equity and total assets. Current assets were
calculated using the current ratio held at 2.0. We chose the current ratio of 2.0
because there was a decreasing trend over the last five years of ratios, and we
believe Bed Bath & Beyond will sustain a current ratio no lower than 2.0.
Property, plant, and equipment were forecasted at 56% of non current assets,
and merchandise inventory was forecasted by adding the cash outflow on
inventory from the statement of cash flows to the ending balance of inventory on
the balance sheet.
After forecasting the balance sheet elements, we found that stockholder’s
equity was growing at a much faster rate than assets. We did not want to
drastically change assets because we were confident in the method we used to
forecast them. In order to balance, we attempted to decrease liabilities, but the
values were negative by the year 2009. We were then forced to increase assets.
We computed assets by taking the ending balance of total assets and adding net
income for that year. There was a slight difference between total assets and total
liabilities and stockholder’s equity. This amount was added to assets setting both
sides of the equation, A = L + OE, equal to each other.
The inconsistency in Bed Bath & Beyond’s balance sheet raises concerns
because the constant increase in net earnings is not accounted for in any asset
account. This is a problem because a company that is as profitable as Bed Bath
& Beyond should be reinvesting in assets or paying dividends to stockholders. In
2005 and 2006 the company repurchased stock valuing 350 million and 948
million. The reason behind this is unknown, but we speculate this could be an
attempt to deceivingly inflate their share price with fewer shares outstanding. An
investor may falsely believe that more shares are being traded than there
actually are.
52
The following balance sheet shows the effect on liabilities when Stockholder’s equity outgrows assets.
Balance Sheet (unrevised)(in thousands) 2002 2003 2004 2005 2006 2007 2008 2009 2010 2011 2012 2013 2014 2015 2016AssetsCurrent assets:Cash and cash equivalents $429,496 $515,670 $294,500 $222,108 $247,697Short term investment securities n/a $100,927 $572,095 $629,339 $404,113Merchandise inventories $753,972 $915,671 $1,012,334 $1,152,028 $1,301,720 $1,449,541 $1,595,514 $1,739,662 $1,882,009 $2,022,576 $2,161,386 $2,298,461 $2,433,823 $2,567,492 $2,699,491Other current assets $43,249 $62,123 $90,357 $93,527 $118,415Total current assets $1,226,717 $1,594,391 $1,969,286 $2,097,002 $2,071,945 $2,532,969 $2,760,936 $3,009,421 $3,280,268 $3,575,493 $3,825,777 $4,093,581 $4,380,132 $4,686,741 $5,014,813Long term investment securities $51,909 $148,005 $210,788 $324,209 $393,862Property and equipment, net $361,741 $423,907 $516,164 $609,631 $738,742 $854,740 $931,926 $1,015,757 $1,106,832 $1,206,640 $1,291,054 $1,381,562 $1,478,141 $1,582,473 $1,692,083Goodwill $147,269 $147,559Other assets $7,150 $22,539 $21,516 $21,578 $177,591Total Non Current Assets $420,800 $594,451 $895,737 $1,102,977 $1,310,195 $1,612,716 $1,758,350 $1,916,523 $2,088,363 $2,276,678 $2,435,951 $2,606,720 $2,788,946 $2,985,799 $3,192,610Total Assets $1,647,517 $2,188,842 $2,865,023 $3,199,979 $3,382,140 $3,517,670 $3,835,328 $4,180,335 $4,555,153 $4,965,909 $5,313,316 $5,685,800 $6,083,272 $6,512,648 $6,963,746
Liabilities and Shareholders EquityCurrent liabilities:Accounts payable $270,917 $362,960 $398,650 $450,525 $534,910Accrued expenses and other current liabilities $190,923 $246,198 $273,851 $254,643 $249,092Merchandise credit and gift card liabilities n/a n/a $63,188 $87,061 $113,514Income taxes payable $49,438 $71,008 $33,845 $81,364 $92,030Total current liabilities $511,278 $680,166 $769,534 $873,593 $989,546 $1,266,485 $1,380,468 $1,504,710 $1,640,134 $1,787,746 $1,912,888 $2,046,791 $2,190,066 $2,343,371 $2,507,407
Deferred rent and other liabilities $41,889 $56,750 $104,669 $122,624 $130,144Total liabilities $553,167 $736,916 $874,203 $996,217 $1,119,690 $622,039 $249,338 ($158,115) ($603,224) ($1,086,332) ($1,695,322) ($2,346,283) ($3,043,799) ($3,786,699) ($4,589,076)
Shareholders equity:Preferred stock - $0.01 par value; authorized -Common stock - $0.01 par value; authorized - $2,914 $2,944 $3,003 $3,028 $3,062Additional paid-in capital $238,672 $294,034 $433,404 $491,508 $575,559Retained earnings $852,764 $1,154,943 $1,554,413 $2,059,377 $2,632,224 $3,265,405 $3,955,764 $4,708,224 $5,528,152 $6,422,015 $7,378,412 $8,401,856 $9,496,845 $10,669,122 $11,922,596Treasury stock, at cost ($350,151) ($948,395)Total shareholders equity $1,094,350 $1,451,921 $1,990,820 $2,203,762 $2,262,450 $2,895,631 $3,585,990 $4,338,450 $5,158,378 $6,052,241 $7,008,638 $8,032,082 $9,127,071 $10,299,348 $11,552,822
$357,571 $538,899 $212,942 $58,688 $633,181 $690,359 $752,460 $819,928 $893,864 $956,397 $1,023,444 $1,094,989 $1,172,277 $1,253,474Total Liabilities and Shareholders Equity $1,647,517 $2,188,837 $2,865,023 $3,199,979 $3,382,140 $4,015,321 $4,705,680 $5,458,140 $6,278,068 $7,171,931 $8,128,328 $9,151,772 $10,246,761 $11,419,038 $12,672,512
Actual Forecasts
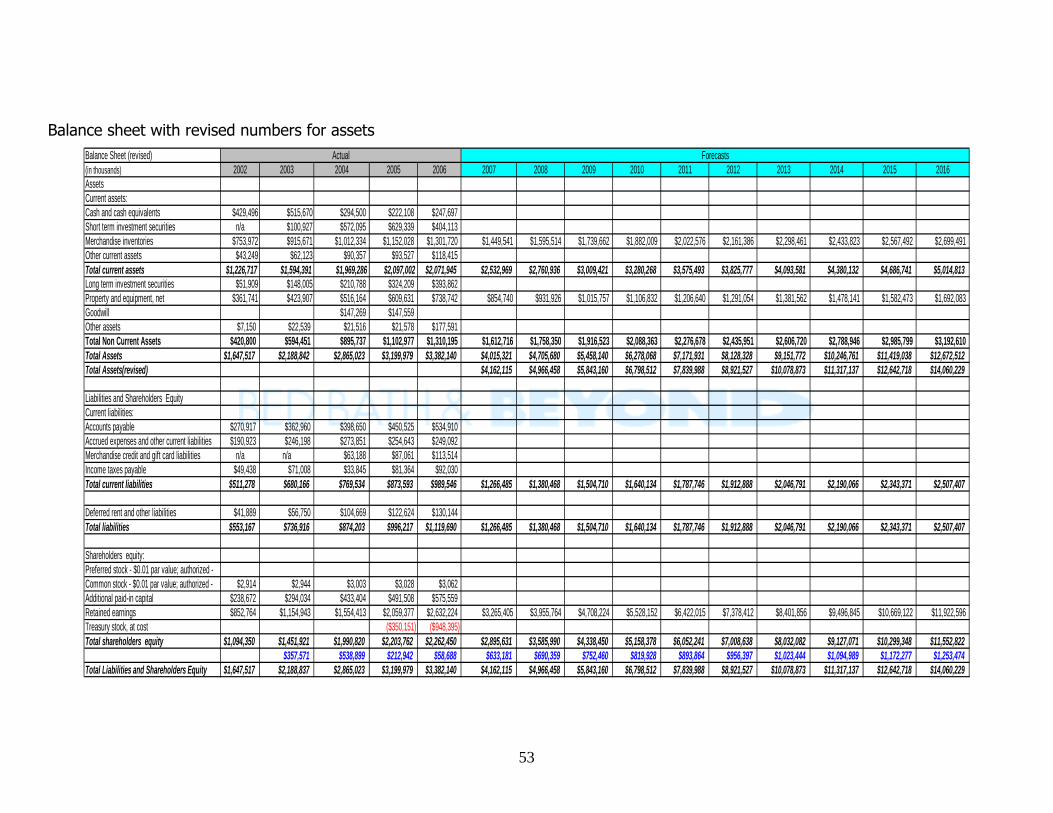
53
Balance sheet with revised numbers for assetsBalance Sheet (revised)(in thousands) 2002 2003 2004 2005 2006 2007 2008 2009 2010 2011 2012 2013 2014 2015 2016AssetsCurrent assets:Cash and cash equivalents $429,496 $515,670 $294,500 $222,108 $247,697Short term investment securities n/a $100,927 $572,095 $629,339 $404,113Merchandise inventories $753,972 $915,671 $1,012,334 $1,152,028 $1,301,720 $1,449,541 $1,595,514 $1,739,662 $1,882,009 $2,022,576 $2,161,386 $2,298,461 $2,433,823 $2,567,492 $2,699,491Other current assets $43,249 $62,123 $90,357 $93,527 $118,415Total current assets $1,226,717 $1,594,391 $1,969,286 $2,097,002 $2,071,945 $2,532,969 $2,760,936 $3,009,421 $3,280,268 $3,575,493 $3,825,777 $4,093,581 $4,380,132 $4,686,741 $5,014,813Long term investment securities $51,909 $148,005 $210,788 $324,209 $393,862Property and equipment, net $361,741 $423,907 $516,164 $609,631 $738,742 $854,740 $931,926 $1,015,757 $1,106,832 $1,206,640 $1,291,054 $1,381,562 $1,478,141 $1,582,473 $1,692,083Goodwill $147,269 $147,559Other assets $7,150 $22,539 $21,516 $21,578 $177,591Total Non Current Assets $420,800 $594,451 $895,737 $1,102,977 $1,310,195 $1,612,716 $1,758,350 $1,916,523 $2,088,363 $2,276,678 $2,435,951 $2,606,720 $2,788,946 $2,985,799 $3,192,610Total Assets $1,647,517 $2,188,842 $2,865,023 $3,199,979 $3,382,140 $4,015,321 $4,705,680 $5,458,140 $6,278,068 $7,171,931 $8,128,328 $9,151,772 $10,246,761 $11,419,038 $12,672,512Total Assets(revised) $4,162,115 $4,966,458 $5,843,160 $6,798,512 $7,839,988 $8,921,527 $10,078,873 $11,317,137 $12,642,718 $14,060,229
Liabilities and Shareholders EquityCurrent liabilities:Accounts payable $270,917 $362,960 $398,650 $450,525 $534,910Accrued expenses and other current liabilities $190,923 $246,198 $273,851 $254,643 $249,092Merchandise credit and gift card liabilities n/a n/a $63,188 $87,061 $113,514Income taxes payable $49,438 $71,008 $33,845 $81,364 $92,030Total current liabilities $511,278 $680,166 $769,534 $873,593 $989,546 $1,266,485 $1,380,468 $1,504,710 $1,640,134 $1,787,746 $1,912,888 $2,046,791 $2,190,066 $2,343,371 $2,507,407
Deferred rent and other liabilities $41,889 $56,750 $104,669 $122,624 $130,144Total liabilities $553,167 $736,916 $874,203 $996,217 $1,119,690 $1,266,485 $1,380,468 $1,504,710 $1,640,134 $1,787,746 $1,912,888 $2,046,791 $2,190,066 $2,343,371 $2,507,407
Shareholders equity:Preferred stock - $0.01 par value; authorized -Common stock - $0.01 par value; authorized - $2,914 $2,944 $3,003 $3,028 $3,062Additional paid-in capital $238,672 $294,034 $433,404 $491,508 $575,559Retained earnings $852,764 $1,154,943 $1,554,413 $2,059,377 $2,632,224 $3,265,405 $3,955,764 $4,708,224 $5,528,152 $6,422,015 $7,378,412 $8,401,856 $9,496,845 $10,669,122 $11,922,596Treasury stock, at cost ($350,151) ($948,395)Total shareholders equity $1,094,350 $1,451,921 $1,990,820 $2,203,762 $2,262,450 $2,895,631 $3,585,990 $4,338,450 $5,158,378 $6,052,241 $7,008,638 $8,032,082 $9,127,071 $10,299,348 $11,552,822
$357,571 $538,899 $212,942 $58,688 $633,181 $690,359 $752,460 $819,928 $893,864 $956,397 $1,023,444 $1,094,989 $1,172,277 $1,253,474Total Liabilities and Shareholders Equity $1,647,517 $2,188,837 $2,865,023 $3,199,979 $3,382,140 $4,162,115 $4,966,458 $5,843,160 $6,798,512 $7,839,988 $8,921,527 $10,078,873 $11,317,137 $12,642,718 $14,060,229
Actual Forecasts
54
Cash Flows
Due to the lack of identifiable trends in the statement of cash flows, we
were only able to forecast four items from the cash flow from operations section.
We forecasted depreciation and amortization using the average growth from the
past five years, 14%. Deferred income taxes were forecasted using a 30%
increase per year, and cash paid for merchandise inventory was decreased by
.25%, the average from the last five years. Net cash provided by operating
activities was increased by 10% a year, which was the average of the last two
years. This was the only trend we were able to find in the CFFO section.
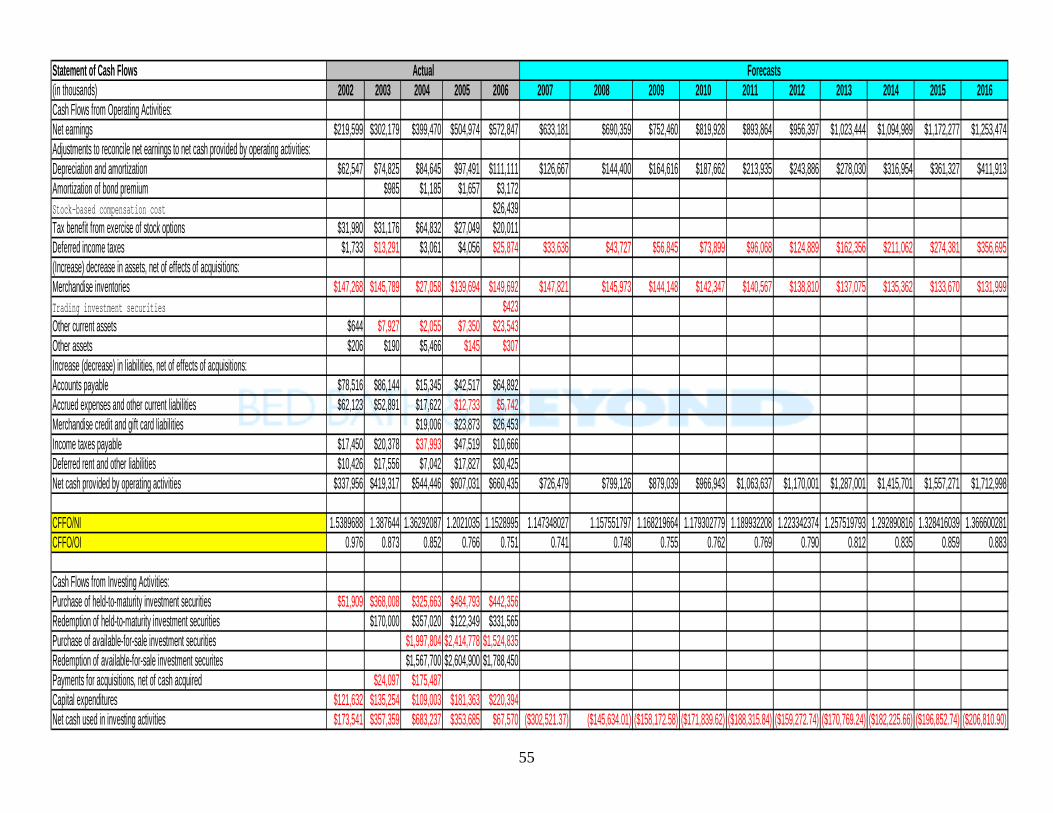
55
Statement of Cash Flows(in thousands) 2002 2003 2004 2005 2006 2007 2008 2009 2010 2011 2012 2013 2014 2015 2016Cash Flows from Operating Activities:Net earnings $219,599 $302,179 $399,470 $504,974 $572,847 $633,181 $690,359 $752,460 $819,928 $893,864 $956,397 $1,023,444 $1,094,989 $1,172,277 $1,253,474Adjustments to reconcile net earnings to net cash provided by operating activities:Depreciation and amortization $62,547 $74,825 $84,645 $97,491 $111,111 $126,667 $144,400 $164,616 $187,662 $213,935 $243,886 $278,030 $316,954 $361,327 $411,913Amortization of bond premium $985 $1,185 $1,657 $3,172Stock-based compensation cost $26,439Tax benefit from exercise of stock options $31,980 $31,176 $64,832 $27,049 $20,011Deferred income taxes $1,733 $13,291 $3,061 $4,056 $25,874 $33,636 $43,727 $56,845 $73,899 $96,068 $124,889 $162,356 $211,062 $274,381 $356,695(Increase) decrease in assets, net of effects of acquisitions:Merchandise inventories $147,268 $145,789 $27,058 $139,694 $149,692 $147,821 $145,973 $144,148 $142,347 $140,567 $138,810 $137,075 $135,362 $133,670 $131,999Trading investment securities $423Other current assets $644 $7,927 $2,055 $7,350 $23,543Other assets $206 $190 $5,466 $145 $307Increase (decrease) in liabilities, net of effects of acquisitions:Accounts payable $78,516 $86,144 $15,345 $42,517 $64,892Accrued expenses and other current liabilities $62,123 $52,891 $17,622 $12,733 $5,742Merchandise credit and gift card liabilities $19,006 $23,873 $26,453Income taxes payable $17,450 $20,378 $37,993 $47,519 $10,666Deferred rent and other liabilities $10,426 $17,556 $7,042 $17,827 $30,425Net cash provided by operating activities $337,956 $419,317 $544,446 $607,031 $660,435 $726,479 $799,126 $879,039 $966,943 $1,063,637 $1,170,001 $1,287,001 $1,415,701 $1,557,271 $1,712,998
CFFO/NI 1.5389688 1.387644 1.36292087 1.2021035 1.1528995 1.147348027 1.157551797 1.168219664 1.179302779 1.189932208 1.223342374 1.257519793 1.292890816 1.328416039 1.366600281CFFO/OI 0.976 0.873 0.852 0.766 0.751 0.741 0.748 0.755 0.762 0.769 0.790 0.812 0.835 0.859 0.883
Cash Flows from Investing Activities:Purchase of held-to-maturity investment securities $51,909 $368,008 $325,663 $484,793 $442,356Redemption of held-to-maturity investment securities $170,000 $357,020 $122,349 $331,565Purchase of available-for-sale investment securities $1,997,804 $2,414,778 $1,524,835Redemption of available-for-sale investment securites $1,567,700 $2,604,900 $1,788,450Payments for acquisitions, net of cash acquired $24,097 $175,487Capital expenditures $121,632 $135,254 $109,003 $181,363 $220,394Net cash used in investing activities $173,541 $357,359 $683,237 $353,685 $67,570 ($302,521.37) ($145,634.01) ($158,172.58) ($171,839.62) ($188,315.84) ($159,272.74) ($170,769.24) ($182,225.66) ($196,852.74) ($206,810.90)
Actual Forecasts
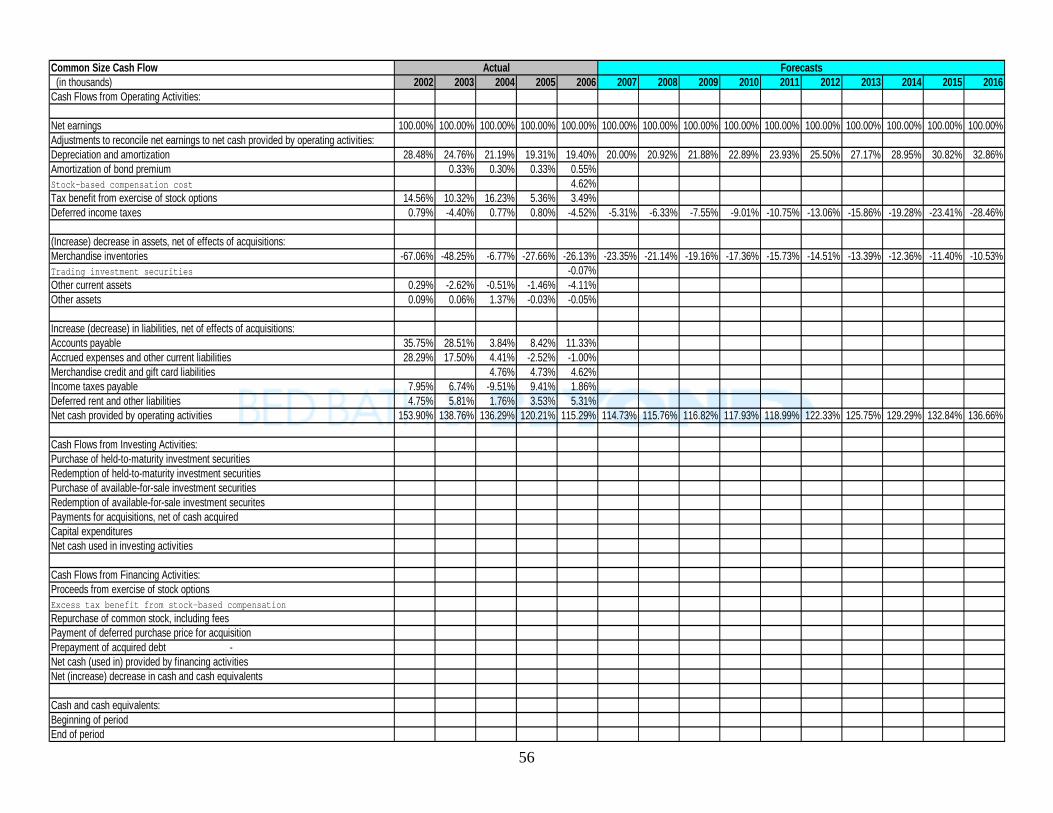
56
Common Size Cash Flow (in thousands) 2002 2003 2004 2005 2006 2007 2008 2009 2010 2011 2012 2013 2014 2015 2016Cash Flows from Operating Activities:
Net earnings 100.00% 100.00% 100.00% 100.00% 100.00% 100.00% 100.00% 100.00% 100.00% 100.00% 100.00% 100.00% 100.00% 100.00% 100.00%Adjustments to reconcile net earnings to net cash provided by operating activities:Depreciation and amortization 28.48% 24.76% 21.19% 19.31% 19.40% 20.00% 20.92% 21.88% 22.89% 23.93% 25.50% 27.17% 28.95% 30.82% 32.86%Amortization of bond premium 0.33% 0.30% 0.33% 0.55%Stock-based compensation cost 4.62%Tax benefit from exercise of stock options 14.56% 10.32% 16.23% 5.36% 3.49%Deferred income taxes 0.79% -4.40% 0.77% 0.80% -4.52% -5.31% -6.33% -7.55% -9.01% -10.75% -13.06% -15.86% -19.28% -23.41% -28.46%
(Increase) decrease in assets, net of effects of acquisitions:Merchandise inventories -67.06% -48.25% -6.77% -27.66% -26.13% -23.35% -21.14% -19.16% -17.36% -15.73% -14.51% -13.39% -12.36% -11.40% -10.53%Trading investment securities -0.07%Other current assets 0.29% -2.62% -0.51% -1.46% -4.11%Other assets 0.09% 0.06% 1.37% -0.03% -0.05%
Increase (decrease) in liabilities, net of effects of acquisitions:Accounts payable 35.75% 28.51% 3.84% 8.42% 11.33%Accrued expenses and other current liabilities 28.29% 17.50% 4.41% -2.52% -1.00%Merchandise credit and gift card liabilities 4.76% 4.73% 4.62%Income taxes payable 7.95% 6.74% -9.51% 9.41% 1.86%Deferred rent and other liabilities 4.75% 5.81% 1.76% 3.53% 5.31%Net cash provided by operating activities 153.90% 138.76% 136.29% 120.21% 115.29% 114.73% 115.76% 116.82% 117.93% 118.99% 122.33% 125.75% 129.29% 132.84% 136.66%
Cash Flows from Investing Activities:Purchase of held-to-maturity investment securities Redemption of held-to-maturity investment securities Purchase of available-for-sale investment securities Redemption of available-for-sale investment securites Payments for acquisitions, net of cash acquiredCapital expenditures Net cash used in investing activities
Cash Flows from Financing Activities:Proceeds from exercise of stock options Excess tax benefit from stock-based compensationRepurchase of common stock, including fees Payment of deferred purchase price for acquisitionPrepayment of acquired debt -Net cash (used in) provided by financing activitiesNet (increase) decrease in cash and cash equivalents
Cash and cash equivalents:Beginning of period End of period
Actual Forecasts
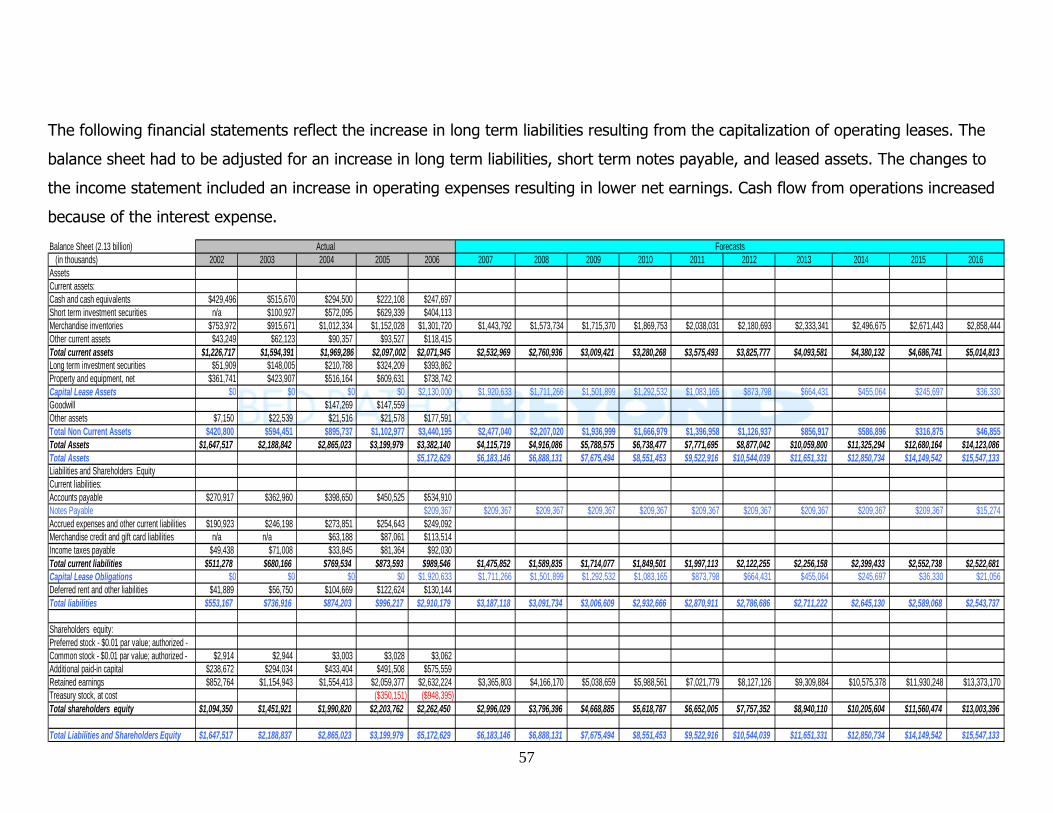
57
The following financial statements reflect the increase in long term liabilities resulting from the capitalization of operating leases. The
balance sheet had to be adjusted for an increase in long term liabilities, short term notes payable, and leased assets. The changes to
the income statement included an increase in operating expenses resulting in lower net earnings. Cash flow from operations increased
because of the interest expense.
Balance Sheet (2.13 billion) (in thousands) 2002 2003 2004 2005 2006 2007 2008 2009 2010 2011 2012 2013 2014 2015 2016AssetsCurrent assets:Cash and cash equivalents $429,496 $515,670 $294,500 $222,108 $247,697Short term investment securities n/a $100,927 $572,095 $629,339 $404,113Merchandise inventories $753,972 $915,671 $1,012,334 $1,152,028 $1,301,720 $1,443,792 $1,573,734 $1,715,370 $1,869,753 $2,038,031 $2,180,693 $2,333,341 $2,496,675 $2,671,443 $2,858,444Other current assets $43,249 $62,123 $90,357 $93,527 $118,415Total current assets $1,226,717 $1,594,391 $1,969,286 $2,097,002 $2,071,945 $2,532,969 $2,760,936 $3,009,421 $3,280,268 $3,575,493 $3,825,777 $4,093,581 $4,380,132 $4,686,741 $5,014,813Long term investment securities $51,909 $148,005 $210,788 $324,209 $393,862Property and equipment, net $361,741 $423,907 $516,164 $609,631 $738,742Capital Lease Assets $0 $0 $0 $0 $2,130,000 $1,920,633 $1,711,266 $1,501,899 $1,292,532 $1,083,165 $873,798 $664,431 $455,064 $245,697 $36,330Goodwill $147,269 $147,559Other assets $7,150 $22,539 $21,516 $21,578 $177,591Total Non Current Assets $420,800 $594,451 $895,737 $1,102,977 $3,440,195 $2,477,040 $2,207,020 $1,936,999 $1,666,979 $1,396,958 $1,126,937 $856,917 $586,896 $316,875 $46,855Total Assets $1,647,517 $2,188,842 $2,865,023 $3,199,979 $3,382,140 $4,115,719 $4,916,086 $5,788,575 $6,738,477 $7,771,695 $8,877,042 $10,059,800 $11,325,294 $12,680,164 $14,123,086Total Assets $5,172,629 $6,183,146 $6,888,131 $7,675,494 $8,551,453 $9,522,916 $10,544,039 $11,651,331 $12,850,734 $14,149,542 $15,547,133Liabilities and Shareholders EquityCurrent liabilities:Accounts payable $270,917 $362,960 $398,650 $450,525 $534,910Notes Payable $209,367 $209,367 $209,367 $209,367 $209,367 $209,367 $209,367 $209,367 $209,367 $209,367 $15,274Accrued expenses and other current liabilities $190,923 $246,198 $273,851 $254,643 $249,092Merchandise credit and gift card liabilities n/a n/a $63,188 $87,061 $113,514Income taxes payable $49,438 $71,008 $33,845 $81,364 $92,030Total current liabilities $511,278 $680,166 $769,534 $873,593 $989,546 $1,475,852 $1,589,835 $1,714,077 $1,849,501 $1,997,113 $2,122,255 $2,256,158 $2,399,433 $2,552,738 $2,522,681Capital Lease Obligations $0 $0 $0 $0 $1,920,633 $1,711,266 $1,501,899 $1,292,532 $1,083,165 $873,798 $664,431 $455,064 $245,697 $36,330 $21,056Deferred rent and other liabilities $41,889 $56,750 $104,669 $122,624 $130,144Total liabilities $553,167 $736,916 $874,203 $996,217 $2,910,179 $3,187,118 $3,091,734 $3,006,609 $2,932,666 $2,870,911 $2,786,686 $2,711,222 $2,645,130 $2,589,068 $2,543,737
Shareholders equity:Preferred stock - $0.01 par value; authorized -Common stock - $0.01 par value; authorized - $2,914 $2,944 $3,003 $3,028 $3,062Additional paid-in capital $238,672 $294,034 $433,404 $491,508 $575,559Retained earnings $852,764 $1,154,943 $1,554,413 $2,059,377 $2,632,224 $3,365,803 $4,166,170 $5,038,659 $5,988,561 $7,021,779 $8,127,126 $9,309,884 $10,575,378 $11,930,248 $13,373,170Treasury stock, at cost ($350,151) ($948,395)Total shareholders equity $1,094,350 $1,451,921 $1,990,820 $2,203,762 $2,262,450 $2,996,029 $3,796,396 $4,668,885 $5,618,787 $6,652,005 $7,757,352 $8,940,110 $10,205,604 $11,560,474 $13,003,396
Total Liabilities and Shareholders Equity $1,647,517 $2,188,837 $2,865,023 $3,199,979 $5,172,629 $6,183,146 $6,888,131 $7,675,494 $8,551,453 $9,522,916 $10,544,039 $11,651,331 $12,850,734 $14,149,542 $15,547,133
Actual Forecasts
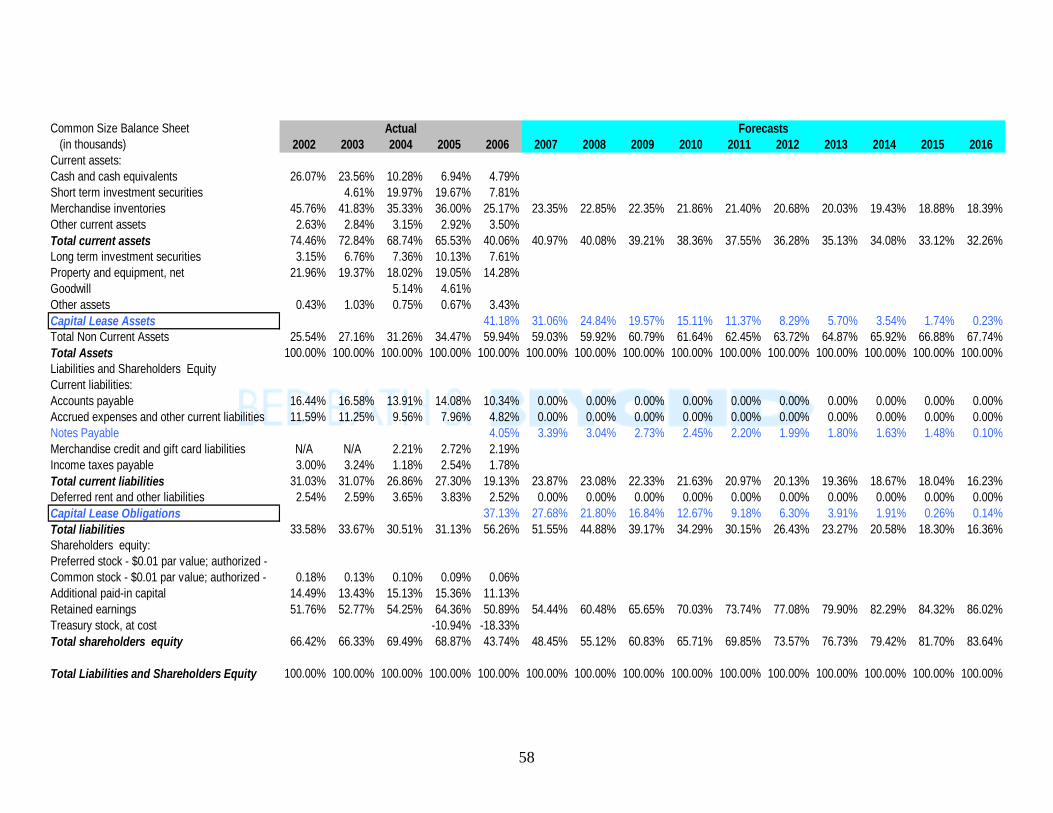
58
Common Size Balance Sheet (in thousands) 2002 2003 2004 2005 2006 2007 2008 2009 2010 2011 2012 2013 2014 2015 2016Current assets:Cash and cash equivalents 26.07% 23.56% 10.28% 6.94% 4.79%Short term investment securities 4.61% 19.97% 19.67% 7.81%Merchandise inventories 45.76% 41.83% 35.33% 36.00% 25.17% 23.35% 22.85% 22.35% 21.86% 21.40% 20.68% 20.03% 19.43% 18.88% 18.39%Other current assets 2.63% 2.84% 3.15% 2.92% 3.50%Total current assets 74.46% 72.84% 68.74% 65.53% 40.06% 40.97% 40.08% 39.21% 38.36% 37.55% 36.28% 35.13% 34.08% 33.12% 32.26%Long term investment securities 3.15% 6.76% 7.36% 10.13% 7.61%Property and equipment, net 21.96% 19.37% 18.02% 19.05% 14.28%Goodwill 5.14% 4.61%Other assets 0.43% 1.03% 0.75% 0.67% 3.43%Capital Lease Assets 41.18% 31.06% 24.84% 19.57% 15.11% 11.37% 8.29% 5.70% 3.54% 1.74% 0.23%Total Non Current Assets 25.54% 27.16% 31.26% 34.47% 59.94% 59.03% 59.92% 60.79% 61.64% 62.45% 63.72% 64.87% 65.92% 66.88% 67.74%Total Assets 100.00% 100.00% 100.00% 100.00% 100.00% 100.00% 100.00% 100.00% 100.00% 100.00% 100.00% 100.00% 100.00% 100.00% 100.00%Liabilities and Shareholders EquityCurrent liabilities:Accounts payable 16.44% 16.58% 13.91% 14.08% 10.34% 0.00% 0.00% 0.00% 0.00% 0.00% 0.00% 0.00% 0.00% 0.00% 0.00%Accrued expenses and other current liabilities 11.59% 11.25% 9.56% 7.96% 4.82% 0.00% 0.00% 0.00% 0.00% 0.00% 0.00% 0.00% 0.00% 0.00% 0.00%Notes Payable 4.05% 3.39% 3.04% 2.73% 2.45% 2.20% 1.99% 1.80% 1.63% 1.48% 0.10%Merchandise credit and gift card liabilities N/A N/A 2.21% 2.72% 2.19%Income taxes payable 3.00% 3.24% 1.18% 2.54% 1.78%Total current liabilities 31.03% 31.07% 26.86% 27.30% 19.13% 23.87% 23.08% 22.33% 21.63% 20.97% 20.13% 19.36% 18.67% 18.04% 16.23%Deferred rent and other liabilities 2.54% 2.59% 3.65% 3.83% 2.52% 0.00% 0.00% 0.00% 0.00% 0.00% 0.00% 0.00% 0.00% 0.00% 0.00%Capital Lease Obligations 37.13% 27.68% 21.80% 16.84% 12.67% 9.18% 6.30% 3.91% 1.91% 0.26% 0.14%Total liabilities 33.58% 33.67% 30.51% 31.13% 56.26% 51.55% 44.88% 39.17% 34.29% 30.15% 26.43% 23.27% 20.58% 18.30% 16.36%Shareholders equity:Preferred stock - $0.01 par value; authorized -Common stock - $0.01 par value; authorized - 0.18% 0.13% 0.10% 0.09% 0.06%Additional paid-in capital 14.49% 13.43% 15.13% 15.36% 11.13%Retained earnings 51.76% 52.77% 54.25% 64.36% 50.89% 54.44% 60.48% 65.65% 70.03% 73.74% 77.08% 79.90% 82.29% 84.32% 86.02%Treasury stock, at cost -10.94% -18.33%Total shareholders equity 66.42% 66.33% 69.49% 68.87% 43.74% 48.45% 55.12% 60.83% 65.71% 69.85% 73.57% 76.73% 79.42% 81.70% 83.64%
Total Liabilities and Shareholders Equity 100.00% 100.00% 100.00% 100.00% 100.00% 100.00% 100.00% 100.00% 100.00% 100.00% 100.00% 100.00% 100.00% 100.00% 100.00%
Actual Forecasts
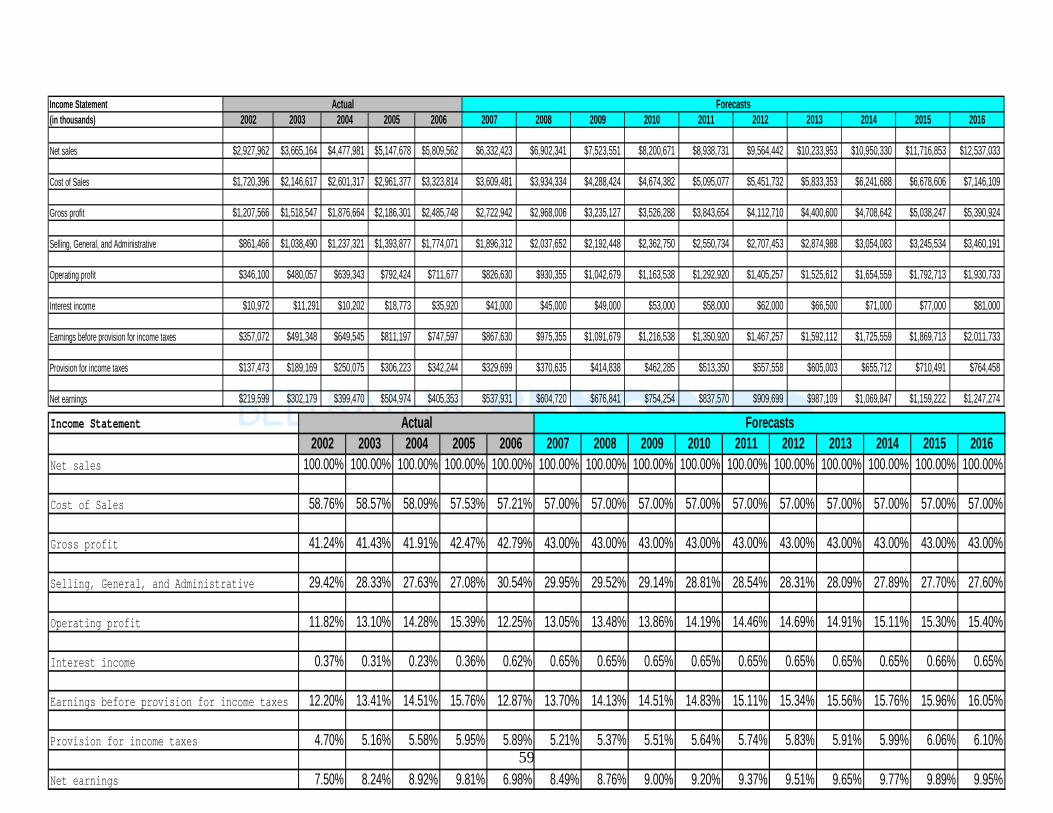
59
Income Statement(in thousands) 2002 2003 2004 2005 2006 2007 2008 2009 2010 2011 2012 2013 2014 2015 2016
Net sales $2,927,962 $3,665,164 $4,477,981 $5,147,678 $5,809,562 $6,332,423 $6,902,341 $7,523,551 $8,200,671 $8,938,731 $9,564,442 $10,233,953 $10,950,330 $11,716,853 $12,537,033
Cost of Sales $1,720,396 $2,146,617 $2,601,317 $2,961,377 $3,323,814 $3,609,481 $3,934,334 $4,288,424 $4,674,382 $5,095,077 $5,451,732 $5,833,353 $6,241,688 $6,678,606 $7,146,109
Gross profit $1,207,566 $1,518,547 $1,876,664 $2,186,301 $2,485,748 $2,722,942 $2,968,006 $3,235,127 $3,526,288 $3,843,654 $4,112,710 $4,400,600 $4,708,642 $5,038,247 $5,390,924
Selling, General, and Administrative $861,466 $1,038,490 $1,237,321 $1,393,877 $1,774,071 $1,896,312 $2,037,652 $2,192,448 $2,362,750 $2,550,734 $2,707,453 $2,874,988 $3,054,083 $3,245,534 $3,460,191
Operating profit $346,100 $480,057 $639,343 $792,424 $711,677 $826,630 $930,355 $1,042,679 $1,163,538 $1,292,920 $1,405,257 $1,525,612 $1,654,559 $1,792,713 $1,930,733
Interest income $10,972 $11,291 $10,202 $18,773 $35,920 $41,000 $45,000 $49,000 $53,000 $58,000 $62,000 $66,500 $71,000 $77,000 $81,000
Earnings before provision for income taxes $357,072 $491,348 $649,545 $811,197 $747,597 $867,630 $975,355 $1,091,679 $1,216,538 $1,350,920 $1,467,257 $1,592,112 $1,725,559 $1,869,713 $2,011,733
Provision for income taxes $137,473 $189,169 $250,075 $306,223 $342,244 $329,699 $370,635 $414,838 $462,285 $513,350 $557,558 $605,003 $655,712 $710,491 $764,458
Net earnings $219,599 $302,179 $399,470 $504,974 $405,353 $537,931 $604,720 $676,841 $754,254 $837,570 $909,699 $987,109 $1,069,847 $1,159,222 $1,247,274
Actual Forecasts
Income Statement2002 2003 2004 2005 2006 2007 2008 2009 2010 2011 2012 2013 2014 2015 2016
Net sales 100.00% 100.00% 100.00% 100.00% 100.00% 100.00% 100.00% 100.00% 100.00% 100.00% 100.00% 100.00% 100.00% 100.00% 100.00%
Cost of Sales 58.76% 58.57% 58.09% 57.53% 57.21% 57.00% 57.00% 57.00% 57.00% 57.00% 57.00% 57.00% 57.00% 57.00% 57.00%
Gross profit 41.24% 41.43% 41.91% 42.47% 42.79% 43.00% 43.00% 43.00% 43.00% 43.00% 43.00% 43.00% 43.00% 43.00% 43.00%
Selling, General, and Administrative 29.42% 28.33% 27.63% 27.08% 30.54% 29.95% 29.52% 29.14% 28.81% 28.54% 28.31% 28.09% 27.89% 27.70% 27.60%
Operating profit 11.82% 13.10% 14.28% 15.39% 12.25% 13.05% 13.48% 13.86% 14.19% 14.46% 14.69% 14.91% 15.11% 15.30% 15.40%
Interest income 0.37% 0.31% 0.23% 0.36% 0.62% 0.65% 0.65% 0.65% 0.65% 0.65% 0.65% 0.65% 0.65% 0.66% 0.65%
Earnings before provision for income taxes 12.20% 13.41% 14.51% 15.76% 12.87% 13.70% 14.13% 14.51% 14.83% 15.11% 15.34% 15.56% 15.76% 15.96% 16.05%
Provision for income taxes 4.70% 5.16% 5.58% 5.95% 5.89% 5.21% 5.37% 5.51% 5.64% 5.74% 5.83% 5.91% 5.99% 6.06% 6.10%
Net earnings 7.50% 8.24% 8.92% 9.81% 6.98% 8.49% 8.76% 9.00% 9.20% 9.37% 9.51% 9.65% 9.77% 9.89% 9.95%
Actual Forecasts
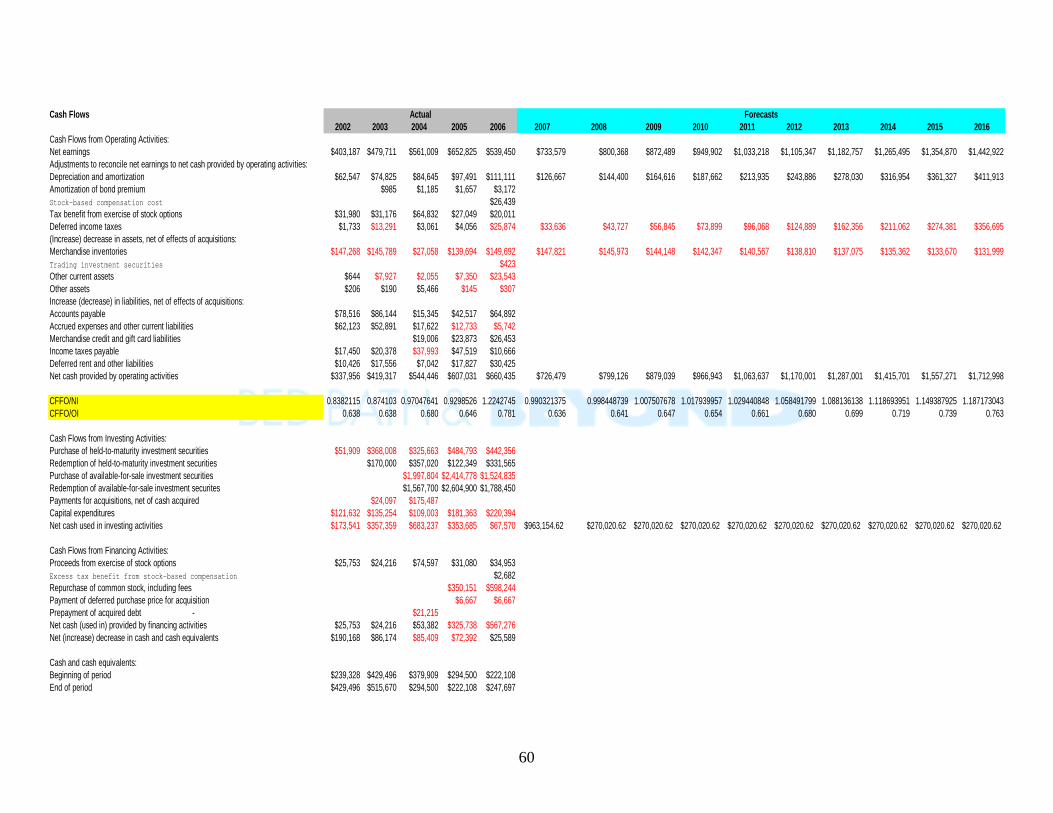
60
Cash Flows2002 2003 2004 2005 2006 2007 2008 2009 2010 2011 2012 2013 2014 2015 2016
Cash Flows from Operating Activities:Net earnings $403,187 $479,711 $561,009 $652,825 $539,450 $733,579 $800,368 $872,489 $949,902 $1,033,218 $1,105,347 $1,182,757 $1,265,495 $1,354,870 $1,442,922Adjustments to reconcile net earnings to net cash provided by operating activities:Depreciation and amortization $62,547 $74,825 $84,645 $97,491 $111,111 $126,667 $144,400 $164,616 $187,662 $213,935 $243,886 $278,030 $316,954 $361,327 $411,913Amortization of bond premium $985 $1,185 $1,657 $3,172Stock-based compensation cost $26,439Tax benefit from exercise of stock options $31,980 $31,176 $64,832 $27,049 $20,011Deferred income taxes $1,733 $13,291 $3,061 $4,056 $25,874 $33,636 $43,727 $56,845 $73,899 $96,068 $124,889 $162,356 $211,062 $274,381 $356,695(Increase) decrease in assets, net of effects of acquisitions:Merchandise inventories $147,268 $145,789 $27,058 $139,694 $149,692 $147,821 $145,973 $144,148 $142,347 $140,567 $138,810 $137,075 $135,362 $133,670 $131,999Trading investment securities $423Other current assets $644 $7,927 $2,055 $7,350 $23,543Other assets $206 $190 $5,466 $145 $307Increase (decrease) in liabilities, net of effects of acquisitions:Accounts payable $78,516 $86,144 $15,345 $42,517 $64,892Accrued expenses and other current liabilities $62,123 $52,891 $17,622 $12,733 $5,742Merchandise credit and gift card liabilities $19,006 $23,873 $26,453Income taxes payable $17,450 $20,378 $37,993 $47,519 $10,666Deferred rent and other liabilities $10,426 $17,556 $7,042 $17,827 $30,425Net cash provided by operating activities $337,956 $419,317 $544,446 $607,031 $660,435 $726,479 $799,126 $879,039 $966,943 $1,063,637 $1,170,001 $1,287,001 $1,415,701 $1,557,271 $1,712,998
CFFO/NI 0.8382115 0.874103 0.97047641 0.9298526 1.2242745 0.990321375 0.998448739 1.007507678 1.017939957 1.029440848 1.058491799 1.088136138 1.118693951 1.149387925 1.187173043CFFO/OI 0.638 0.638 0.680 0.646 0.781 0.636 0.641 0.647 0.654 0.661 0.680 0.699 0.719 0.739 0.763
Cash Flows from Investing Activities:Purchase of held-to-maturity investment securities $51,909 $368,008 $325,663 $484,793 $442,356Redemption of held-to-maturity investment securities $170,000 $357,020 $122,349 $331,565Purchase of available-for-sale investment securities $1,997,804 $2,414,778 $1,524,835Redemption of available-for-sale investment securites $1,567,700 $2,604,900 $1,788,450Payments for acquisitions, net of cash acquired $24,097 $175,487Capital expenditures $121,632 $135,254 $109,003 $181,363 $220,394Net cash used in investing activities $173,541 $357,359 $683,237 $353,685 $67,570 $963,154.62 $270,020.62 $270,020.62 $270,020.62 $270,020.62 $270,020.62 $270,020.62 $270,020.62 $270,020.62 $270,020.62
Cash Flows from Financing Activities:Proceeds from exercise of stock options $25,753 $24,216 $74,597 $31,080 $34,953Excess tax benefit from stock-based compensation $2,682Repurchase of common stock, including fees $350,151 $598,244Payment of deferred purchase price for acquisition $6,667 $6,667Prepayment of acquired debt - $21,215Net cash (used in) provided by financing activities $25,753 $24,216 $53,382 $325,738 $567,276Net (increase) decrease in cash and cash equivalents $190,168 $86,174 $85,409 $72,392 $25,589
Cash and cash equivalents:Beginning of period $239,328 $429,496 $379,909 $294,500 $222,108End of period $429,496 $515,670 $294,500 $222,108 $247,697
Actual Forecasts
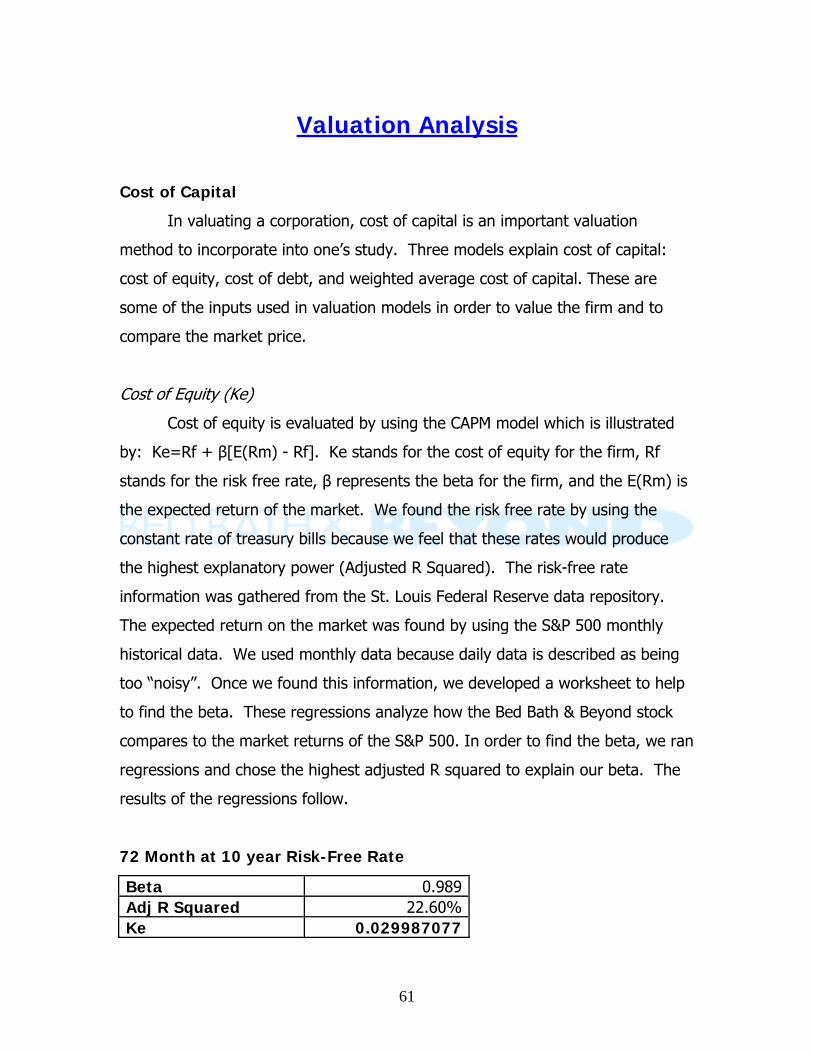
61
Valuation Analysis
Cost of Capital
In valuating a corporation, cost of capital is an important valuation
method to incorporate into one’s study. Three models explain cost of capital:
cost of equity, cost of debt, and weighted average cost of capital. These are
some of the inputs used in valuation models in order to value the firm and to
compare the market price.
Cost of Equity (Ke)
Cost of equity is evaluated by using the CAPM model which is illustrated
by: Ke=Rf + β[E(Rm) - Rf]. Ke stands for the cost of equity for the firm, Rf
stands for the risk free rate, β represents the beta for the firm, and the E(Rm) is
the expected return of the market. We found the risk free rate by using the
constant rate of treasury bills because we feel that these rates would produce
the highest explanatory power (Adjusted R Squared). The risk-free rate
information was gathered from the St. Louis Federal Reserve data repository.
The expected return on the market was found by using the S&P 500 monthly
historical data. We used monthly data because daily data is described as being
too “noisy”. Once we found this information, we developed a worksheet to help
to find the beta. These regressions analyze how the Bed Bath & Beyond stock
compares to the market returns of the S&P 500. In order to find the beta, we ran
regressions and chose the highest adjusted R squared to explain our beta. The
results of the regressions follow.
72 Month at 10 year Risk-Free Rate
Beta 0.989Adj R Squared 22.60%Ke 0.029987077
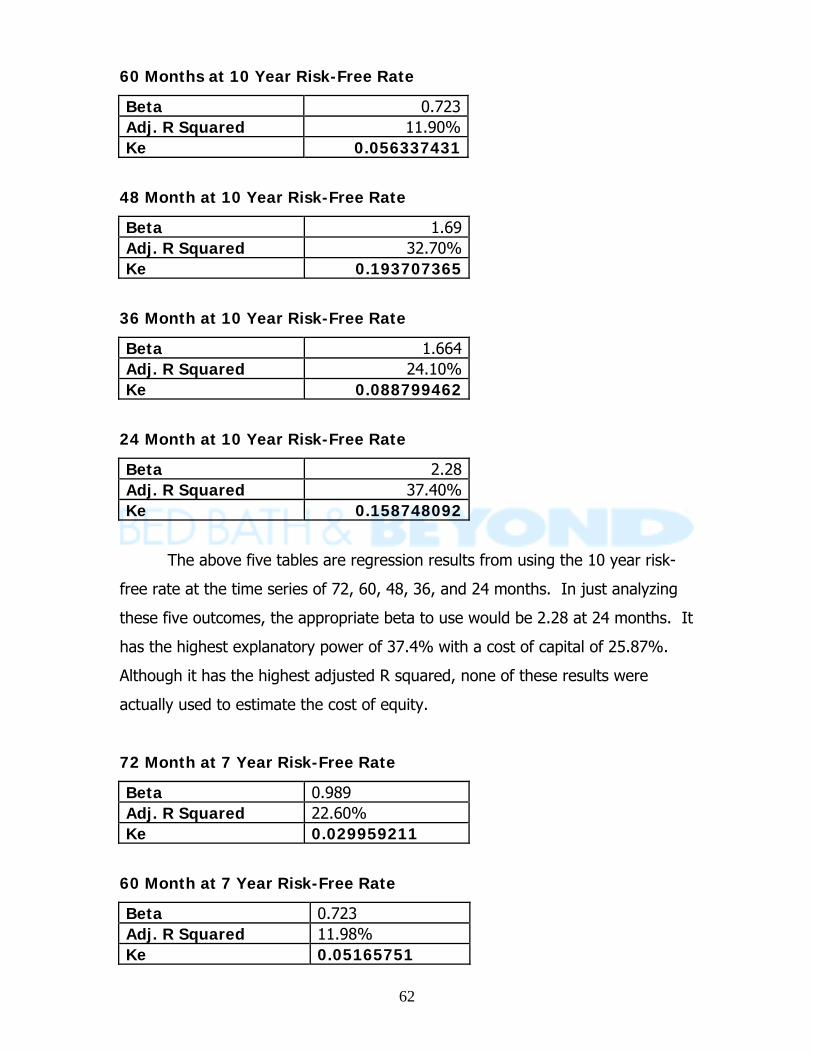
62
60 Months at 10 Year Risk-Free Rate
48 Month at 10 Year Risk-Free Rate
Beta 1.69Adj. R Squared 32.70%Ke 0.193707365
36 Month at 10 Year Risk-Free Rate
Beta 1.664Adj. R Squared 24.10%Ke 0.088799462
24 Month at 10 Year Risk-Free Rate
Beta 2.28Adj. R Squared 37.40%Ke 0.158748092
The above five tables are regression results from using the 10 year risk-
free rate at the time series of 72, 60, 48, 36, and 24 months. In just analyzing
these five outcomes, the appropriate beta to use would be 2.28 at 24 months. It
has the highest explanatory power of 37.4% with a cost of capital of 25.87%.
Although it has the highest adjusted R squared, none of these results were
actually used to estimate the cost of equity.
72 Month at 7 Year Risk-Free Rate
Beta 0.989 Adj. R Squared 22.60% Ke 0.029959211
60 Month at 7 Year Risk-Free Rate
Beta 0.723 Adj. R Squared 11.98% Ke 0.05165751
Beta 0.723Adj. R Squared 11.90%Ke 0.056337431
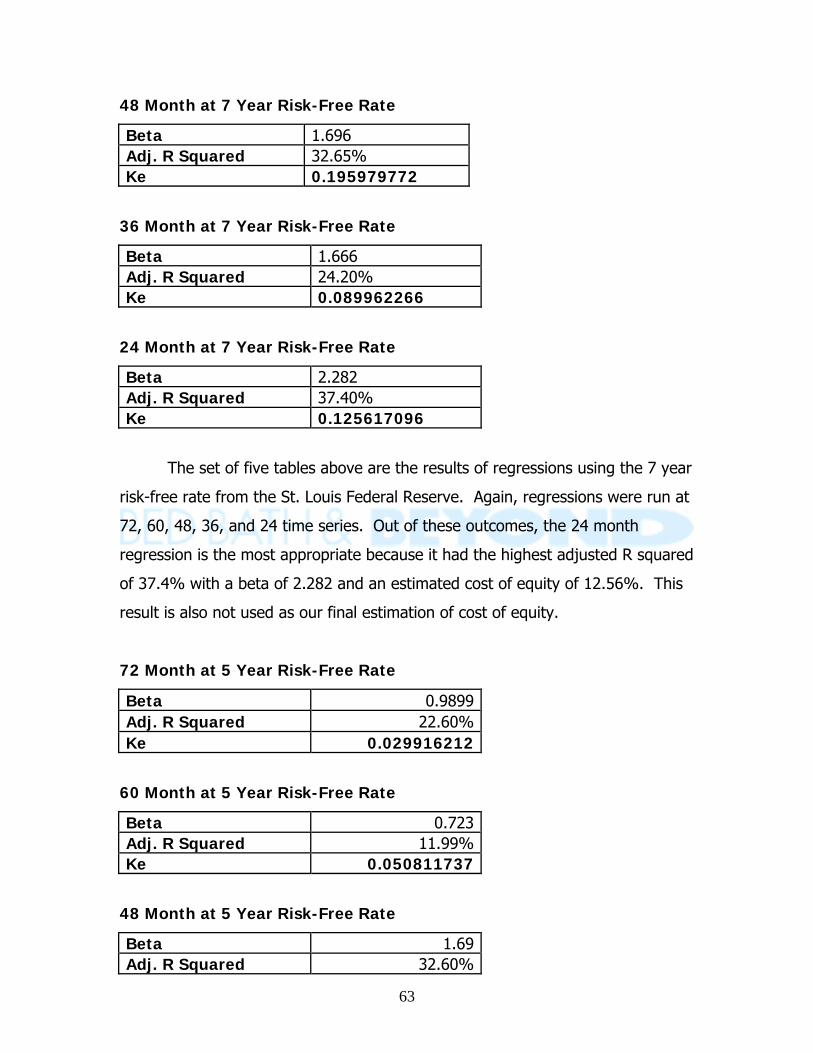
63
48 Month at 7 Year Risk-Free Rate
Beta 1.696 Adj. R Squared 32.65% Ke 0.195979772
36 Month at 7 Year Risk-Free Rate
Beta 1.666 Adj. R Squared 24.20% Ke 0.089962266
24 Month at 7 Year Risk-Free Rate
Beta 2.282 Adj. R Squared 37.40% Ke 0.125617096
The set of five tables above are the results of regressions using the 7 year
risk-free rate from the St. Louis Federal Reserve. Again, regressions were run at
72, 60, 48, 36, and 24 time series. Out of these outcomes, the 24 month
regression is the most appropriate because it had the highest adjusted R squared
of 37.4% with a beta of 2.282 and an estimated cost of equity of 12.56%. This
result is also not used as our final estimation of cost of equity.
72 Month at 5 Year Risk-Free Rate
Beta 0.9899Adj. R Squared 22.60%Ke 0.029916212
60 Month at 5 Year Risk-Free Rate
Beta 0.723Adj. R Squared 11.99%Ke 0.050811737
48 Month at 5 Year Risk-Free Rate
Beta 1.69Adj. R Squared 32.60%
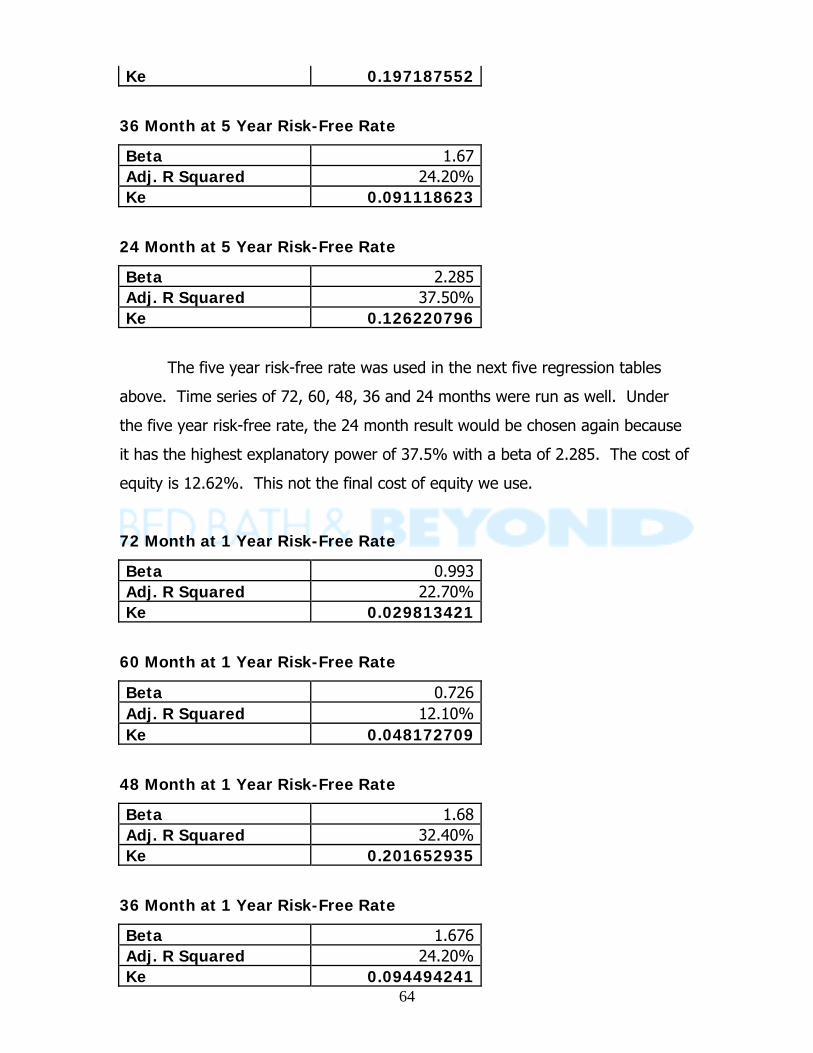
64
Ke 0.197187552
36 Month at 5 Year Risk-Free Rate
Beta 1.67Adj. R Squared 24.20%Ke 0.091118623
24 Month at 5 Year Risk-Free Rate
Beta 2.285Adj. R Squared 37.50%Ke 0.126220796
The five year risk-free rate was used in the next five regression tables
above. Time series of 72, 60, 48, 36 and 24 months were run as well. Under
the five year risk-free rate, the 24 month result would be chosen again because
it has the highest explanatory power of 37.5% with a beta of 2.285. The cost of
equity is 12.62%. This not the final cost of equity we use.
72 Month at 1 Year Risk-Free Rate
Beta 0.993Adj. R Squared 22.70%Ke 0.029813421
60 Month at 1 Year Risk-Free Rate
Beta 0.726Adj. R Squared 12.10%Ke 0.048172709
48 Month at 1 Year Risk-Free Rate
Beta 1.68Adj. R Squared 32.40%Ke 0.201652935
36 Month at 1 Year Risk-Free Rate
Beta 1.676Adj. R Squared 24.20%Ke 0.094494241
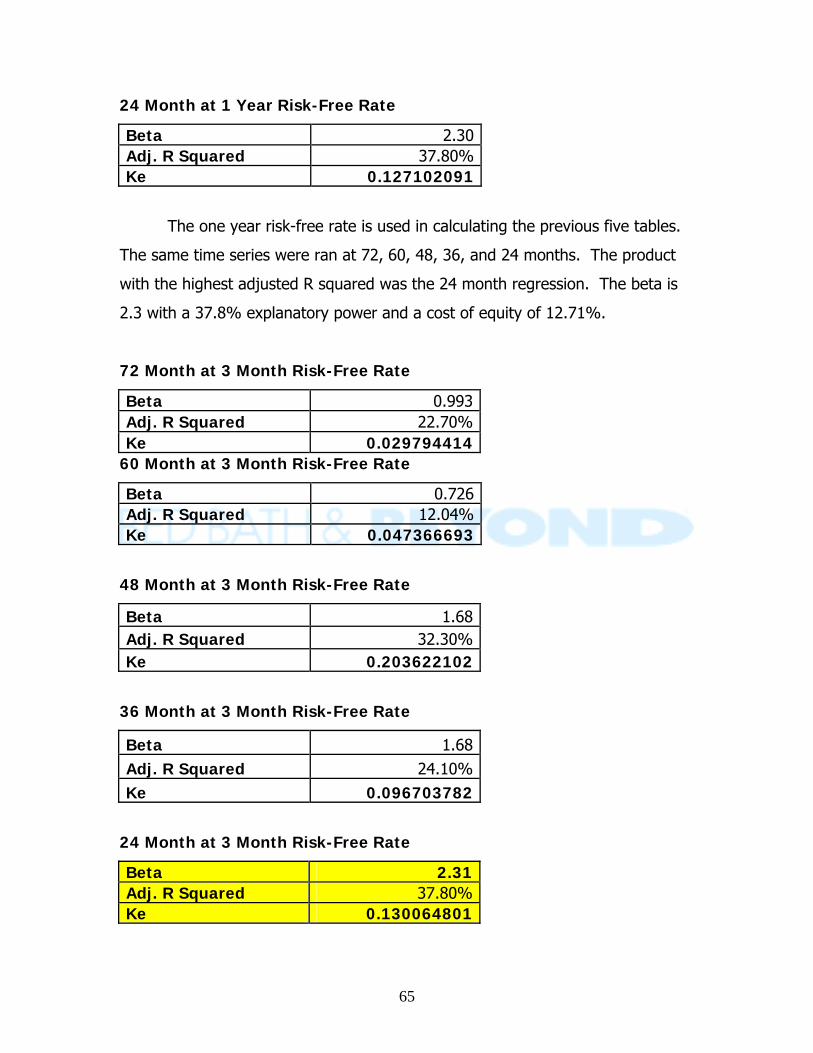
65
24 Month at 1 Year Risk-Free Rate
Beta 2.30Adj. R Squared 37.80%Ke 0.127102091
The one year risk-free rate is used in calculating the previous five tables.
The same time series were ran at 72, 60, 48, 36, and 24 months. The product
with the highest adjusted R squared was the 24 month regression. The beta is
2.3 with a 37.8% explanatory power and a cost of equity of 12.71%.
72 Month at 3 Month Risk-Free Rate
Beta 0.993Adj. R Squared 22.70%Ke 0.029794414
60 Month at 3 Month Risk-Free Rate
Beta 0.726Adj. R Squared 12.04%Ke 0.047366693
48 Month at 3 Month Risk-Free Rate
Beta 1.68Adj. R Squared 32.30%Ke 0.203622102
36 Month at 3 Month Risk-Free Rate
Beta 1.68Adj. R Squared 24.10%Ke 0.096703782
24 Month at 3 Month Risk-Free Rate
Beta 2.31Adj. R Squared 37.80%Ke 0.130064801
66
The above final five regression tables use the three month risk-free rate
from the St. Louis Federal Reserve. This computes a final beta, that we will be
using in future models, that illustrates how the company’s stock price would
correspond or change with the way the market moves. In Bed Bath & Beyond’s
case, we came up with a beta of 2.31. This means that as the market changes
by 1 point, Bed Bath & Beyond’s stock changes 2.31 points. To configure this
beta, we used the three month time series because it had the highest risk free
rate of 4.3%. Then under the three month time series, we used 24 month data
because it had the highest adjusted R squared of 37.8%. To set up the CAPM
model, we used the averages of the risk free rate and the market risk premium
over the 24 months. We felt that taking the averages of these amounts would
give a better estimate of the cost of equity over time rather than just one point
in time. Therefore, the model would be: Ke= 4.3% + 2.31(3.8%), (These
numbers are rounded up). The cost of equity then comes out to be about
13.01%. This represents the return that investors require from the firm for
bearing the risk of ownership of the stock. This number is very important on
running other valuation models.
Cost of Debt (Kd)
Measuring how much a company’s short-term debt and liabilities are
costing them is what cost of debt does. Calculating cost of debt for Bed Bath &
Beyond is a much simpler approach then cost of equity. To find cost of debt, we
found all the debt on the balance sheet. Since Bed Bath & Beyond tries to stay as
debt free as possible, they have no long-term debt. After finding the debt, we
assigned an interest rate appropriate for the type of debt. Usually this is found
on a 10-k, but in the case of Bed Bath & Beyond they did not disclose the rates
of there debt. Interest rates were found for these debts by looking at the current
rates from the St. Louis Federal Reserve data repository and using estimations.
After finding the rates, we got a weighted average of each liability account, by
dividing each account into total liabilities, then multiplying that number by the
interest rate. To finally calculate cost of debt we added all the final weights that
were multiplied by the interest rates, and calculated a cost of debt of 5.7%.
67
The revised cost of debt included the increase in capital lease obligations
resulting in higher total liabilities, and higher value of the firm. This resulted in a
revised cost of debt of 2.7%.
Weighted Average Cost of Capital (WACC)
The final model called weighted average cost of capital (WACC) is found
two different ways: before tax and after tax. We used the after tax method since
it provides us with a more approximate rate to apply to valuation models. We
found the tax rate in the Bed Bath & Beyond 10-k. WACC cannot be determined
without finding cost of debt and cost of equity. This is why those two values are
important in calculating cost of capital. The other variables used in estimating
WACC are value of debt, value of equity, and value of the firm. To get the value
of the firm’s debt (Vd) we took the total of all liabilities. To find value of equity
(Ve), otherwise known as market value of equity, we took the April 1st share
price and multiplied it by the number of shares outstanding. Value of the firm is
simply, value of equity plus value of debt. To estimate WACC you have the
following equation:
WACC = Vd/Vf(Kd)(1-Tax Rate) + Ve/Vf(Ke)
WACC (BBBY) =1120/10750(.0574)(1-.364) + 9631/10750(.13) = 12.03%
Revised WACC
WACC (BBBY) =2910/12540(.027)(1-.364) + 9631/12540(.13) = 10.3%
The revised WACC incorporates the change in liabilities and the new cost of debt
after the capitalization of operating leases. The changes had no effect on the
value of equity, yet increased the value of debt by 1.79 billion dollars.
Valuation Models
There are several methods that can be utilized in order to come up with
an intrinsic value of Bed Bath & Beyond. These values will be directly compared
with the actual share price as of April 1, 2007, which will allows us to derive an
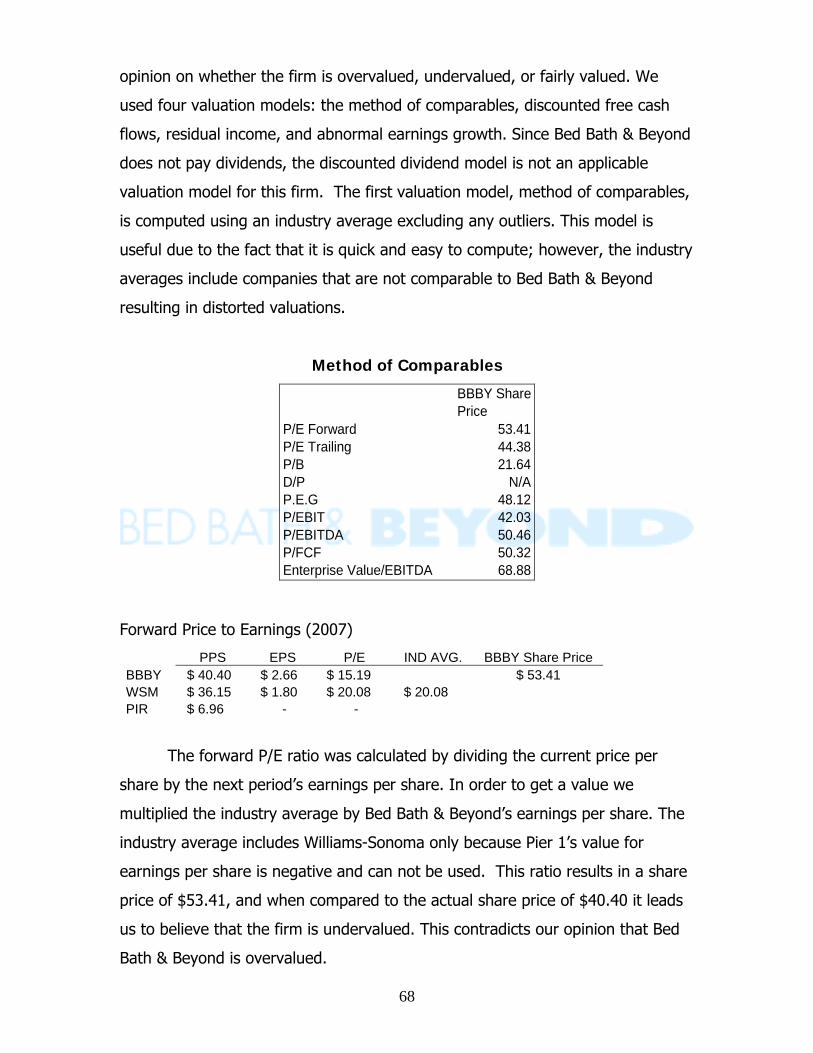
68
opinion on whether the firm is overvalued, undervalued, or fairly valued. We
used four valuation models: the method of comparables, discounted free cash
flows, residual income, and abnormal earnings growth. Since Bed Bath & Beyond
does not pay dividends, the discounted dividend model is not an applicable
valuation model for this firm. The first valuation model, method of comparables,
is computed using an industry average excluding any outliers. This model is
useful due to the fact that it is quick and easy to compute; however, the industry
averages include companies that are not comparable to Bed Bath & Beyond
resulting in distorted valuations.
Method of Comparables
BBBY Share Price
P/E Forward 53.41P/E Trailing 44.38P/B 21.64D/P N/AP.E.G 48.12P/EBIT 42.03P/EBITDA 50.46P/FCF 50.32Enterprise Value/EBITDA 68.88
Forward Price to Earnings (2007)
PPS EPS P/E IND AVG. BBBY Share Price BBBY $ 40.40 $ 2.66 $ 15.19 $ 53.41 WSM $ 36.15 $ 1.80 $ 20.08 $ 20.08 PIR $ 6.96 - -
The forward P/E ratio was calculated by dividing the current price per
share by the next period’s earnings per share. In order to get a value we
multiplied the industry average by Bed Bath & Beyond’s earnings per share. The
industry average includes Williams-Sonoma only because Pier 1’s value for
earnings per share is negative and can not be used. This ratio results in a share
price of $53.41, and when compared to the actual share price of $40.40 it leads
us to believe that the firm is undervalued. This contradicts our opinion that Bed
Bath & Beyond is overvalued.
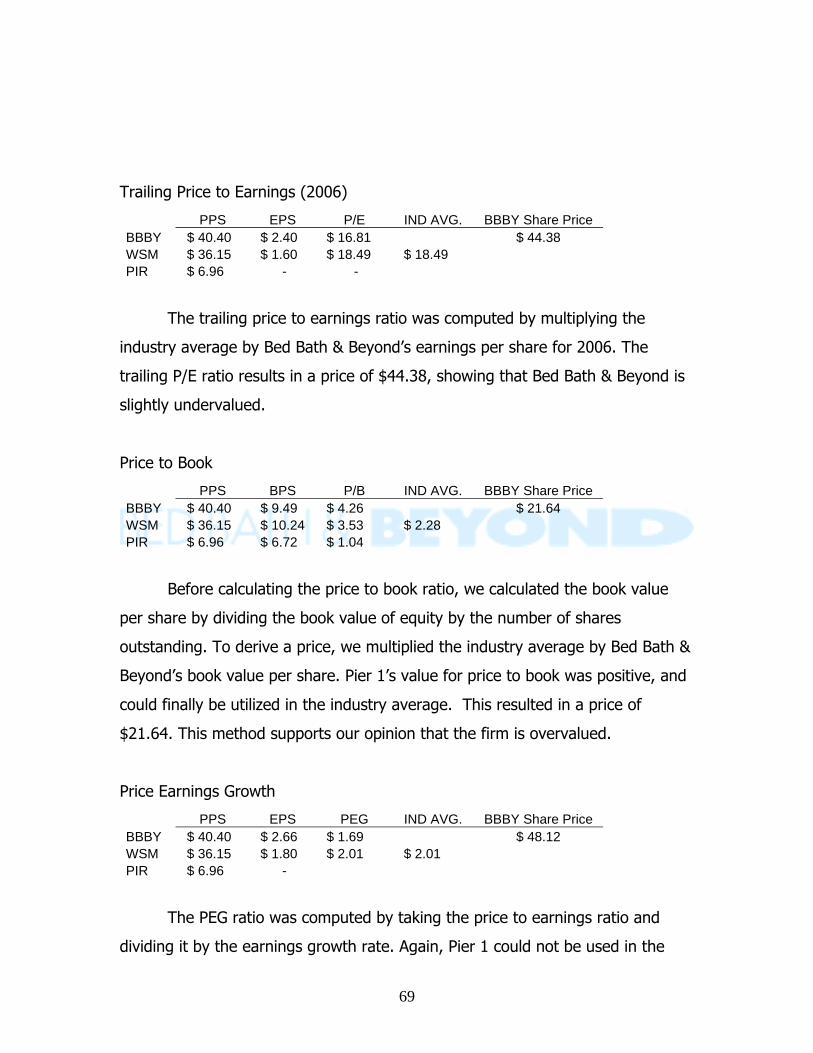
69
Trailing Price to Earnings (2006)
PPS EPS P/E IND AVG. BBBY Share Price BBBY $ 40.40 $ 2.40 $ 16.81 $ 44.38 WSM $ 36.15 $ 1.60 $ 18.49 $ 18.49 PIR $ 6.96 - -
The trailing price to earnings ratio was computed by multiplying the
industry average by Bed Bath & Beyond’s earnings per share for 2006. The
trailing P/E ratio results in a price of $44.38, showing that Bed Bath & Beyond is
slightly undervalued.
Price to Book
PPS BPS P/B IND AVG. BBBY Share Price BBBY $ 40.40 $ 9.49 $ 4.26 $ 21.64 WSM $ 36.15 $ 10.24 $ 3.53 $ 2.28 PIR $ 6.96 $ 6.72 $ 1.04
Before calculating the price to book ratio, we calculated the book value
per share by dividing the book value of equity by the number of shares
outstanding. To derive a price, we multiplied the industry average by Bed Bath &
Beyond’s book value per share. Pier 1’s value for price to book was positive, and
could finally be utilized in the industry average. This resulted in a price of
$21.64. This method supports our opinion that the firm is overvalued.
Price Earnings Growth
PPS EPS PEG IND AVG. BBBY Share Price BBBY $ 40.40 $ 2.66 $ 1.69 $ 48.12 WSM $ 36.15 $ 1.80 $ 2.01 $ 2.01 PIR $ 6.96 -
The PEG ratio was computed by taking the price to earnings ratio and
dividing it by the earnings growth rate. Again, Pier 1 could not be used in the
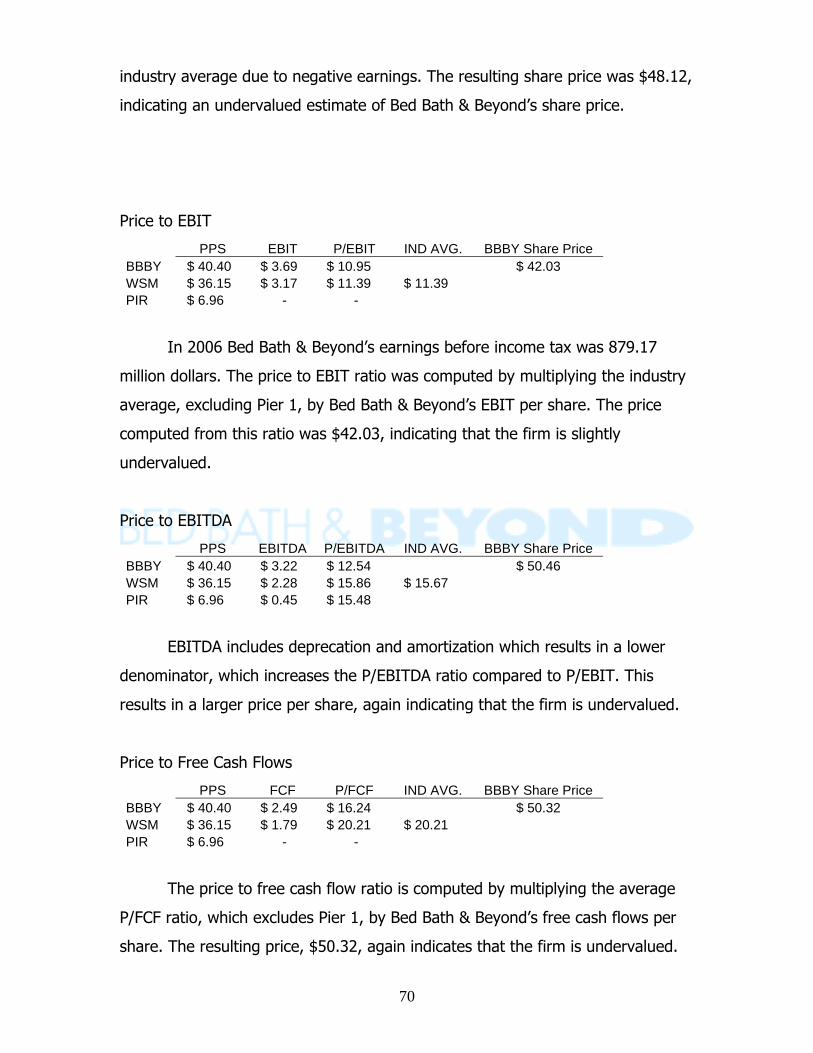
70
industry average due to negative earnings. The resulting share price was $48.12,
indicating an undervalued estimate of Bed Bath & Beyond’s share price.
Price to EBIT
PPS EBIT P/EBIT IND AVG. BBBY Share Price BBBY $ 40.40 $ 3.69 $ 10.95 $ 42.03 WSM $ 36.15 $ 3.17 $ 11.39 $ 11.39 PIR $ 6.96 - -
In 2006 Bed Bath & Beyond’s earnings before income tax was 879.17
million dollars. The price to EBIT ratio was computed by multiplying the industry
average, excluding Pier 1, by Bed Bath & Beyond’s EBIT per share. The price
computed from this ratio was $42.03, indicating that the firm is slightly
undervalued.
Price to EBITDA
PPS EBITDA P/EBITDA IND AVG. BBBY Share Price BBBY $ 40.40 $ 3.22 $ 12.54 $ 50.46 WSM $ 36.15 $ 2.28 $ 15.86 $ 15.67 PIR $ 6.96 $ 0.45 $ 15.48
EBITDA includes deprecation and amortization which results in a lower
denominator, which increases the P/EBITDA ratio compared to P/EBIT. This
results in a larger price per share, again indicating that the firm is undervalued.
Price to Free Cash Flows
PPS FCF P/FCF IND AVG. BBBY Share Price BBBY $ 40.40 $ 2.49 $ 16.24 $ 50.32 WSM $ 36.15 $ 1.79 $ 20.21 $ 20.21 PIR $ 6.96 - -
The price to free cash flow ratio is computed by multiplying the average
P/FCF ratio, which excludes Pier 1, by Bed Bath & Beyond’s free cash flows per
share. The resulting price, $50.32, again indicates that the firm is undervalued.
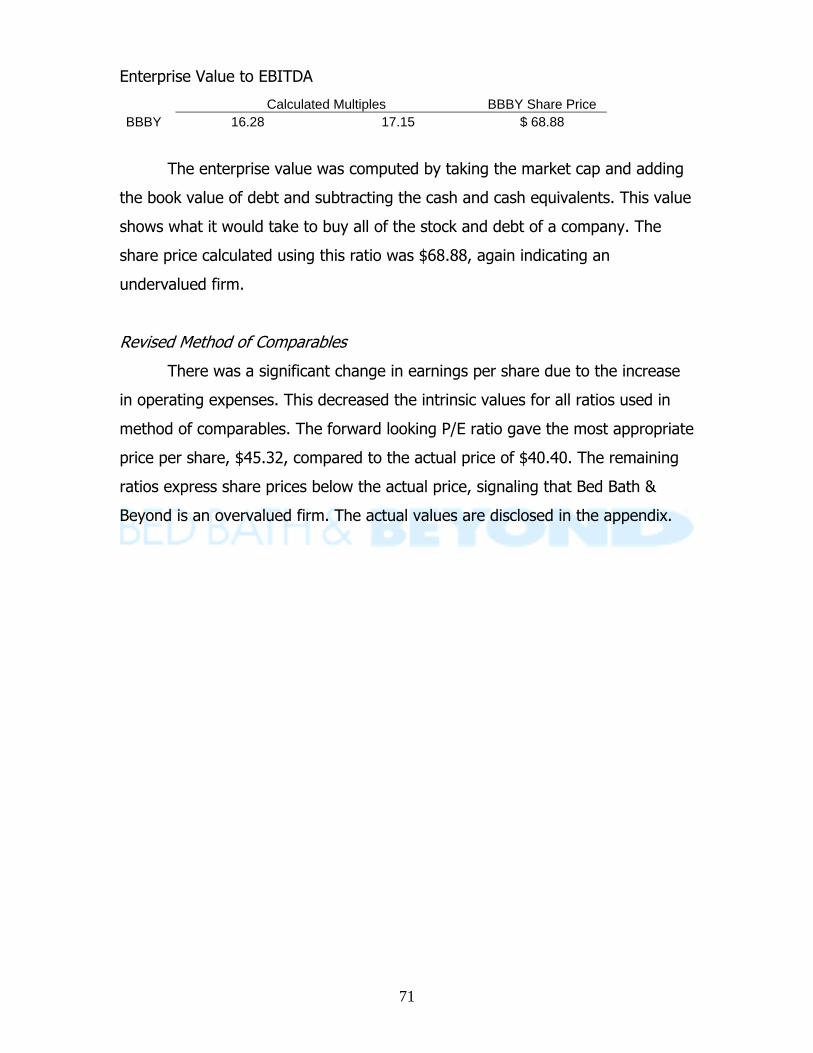
71
Enterprise Value to EBITDA
Calculated Multiples BBBY Share Price BBBY 16.28 17.15 $ 68.88
The enterprise value was computed by taking the market cap and adding
the book value of debt and subtracting the cash and cash equivalents. This value
shows what it would take to buy all of the stock and debt of a company. The
share price calculated using this ratio was $68.88, again indicating an
undervalued firm.
Revised Method of Comparables
There was a significant change in earnings per share due to the increase
in operating expenses. This decreased the intrinsic values for all ratios used in
method of comparables. The forward looking P/E ratio gave the most appropriate
price per share, $45.32, compared to the actual price of $40.40. The remaining
ratios express share prices below the actual price, signaling that Bed Bath &
Beyond is an overvalued firm. The actual values are disclosed in the appendix.
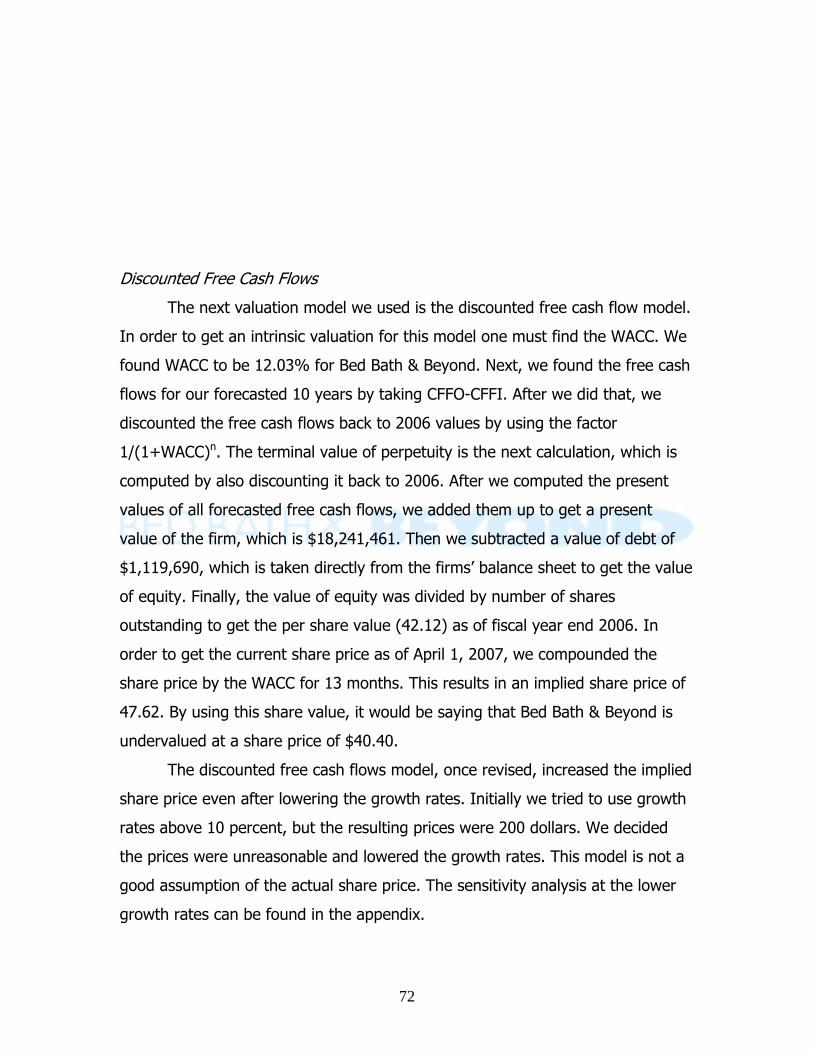
72
Discounted Free Cash Flows
The next valuation model we used is the discounted free cash flow model.
In order to get an intrinsic valuation for this model one must find the WACC. We
found WACC to be 12.03% for Bed Bath & Beyond. Next, we found the free cash
flows for our forecasted 10 years by taking CFFO-CFFI. After we did that, we
discounted the free cash flows back to 2006 values by using the factor
1/(1+WACC)n. The terminal value of perpetuity is the next calculation, which is
computed by also discounting it back to 2006. After we computed the present
values of all forecasted free cash flows, we added them up to get a present
value of the firm, which is $18,241,461. Then we subtracted a value of debt of
$1,119,690, which is taken directly from the firms’ balance sheet to get the value
of equity. Finally, the value of equity was divided by number of shares
outstanding to get the per share value (42.12) as of fiscal year end 2006. In
order to get the current share price as of April 1, 2007, we compounded the
share price by the WACC for 13 months. This results in an implied share price of
47.62. By using this share value, it would be saying that Bed Bath & Beyond is
undervalued at a share price of $40.40.
The discounted free cash flows model, once revised, increased the implied
share price even after lowering the growth rates. Initially we tried to use growth
rates above 10 percent, but the resulting prices were 200 dollars. We decided
the prices were unreasonable and lowered the growth rates. This model is not a
good assumption of the actual share price. The sensitivity analysis at the lower
growth rates can be found in the appendix.
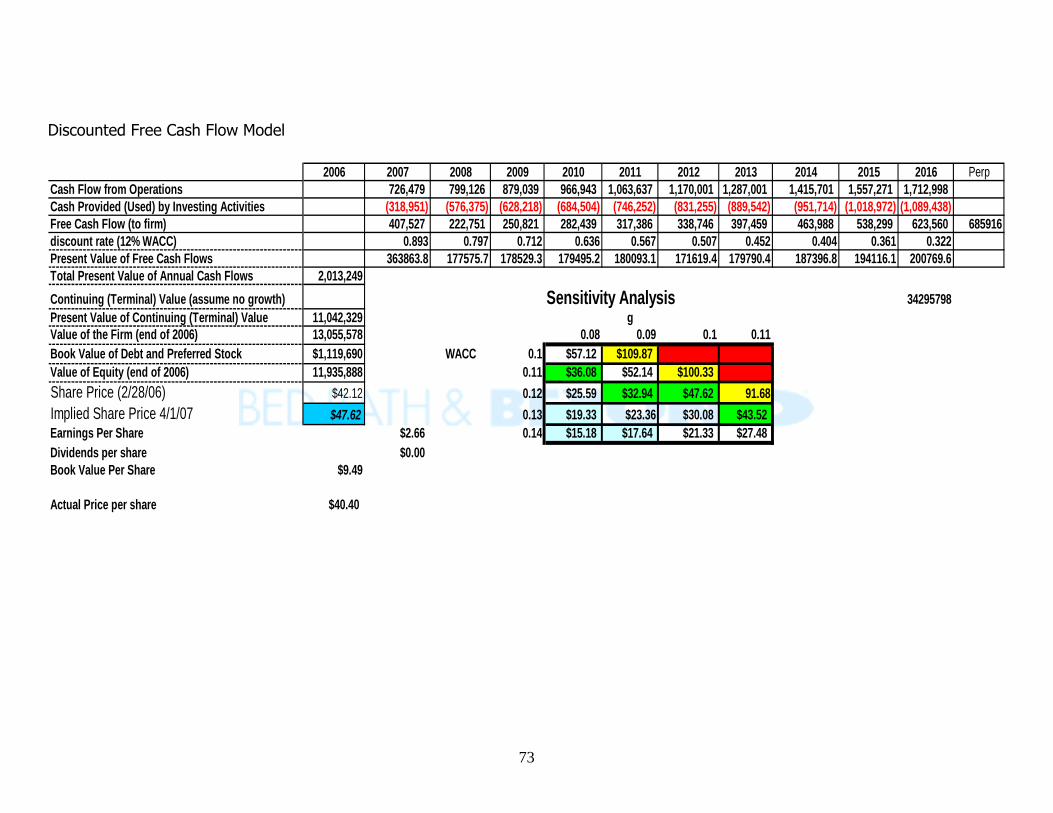
73
Discounted Free Cash Flow Model
2006 2007 2008 2009 2010 2011 2012 2013 2014 2015 2016 PerpCash Flow from Operations 726,479 799,126 879,039 966,943 1,063,637 1,170,001 1,287,001 1,415,701 1,557,271 1,712,998Cash Provided (Used) by Investing Activities (318,951) (576,375) (628,218) (684,504) (746,252) (831,255) (889,542) (951,714) (1,018,972) (1,089,438)Free Cash Flow (to firm) 407,527 222,751 250,821 282,439 317,386 338,746 397,459 463,988 538,299 623,560 685916discount rate (12% WACC) 0.893 0.797 0.712 0.636 0.567 0.507 0.452 0.404 0.361 0.322Present Value of Free Cash Flows 363863.8 177575.7 178529.3 179495.2 180093.1 171619.4 179790.4 187396.8 194116.1 200769.6Total Present Value of Annual Cash Flows 2,013,249Continuing (Terminal) Value (assume no growth) Sensitivity Analysis 34295798Present Value of Continuing (Terminal) Value 11,042,329 gValue of the Firm (end of 2006) 13,055,578 0.08 0.09 0.1 0.11Book Value of Debt and Preferred Stock $1,119,690 WACC 0.1 $57.12 $109.87Value of Equity (end of 2006) 11,935,888 0.11 $36.08 $52.14 $100.33Share Price (2/28/06) $42.12 0.12 $25.59 $32.94 $47.62 91.68Implied Share Price 4/1/07 $47.62 0.13 $19.33 $23.36 $30.08 $43.52Earnings Per Share $2.66 0.14 $15.18 $17.64 $21.33 $27.48Dividends per share $0.00Book Value Per Share $9.49
Actual Price per share $40.40
74
Residual Income
Instead of using WACC, the residual income model uses cost of equity
(ke) as the discount rate. We found residual income by adding net income to
book value of equity, then subtracting dividends of zero. The first step results in
the ending book value of equity, which is carried to the next years’ beginning
book value of equity (BVE). Next, we found the normal income by taking the
beginning BVE and multiplying it by the discount rate. To get residual income,
we subtracted normal income from net income. The next step was to calculate
the present value of residual income by multiplying residual income and the
present value factor of 1/(1+Ke)n. After finding the total present value of residual
income by adding up the discounted values, we added the discounted perpetuity
back to the present at a negative growth rate. The negative growth rate used in
the residual income model is necessary because it will bring the negative residual
income values back to zero. How quickly these values get back to zero depend
on the growth rate, which is shown in the sensitivity analysis.
The residual income model resulted in less accurate valuations once
capital lease adjustments were made to the financial statements. The decrease
in net income also decreased residual income each year. These amounts were
discounted back using a 13 percent cost of equity, and resulted in a share price
on April 1, 2007 of $15.22. This change was not significant enough to alter our
opinions considering the overvalued share price. The actual model reflecting the
adjustments for the capital lease can be found in the appendix.
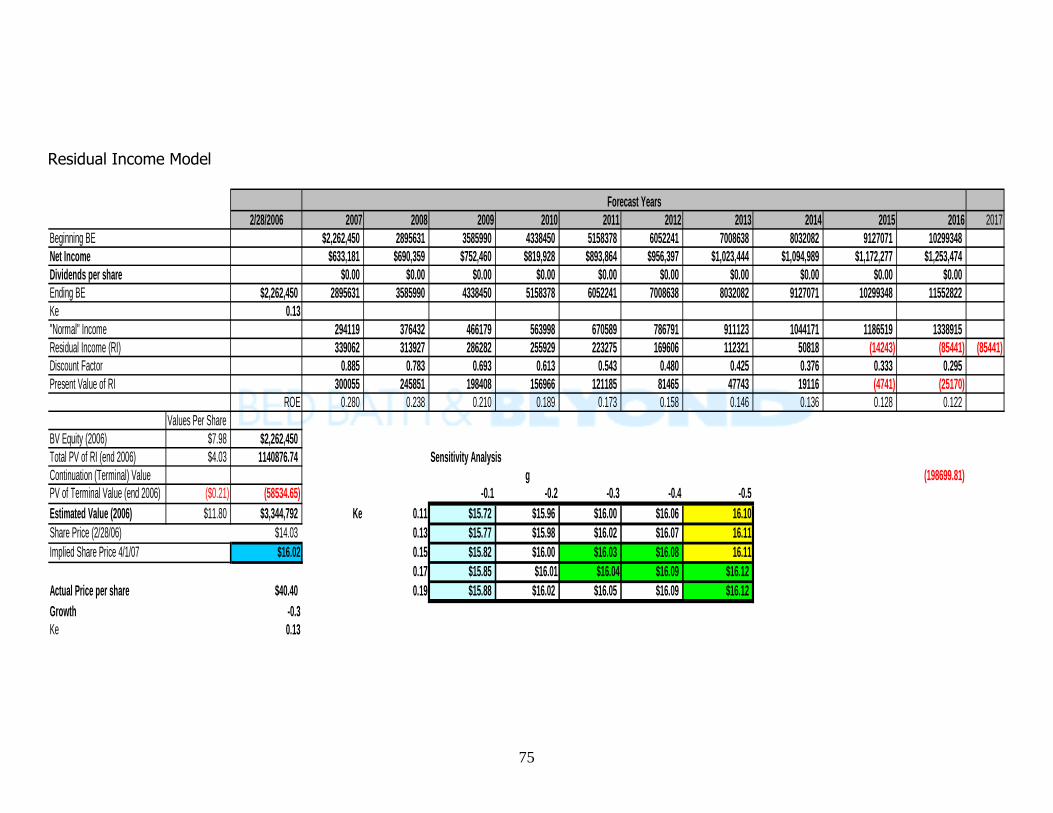
75
Residual Income Model
2/28/2006 2007 2008 2009 2010 2011 2012 2013 2014 2015 2016 2017Beginning BE $2,262,450 2895631 3585990 4338450 5158378 6052241 7008638 8032082 9127071 10299348Net Income $633,181 $690,359 $752,460 $819,928 $893,864 $956,397 $1,023,444 $1,094,989 $1,172,277 $1,253,474Dividends per share $0.00 $0.00 $0.00 $0.00 $0.00 $0.00 $0.00 $0.00 $0.00 $0.00Ending BE $2,262,450 2895631 3585990 4338450 5158378 6052241 7008638 8032082 9127071 10299348 11552822Ke 0.13"Normal" Income 294119 376432 466179 563998 670589 786791 911123 1044171 1186519 1338915Residual Income (RI) 339062 313927 286282 255929 223275 169606 112321 50818 (14243) (85441) (85441)Discount Factor 0.885 0.783 0.693 0.613 0.543 0.480 0.425 0.376 0.333 0.295Present Value of RI 300055 245851 198408 156966 121185 81465 47743 19116 (4741) (25170)
ROE 0.280 0.238 0.210 0.189 0.173 0.158 0.146 0.136 0.128 0.122Values Per Share
BV Equity (2006) $7.98 $2,262,450Total PV of RI (end 2006) $4.03 1140876.74 Sensitivity AnalysisContinuation (Terminal) Value g (198699.81)PV of Terminal Value (end 2006) ($0.21) (58534.65) -0.1 -0.2 -0.3 -0.4 -0.5Estimated Value (2006) $11.80 $3,344,792 Ke 0.11 $15.72 $15.96 $16.00 $16.06 16.10Share Price (2/28/06) $14.03 0.13 $15.77 $15.98 $16.02 $16.07 16.11Implied Share Price 4/1/07 $16.02 0.15 $15.82 $16.00 $16.03 $16.08 16.11
0.17 $15.85 $16.01 $16.04 $16.09 $16.12Actual Price per share $40.40 0.19 $15.88 $16.02 $16.05 $16.09 $16.12Growth -0.3Ke 0.13
Forecast Years
76
Abnormal Earnings Growth Model
The abnormal earnings are computed by adding the dividend
reinvestment rate to net income or earnings per share, and then subtracting the
firm’s normal earnings. Bed Bath & Beyond does not have a D.R.I.P. income
because they do not pay dividends. To get normal earnings you multiply the
previous year’s net income by one plus the cost of equity. This model shows the
increase in earnings year by year with respect to equity.
According to the AEG model, the implied share price was $5.63 with an 11
percent cost of equity and a growth rate of negative 15 percent. Based on this
analysis the firm is overvalued. At the highest growth rate and highest cost of
equity, the resulting value was $6.73. This was the closest to the actual share
price of $40.40. Since this ratio is heavily based on dividends paid out, the model
is not as accurate when valuing a non dividend paying company.
The revised AEG model reflecting the capitalization of operating leases,
resulted in a lower valuation than the original model. The cost of equity
remained at 13 percent, but at a negative 25 percent growth rate the model
valued the share price at $4.54. The results of the model are in the appendix.
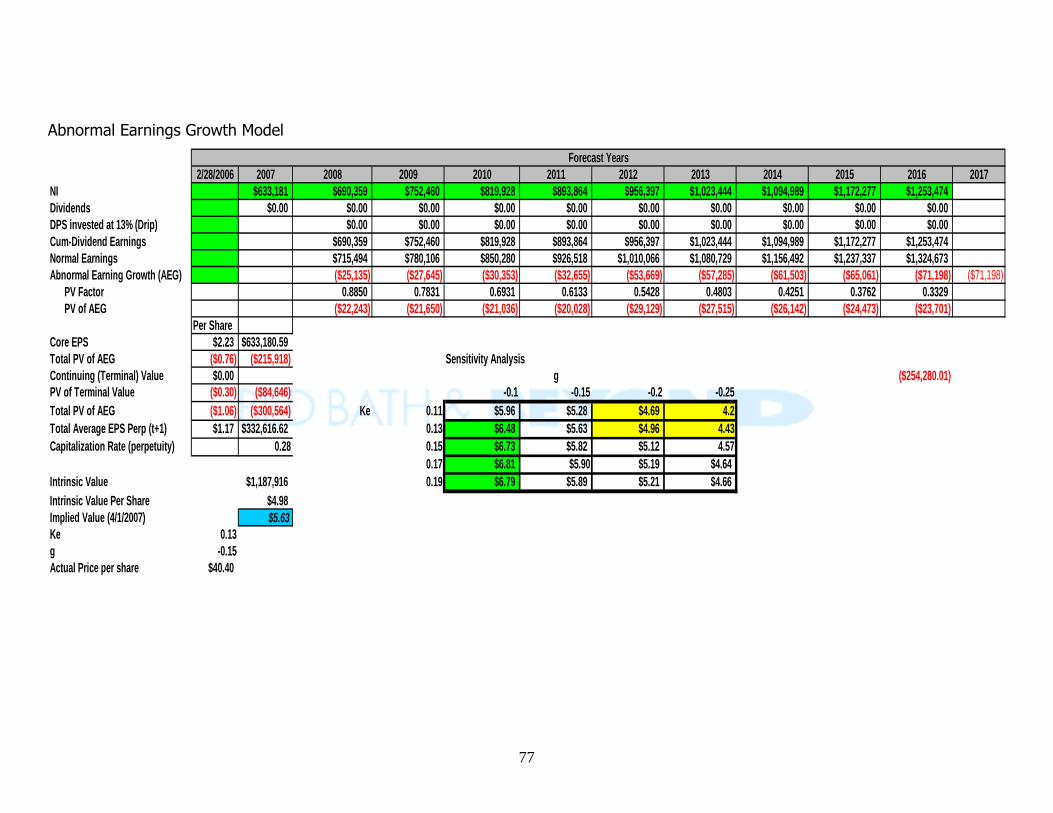
77
Abnormal Earnings Growth Model
2/28/2006 2007 2008 2009 2010 2011 2012 2013 2014 2015 2016 2017NI $633,181 $690,359 $752,460 $819,928 $893,864 $956,397 $1,023,444 $1,094,989 $1,172,277 $1,253,474Dividends $0.00 $0.00 $0.00 $0.00 $0.00 $0.00 $0.00 $0.00 $0.00 $0.00DPS invested at 13% (Drip) $0.00 $0.00 $0.00 $0.00 $0.00 $0.00 $0.00 $0.00 $0.00Cum-Dividend Earnings $690,359 $752,460 $819,928 $893,864 $956,397 $1,023,444 $1,094,989 $1,172,277 $1,253,474Normal Earnings $715,494 $780,106 $850,280 $926,518 $1,010,066 $1,080,729 $1,156,492 $1,237,337 $1,324,673Abnormal Earning Growth (AEG) ($25,135) ($27,645) ($30,353) ($32,655) ($53,669) ($57,285) ($61,503) ($65,061) ($71,198) ($71,198)
PV Factor 0.8850 0.7831 0.6931 0.6133 0.5428 0.4803 0.4251 0.3762 0.3329PV of AEG ($22,243) ($21,650) ($21,036) ($20,028) ($29,129) ($27,515) ($26,142) ($24,473) ($23,701)
Per ShareCore EPS $2.23 $633,180.59Total PV of AEG ($0.76) ($215,918) Sensitivity AnalysisContinuing (Terminal) Value $0.00 g ($254,280.01)PV of Terminal Value ($0.30) ($84,646) -0.1 -0.15 -0.2 -0.25Total PV of AEG ($1.06) ($300,564) Ke 0.11 $5.96 $5.28 $4.69 4.2Total Average EPS Perp (t+1) $1.17 $332,616.62 0.13 $6.48 $5.63 $4.96 4.43Capitalization Rate (perpetuity) 0.28 0.15 $6.73 $5.82 $5.12 4.57
0.17 $6.81 $5.90 $5.19 $4.64Intrinsic Value $1,187,916 0.19 $6.79 $5.89 $5.21 $4.66Intrinsic Value Per Share $4.98Implied Value (4/1/2007) $5.63Ke 0.13g -0.15Actual Price per share $40.40
Forecast Years
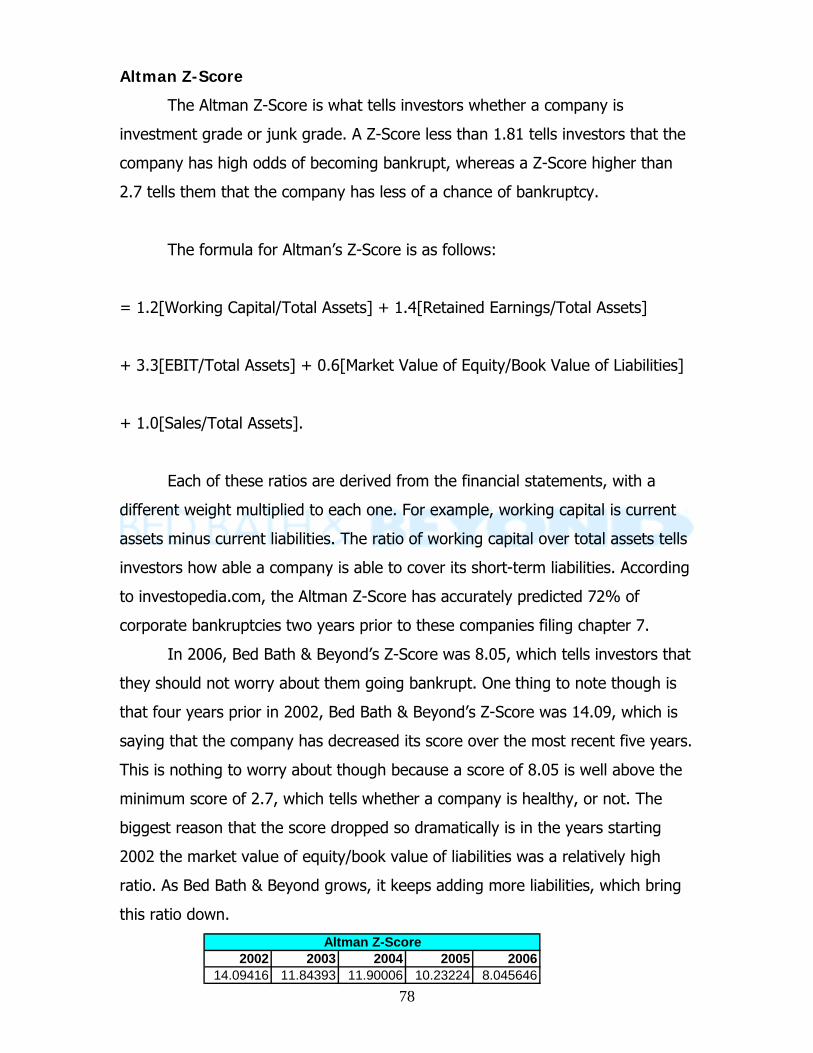
78
Altman Z-Score
The Altman Z-Score is what tells investors whether a company is
investment grade or junk grade. A Z-Score less than 1.81 tells investors that the
company has high odds of becoming bankrupt, whereas a Z-Score higher than
2.7 tells them that the company has less of a chance of bankruptcy.
The formula for Altman’s Z-Score is as follows:
= 1.2[Working Capital/Total Assets] + 1.4[Retained Earnings/Total Assets]
+ 3.3[EBIT/Total Assets] + 0.6[Market Value of Equity/Book Value of Liabilities]
+ 1.0[Sales/Total Assets].
Each of these ratios are derived from the financial statements, with a
different weight multiplied to each one. For example, working capital is current
assets minus current liabilities. The ratio of working capital over total assets tells
investors how able a company is able to cover its short-term liabilities. According
to investopedia.com, the Altman Z-Score has accurately predicted 72% of
corporate bankruptcies two years prior to these companies filing chapter 7.
In 2006, Bed Bath & Beyond’s Z-Score was 8.05, which tells investors that
they should not worry about them going bankrupt. One thing to note though is
that four years prior in 2002, Bed Bath & Beyond’s Z-Score was 14.09, which is
saying that the company has decreased its score over the most recent five years.
This is nothing to worry about though because a score of 8.05 is well above the
minimum score of 2.7, which tells whether a company is healthy, or not. The
biggest reason that the score dropped so dramatically is in the years starting
2002 the market value of equity/book value of liabilities was a relatively high
ratio. As Bed Bath & Beyond grows, it keeps adding more liabilities, which bring
this ratio down.
2002 2003 2004 2005 200614.09416 11.84393 11.90006 10.23224 8.045646
Altman Z-Score
79
Analyst Recommendation
After a thorough examination of the industry, accounting policies, financial
ratios, and valuation models, Bed Bath & Beyond is an obvious leader in the
home furnishings industry. Their ability to drive down operating costs, maintain
sufficient levels of inventory, and increase their market share, sets them apart in
the industry. However, several discrepancies in their accounting policies and
financial statements lead us to believe that there are more risks associated with
Bed Bath & Beyond then once perceived. These discrepancies originated from
the use of operating leases instead of capital leases, and a missing link between
the growth in net income and value of the firm. These discrepancies had a
negative effect on all of our valuation models, and resulted in distorted values
when compared to the April 1 observed share price. According to the valuation
models, the abnormal earnings growth model gave the lowest value at $5.63 per
share. The closest values came from the method of comparables and the
discounted free cash flow method, which are perceived to be less realistic than
the other models. Two of models state that Bed Bath & Beyond are overvalued,
whereas two of the models state the opposite. Due to discrepancies found, we
believe that Bed Bath & Beyond should be valued lower than the observed
market price of $40.40. We suggest that investors sell their holdings in this
company.
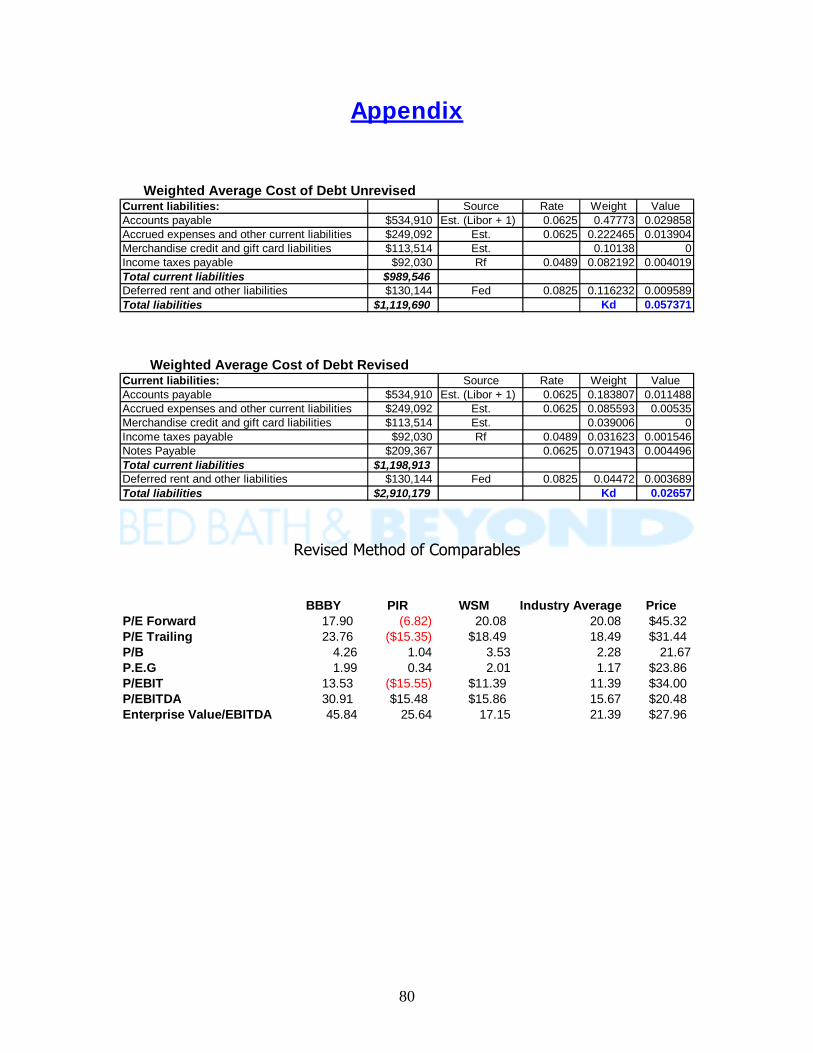
80
Appendix
Current liabilities: Source Rate Weight ValueAccounts payable $534,910 Est. (Libor + 1) 0.0625 0.47773 0.029858Accrued expenses and other current liabilities $249,092 Est. 0.0625 0.222465 0.013904Merchandise credit and gift card liabilities $113,514 Est. 0.10138 0Income taxes payable $92,030 Rf 0.0489 0.082192 0.004019Total current liabilities $989,546Deferred rent and other liabilities $130,144 Fed 0.0825 0.116232 0.009589Total liabilities $1,119,690 Kd 0.057371
Weighted Average Cost of Debt Unrevised
Current liabilities: Source Rate Weight ValueAccounts payable $534,910 Est. (Libor + 1) 0.0625 0.183807 0.011488Accrued expenses and other current liabilities $249,092 Est. 0.0625 0.085593 0.00535Merchandise credit and gift card liabilities $113,514 Est. 0.039006 0Income taxes payable $92,030 Rf 0.0489 0.031623 0.001546Notes Payable $209,367 0.0625 0.071943 0.004496Total current liabilities $1,198,913Deferred rent and other liabilities $130,144 Fed 0.0825 0.04472 0.003689Total liabilities $2,910,179 Kd 0.02657
Weighted Average Cost of Debt Revised
Revised Method of Comparables
BBBY PIR WSM Industry Average PriceP/E Forward 17.90 (6.82) 20.08 20.08 $45.32P/E Trailing 23.76 ($15.35) $18.49 18.49 $31.44P/B 4.26 1.04 3.53 2.28 21.67P.E.G 1.99 0.34 2.01 1.17 $23.86P/EBIT 13.53 ($15.55) $11.39 11.39 $34.00P/EBITDA 30.91 $15.48 $15.86 15.67 $20.48Enterprise Value/EBITDA 45.84 25.64 17.15 21.39 $27.96
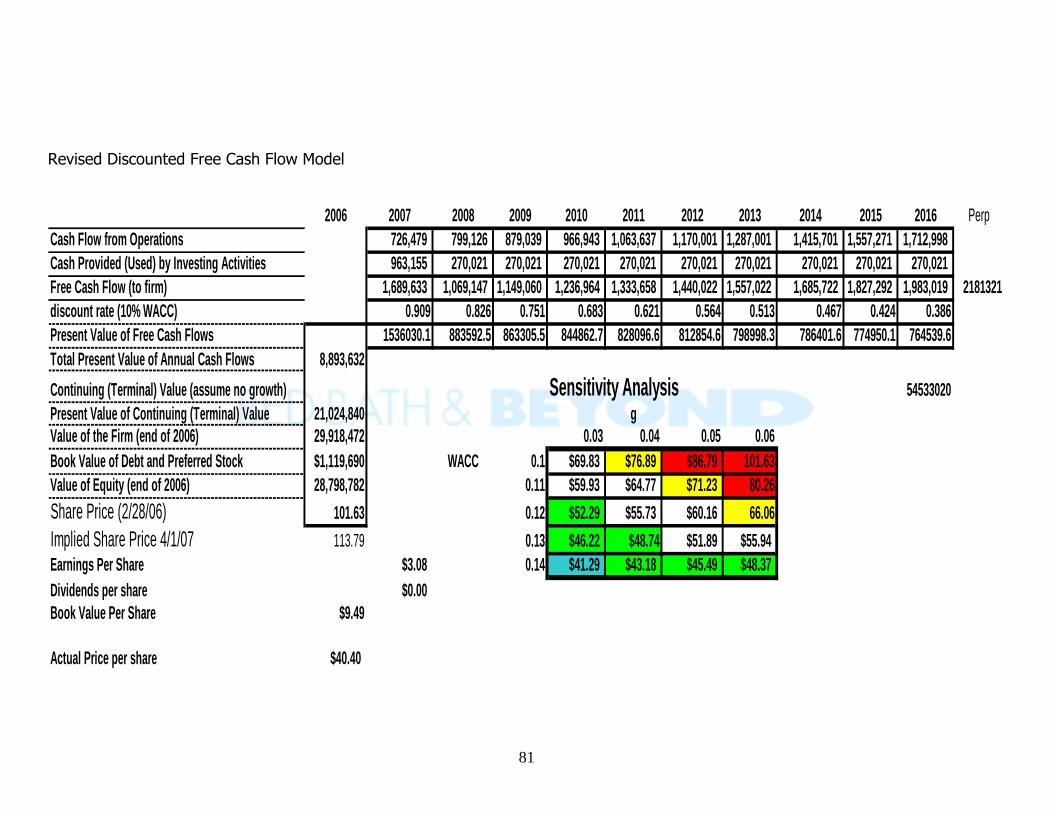
81
Revised Discounted Free Cash Flow Model
2006 2007 2008 2009 2010 2011 2012 2013 2014 2015 2016 PerpCash Flow from Operations 726,479 799,126 879,039 966,943 1,063,637 1,170,001 1,287,001 1,415,701 1,557,271 1,712,998Cash Provided (Used) by Investing Activities 963,155 270,021 270,021 270,021 270,021 270,021 270,021 270,021 270,021 270,021Free Cash Flow (to firm) 1,689,633 1,069,147 1,149,060 1,236,964 1,333,658 1,440,022 1,557,022 1,685,722 1,827,292 1,983,019 2181321discount rate (10% WACC) 0.909 0.826 0.751 0.683 0.621 0.564 0.513 0.467 0.424 0.386Present Value of Free Cash Flows 1536030.1 883592.5 863305.5 844862.7 828096.6 812854.6 798998.3 786401.6 774950.1 764539.6Total Present Value of Annual Cash Flows 8,893,632Continuing (Terminal) Value (assume no growth) Sensitivity Analysis 54533020Present Value of Continuing (Terminal) Value 21,024,840 gValue of the Firm (end of 2006) 29,918,472 0.03 0.04 0.05 0.06Book Value of Debt and Preferred Stock $1,119,690 WACC 0.1 $69.83 $76.89 $86.79 101.63Value of Equity (end of 2006) 28,798,782 0.11 $59.93 $64.77 $71.23 80.26Share Price (2/28/06) 101.63 0.12 $52.29 $55.73 $60.16 66.06Implied Share Price 4/1/07 113.79 0.13 $46.22 $48.74 $51.89 $55.94Earnings Per Share $3.08 0.14 $41.29 $43.18 $45.49 $48.37Dividends per share $0.00Book Value Per Share $9.49
Actual Price per share $40.40
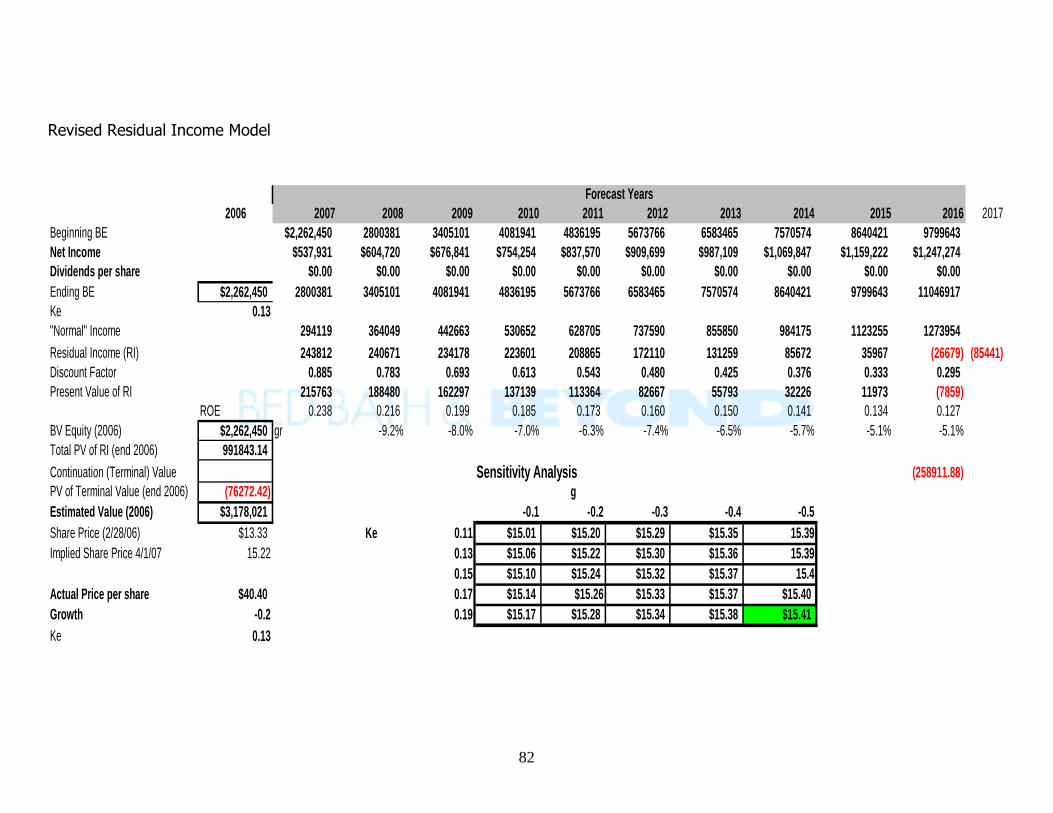
82
Revised Residual Income Model
2006 2007 2008 2009 2010 2011 2012 2013 2014 2015 2016 2017Beginning BE $2,262,450 2800381 3405101 4081941 4836195 5673766 6583465 7570574 8640421 9799643Net Income $537,931 $604,720 $676,841 $754,254 $837,570 $909,699 $987,109 $1,069,847 $1,159,222 $1,247,274Dividends per share $0.00 $0.00 $0.00 $0.00 $0.00 $0.00 $0.00 $0.00 $0.00 $0.00Ending BE $2,262,450 2800381 3405101 4081941 4836195 5673766 6583465 7570574 8640421 9799643 11046917Ke 0.13"Normal" Income 294119 364049 442663 530652 628705 737590 855850 984175 1123255 1273954Residual Income (RI) 243812 240671 234178 223601 208865 172110 131259 85672 35967 (26679) (85441)Discount Factor 0.885 0.783 0.693 0.613 0.543 0.480 0.425 0.376 0.333 0.295Present Value of RI 215763 188480 162297 137139 113364 82667 55793 32226 11973 (7859)
ROE 0.238 0.216 0.199 0.185 0.173 0.160 0.150 0.141 0.134 0.127BV Equity (2006) $2,262,450 gr -9.2% -8.0% -7.0% -6.3% -7.4% -6.5% -5.7% -5.1% -5.1%Total PV of RI (end 2006) 991843.14Continuation (Terminal) Value Sensitivity Analysis (258911.88)PV of Terminal Value (end 2006) (76272.42) gEstimated Value (2006) $3,178,021 -0.1 -0.2 -0.3 -0.4 -0.5Share Price (2/28/06) $13.33 Ke 0.11 $15.01 $15.20 $15.29 $15.35 15.39Implied Share Price 4/1/07 15.22 0.13 $15.06 $15.22 $15.30 $15.36 15.39
0.15 $15.10 $15.24 $15.32 $15.37 15.4Actual Price per share $40.40 0.17 $15.14 $15.26 $15.33 $15.37 $15.40Growth -0.2 0.19 $15.17 $15.28 $15.34 $15.38 $15.41Ke 0.13
Forecast Years
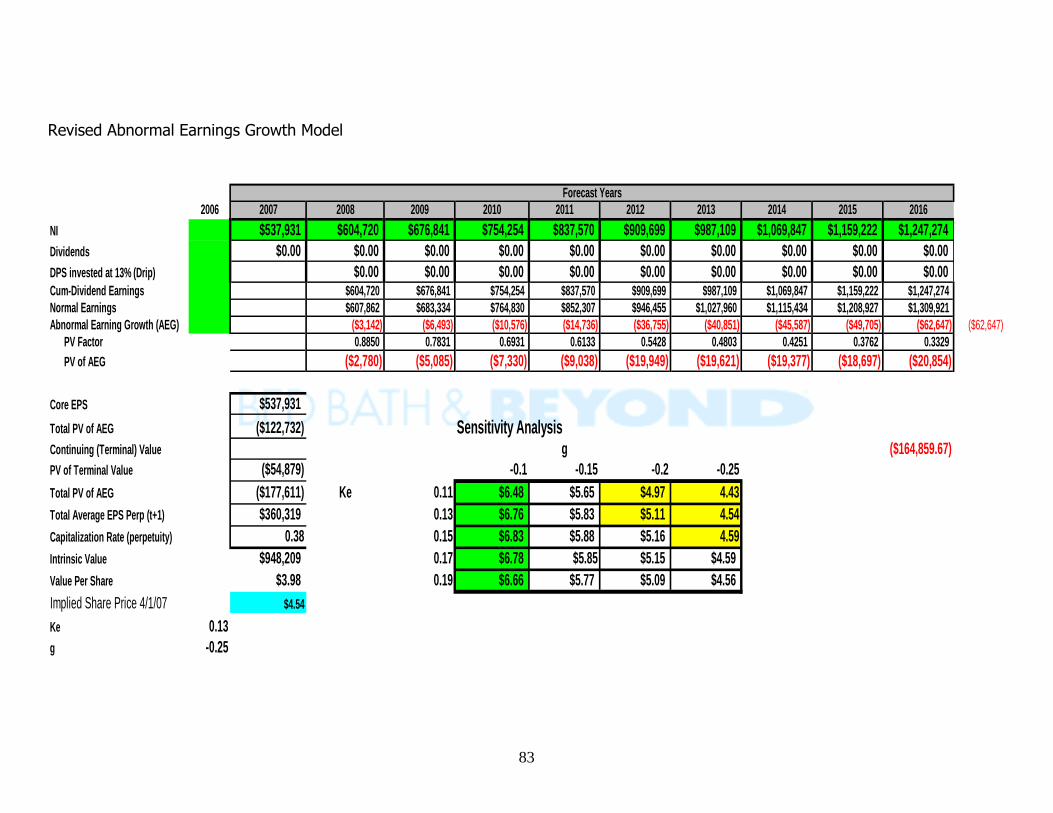
83
Revised Abnormal Earnings Growth Model
2006 2007 2008 2009 2010 2011 2012 2013 2014 2015 2016NI $537,931 $604,720 $676,841 $754,254 $837,570 $909,699 $987,109 $1,069,847 $1,159,222 $1,247,274Dividends $0.00 $0.00 $0.00 $0.00 $0.00 $0.00 $0.00 $0.00 $0.00 $0.00DPS invested at 13% (Drip) $0.00 $0.00 $0.00 $0.00 $0.00 $0.00 $0.00 $0.00 $0.00Cum-Dividend Earnings $604,720 $676,841 $754,254 $837,570 $909,699 $987,109 $1,069,847 $1,159,222 $1,247,274Normal Earnings $607,862 $683,334 $764,830 $852,307 $946,455 $1,027,960 $1,115,434 $1,208,927 $1,309,921Abnormal Earning Growth (AEG) ($3,142) ($6,493) ($10,576) ($14,736) ($36,755) ($40,851) ($45,587) ($49,705) ($62,647) ($62,647)
PV Factor 0.8850 0.7831 0.6931 0.6133 0.5428 0.4803 0.4251 0.3762 0.3329PV of AEG ($2,780) ($5,085) ($7,330) ($9,038) ($19,949) ($19,621) ($19,377) ($18,697) ($20,854)
Core EPS $537,931Total PV of AEG ($122,732) Sensitivity AnalysisContinuing (Terminal) Value g ($164,859.67)PV of Terminal Value ($54,879) -0.1 -0.15 -0.2 -0.25Total PV of AEG ($177,611) Ke 0.11 $6.48 $5.65 $4.97 4.43Total Average EPS Perp (t+1) $360,319 0.13 $6.76 $5.83 $5.11 4.54Capitalization Rate (perpetuity) 0.38 0.15 $6.83 $5.88 $5.16 4.59Intrinsic Value $948,209 0.17 $6.78 $5.85 $5.15 $4.59Value Per Share $3.98 0.19 $6.66 $5.77 $5.09 $4.56Implied Share Price 4/1/07 $4.54Ke 0.13g -0.25
Forecast Years
84
Works Cited Bed Bath & Beyond 2006 10-K
Linens-N-Things 2006 10-K
Pier 1 2006 10-K
Williams-Sonoma 2006 10-K
“Operating versus Capital Lease.”
http://pages.stern.nyu.edu/~adamodar/new_home_page/accprimer/lease.
htm
Palepu, Krishna G., Paul M. Healy, and Victor L. Bernard. Business Analysis &
Valuation: Using Financial Statements. Ohio: South-Western, 2004
“Cash Flow from Operations Ratio.”
Http://www.valuecasedmanagement.net/methods_cash_flow_from_operat
ions.html
Moore, Mark. Vann Corporation Handout. April 3, 2007.
Investopedia. April 3, 2007. http://investopedia.com
About.com. April 3, 2007.
http://beginnersinvest.about.com/cs/investinglesson/l/blassetturnover.htm
Australian Financial Institution. April 3, 2007.
www.anz.com/australia/business/calculator/businessbenchmark/return.asp
Wikipedia. April 3, 2007. http://en.wikipedia.org/wiki/return_on_equity
Entrepreneur.com. April 3, 2007.
http://entrepreneur.com/encyclopedia/term/82208.html


![Hino Torque Spring2007[1]](https://img.pdfslide.us/doc/110x75/5517c5e049795947228b4b3e/hino-torque-spring20071.jpg)
