Embed Size (px)
Citation preview
I
Value Stream Mapping of
Atlas Copco CTO India MG202X: Master Degree Project in Industrial Engineering and Management
2012-09-01 KTH, Royal Institute of Technology Shirish Kumar & Abel Yoseph
Supervisors: Anand Dixit, Atlas Copco & Farazee Asif, KTH

II
III
Acknowledgements We would like to express our gratitude towards Atlas Copco and the Royal Institute of
Technology for providing us with the opportunity to pursue our Master Thesis.
We would especially like to thank our supervisor, Farazee Asif, from the department of
Production Engineering, for his patient guidance, continuous assistance and constructive
critique along the study, the Lean Management Institute of India for excellent theoretical
and practical knowledge sharing, and Mr. Anand Dixit, CTO Flow Team Manager of Atlas
Copco, for his immense support and supervision.
We also wish to thank the following Atlas Copco staff for various contributions:
• Sudhir Deshmukh, Operations Manager
• Suresh Magdum, Quality Manager
• Deepak Gangurde, Assembly Manager
• Sanjay Nere, Machine Shop Planner
• Yogesh Chavan, HR Manager
• Tom Reeder, Engineering Manager
• Olof Sjöstrand, IMS Coordinator
• Per-Anders Karlsson, Technical Development Handheld Equipment
• Olof Östensson, Technical Responsible Pneumatic Breakers
We also take this time to show our appreciation of Mr. Velu and the guest house staff for
comforting our stay in Nasik.
Finally we wish to thank all operators of CTO for their patience and assistance throughout
this study.
Shirish Kumar & Abel Yoseph
IV
Abstract The Construction Tools & Organization (CTO) division of Atlas Copco India is growing and
demonstrating positive business results, however, it is faced with challenges due to rapid
growth. The production lead times are 25-30% longer than its sister factory in Kalmar, which
causes excess inventory and unnecessary costs. There is a need for investigating how lead
times can be reduced.
The aim of this study was to develop suggestions on how production lead times can be
reduced. The study used concepts of Lean Management and the Value Stream Mapping tool
to analyze and examine value and non-value adding activities, to reduce wasteful
operations, to improve quality within processes and to simplify and standardize working
methods. Delimitations were set to investigate one single product component and product
type; the CP1230 Breaker and CP1230 cylinder. Research approach was of deductive
method, information gathering was done in the form of literature review, personal
observations and interviews, i.e. qualitative and quantitative methods were used to reach
the objectives.
The analysis highlighted over-processing, excess transportation and inventory issues in the
material flow and the following suggestions were concluded:
• Enhance employee satisfaction by rotating personnel in different stations.
• Visualize work methods and weekly planning on approachable boards to standardize
work and ensure quality of outcome.
• Reduce and eliminate inspection processes by training suppliers and sub-contractors
in quality assurance.
• Sequence material in honing operations to reduce change-over times.
• Outsource heat treatment operations to save resources and lead time.
The following recommendations would allow for a 24,6% or 68,3% reduction in lead time,
depending on choosen solutions, according to the authors’ estimations.
The study was a part of the MG202X: Master Degree Project in Industrial Engineering and
Management of the Royal Institute of Technology and was conducted in Atlas Copco Nasik,
India and Stockholm, Sweden. On-site analysis lasted for 12 weeks and the thesis was
finalized in Stockholm for a total duration of 30 weeks.
V
Sammanfattning Construction Tools & Organisation (CTO) avdelningen av Atlas Copco Indien växer och visar
positiva affärsresultat, men den snabba tillväxten har orsakat utmaningar. Produktionens
ledtider är 25-30% längre än systerfabriken i Kalmar, som orsakar alltför stora lager och
onödiga kostnader. Det finns ett behov att undersöka hur dessa ledtider kan minskas.
Syftet med denna studie var att utveckla förslag på hur ledtider kan reduceras. I studien
använde Lean Management och Värdeflödesanalys-verktyget som teoretisk referens för att
analysera och undersöka värde och icke-värdeskapande aktiviteter, att minska slöserier, att
förbättra kvaliteten inom processer och för att förenkla och standardisera arbetsmetoder.
Arbetet avgränsade undersökningen till enda produktkomponent och produkttyp; CP1230
brytaren och dess cylinder. Forskningsansatsen var av deduktiv natur, informationsinsamling
har skett i form av litteraturstudie, personliga observationer och intervjuer, dvs. kvalitativa
och kvantitativa metoder har använts för att nå målen.
Analysen upptäckte över-bearbetning, onödig transport och lager som problemområden i
materialflödet och följande förbättringsförslag sammanfattades:
• Öka arbetsglädjen genom att rotera personal till olika stationer.
• Visualisera arbetsmetoder och produktionsplanering med lättillgängliga planscher för
att standardisera arbetet och säkerställa kvaliteten.
• Minska och frigöra inspektionsprocesser genom att utbilda leverantörer i
kvalitetssäkringen.
• Sekvensera flödet i heningsprocessen för att minska omställningstiden.
• Outsourca värmebehandlingsverksamheten för att spara resurser och ledtid.
Följande rekommendationer skulle möjliggöra en 24,6% eller 68,3% reducering av ledtiden,
beroende på val av lösning, enligt författarnas uppskattningar.
Studien var en del av kursen MG202X: Examensarbete i Industriell Ekonomi från Kungliga
Tekniska Högskolan, och genomfördes i Atlas Copco Nasik, Indien och Stockholm. Analysen
gjordes under 12 veckor i Indien och rapporten slutfördes i Stockholm. Sammanlagd
arbetstid uppskattas till 30 veckor.
VI
Table of Contents Acknowledgements ................................................................................................................... III
Abstract ..................................................................................................................................... IV
Sammanfattning ......................................................................................................................... V
Explanation of terms .................................................................................................................. 8
1 Introduction ........................................................................................................................ 9
1.1 Background .............................................................................................................................. 9
1.2 Problem description .............................................................................................................. 10
1.3 Goal and objectives ............................................................................................................... 10
1.4 Delimitations ......................................................................................................................... 11
2 Methodology .................................................................................................................... 13
2.1 Method .................................................................................................................................. 13
2.2 Research approach ................................................................................................................ 14
2.3 Information gathering ........................................................................................................... 17
2.4 Methodological problems ..................................................................................................... 18
3 Literature review .............................................................................................................. 20
3.1 What is Lean? ........................................................................................................................ 20
3.2 History of Lean....................................................................................................................... 22
3.3 Lean Production .................................................................................................................... 24
3.4 Reflections and criticism on Lean .......................................................................................... 31
3.5 Value Stream ......................................................................................................................... 35
4 Company Description ....................................................................................................... 43
4.1 Atlas Copco Group ................................................................................................................. 43
5 Current state description ................................................................................................. 47
5.1 Production layout .................................................................................................................. 47
5.2 Information flow .................................................................................................................... 61
6 Value Stream Analysis ...................................................................................................... 63
6.1 Customer requirements ........................................................................................................ 63
6.2 Current state maps ................................................................................................................ 64
6.3 Value & Non-value adding activities ..................................................................................... 67
6.4 Future state maps.................................................................................................................. 68
7 Conclusions & Recommendations .................................................................................... 73
7.1 Conclusions ............................................................................................................................ 73
VII
7.2 Plan of action ......................................................................................................................... 74
7.3 Estimated outcome ............................................................................................................... 75
8 Discussion ......................................................................................................................... 76
8.1 Reflections ............................................................................................................................. 76
8.2 Critique .................................................................................................................................. 77
8.3 Future work ........................................................................................................................... 78
9 References ........................................................................................................................ 79
10 Appendix ........................................................................................................................... 82
10.1 Exploded view of 1230 .......................................................................................................... 82
10.2 Component listing ................................................................................................................. 83
10.3 Production layout .................................................................................................................. 84
10.4 Inspection template of cylinder ............................................................................................ 85
10.5 Inspection check sheet .......................................................................................................... 86
10.6 Value Stream Mapping Legend ............................................................................................. 87
10.7 VSM - Post C-stock Current ................................................................................................... 88
10.8 VSM - Post C-stock Future ..................................................................................................... 89
10.9 VSM - Pre C-stock Current ..................................................................................................... 90
10.10 VSM - Pre C-stock Future ....................................................................................................... 91
10.11 VSM - Pre C-stock Alternative Future .................................................................................... 92
10.12 Process- and Cycle-times calculations ................................................................................... 93
10.13 Change-over times calculations ............................................................................................ 94
10.14 Uptime calculations ............................................................................................................... 95
10.15 Inventory times calculations ................................................................................................. 96
10.16 Lead time savings calculations .............................................................................................. 97
8
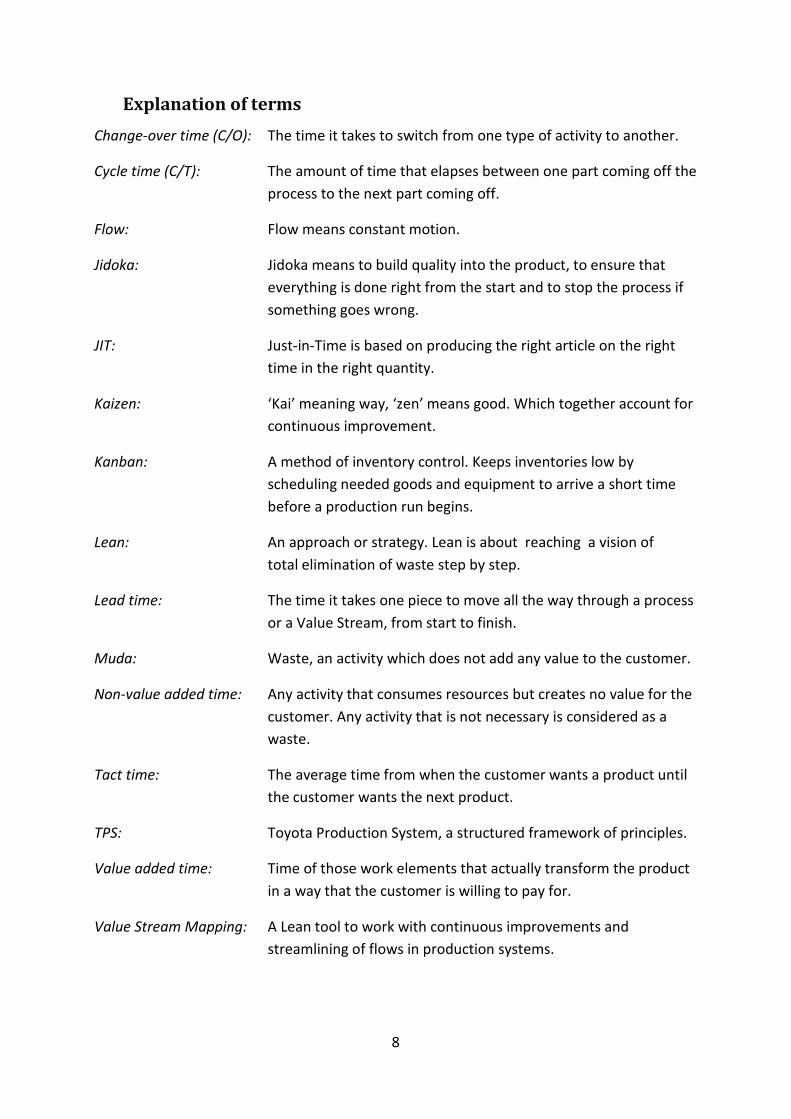
Explanation of terms Change-over time (C/O): The time it takes to switch from one type of activity to another.
Cycle time (C/T): The amount of time that elapses between one part coming off the process to the next part coming off.
Flow: Flow means constant motion.
Jidoka: Jidoka means to build quality into the product, to ensure that everything is done right from the start and to stop the process if something goes wrong.
JIT: Just-in-Time is based on producing the right article on the right time in the right quantity.
Kaizen: ‘Kai’ meaning way, ‘zen’ means good. Which together account for continuous improvement.
Kanban: A method of inventory control. Keeps inventories low by scheduling needed goods and equipment to arrive a short time before a production run begins.
Lean: An approach or strategy. Lean is about reaching a vision of total elimination of waste step by step.
Lead time: The time it takes one piece to move all the way through a process or a Value Stream, from start to finish.
Muda: Waste, an activity which does not add any value to the customer.
Non-value added time: Any activity that consumes resources but creates no value for the customer. Any activity that is not necessary is considered as a waste.
Tact time: The average time from when the customer wants a product until the customer wants the next product.
TPS: Toyota Production System, a structured framework of principles.
Value added time: Time of those work elements that actually transform the product in a way that the customer is willing to pay for.
Value Stream Mapping: A Lean tool to work with continuous improvements and streamlining of flows in production systems.
9
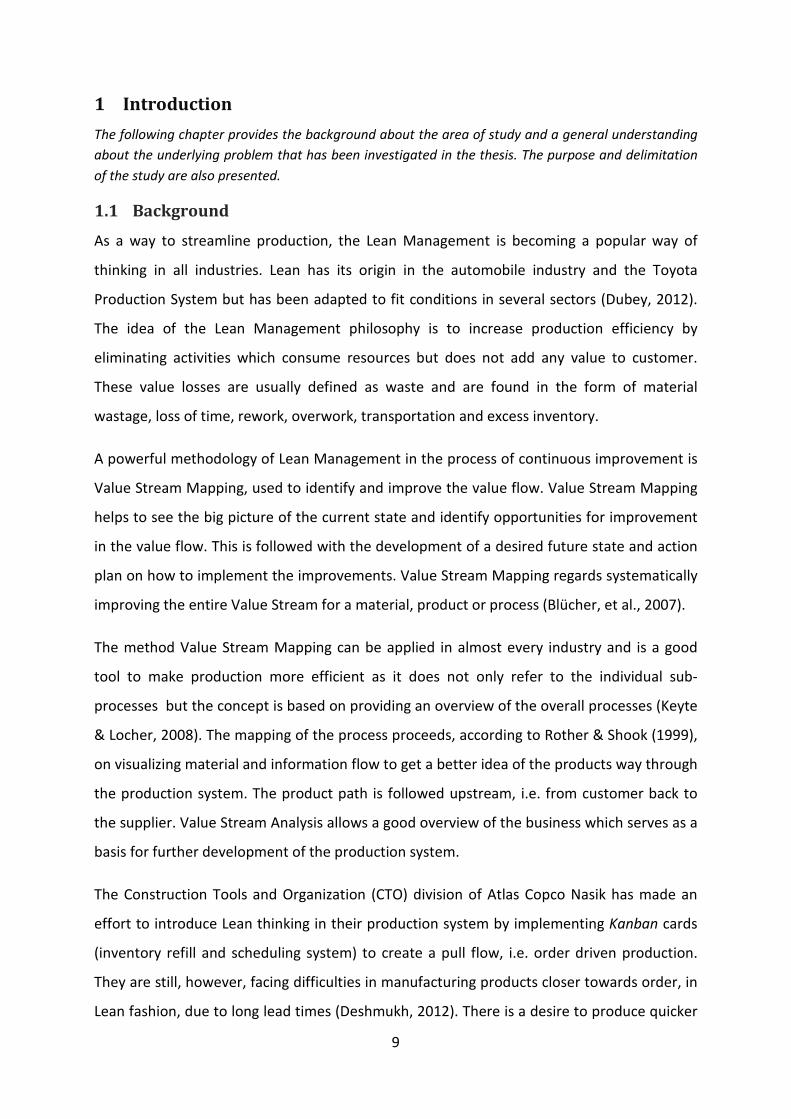
1 Introduction The following chapter provides the background about the area of study and a general understanding about the underlying problem that has been investigated in the thesis. The purpose and delimitation of the study are also presented.
1.1 Background
As a way to streamline production, the Lean Management is becoming a popular way of
thinking in all industries. Lean has its origin in the automobile industry and the Toyota
Production System but has been adapted to fit conditions in several sectors (Dubey, 2012).
The idea of the Lean Management philosophy is to increase production efficiency by
eliminating activities which consume resources but does not add any value to customer.
These value losses are usually defined as waste and are found in the form of material
wastage, loss of time, rework, overwork, transportation and excess inventory.
A powerful methodology of Lean Management in the process of continuous improvement is
Value Stream Mapping, used to identify and improve the value flow. Value Stream Mapping
helps to see the big picture of the current state and identify opportunities for improvement
in the value flow. This is followed with the development of a desired future state and action
plan on how to implement the improvements. Value Stream Mapping regards systematically
improving the entire Value Stream for a material, product or process (Blücher, et al., 2007).
The method Value Stream Mapping can be applied in almost every industry and is a good
tool to make production more efficient as it does not only refer to the individual sub-
processes but the concept is based on providing an overview of the overall processes (Keyte
& Locher, 2008). The mapping of the process proceeds, according to Rother & Shook (1999),
on visualizing material and information flow to get a better idea of the products way through
the production system. The product path is followed upstream, i.e. from customer back to
the supplier. Value Stream Analysis allows a good overview of the business which serves as a
basis for further development of the production system.
The Construction Tools and Organization (CTO) division of Atlas Copco Nasik has made an
effort to introduce Lean thinking in their production system by implementing Kanban cards
(inventory refill and scheduling system) to create a pull flow, i.e. order driven production.
They are still, however, facing difficulties in manufacturing products closer towards order, in
Lean fashion, due to long lead times (Deshmukh, 2012). There is a desire to produce quicker
10
and implement Lean thinking further. Quality and costs are becoming important incitements
for CTO Nasik as the site is taking over production from other Atlas Copco factories, such as
from Kalmar in Sweden (Karlsson & Östensson, 2012).
1.2 Problem description
The CTO division is expanding every year in terms of production volumes and employees and
is demonstrating positive business results (Deshmukh, 2012). However, the division is faced
with challenges due to this rapid growth. The production lead times, i.e. time involving all
processes from material acquisition to finished product delivery, are 25-30% longer
compared to the CTO operations in Kalmar (Karlsson & Östensson, 2012). The relatively long
lead times are causing difficulties in resource and order management. The division has to
keep excess inventory in the form of safety stocks because of fluctuating demand, causing
unnecessary costs related to inventory and idle-time. Rework and re-processing because of
poor material quality and dimensional faults of components are also factors for long lead
times (Deshmukh, 2012). These difficulties give reason for the project to examine how the
lead time can be reduced.
1.3 Goal and objectives
The primary goal of this project is to give recommendations on how to reduce the lead times
by examining the Value Stream of the CTO operations. Lean Management principles and
specifically the Value Stream Mapping tool has been used to reach this goal as it is a simple
technique and gives a comprehensive overall picture of the production system and not only
sub-optimizes processes with negative influence. The goal is to reduce the lead time by
fulfilling the following objectives:
• Identify value adding and non-value adding activities.
• Improve product quality within processes.
• Reduce wasteful operations, i.e. transportation, over-processing, idle-time, etc.
• Simplify and standardize working methods.
11
1.4 Delimitations
The study is limited to only examine the flow of a single product component. However, the
examined component is chosen carefully to represent all in-house processes, hence, all
processes have been analyzed in the study. The product which the component represents is
one of the highest turnover in terms of order and delivery which leads the outcome and
recommendations of the study to be of bigger impact.
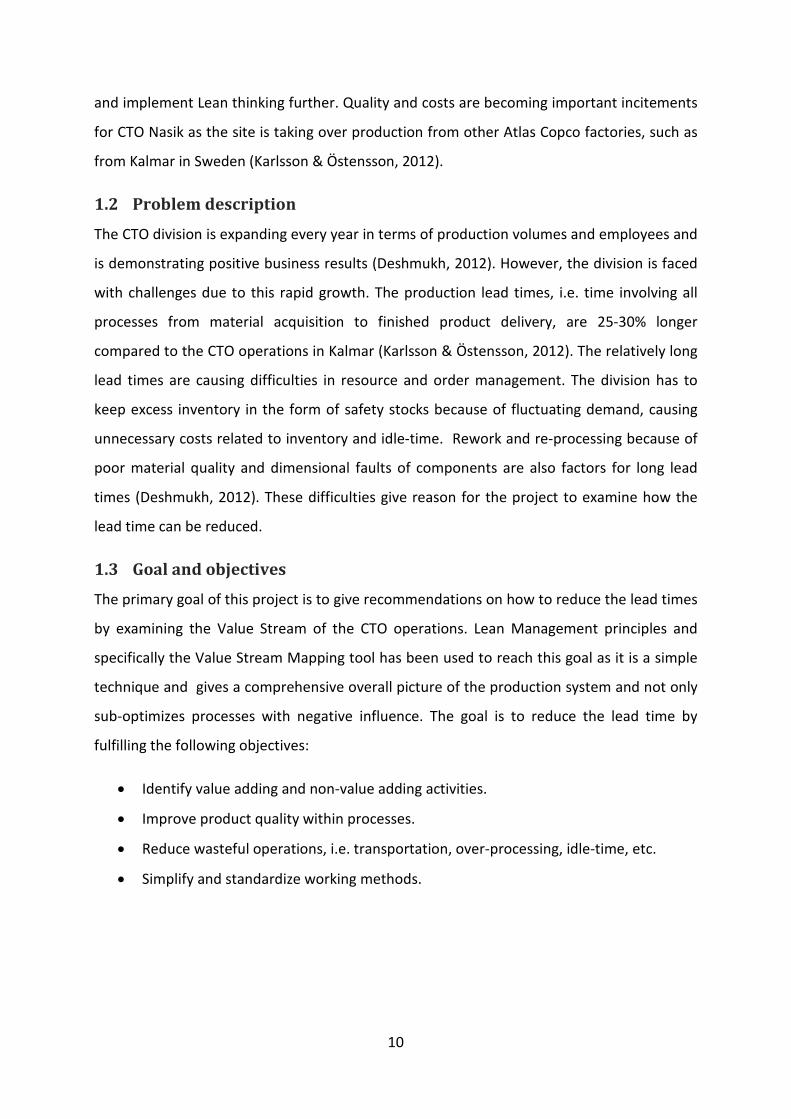
The study will not examine the complete Value Stream, i.e. from raw materials to end user.
It will cover the flow from order-delivery to factory, to dispatching, i.e. “door-to-door”
operations (see figure 1).
Figure 1 - Part of the total Value Stream which is examined (Rother & Shook, 1999)
All steps of Value Stream Mapping are conducted including recommendations and plan of
action. However, required investment or cost analysis for implementing the
recommendations have not been done. Recommendations on improving the information
system has not been included in our studies. The recommendations have been based on
their effect on the lead time and feasibility. No inventory management is done apart from a
basic analysis to get an overview of the material handling systems.
The literature review provides a comprehensive presentation of the Lean Production system,
its origin and development. Only the Value Stream Mapping tool from Lean principles has
been used.
12
The results are achieved by evaluating the Value Stream of a product’s component and
generate conclusions and recommendations for how the result can be applied in similar
product flows for efficiency and minimizing losses.
The resources available in the study can be divided into internal and external resources.
Internal resources are supervisors from both the School of Industrial Engineering and
Management, KTH, Royal Institute of Technology and the Atlas Copco CTO Management
team whom have assisted with their expertise and guidance. Atlas Copco also arranged
training with the Lean Management Institute of India in the form of seminars and workshops
in Lean Thinking and Value Stream Mapping. External resources are literature and studies
within the research area. Time resource consists of 20+ weeks of full-time study out of which
12 weeks were spent in the Atlas Copco facility in Nasik, India.
13
2 Methodology The methodology chapter describes how the study is conducted. This chapter provides an overview of the approach, the chosen research approach and data collection methods. The concepts of reliability and validity are discussed and how the quality of the study has been secured.
2.1 Method
The project started with a discussion of the research problem together with the CTO
division’s Operational Manager to specify and describe the background of the study. The
method was then set up and, after discussion with the university supervisor, reformulated to
follow the framework for a final thesis of the Royal Institute of Technology, KTH. After
meeting with the head of the CTO Flow and other persons of interest, an overall plan of the
project was made. Then began a tour around all the departments in the production and
introduction meetings with its’ respective managers to get an overview of the business. This
was followed by a literature study to gain theoretical background in Lean Management and
knowledge of Value Stream Mapping. The literature study was carried on throughout the
remaining part of the study. Data collection and understanding of the current state Value
Stream has been done based on observations in Nasik during a 12 week period. Interviews
were conducted throughout the stay in Nasik with people directly affiliated with the
processes and with people of knowledge in Lean Management and Value Stream Mapping.
The Lean “experts” in addition to providing knowledge and experience, helped to increase
understanding of how Value Stream Mapping can be used. A future state and an example of
an action plan have been developed as a final element of the Value Stream Analysis. As a
final discussion around the study, Value Stream Mapping as a tool is analyzed and reflected
upon to see how the conclusions and recommendations of the study towards the Atlas
Copco CTO division can be used as a reference platform for the other divisions within the
group. Additionally, how the work and the study has been carried out and what could have
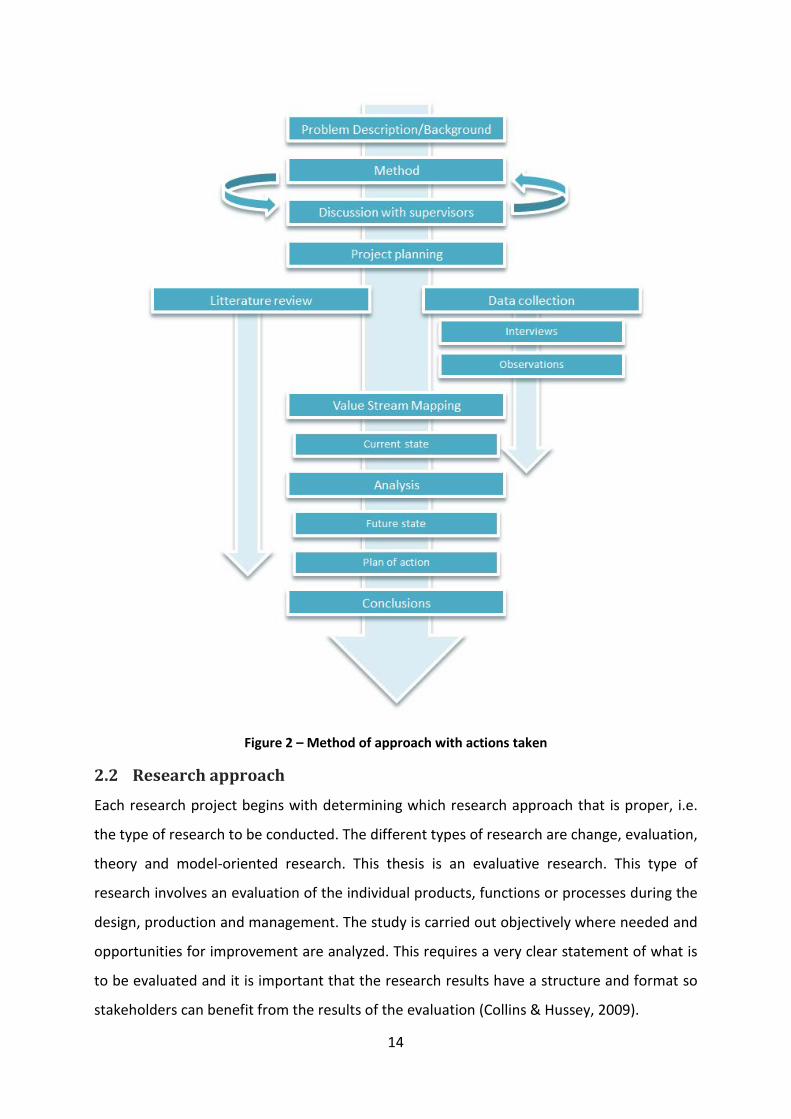
been done differently is also discussed. Figure 2 below illustrates the approach of the work
and the activities that were included in the work.
14
Figure 2 – Method of approach with actions taken
2.2 Research approach
Each research project begins with determining which research approach that is proper, i.e.
the type of research to be conducted. The different types of research are change, evaluation,
theory and model-oriented research. This thesis is an evaluative research. This type of
research involves an evaluation of the individual products, functions or processes during the
design, production and management. The study is carried out objectively where needed and
opportunities for improvement are analyzed. This requires a very clear statement of what is
to be evaluated and it is important that the research results have a structure and format so
stakeholders can benefit from the results of the evaluation (Collins & Hussey, 2009).

15
Inductive and deductive methods
According to Holme & Solvang (1991), there are two different approaches to the theory,
deductive and inductive method. Deductive can be explained as the path to prove while
inductive follows the path to discover. Patel & Davidsson (2003) further describes that a
deductive approach is characterized on the basis of general principles and existing theories
to draw conclusions about individual phenomena.
In a deductive approach, the objectivity of the research is assumed to be strengthened since
it is based out of existing theory. The research process becomes in lesser extent influenced
by the individual researcher's subjective perceptions. One danger is of course that the
existing theory, that the researcher assumes from, will direct and influence the research so
new findings will not be detected (Patel & Davidsson, 2003).
A researcher who uses an inductive research method, according to Patel & Davidsson (2003),
study the research object without having first secured earlier theory to be acceptable, and
based on the information gathered formulates an own theory. The researcher assumes
discoveries in reality brought together as general principles, which in turn merges into
theory. The risk here is that the researcher does not really know anything about the theory
in generality, since it is based on an empirical basis that is typical for a particular situation,
time, or group of people.
Choice of method: In our research, a deductive research method is used because the work is
based on a literature study on Lean Management principles. The literature review is the
basis for further data collection through case studies, interviews and observations.
Quantitative and qualitative methods
In methodology, there are two clear approaches according to Olsson & Sörenson (2007),
qualitative and quantitative approaches. The two terms are associated to specific research
methods and how the collected data is processed.
The quantitative research is based in most cases on theory, previous research and the
researcher's own experiences in the field. These theories are then specified as a hypothesis
that can be verified or rejected. The researcher tries to find connections, variations and
distributions in the studies. Often, these are a limited number of variables in a large number
16
of individuals. In quantitative research, the researcher mostly base the study from official
statistics, but a common method of data collection is also surveys on a specially selected
audience or in-depth interviews with guiding questions. The advantage of a quantitative
approach is that it is easy to collect data, however, usually a large amount of data that can
be difficult to analyze (Olsson & Sörenson, 2007).
The qualitative method is related mostly to the hermeneutics and refers to research
methods that provide descriptive data. The unique feature of qualitative research is that the
researcher wishes to characterize something, create a deeper understanding of the problem
and describe the context in which the problem fits in and sees the big picture. Using
qualitative methods, the researcher tries to find categories, descriptions or models that best
describe a phenomenon in context. Most often it is a large number of variables and a small
number of individuals. Data collection methods used in the qualitative approach is, for
example, interviews, case studies, observations and literature studies. The advantage of a
qualitative study is that it provides a complete picture of the problem, but the downside is
that it is difficult to repeat as many factors come into play (Olsson & Sörenson, 2007).
Choice of method: The research is qualitative as a deeper understanding of the problem is
sought. The data collection methods used are literature studies, observations and open
interviews. However, there are also quantitative elements in the form of numerical data
collected during the observations made (Holme & Solvang, 1991).

17
2.3 Information gathering
The following section describes the information gathering techniques used in the study.
Literature review
The literature review begins with an information retrieval at KTH Library database Primo, the
keywords used were; Lean, Lean Production, Lean Management, Lean in India and Value
Stream Mapping. The evidence used comes from books, articles and reports. Supervisors
from KTH and Atlas Copco have helped to find relevant literature and articles as well.
Personal observations
Observation is not dependent on what people say they do, but based on the eye's direct
observation of actual events (Holme & Solvang, 1991). According to Holme & Solvang (1991)
there are two types of observational research: the systematic observation and participant
observation. Systematic observation is associated with quantitative data of measurement of
events made while participating observation made in order to understand the work culture
and everyday situations. Systematic observations were made in the production flow as
buffers and work in progress were calculated and own measurements of cycle times were
performed. Participation observations were made to examine the daily work in production.
The authors also participated in department meetings to listen and get an insight into daily
work routines.
Interviews
The interviews were carried out in dialogue form with open-ended questions to get as much
information and understanding as possible and not to restrict information. They have been
conducted with all concerned of the value flow, mainly with representatives from the
production, but also from the planning-, procurement-, logistics-, order- and material-
functions. An interview was also conducted with a person of great expertise in Lean
Management and Value Stream Mapping. The selected interviewees were conducted by the
researchers own initiative and after recommendations from supervisors. The interviews
were openly discussed about the implementation of Lean Management and its tools in the
workplace and the barriers and opportunities that it could bring. The authors have primarily
used semi-structured and unstructured interviews, only a list of topics to discuss was
prepared before the interview took place.
18
2.4 Methodological problems
A challenge in investigative research is how theoretical concepts and models are consistent
with empirical observations, i.e. how theory can be transferred to real life. In this context,
the validity and reliability are key concepts (Collins & Hussey, 2009).
Reliability
According to (Olsson & Sörenson, 2007) reliability is the degree of consistency between the
measurements with the same instrument, i.e. that the same results are obtained at each
measurement. A high degree of consistency implies a high degree of reliability. A method is
to be independent of the investigator and independent of the amount of researched units to
have high reliability (Eriksson & Wiedersheim-Paul, 2001). There are different methods to
measure the reliability of studies depending on the measurement method used. This work is
mostly based on own observations, measurements and interpretations. To ensure high
reliability, several measurements have been recorded and then an average has been
calculated, i.e. at least three measurements were recorded for calculating cycle-time and the
average was used in the Value Stream Analysis. The author's interpretations have been
approved by concerned people with different experiences and knowledge to make sure that
the gathetered information is correct and reproduceable. Clear explanations and reasonings
of the chosen approach are also important to achieve a high degree of reliability (Collins &
Hussey, 2009).
Validity
Validity, according to Olsson & Sörenson (2007), refers to the measuring instrument's ability
to measure the right things. They also describes validity as the most important requirement
of a measuring instrument and says that if an instrument is not measuring the referred
measure, it does not matter if the measurement itself is conducted well. It is usually easier
to test reliability, but in order to make proper evaluations of one’s research, it is important
to know both the measuring instrument’s validity and reliability. If this is not done the
interpretation of the data is questionable or unreliable. There are a variety of methods in
which the study's validity can be calculated depending on the measurement method. To
ensure validity, triangulation can be used, with the meaning that two or more benchmarks
are used to determine where the truth lies (Denscombe, 2000). To get high validity of the
research, a number of respondents were used in gathering of information, different
19
methods such as interviews, observations, and measurements were made in data collection,
as well as use of multiple sources of theories. Respondents also verified that the
interpretation obtained by the authors were representative.
20
3 Literature review This chapter presents the theories and principles on which the study is based. Focus is on Lean Management, the origin and history of the theory, which is clarified by giving explanations and background information about the principles. This is followed by a clarification about the Value Stream Mapping technique. The chapter also includes perspectives, reflections and criticism towards the theories of Lean.
3.1 Background on Lean
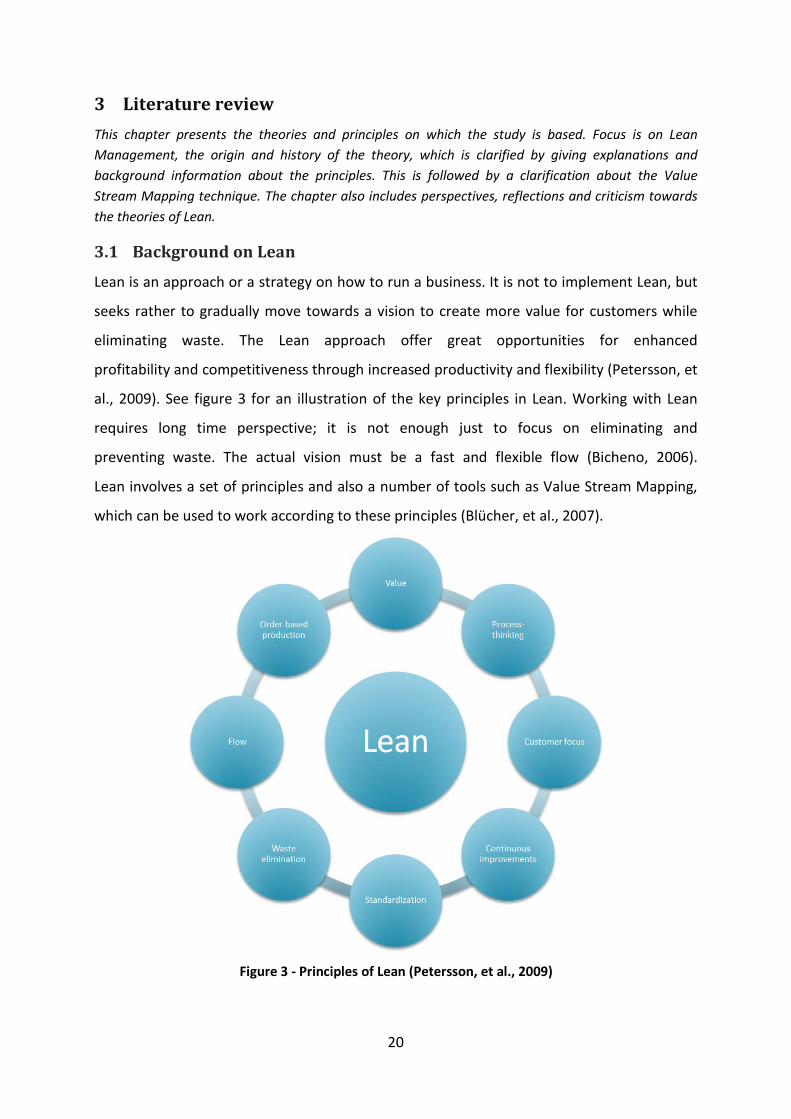
Lean is an approach or a strategy on how to run a business. It is not to implement Lean, but
seeks rather to gradually move towards a vision to create more value for customers while
eliminating waste. The Lean approach offer great opportunities for enhanced
profitability and competitiveness through increased productivity and flexibility (Petersson, et
al., 2009). See figure 3 for an illustration of the key principles in Lean. Working with Lean
requires long time perspective; it is not enough just to focus on eliminating and
preventing waste. The actual vision must be a fast and flexible flow (Bicheno, 2006).
Lean involves a set of principles and also a number of tools such as Value Stream Mapping,
which can be used to work according to these principles (Blücher, et al., 2007).
Figure 3 - Principles of Lean (Petersson, et al., 2009)
21
Womack & Jones (2003) defines Lean with five key principles:
• Specify value - You have to have a customer perspective, to think of the customer’s
situation. Often focus is directed to what the vendor/manufacturer themselves think
is best or what is most economical for the customer.
• Identify the Value Stream - The principle is based on identifying and mapping the
Value Streams all the way from raw materials to end customers. The main focus
should be on the part where customer demand can be reconciled.
• Create Value Stream, get the value to flow - This principle can only be performed
after the value is specified and the Value Stream has been mapped. By keeping
the production in a smooth motion and avoiding queues and prevent barriers,
one creates a flow.
• Produce on demand (pull systems) - An pull system means that a short reaction
time in relation to changes in demand, this is possible when the idea is that
the customer "pulls" out the product / service through production. It only works if
the previous three principles are implemented and as the effect of a pull system
there will be no overproduction.
• Pursue perfection - The principle pursue perfection means to produce exactly what
the customer wants, on time, at a reasonable price and with as little waste as
possible. When the previous principles are accomplished, perfection can be set as a
target. Perfection is not permanent, but must be constantly maintained by
continuous improvement.

22
3.2 History of Lean
In the spring of 1950 the Japanese engineer Eiji Toyoda, whose family founded the Toyota
Motor Company in 1937, visited the American automaker Ford Factory, The Rouge. Mass
production technology developed in United States had been a major success in efforts to
reduce production costs and gain volume allocations of a broader market. Since its
inception in 1937, Toyota had only managed to produce 2685 compared to Ford’s 7000 cars
per day. The ambition to achieve high productivity was equally thought of in Toyota as in
Ford and therefore mass production of The Rouge was studied in every detail (Dennis, 2007).
After returning to Japan Eiji Toyoda realized that there was much to learn from mass
production, but that it must be adapted to the Japanese situation as both Japan and
Toyota were in severe economic crisis after World War II. Along with Toyota plant
manager Taiichi Ohno, he came to the conclusion that mass production would not work in
Japan but that “there are some possibilities to improve the production systems” (Dennis,
2007). The weaknesses that existed with mass production technology were inflexibility,
high volume-dependency and poor customization. Eiji Toyoda and Taiichi Ohno’s work
resulted in a structured framework of principles that is known as the Toyota Production
System (TPS). The principles and guidelines that describe how the company should operate
(Petersson, et al., 2009) are as seen in Figure 4:
Figure 4 - The Toyota Production Systems 14 principles (Liker & Meier, 2006)
23
“All we are doing is looking at a timeline from the moment the customer gives us an order to
the point when we collect the cash. And we are reducing that timeline by removing the non-
value added wastes.”
Taiichi Ohno describing the heart of TPS (Bicheno, 2006)
In the 1970’s the world was hit by the oil crisis which led to major economic difficulties for
the industries in all over the world. Toyota managed this crisis much better, with higher
profits than their competitors. After that the concept of Toyota Production System spread
(Petersson, et al., 2009).
Initially Toyota's success was regarded as a manifestation of the Japanese culture, where
workers adopted to work harder and for less compensation. To transfer this to the West was
impossible, but in the 1980’s Toyota established plants in the U.S., Canada, England, France
and several other countries. It turned out that Toyota achieved similar results even in those
plants, known as “Transplants” (Berglund, 2006).
In 1979, the U.S. researchers from the Massachusetts Institute of Technology (MIT), on
behalf of the North American and Western European automotive industry, were sent to
Japan to find out how Toyota proceeded (Östlund, 2007). The results of the study, which ran
for five years, were presented in the book “The Machine that changed the world”. The name
and the concept of Lean Production were introduced in that book for the first time. In the
book the differences between mass production and Lean Production described in details.
According to Petersson (Petersson, et al., 2009), the concept of Lean was derived from the
Toyota’s way of production, the term Lean is considered “slender and smooth” as it is about
being efficient and using resources in the best way. Lean is an extension of the Toyota
production system and it has been applied in areas outside the manufacturing sector, such
as health-care, service and administration (Bicheno, 2006). The authors of the book
described that they are convinced that the principles of Lean can be applied in all industries
around the world and will have a major impact on human society: in their words, “it will
truly change the world”.
In March, 2008, Toyota's market capitalization was greater than both the German and
American automobile market capitalization together. This is a clear sign that properly
applied Lean is a means for success (Petersson, et al., 2009).
24
3.3 Lean Production
Perhaps the most striking difference between mass production and Lean Production is their
ultimate goal. Mass manufacturers set goals – “good enough”, which means they accept
defects, high level of inventories and offer a narrow range of standardized products
(Womack, et al., 1990). A common problem for companies that are still using mass
production principles is that they produce and push the products, rather than just producing
what downstream customers really need and when they need. The abundance of material
produced too early must be handled and stored, which means waste of resources (Rother &
Shook, 1999). Lean manufacturers, however, have their sights clearly set on perfection,
constantly pressing costs, zero defects, no inventory, and infinite variety of products
(Womack, et al., 1990).
“What we are trying to accomplish is a manufacturing process that produces only what
subsequent processing needs and when it’s needed. We try to link all processes - From the
product's end users and upstream to raw materials - in a steady flow without detours. A
stream that provides the shortest lead time, the highest quality and the lowest total cost”
(Rother & Shook, 1999).
There are fundamental differences between mass and Lean Production in leadership,
teamwork, communication and continuous improvement (kaizen). Overall, application of
Lean in these four areas makes it possible to make work better and faster with less effort
(Womack, et al., 1990). According to Womack & Jones (2003), there is great potential for
improvement in transition from traditional mass production, with a lot of sub-inventory, to
Lean Production, where the aim is continuous flow of goods and services that precisely meet
customer current needs. A key point is that the productivity of the entire system can be
doubled, while the throughput time in production and inventory levels can be reduced by up
to 90%.
Lean is based on the principle that more can be produced with less: less diverse efforts,
fewer machines and equipments, less time, less space and less waste (Blücher, et al., 2007).
25
“Lean Production is a superior way for humans to make things. It provides better products in
wider variety at lower cost. Equally important, it provides more challenging and fulfilling
work for employees at every level, from factory to headquarters. It follows that the whole
world should adopt Lean Production, and as quickly as possible”
(Womack, et al., 1990)
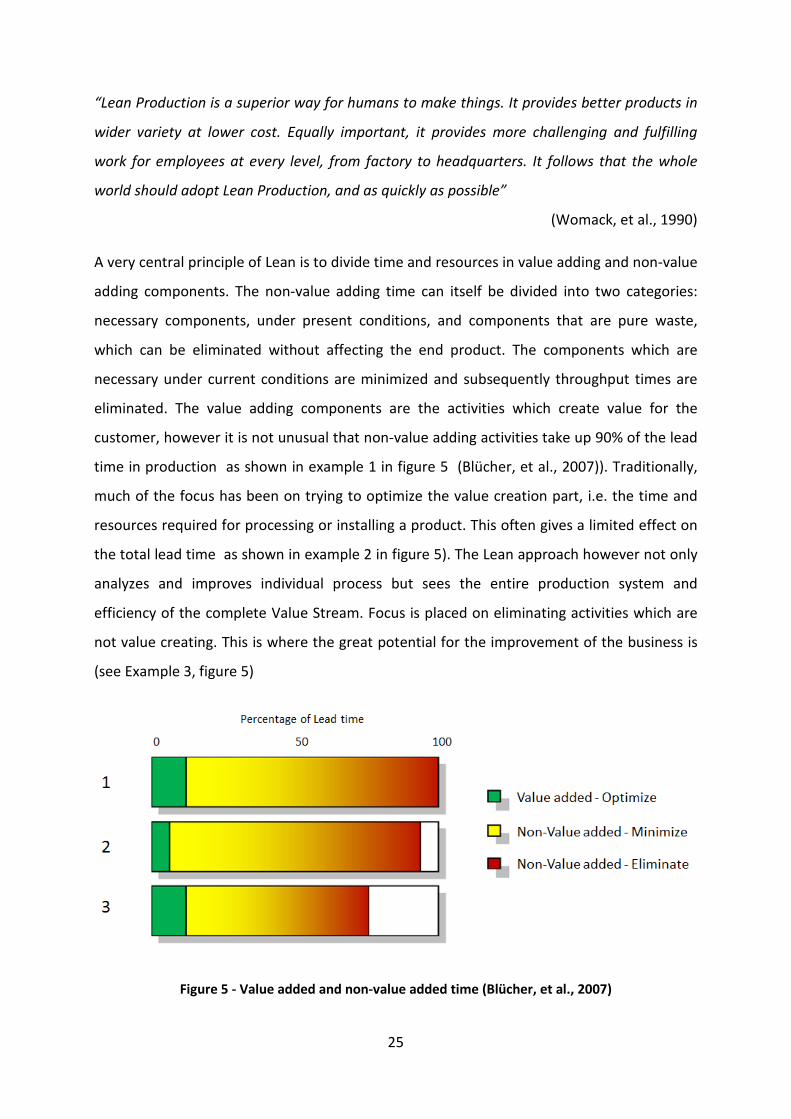
A very central principle of Lean is to divide time and resources in value adding and non-value
adding components. The non-value adding time can itself be divided into two categories:
necessary components, under present conditions, and components that are pure waste,
which can be eliminated without affecting the end product. The components which are
necessary under current conditions are minimized and subsequently throughput times are
eliminated. The value adding components are the activities which create value for the
customer, however it is not unusual that non-value adding activities take up 90% of the lead
time in production as shown in example 1 in figure 5 (Blücher, et al., 2007)). Traditionally,
much of the focus has been on trying to optimize the value creation part, i.e. the time and
resources required for processing or installing a product. This often gives a limited effect on
the total lead time as shown in example 2 in figure 5). The Lean approach however not only
analyzes and improves individual process but sees the entire production system and
efficiency of the complete Value Stream. Focus is placed on eliminating activities which are
not value creating. This is where the great potential for the improvement of the business is
(see Example 3, figure 5)
Figure 5 - Value added and non-value added time (Blücher, et al., 2007)
26
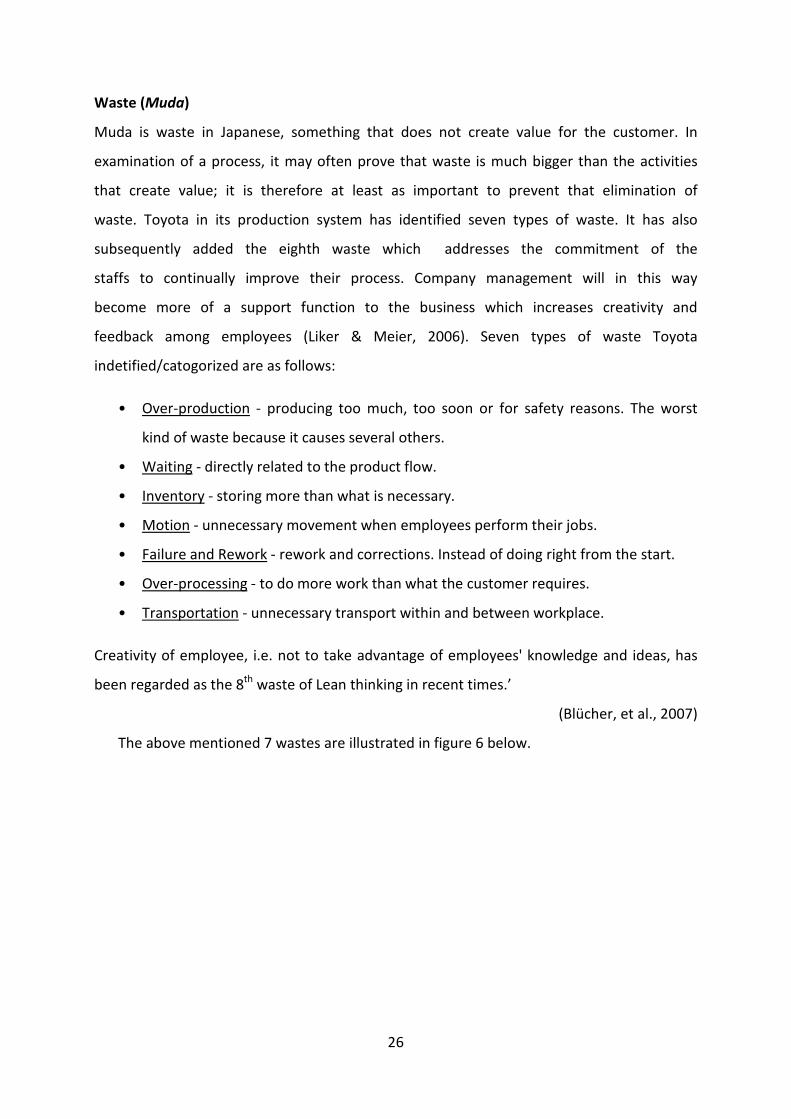
Waste (Muda)
Muda is waste in Japanese, something that does not create value for the customer. In
examination of a process, it may often prove that waste is much bigger than the activities
that create value; it is therefore at least as important to prevent that elimination of
waste. Toyota in its production system has identified seven types of waste. It has also
subsequently added the eighth waste which addresses the commitment of the
staffs to continually improve their process. Company management will in this way
become more of a support function to the business which increases creativity and
feedback among employees (Liker & Meier, 2006). Seven types of waste Toyota
indetified/catogorized are as follows:
• Over-production - producing too much, too soon or for safety reasons. The worst
kind of waste because it causes several others.
• Waiting - directly related to the product flow.
• Inventory - storing more than what is necessary.
• Motion - unnecessary movement when employees perform their jobs.
• Failure and Rework - rework and corrections. Instead of doing right from the start.
• Over-processing - to do more work than what the customer requires.
• Transportation - unnecessary transport within and between workplace.
Creativity of employee, i.e. not to take advantage of employees' knowledge and ideas, has
been regarded as the 8th waste of Lean thinking in recent times.’
(Blücher, et al., 2007)
The above mentioned 7 wastes are illustrated in figure 6 below.

27
Figure 6 - The 7 common wastes of Lean (Dennis, 2007)
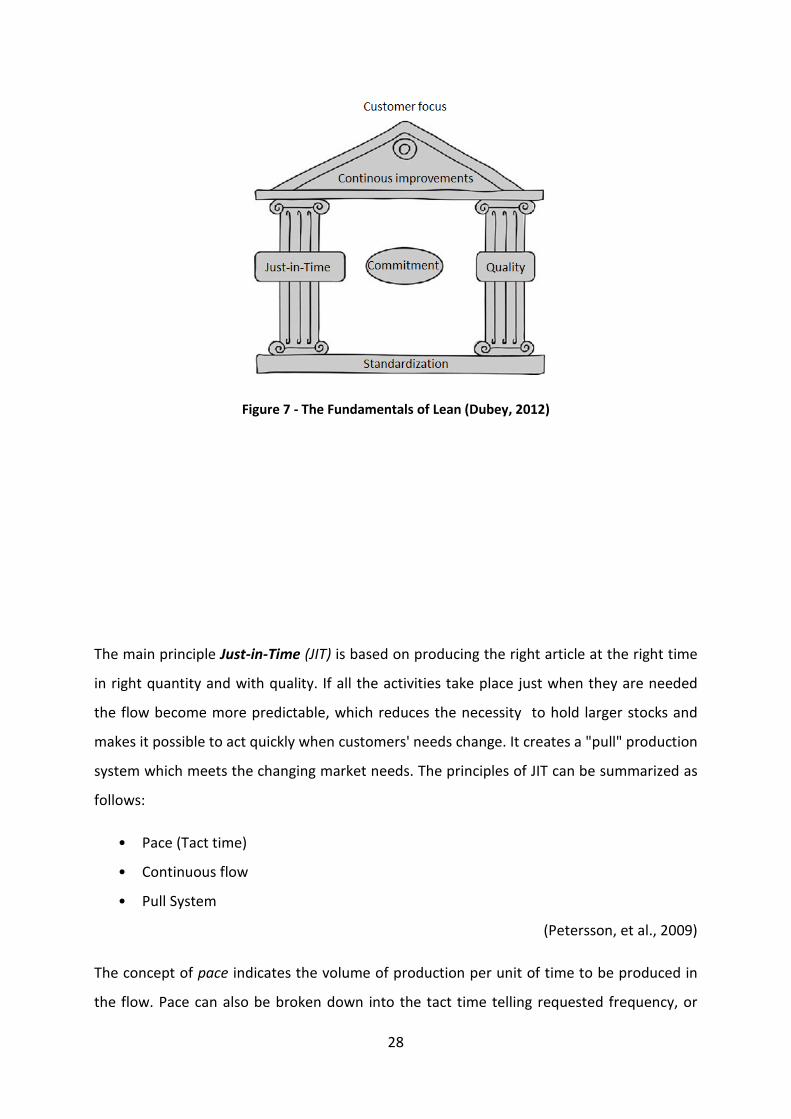
Fundamentals of Lean
For the potential of Lean Production to be fully utilized, it is important to understand the
concept as a whole and its fundamental principles. A temple as shown in figure 7 is often
used to illustrate the interaction between principles, methods and tools which are part of
the Lean Production. The foundation of the Lean temple, measurement and standardization,
provides stability and is fundamentally required for success. The two pillars show the two
main principles of Lean Production; consumption-driven production (Just-in-Time) and
quality in all levels (Jidoka). In the center there is commitment, dedication and teamwork
with team members who are constantly looking for a better way or improved working
methods. The roof illustrates a clearly defined goal; customer focus and continuous
improvement (Blücher, et al., 2007).
28
Figure 7 - The Fundamentals of Lean (Dubey, 2012)
The main principle Just-in-Time (JIT) is based on producing the right article at the right time
in right quantity and with quality. If all the activities take place just when they are needed
the flow become more predictable, which reduces the necessity to hold larger stocks and
makes it possible to act quickly when customers' needs change. It creates a "pull" production
system which meets the changing market needs. The principles of JIT can be summarized as
follows:
• Pace (Tact time)
• Continuous flow
• Pull System
(Petersson, et al., 2009)
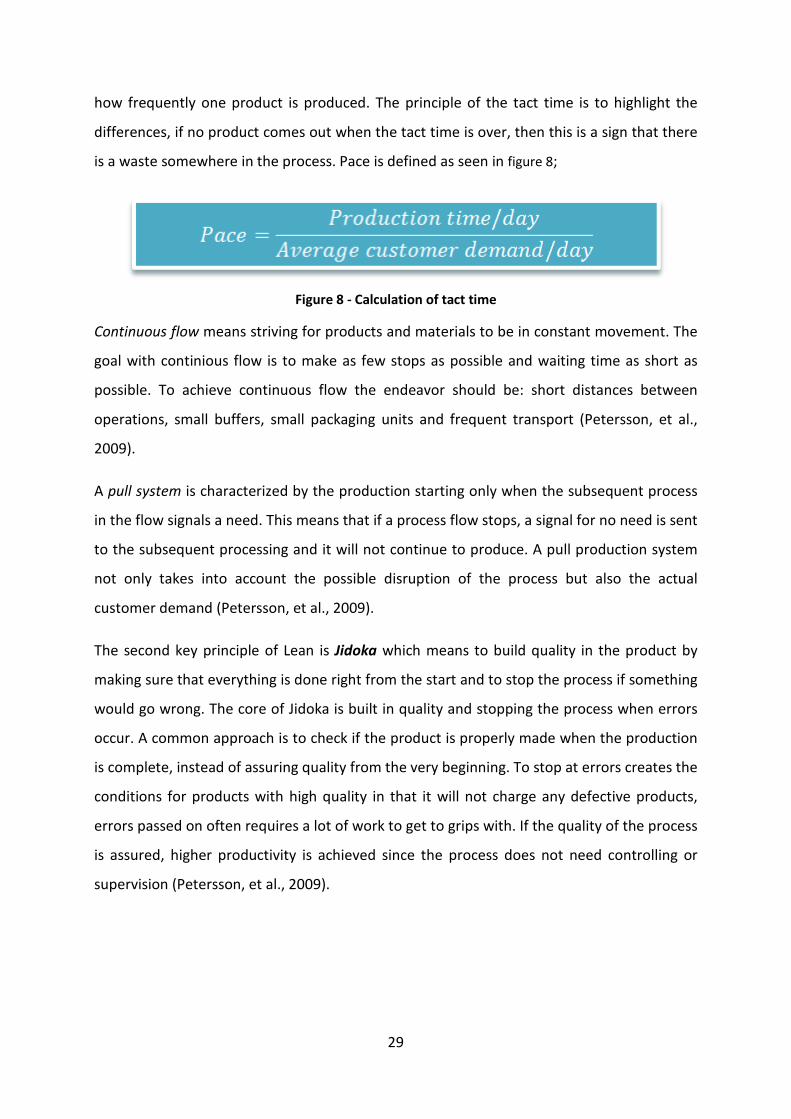
The concept of pace indicates the volume of production per unit of time to be produced in
the flow. Pace can also be broken down into the tact time telling requested frequency, or
29
how frequently one product is produced. The principle of the tact time is to highlight the
differences, if no product comes out when the tact time is over, then this is a sign that there
is a waste somewhere in the process. Pace is defined as seen in figure 8;
Figure 8 - Calculation of tact time
Continuous flow means striving for products and materials to be in constant movement. The
goal with continious flow is to make as few stops as possible and waiting time as short as
possible. To achieve continuous flow the endeavor should be: short distances between
operations, small buffers, small packaging units and frequent transport (Petersson, et al.,
2009).
A pull system is characterized by the production starting only when the subsequent process
in the flow signals a need. This means that if a process flow stops, a signal for no need is sent
to the subsequent processing and it will not continue to produce. A pull production system
not only takes into account the possible disruption of the process but also the actual
customer demand (Petersson, et al., 2009).
The second key principle of Lean is Jidoka which means to build quality in the product by
making sure that everything is done right from the start and to stop the process if something
would go wrong. The core of Jidoka is built in quality and stopping the process when errors
occur. A common approach is to check if the product is properly made when the production
is complete, instead of assuring quality from the very beginning. To stop at errors creates the
conditions for products with high quality in that it will not charge any defective products,
errors passed on often requires a lot of work to get to grips with. If the quality of the process
is assured, higher productivity is achieved since the process does not need controlling or
supervision (Petersson, et al., 2009).
30
Visual Management
In many organizations where communication is ineffective, the shop floor staff has no
tangible link between their activity and the organizations objectives, where processes are
designed away from the staff that will actually carry them out. Effectiveness can be
hampered with a lack of pressure targeted towards performance. Visual management is an
improvement tool that utilizes visual aids such as charts, signs and visual cues helps
organizations to focus on targets and objectives, see figure 9. Visual management means
making all processes within a company, visual and tangible and it consolidates messages
about company strategy and objectives, providing a consistent message about what should
be done and why (Dubey, 2012). These steps one should follow to apply Visual
Management:
• Step 1: Decide what message you would like to send or which mistakes you want to
prevent.
• Step 2: Design a simple visual aid to clearly state your message.
31
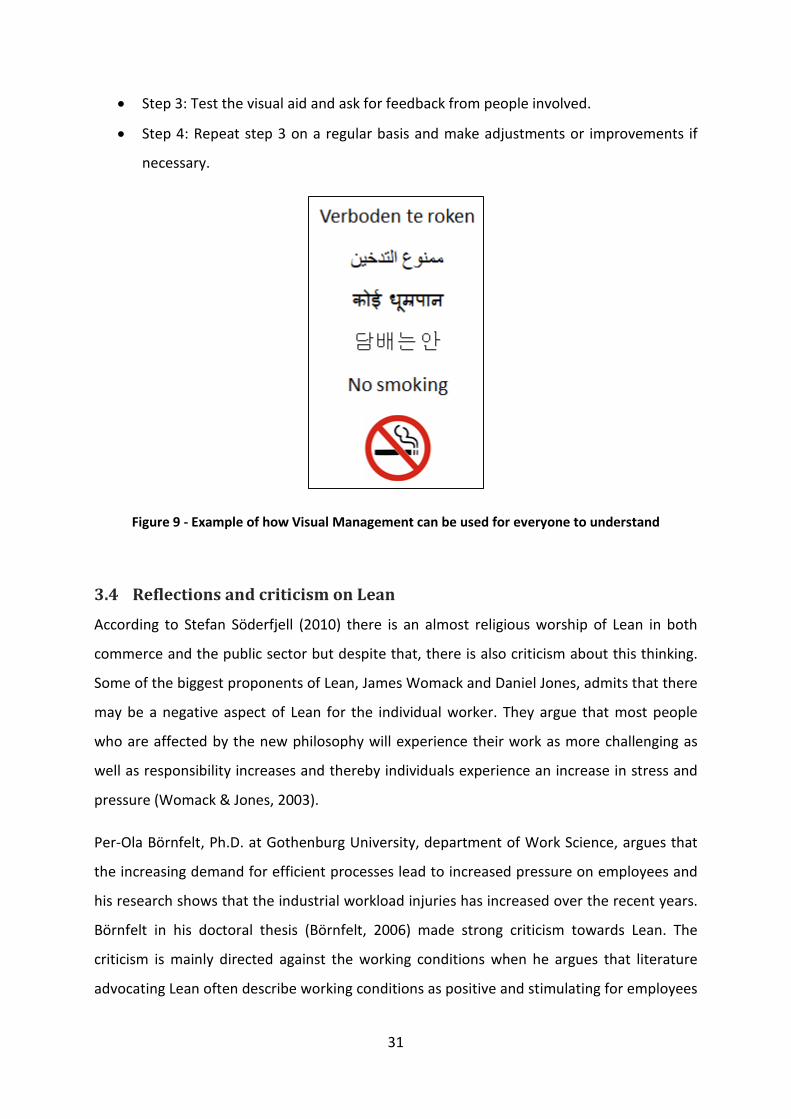
• Step 3: Test the visual aid and ask for feedback from people involved.
• Step 4: Repeat step 3 on a regular basis and make adjustments or improvements if
necessary.
Figure 9 - Example of how Visual Management can be used for everyone to understand
3.4 Reflections and criticism on Lean
According to Stefan Söderfjell (2010) there is an almost religious worship of Lean in both
commerce and the public sector but despite that, there is also criticism about this thinking.
Some of the biggest proponents of Lean, James Womack and Daniel Jones, admits that there
may be a negative aspect of Lean for the individual worker. They argue that most people
who are affected by the new philosophy will experience their work as more challenging as
well as responsibility increases and thereby individuals experience an increase in stress and
pressure (Womack & Jones, 2003).
Per-Ola Börnfelt, Ph.D. at Gothenburg University, department of Work Science, argues that
the increasing demand for efficient processes lead to increased pressure on employees and
his research shows that the industrial workload injuries has increased over the recent years.
Börnfelt in his doctoral thesis (Börnfelt, 2006) made strong criticism towards Lean. The
criticism is mainly directed against the working conditions when he argues that literature
advocating Lean often describe working conditions as positive and stimulating for employees
32
while studies on the work floor shows the opposite. According to him, Lean further develops
on Ford's production principles with assembly lines and repetitive, short cycled tasks which
give monotonous work, more pressure and also greater monitoring of various control
instruments. There are no breaks, but each worker should preferably be active in 60 seconds
of every minute. In practice, it is not about working smarter but work more intensively.
Börnfelt also claims that the only people who are motivated to work with Lean are those
who see a chance for a career as team leaders and planners. The employees however are
becoming more settled in their duties and passive long term and tend to lower the quality of
the work performed.
Central concepts of Lean are dedication, pride, and continuous improvement. According to
Japanese tradition and culture, people are not only employees at the company, but the
company is practically seen as family. Kaizen activities, work planning, cleaning and courses,
often take place outside normal working hours and is uncompensated. Indeed, companies
argue that these activities are voluntary, but the employee is expected to be loyal and show
up. Börnfelt (2006) argues that pride and community easily leads to disgrace. Disorder in
front of others brings shame, as well as not catching up with the pace. Focus is clearly
directed at the one who stops the process.
This negative attitude towards Lean permeates many of the studies presented in Börnfelts
dissertation. Some of the most negative images are compiled from a book written by Satoshi
Kamata, a Japanese journalist who worked as a temporary employee at Toyota for six
months in the early 70's. The book “Japan in the passing lane: An insider's account of life in a
Japanese auto factory” describes the harsh conditions of work as an employee of Toyota,
where tough managers, extremely fast pace and almost inhuman working conditions are
common.
The author of the article “The darker side of lean: An insider's perspective on the realities of
the Toyota production system”, Darius Mehri, is an American computer simulation engineer,
who during 1996-1999 worked in Japan at Nizumi (pseudonym for the Toyota owned
subsidiary). He described where the true powers of Lean - the people, are paying the price of
the company's success. Mehri goes to fierce criticism to Toyota's way of treating their
employees, who are in constant danger of being seriously injured, have insufficient
33
protective gear and the company trying to hide accidents to maintain a good image. The
culture of the company is characterized by rules, it is not allowed to have open discussions
or come up with new ideas, teamwork does not exist, all information and all work is
controlled from the top. It is considered bad behavior to criticize and show feelings.
"The TPS is certainly Lean, but it is also unhealthy and dangerous."
". . . workers do not even have a second to wipe the sweat off their faces. "
(Mehri, 2006)
Parker & Slaughter (1988) criticizes the high stress factor in Lean and coins the term
“management by stress” to describe the system. Department Managers pressure employees
until breaking point in order to reduce inventory and eliminate non-value adding activities in
pursuit of profit maximization. Conti, et al. (2006), however, are reluctant to earlier studies
criticism because of their lack of statistical significance and that the criticism cannot be
generalized across the whole population. They also argued that the correlation between the
degree of stress and level of Lean cannot be proven.
Berglund (2006) in his thesis describes the “Smart Lean” project, where the effect of Lean
Production is investigated in 22 companies deemed to have come a long way in their work
with Lean. The following conclusions were drawn:
“Lean provides great opportunities, both a good working situation and a high efficiency,
however, this is not done automatically but only by a great awareness and willingness to
make a reality of possibilities.”
(Berglund, 2006)
The conclusion is that “Lean is good” or “Lean is bad” for a work environment cannot be
easily answered , however, it is concluded that there are benefits to be taken advantage of.
The positive effects associated with the involvement of everyone in the organization creates
participation and an outlet for creativity, focus on leadership for enriching the work,
orderliness and reduces the risk of accidents and produces a willingness to tackle problems
(Berglund, 2006).
There are also negative effects on the work situation, but it is not negative effects of Lean
but a poor use of Lean opportunities. The negative effects existed even without Lean. In
34
many companies, there was a reduction in variation directly in the work and shorter cycles.
But the biggest problem is that Lean is not implemented properly and/ or implementation
is notconsistent. The managers mostly do not invest enough of their own commitment to
understand and implement Lean entirely. The consequences of this can be an unchanged,
rather top-heavy work, great physical and mental distance between management andother
employees, inadequate disposal of ideas and suggestions, unsystematic competence
development and often too short and unilateral economic objectives (Berglund, 2006).
According to Dubey (2012), failure to implement Lean in companies is because of not having
been sufficiently consistent in their work with Lean. He estimated the proportion of failure in
introducing Lean is about 80%.Many organizations see Lean as a tool instead of a philosophy
and a new way of thinking that must be anchored in the enterprise. He argues that Lean is
often used with the wrong objectives. Many define success in terms of revenue while Toyota
defines success in terms of customer satisfaction, delivery reliability , quality and employee
satisfaction s. This, in turn, creates growth. The error is often in the upper management
level, with owners on short-term objectives who want to earn quick money. To succeed it
requires a new way of thinking with long-term owners who want to streamline and develop
the company in the long run.
Dhirendra Kumar Dubey, CEO of Lean Management Institute of India (Lean Global Network),
who has worked closely with Toyota and now works to spread knowledge of Lean, claims
that the majority of the companies that implement Lean experience positive effects but
points out that most often goes to fast forward.
"Lean can never be used as a quick fix to become more profitable”
(Dubey, 2012)
He mentioned five points that are important to meet in order to achieve the best outcomes
in introduction of Lean.
• Philosophy before method - The key is to create an understanding of the philosophy,
to create a common desire and commitment within the organization. It's easy to skip
this step and instead focus on methods and tools, which usually leads to failure.
35
• Pull instead of Push - There is a risk in forcing the employees to the new philosophy.
The company which has been in a hurry to introduce Lean misses the importance of
the employee involvement and eventually the whole philosophy may fail. Instead,
create small pilot groups who can show good examples and success to spread the will
of the organization.
• "Whom or who?" before "what or how?" - Again choose the right people to operate
and drive the philosophy. Bring in outside resources early and attract those who
show interest. How Lean is to be used or which tools are to be used is not essential in
the starting phase.
• Lean is not a project! - A project is underway for a limited period of time while
implementation of Lean is part of an organization's long-term goals without
deadlines.
• Thoughtful and correct - Do not choose the easy way out. Plan each step and provide
proper resources.
3.5 Value Stream
A Value Stream is all the activities, both those that create value and those that do not, from
raw materials all the way to the customer (Rother & Shook, 1999). The opposite of value is
waste. Every company needs to work on constantly improving its share of value creation in
relative to non-value adding activities. This can be done in two ways, to prevent and
reducing waste and optimizing the value-time (Womack & Jones, 2003).
"Whenever there is a product for a customer, there is also a Value Stream. The challenge is in
identifying this flow"
(Womack & Jones, 2003)
The critical starting point in Lean Production is the value. Womack and Jones (2003) argued
that value can only be defined by the end customer and then it is up to the manufacturer to
know the expectations of the customer and apply characteristics and processes accordingly
which will increase value. After the customer defines what the value is the manufacturer
should consider where value is created.
36
Value Stream Mapping
One of the Lean tools for working on the efficiency of Value Streams is Value Stream
Mapping/Analysis. The method of Value Stream Analysis has its origins in the Toyota
Production System (TPS) and includes mapping, analysis and design of business value flows.
It covers all stages, both those that create value and those that do not, from raw materials
all the way to the customer. Mapping the Value Stream is a qualitative method which
describes in detail how the business should work to achieve a good flow. It is a good and
simple method to understand the flow and describe the effects of what is done and what
must be done to improve business performance (Rother & Shook, 1999).
"Value Stream Mapping is the language of Lean" (Rother & Shook, 1999)
Value Stream Mapping is also called the paper-and-pencil method since the information and
material flow which a production system consists of is drawn in paper with pencil. Value
Stream Analysis uses a standardized international language. The symbols used for
customers, shipments, inventory and so on are symbols that everyone can understand
(Dennis, 2007).
It is important that it is the reality which is described. The mapping should be based on facts
and not personal experiences or information systems. The analysis helps to visualize and
understand the material and information flows that the product follows through. Usually in
manufacturing the focus is mainly only on the material flow, but it is equally important to
identify the flow of information because the flow of information which tells what to
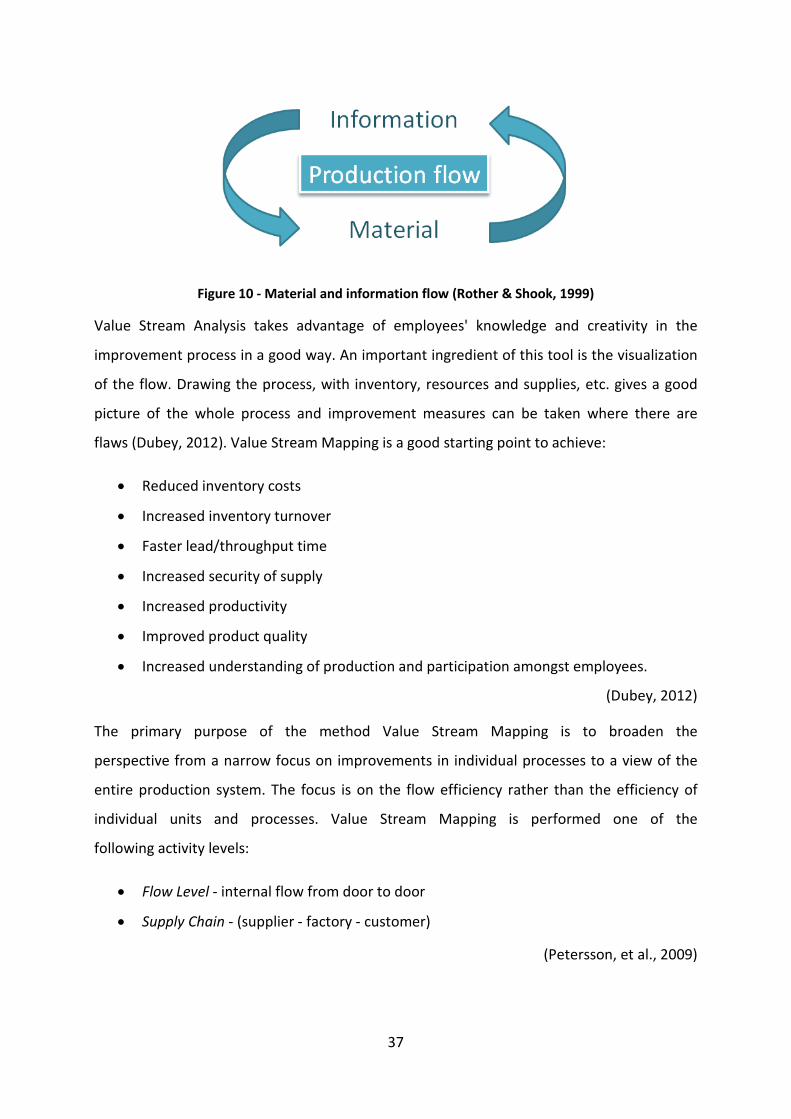
manufacture and what is to be done next, see figure 10. Value Stream Mapping therefore,
shows the relationship between material and information flows in a better way than many
other tools (Rother & Shook, 1999).
37
Figure 10 - Material and information flow (Rother & Shook, 1999) Value Stream Analysis takes advantage of employees' knowledge and creativity in the
improvement process in a good way. An important ingredient of this tool is the visualization
of the flow. Drawing the process, with inventory, resources and supplies, etc. gives a good
picture of the whole process and improvement measures can be taken where there are
flaws (Dubey, 2012). Value Stream Mapping is a good starting point to achieve:
• Reduced inventory costs
• Increased inventory turnover
• Faster lead/throughput time
• Increased security of supply
• Increased productivity
• Improved product quality
• Increased understanding of production and participation amongst employees.
(Dubey, 2012)
The primary purpose of the method Value Stream Mapping is to broaden the
perspective from a narrow focus on improvements in individual processes to a view of the
entire production system. The focus is on the flow efficiency rather than the efficiency of
individual units and processes. Value Stream Mapping is performed one of the
following activity levels:
• Flow Level - internal flow from door to door
• Supply Chain - (supplier - factory - customer)
(Petersson, et al., 2009)
38
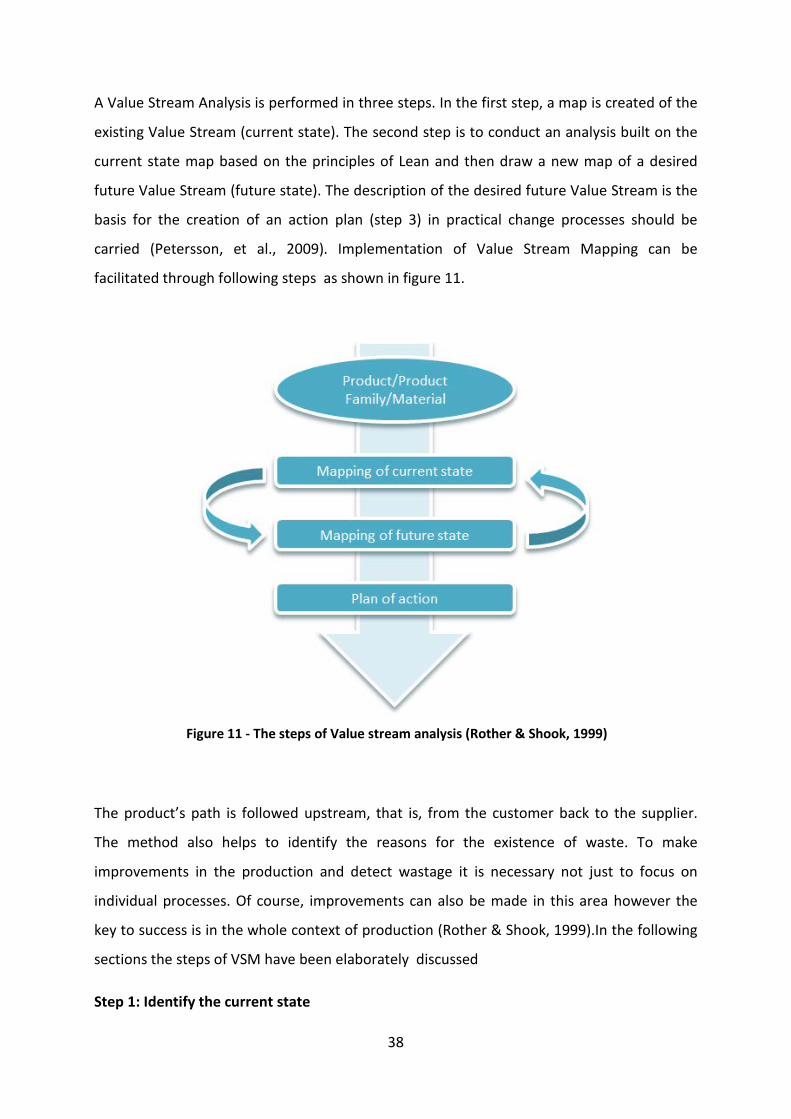
A Value Stream Analysis is performed in three steps. In the first step, a map is created of the
existing Value Stream (current state). The second step is to conduct an analysis built on the
current state map based on the principles of Lean and then draw a new map of a desired
future Value Stream (future state). The description of the desired future Value Stream is the
basis for the creation of an action plan (step 3) in practical change processes should be
carried (Petersson, et al., 2009). Implementation of Value Stream Mapping can be
facilitated through following steps as shown in figure 11.
The product’s path is followed upstream, that is, from the customer back to the supplier.
The method also helps to identify the reasons for the existence of waste. To make
improvements in the production and detect wastage it is necessary not just to focus on
individual processes. Of course, improvements can also be made in this area however the
key to success is in the whole context of production (Rother & Shook, 1999).In the following
sections the steps of VSM have been elaborately discussed
Step 1: Identify the current state
Figure 11 - The steps of Value stream analysis (Rother & Shook, 1999)
39
The first step is to find out how the business works today in detail. If the change process
starts without a comprehensive and accurate picture of today's business there is a high risk
of going towards wrong change measures. First, determine the product, product family or
material to be analyzed. It is usually better to start in a small scale since it becomes too
complex and resource intensive to try to improve all production flows simultaneously. Focus
on one product family, product or material and developing it into as good a flow as possible
in accordance with the principles of Lean. This allows the rest of the organization associate
with the advantages of Lean and it also creates a willingness of employees to improve other
streams (Petersson, et al., 2009). Subsequently, it is determined to what extent the analysis
should be done, which means to choose the level of detail the analysis is to be carried on,
flow level or supply chain. One the focus is defined the next step is to define the customer
requirements to determine the value of the chosen product (Rother & Shook, 1999).
The mapping begins with a quick walk along the Value Stream in order to get a feeling of the
flow, draw the sub-processes, level of inventory and other relevant information. The
material flow is plotted from left to right in the lower portion of the map, and the
information flow is plotted in the upper part from right to left. Next is to gather detailed
facts about each process such as lead time, cycle time, change-over time, delivery volume,
working hours (minus time for breaks, uptime) and number of employees. The value flow is
summarized with a timeline under the material flow showing the total lead time for a
product. The next step is to sum up the time required for value-adding activities and
compare it with the total lead time (Rother & Shook, 1999). Mapping of the current state in
itself resolves nothing, but its task is to quickly and graphically gather information about a
process to easily be able to point out problems in the current work flow (Keyte & Locher,
2008). An example of current state of VSM is shown in figure 12.

40
Figure 12 - Example of a current state map (Rother & Shook, 1999)
Step 2: Development of map of the future state
Step two is to take the map of the current state to conduct an analysis based on Lean
principles and then draw a new map of a desired future Value Stream (future state). The goal
is to provide a clear and agreed view of what the change will lead to. It is good to map a
picture of how the Value Stream will look after three months or after the year. According to
Keyte and Locher (2008) there should be no planning of anything more than 12 months since
the terms are often changing with time. This means that the future state map is an iterative
and living document which can be used for continuous improvement, also known as Kaizen.
Reducing lead time is usually a common goal in a Value Stream Analysis. To reduce the lead
time and get the material to flow more efficiently it is usually required that the process in
the Value Stream are tied closer together (Petersson, et al., 2009). A question which Rother
and Shook (1999) thinks is important to ask in VSM is "what can we accomplish with what
we already have?”. It's about the changes which do not lead to major investment costs or do
not take long time to develop and implement. Stalk and Houts golden rule follows:

41
"Never delay value-creating steps in favor for non-value-creating steps - try to take such
steps simultaneously"
(Bicheno, 2006)
To identify the options available to apply to the development of a future state, see figure 13,
some of the following questions can be asked:
• What does the customer specifically want and when can be delivered?
• How often the effectiveness should be monitored?
• Which steps create value and which causes waste?
• Is the sequence of the processes creating waste?
• How can the work flow with fewer interruptions?
• How should the workload and/or activities be balanced?
• What process improvements is necessary to achieve the future state?
(Keyte & Locher, 2008)
Figure 13 - Example of a desired future state (Rother & Shook, 1999)

42
Step 3: Plan of action to realize the future state
The last and most important step is to develop a detailed action plan that describes how the
change should happen. The mapping in steps 1 and 2 are good visual tools and foundations
for the improvement (Keyte & Locher, 2008). The description of the desired future Value
Stream forms a basis for the creation of the action plan on how the practical change process
should be carried out (Petersson, et al., 2009).
"What improvements are necessary in the process to get the Value Stream to flow through
the means specified on the map of the future state?"
A key issue in “Learning to See: Value Stream Mapping to add value and eliminate muda”
(Rother & Shook, 1999).
The action plan should be regarding one year and show; what is planned to be done, when it
will happen and contents of each step, measurable targets with clear milestones at set
times. The map of the current state changes with and when the current state coincides with
the future state map, it is time for developing a new Value Stream Map. Continuous
improvements can be carried out at all times because there is always is something that can
be improved (Rother & Shook, 1999).
43
4 Company Description The following chapter presentations the the role of Atlas Copco and the CTO division in Nasik. Successively the product of the study - CP1230 – is presented and its key components.
4.1 Atlas Copco Group
Atlas Copco is a Swedish industrial group with world-leading positions in manufacturing
compressors and mining equipment. The company was founded and named AB Atlas in 1873
in Stockholm, Sweden by Edward Fränckel. It started off by producing and selling material
used in railway operations. Gradually, the focus was directed towards developing
compressors with the business motto sustainable productivity.,. The current company
name Atlas Copco was established in 1956. Since 1968 the group’s operations have been
divided in three business areas naming Air Compressors, Construction and Mining
Equipment, Industrial Power Tools and Assembly Systems. The company currently
manufactures products at 68 production sites in 20 countries. The majority of manufacturing
is mainly done in Belgium, Sweden, Germany, the United States, India and China (Atlas
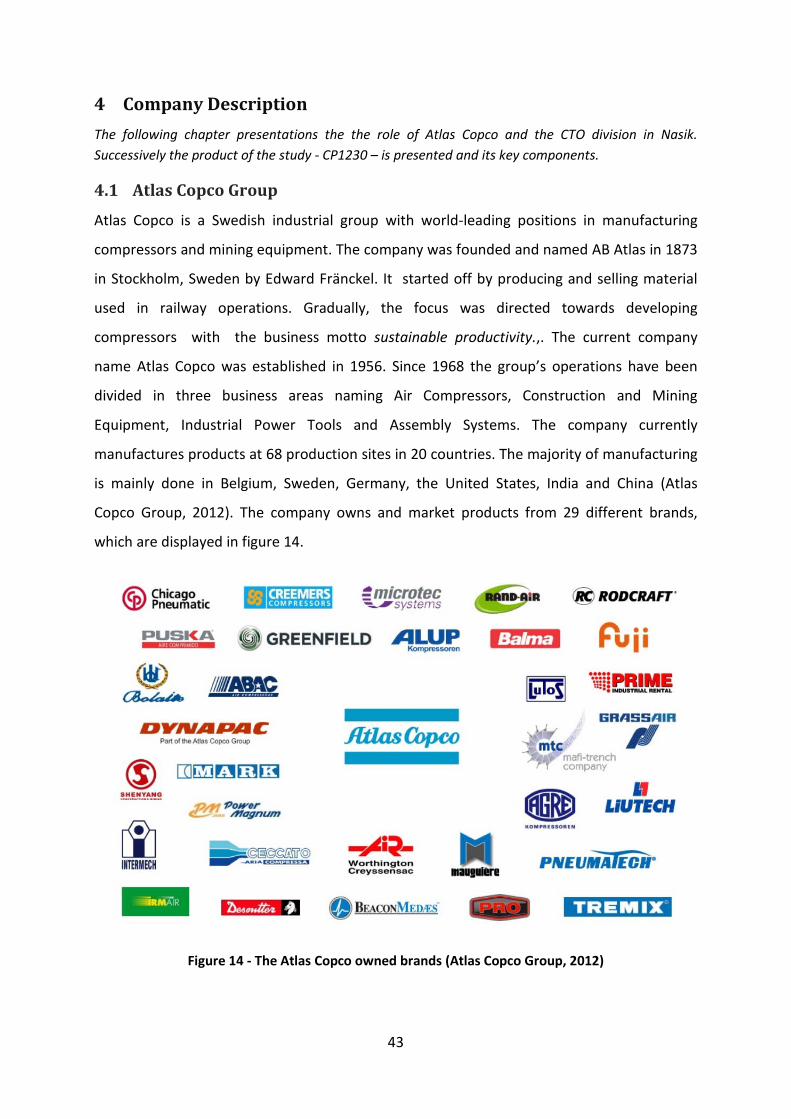
Copco Group, 2012). The company owns and market products from 29 different brands,
which are displayed in figure 14.
Figure 14 - The Atlas Copco owned brands (Atlas Copco Group, 2012)
44
Atlas Copco has strong positions globally and concentrates on strengthening its position
within the segments where they are already strong and has core competence. To reach the
overall strategic directions are focused around organic and acquired growth, strengthened
aftermarket and continuous improvements (Atlas Copco, 2012).
As of January 2012 the group employee’s more than 33 000 people and is the 3rd largest
actor in the Swedish stock market OMX with a net worth of 199.2 billion SEK, surpassing
telecom giants Ericsson and Telia Sonera (Dagens Industri, 2012).
Atlas Copco India
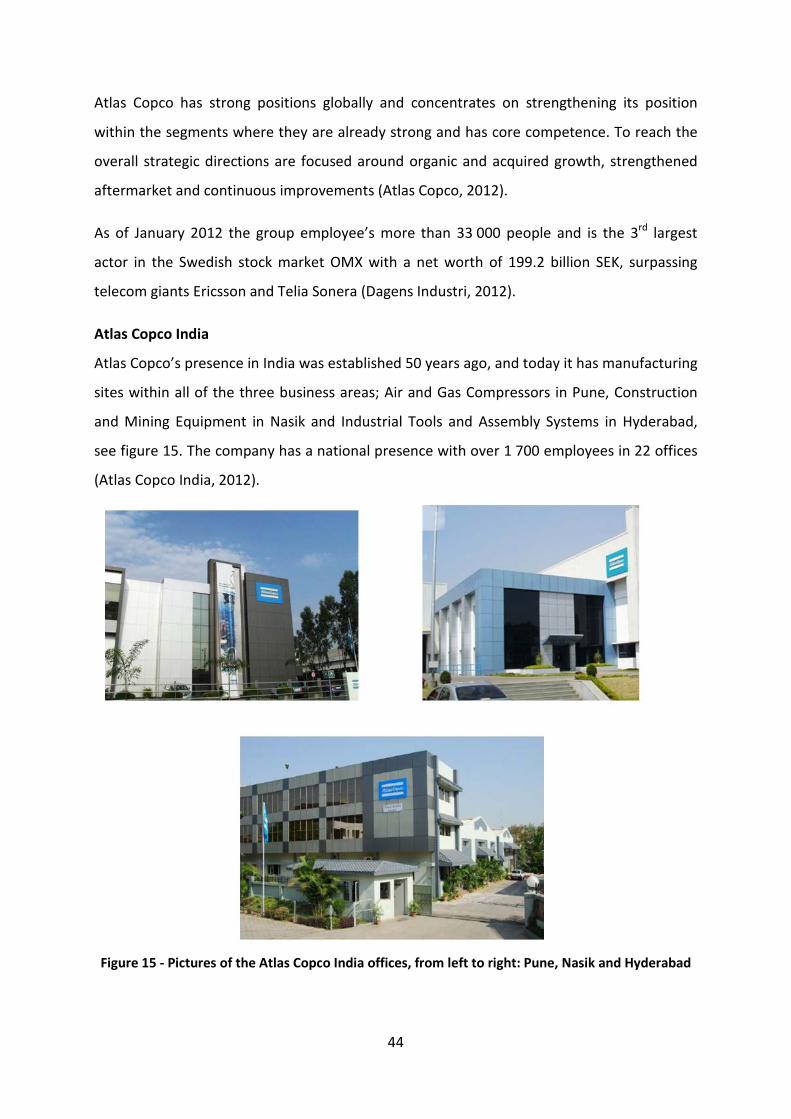
Atlas Copco’s presence in India was established 50 years ago, and today it has manufacturing
sites within all of the three business areas; Air and Gas Compressors in Pune, Construction
and Mining Equipment in Nasik and Industrial Tools and Assembly Systems in Hyderabad,
see figure 15. The company has a national presence with over 1 700 employees in 22 offices
(Atlas Copco India, 2012).
Figure 15 - Pictures of the Atlas Copco India offices, from left to right: Pune, Nasik and Hyderabad
45
Atlas Copco Nasik
The Nasik Atlas Copco plant is dedicated to Construction and Mining Equipment (CMT), the
facility includes production units covering products such as surface drilling equipment, rotary
blast-hole and water-well drills, down-the-hole hammers and construction tools divided in
five different CMT divisions. Divisions are Atlas Copco Drilling Solutions (ADS), Surface
Drilling Equipment (SDE), Construction Tools and Organization (CTO), Road Construction
Equipment and Underground Rock Excavation (URE). The SDE plant is the largest facility for
manufacturing of pneumatic crawlers in the Atlas Copco Group and The RCE division
contains of Dynapac, manufacturers of compaction and paving equipment acquired by the
Atlas Copco Group in 2007.
Atlas Copco CTO
Atlas Copco Construction Tools is a department within the Construction and Mining
Technique division. Here, hydraulic, pneumatic and gasoline-driven equipment for
demolition, recycling, compaction, rock drilling and concrete works are being produced and
merchandised. The products are sold by miscellaneous brands through a worldwide sales
and service organization. The department has its headquarters in Stockholm and maintains
manufacturing facilities in Europe, Africa and Asia. At Nasik facility CTO products are
manufactured under the brands; Atlas Copco and Chicago Pneumatic with a range of 45
different product types. Organization is structured into Sourcing Team, Flow Team, Quality
Assurance team and Production Planning Team.
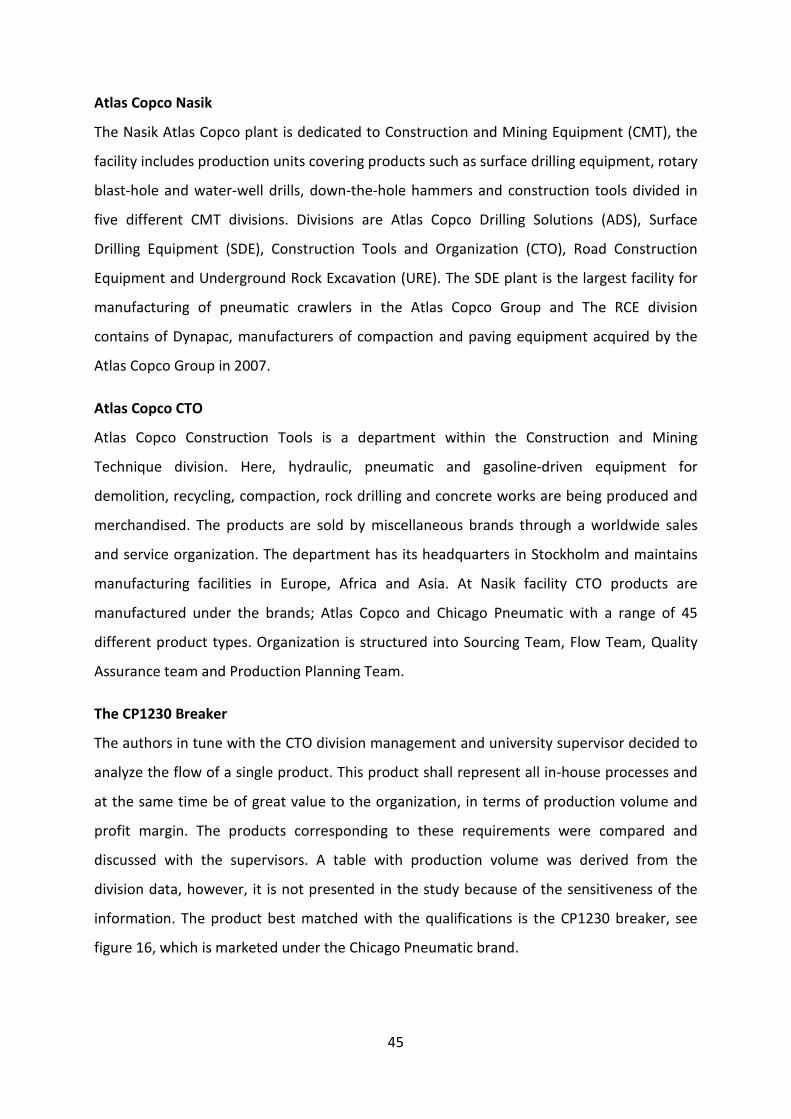
The CP1230 Breaker
The authors in tune with the CTO division management and university supervisor decided to
analyze the flow of a single product. This product shall represent all in-house processes and
at the same time be of great value to the organization, in terms of production volume and
profit margin. The products corresponding to these requirements were compared and
discussed with the supervisors. A table with production volume was derived from the
division data, however, it is not presented in the study because of the sensitiveness of the
information. The product best matched with the qualifications is the CP1230 breaker, see
figure 16, which is marketed under the Chicago Pneumatic brand.
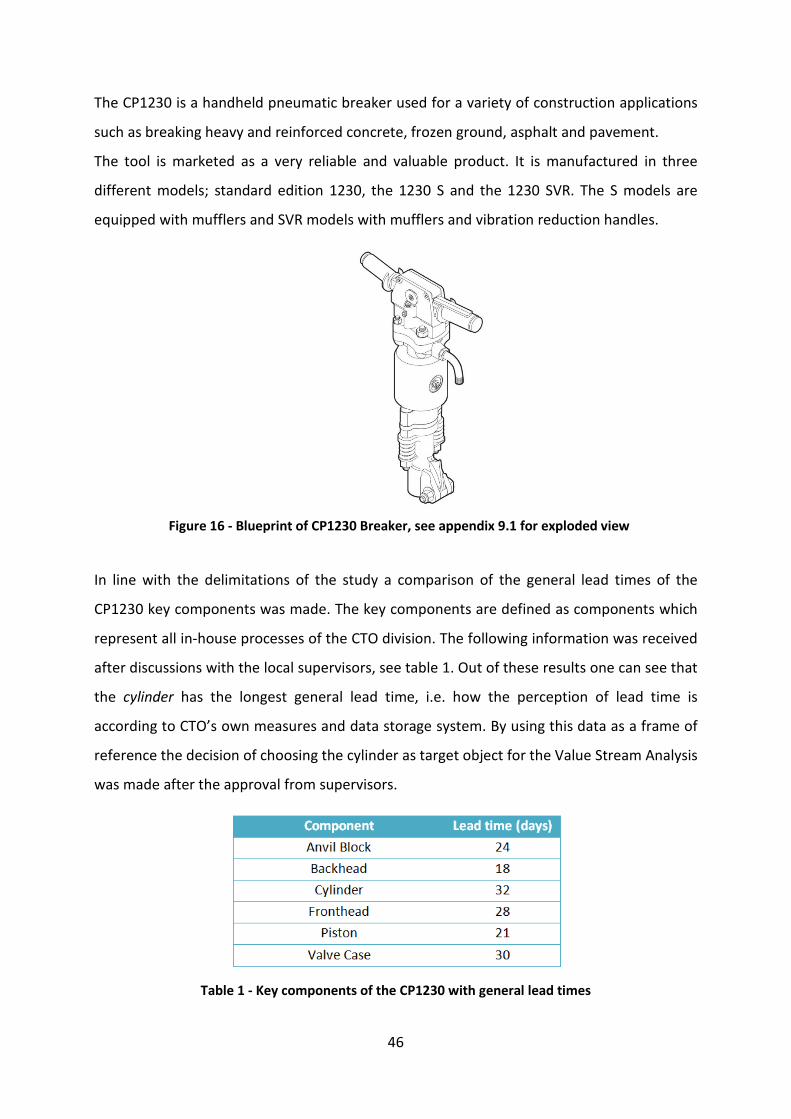
46
The CP1230 is a handheld pneumatic breaker used for a variety of construction applications
such as breaking heavy and reinforced concrete, frozen ground, asphalt and pavement.
The tool is marketed as a very reliable and valuable product. It is manufactured in three
different models; standard edition 1230, the 1230 S and the 1230 SVR. The S models are
equipped with mufflers and SVR models with mufflers and vibration reduction handles.
In line with the delimitations of the study a comparison of the general lead times of the
CP1230 key components was made. The key components are defined as components which
represent all in-house processes of the CTO division. The following information was received
after discussions with the local supervisors, see table 1. Out of these results one can see that
the cylinder has the longest general lead time, i.e. how the perception of lead time is
according to CTO’s own measures and data storage system. By using this data as a frame of
reference the decision of choosing the cylinder as target object for the Value Stream Analysis
was made after the approval from supervisors.
Table 1 - Key components of the CP1230 with general lead times
Figure 16 - Blueprint of CP1230 Breaker, see appendix 9.1 for exploded view

47
5 Current state description The following chapter providse a description of the CTO division’s production layout and processes involved in the production. An in-depth description of the material and information flow through out the facility is also presented.
5.1 Production layout
The CTO division is divided in three facilities, the assembly and machine-shop building, heat
treatment building and the testing, inspection and painting building.
Figure 17 - Production layout of the CTO division, see appendix 10.3 for full-scale size
In figure 17; blue chamfered rectangles are assembly cells and green rectangles are
inventory. When observing and analyzing the Value Stream of the CP1230 and the chosen
key components, the in-house flow has been divided in two separate flows. This breakdown
is not only used by the authors to deal with a less complex Value Stream in theory but is very
much a direct reflection of the physical flow at the facility. The Value Stream will henceforth
be regarded as either pre C-stock or post C-stock (abbreviation of complete stock). The pre
C-stock flow embodies all processes that the cylinder goes through before becoming a
finished component ready to be used in the assembly. Post C-stock represents the flow of
finished cylinder and the assembled CP1230 breaker. In the transition between pre and post
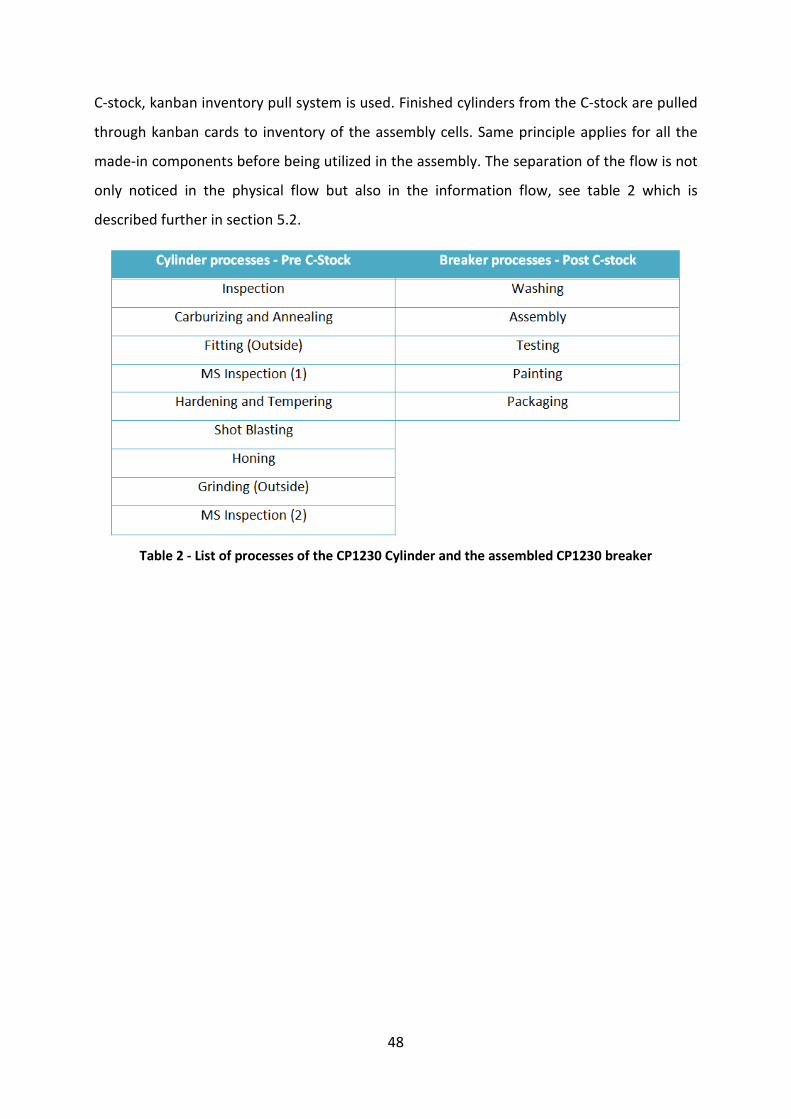
48
C-stock, kanban inventory pull system is used. Finished cylinders from the C-stock are pulled
through kanban cards to inventory of the assembly cells. Same principle applies for all the
made-in components before being utilized in the assembly. The separation of the flow is not
only noticed in the physical flow but also in the information flow, see table 2 which is
described further in section 5.2.
Table 2 - List of processes of the CP1230 Cylinder and the assembled CP1230 breaker
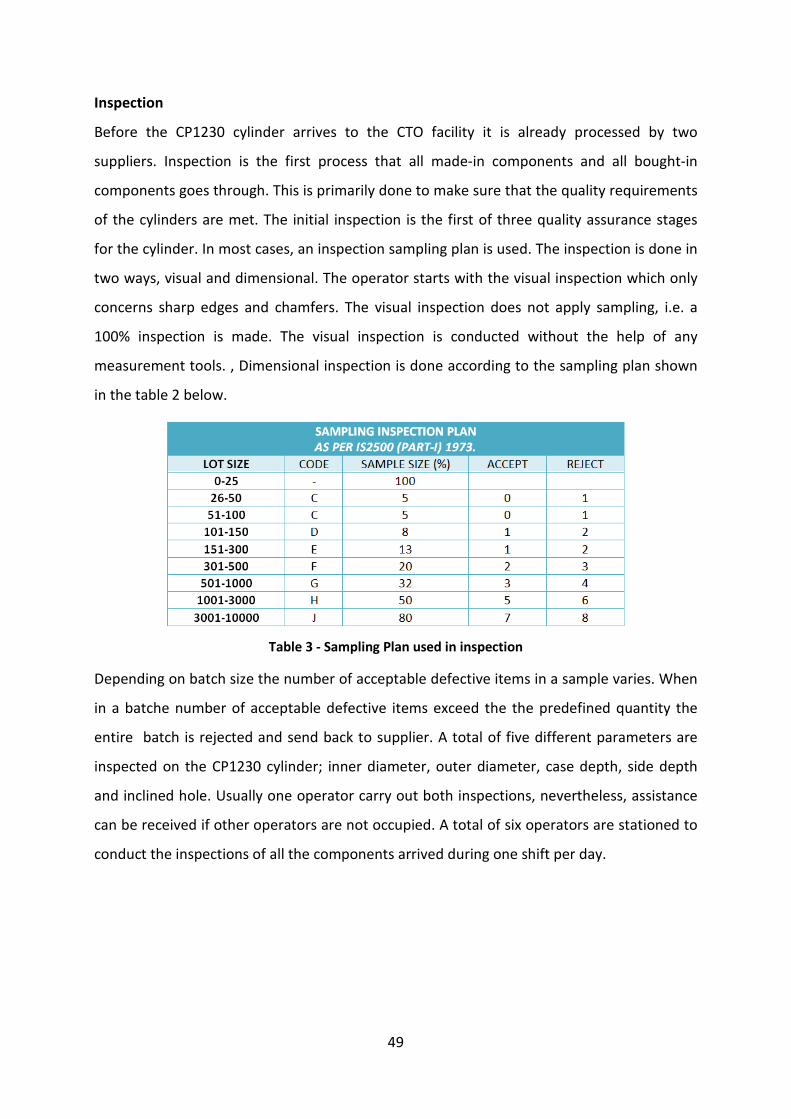
49
Inspection
Before the CP1230 cylinder arrives to the CTO facility it is already processed by two
suppliers. Inspection is the first process that all made-in components and all bought-in
components goes through. This is primarily done to make sure that the quality requirements
of the cylinders are met. The initial inspection is the first of three quality assurance stages
for the cylinder. In most cases, an inspection sampling plan is used. The inspection is done in
two ways, visual and dimensional. The operator starts with the visual inspection which only
concerns sharp edges and chamfers. The visual inspection does not apply sampling, i.e. a
100% inspection is made. The visual inspection is conducted without the help of any
measurement tools. , Dimensional inspection is done according to the sampling plan shown
in the table 2 below.
Table 3 - Sampling Plan used in inspection
Depending on batch size the number of acceptable defective items in a sample varies. When
in a batche number of acceptable defective items exceed the the predefined quantity the
entire batch is rejected and send back to supplier. A total of five different parameters are
inspected on the CP1230 cylinder; inner diameter, outer diameter, case depth, side depth
and inclined hole. Usually one operator carry out both inspections, nevertheless, assistance
can be received if other operators are not occupied. A total of six operators are stationed to
conduct the inspections of all the components arrived during one shift per day.
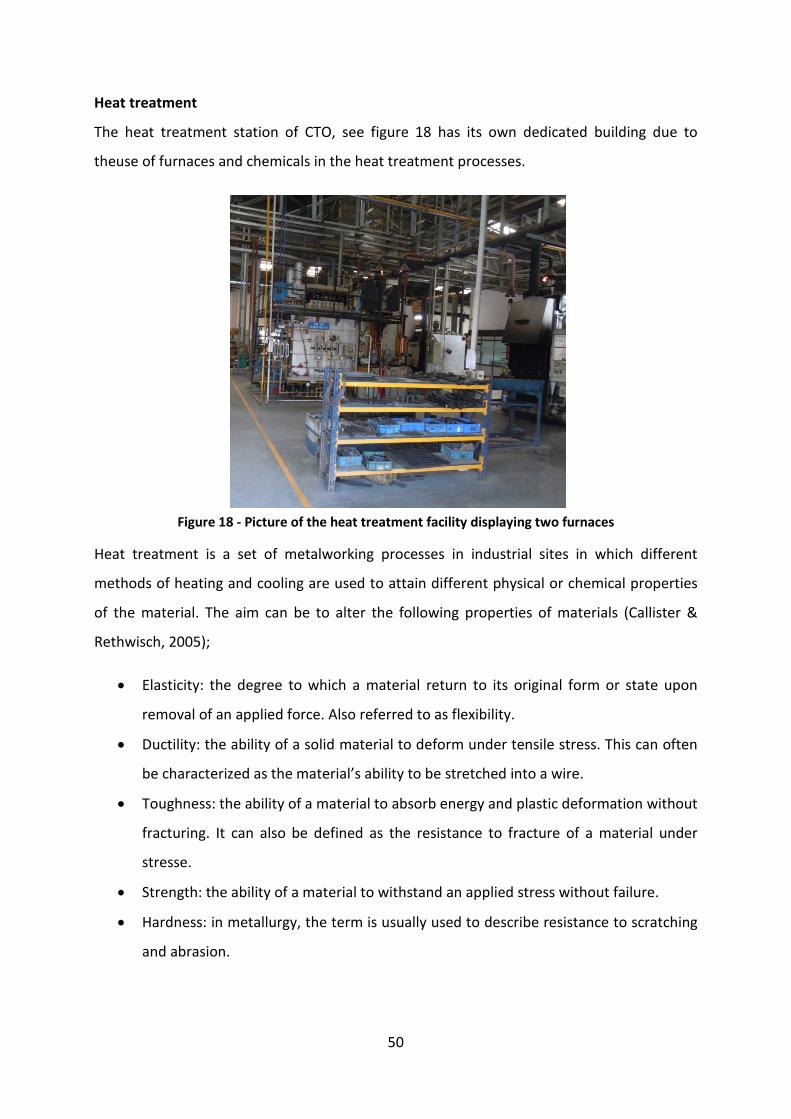
50
Heat treatment
The heat treatment station of CTO, see figure 18 has its own dedicated building due to
theuse of furnaces and chemicals in the heat treatment processes.
Figure 18 - Picture of the heat treatment facility displaying two furnaces
Heat treatment is a set of metalworking processes in industrial sites in which different
methods of heating and cooling are used to attain different physical or chemical properties
of the material. The aim can be to alter the following properties of materials (Callister &
Rethwisch, 2005);
• Elasticity: the degree to which a material return to its original form or state upon
removal of an applied force. Also referred to as flexibility.
• Ductility: the ability of a solid material to deform under tensile stress. This can often
be characterized as the material’s ability to be stretched into a wire.
• Toughness: the ability of a material to absorb energy and plastic deformation without
fracturing. It can also be defined as the resistance to fracture of a material under
stresse.
• Strength: the ability of a material to withstand an applied stress without failure.
• Hardness: in metallurgy, the term is usually used to describe resistance to scratching
and abrasion.
51
The methods applied to achieve the different physical properties are briefly described in the
following sections:
Carburizing
The process involves heating the metallic surface of steel with a source of carbon. It is used
to increase the surface hardness of low carbon steel (Callister & Rethwisch, 2005). The
technique is applied with carbon-bearing gases or plasmas and is carefully controlled in
furnaces with low pressures or vacuum chambers. The CTO division uses furnace with a
temperature reaching up to 900°C
Annealing
This process is used to change the ductility and hardness properties of a material. The
method is to heat the material above the critical temperature, maintaining a suitable
temperature, and then quickly cooling the material. Annealing is used to induce ductility,
soften material, relieve internal stress, refine the structure by making it homogenous and
improve cold working properties (Callister & Rethwisch, 2005).
Hardening
This process is used to increase the hardness of the material, however, it is done after the
material has been processed with soft machining, such as, fitting, turning, milling and
drilling, which for the CP1230 cylinder is handled by an outside supplier.
The material in this stage already contains enough carbon to obtain a corresponding
increase in hardness by heating and quenching. The steel is heated to a temperature where
the iron phase changes from ferrite into austenite. In austenitic form, steel can dissolve a lot
more carbon. Once the carbon has been dissolved, the material is quenched. It is important
to quench with a high cooling rate so that the carbon does not have time to form
precipitates of carbides. Because of the extreme supersaturating of solid solution carbon,
the material phase changes to a martensitic structure, which is extremely hard due to a
combined effect of distorted crystal structure and extreme solid solution strengthening
(Callister & Rethwisch, 2005).
52
Tempering
This process should be carried out within a reasonable time after hardening and quenching,
i.e. preferably within an hour. It is of huge importance that the material is allowed to be
cooled down to room temperature before tempering is started. The transformation to
martensite will otherwise be interrupted and the hardening result may be impaired (Callister
& Rethwisch, 2005).
The martensitic structure arising from the hardening process is extremely hard but also very
brittle. For this reason the material is tempered i.e. heated to a temperature between the
room temperature and annealing temperature (lower critical temperature), resulting in a
good balance between hardness, sharpness retention, grind ability and toughness (Callister
& Rethwisch, 2005).
After tempering the component is ready for hard machining without the risk of breaking.
Other operations in heat treatment
Besides heat treatment procedures mentioned above, the heat treatment facility also holds
machines and operations involved with finishing and refining a material. Such operations
are:
• Dibbering machine: a vibrating machine which is used to sharpening of the edges of
the material.
• Shot blasting: an abrasive blasting machine which shoots beams of fine abrasive
material (small corned sand) against the surface of the metal under high pressure to
smoothen out rough surface or remove surface containments.
• Blackening: A chemical process to prevent oxidation of metals. It is also gives the
material a nice appearance.
The heat treatment facility works 24 hours per day, seven days a week, in three shifts per
day. Each process requires one or two operators for setup and after that the machine are
running itself. For the CP1230 cylinder, the carburizing and annealing process takes about 40
hours and the hardening and tempering process takes about 2 hours.
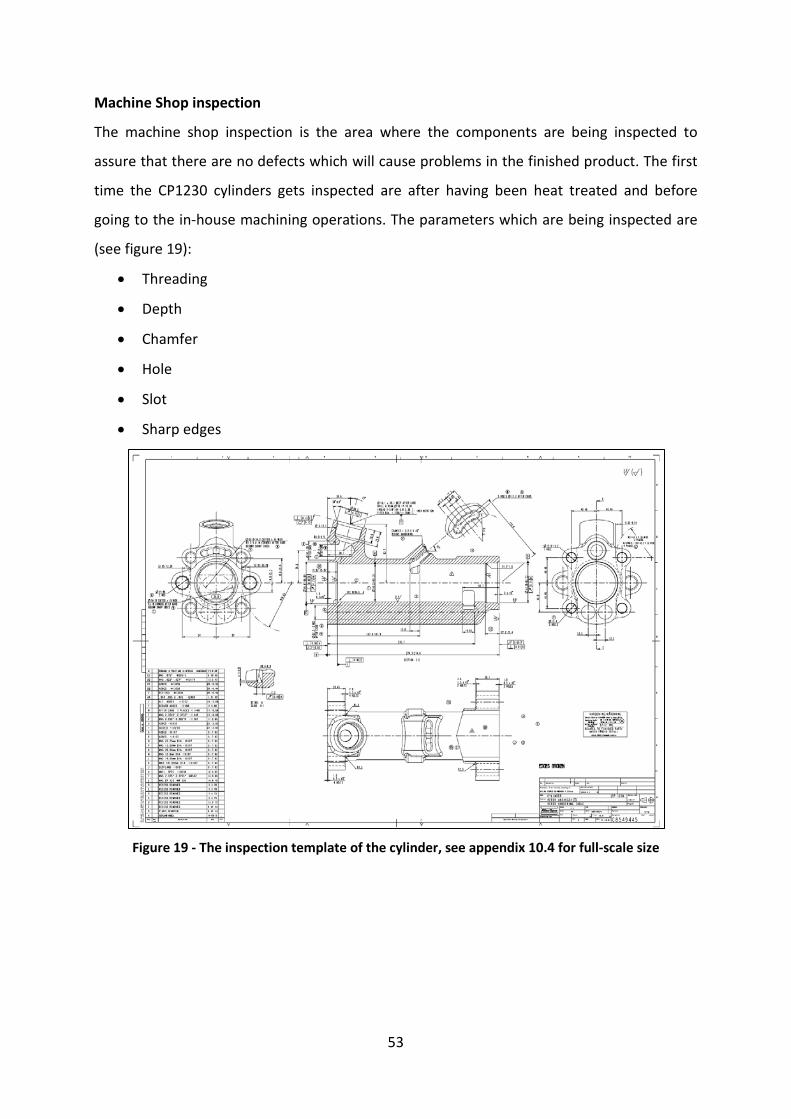
53
Machine Shop inspection
The machine shop inspection is the area where the components are being inspected to
assure that there are no defects which will cause problems in the finished product. The first
time the CP1230 cylinders gets inspected are after having been heat treated and before
going to the in-house machining operations. The parameters which are being inspected are
(see figure 19):
• Threading
• Depth
• Chamfer
• Hole
• Slot
• Sharp edges
Figure 19 - The inspection template of the cylinder, see appendix 10.4 for full-scale size
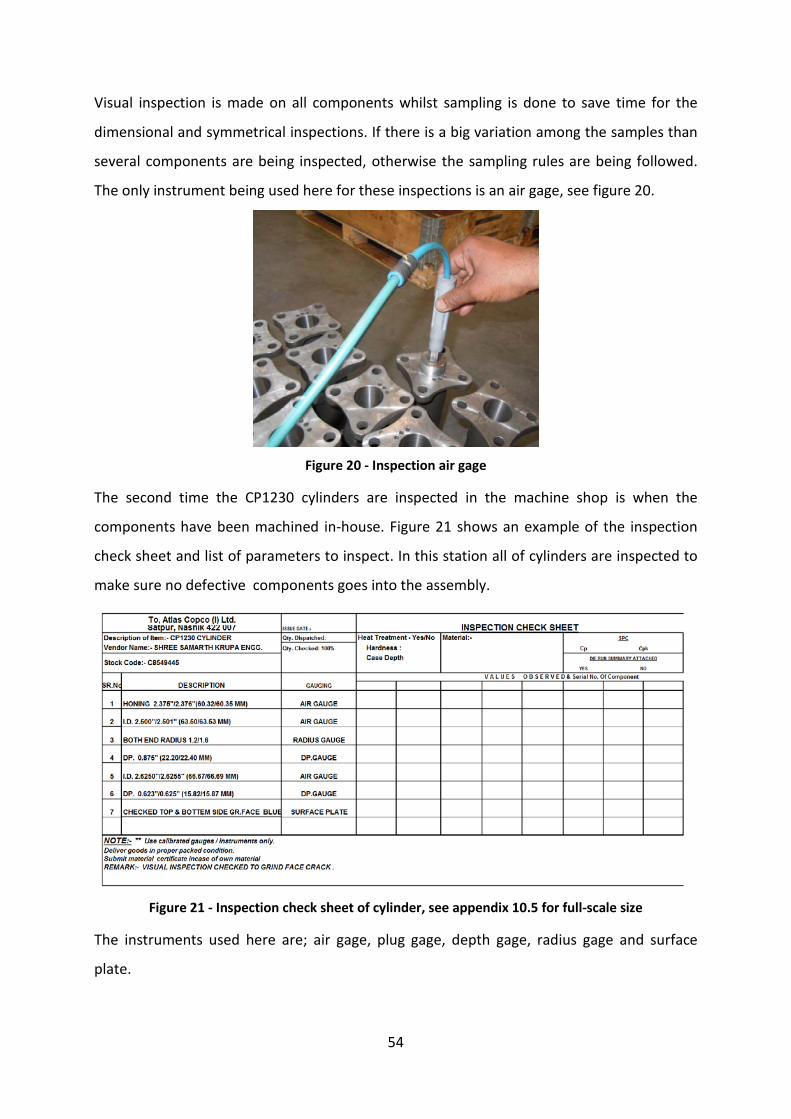
54
Visual inspection is made on all components whilst sampling is done to save time for the
dimensional and symmetrical inspections. If there is a big variation among the samples than
several components are being inspected, otherwise the sampling rules are being followed.
The only instrument being used here for these inspections is an air gage, see figure 20.
Figure 20 - Inspection air gage
The second time the CP1230 cylinders are inspected in the machine shop is when the
components have been machined in-house. Figure 21 shows an example of the inspection
check sheet and list of parameters to inspect. In this station all of cylinders are inspected to
make sure no defective components goes into the assembly.
Figure 21 - Inspection check sheet of cylinder, see appendix 10.5 for full-scale size
The instruments used here are; air gage, plug gage, depth gage, radius gage and surface
plate.
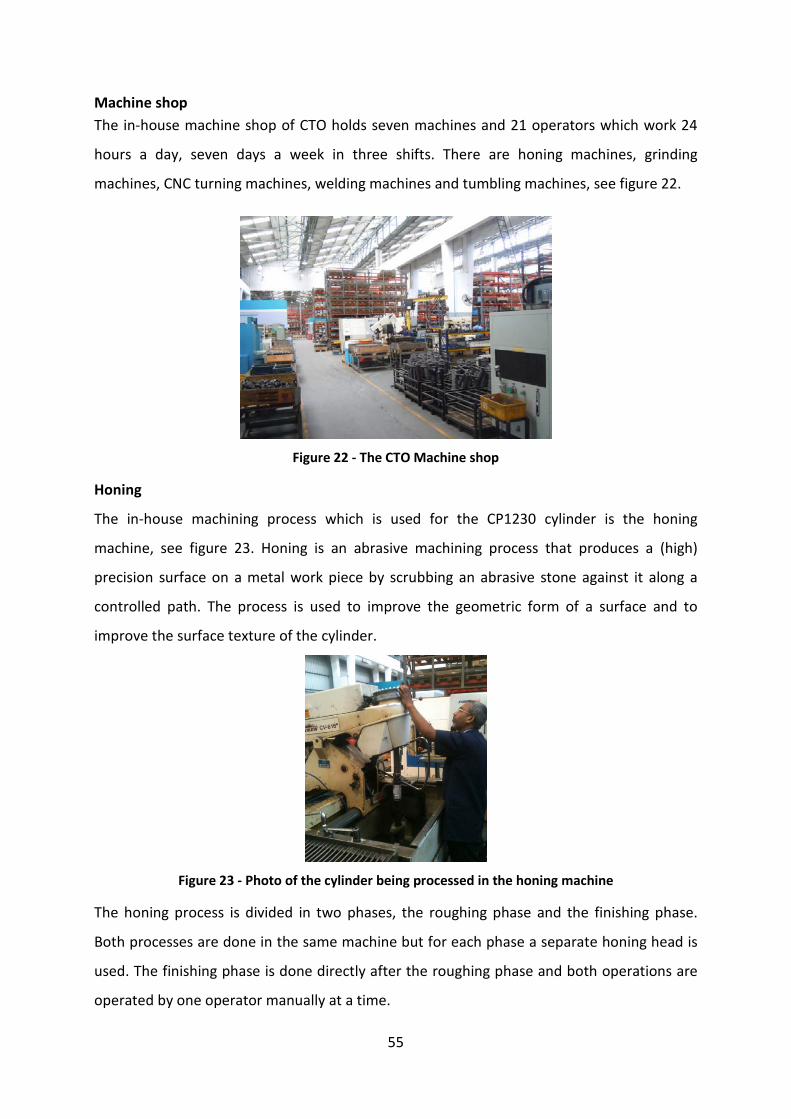
55
Machine shop The in-house machine shop of CTO holds seven machines and 21 operators which work 24
hours a day, seven days a week in three shifts. There are honing machines, grinding
machines, CNC turning machines, welding machines and tumbling machines, see figure 22.
Figure 22 - The CTO Machine shop
Honing
The in-house machining process which is used for the CP1230 cylinder is the honing
machine, see figure 23. Honing is an abrasive machining process that produces a (high)
precision surface on a metal work piece by scrubbing an abrasive stone against it along a
controlled path. The process is used to improve the geometric form of a surface and to
improve the surface texture of the cylinder.
Figure 23 - Photo of the cylinder being processed in the honing machine
The honing process is divided in two phases, the roughing phase and the finishing phase.
Both processes are done in the same machine but for each phase a separate honing head is
used. The finishing phase is done directly after the roughing phase and both operations are
operated by one operator manually at a time.
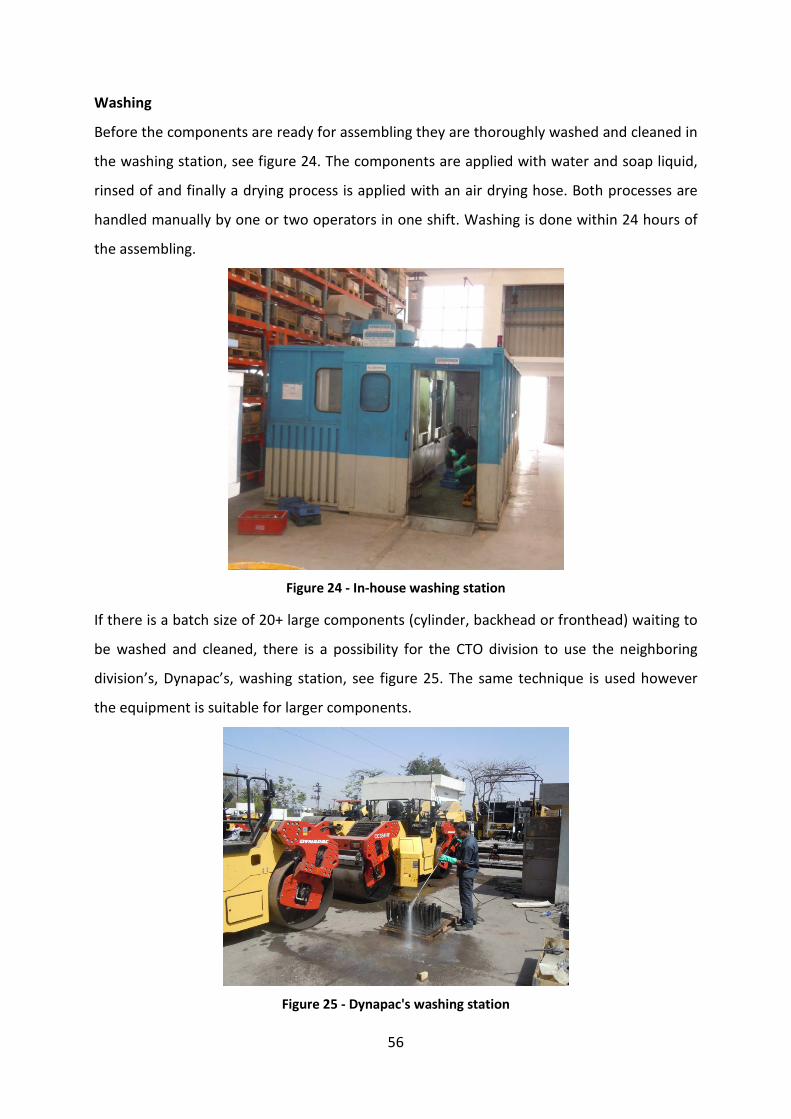
56
Washing
Before the components are ready for assembling they are thoroughly washed and cleaned in
the washing station, see figure 24. The components are applied with water and soap liquid,
rinsed of and finally a drying process is applied with an air drying hose. Both processes are
handled manually by one or two operators in one shift. Washing is done within 24 hours of
the assembling.
Figure 24 - In-house washing station
If there is a batch size of 20+ large components (cylinder, backhead or fronthead) waiting to
be washed and cleaned, there is a possibility for the CTO division to use the neighboring
division’s, Dynapac’s, washing station, see figure 25. The same technique is used however
the equipment is suitable for larger components.
Figure 25 - Dynapac's washing station
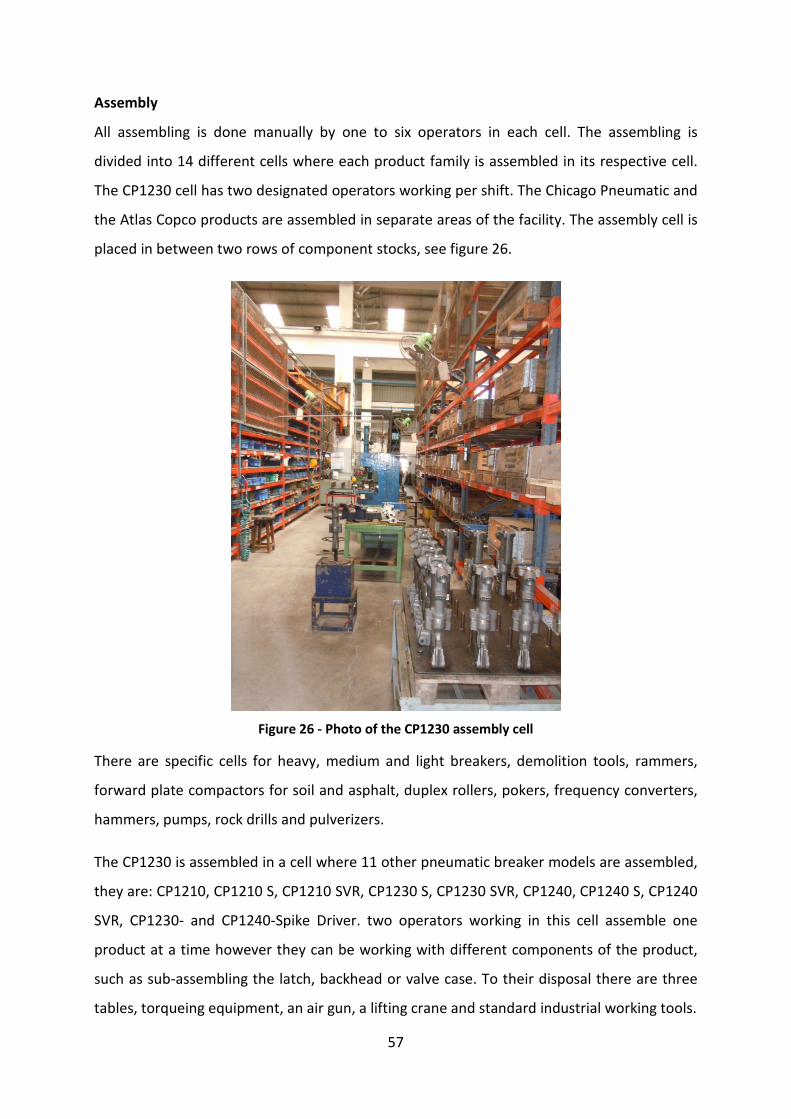
57
Assembly
All assembling is done manually by one to six operators in each cell. The assembling is
divided into 14 different cells where each product family is assembled in its respective cell.
The CP1230 cell has two designated operators working per shift. The Chicago Pneumatic and
the Atlas Copco products are assembled in separate areas of the facility. The assembly cell is
placed in between two rows of component stocks, see figure 26.
Figure 26 - Photo of the CP1230 assembly cell
There are specific cells for heavy, medium and light breakers, demolition tools, rammers,
forward plate compactors for soil and asphalt, duplex rollers, pokers, frequency converters,
hammers, pumps, rock drills and pulverizers.
The CP1230 is assembled in a cell where 11 other pneumatic breaker models are assembled,
they are: CP1210, CP1210 S, CP1210 SVR, CP1230 S, CP1230 SVR, CP1240, CP1240 S, CP1240
SVR, CP1230- and CP1240-Spike Driver. two operators working in this cell assemble one
product at a time however they can be working with different components of the product,
such as sub-assembling the latch, backhead or valve case. To their disposal there are three
tables, torqueing equipment, an air gun, a lifting crane and standard industrial working tools.
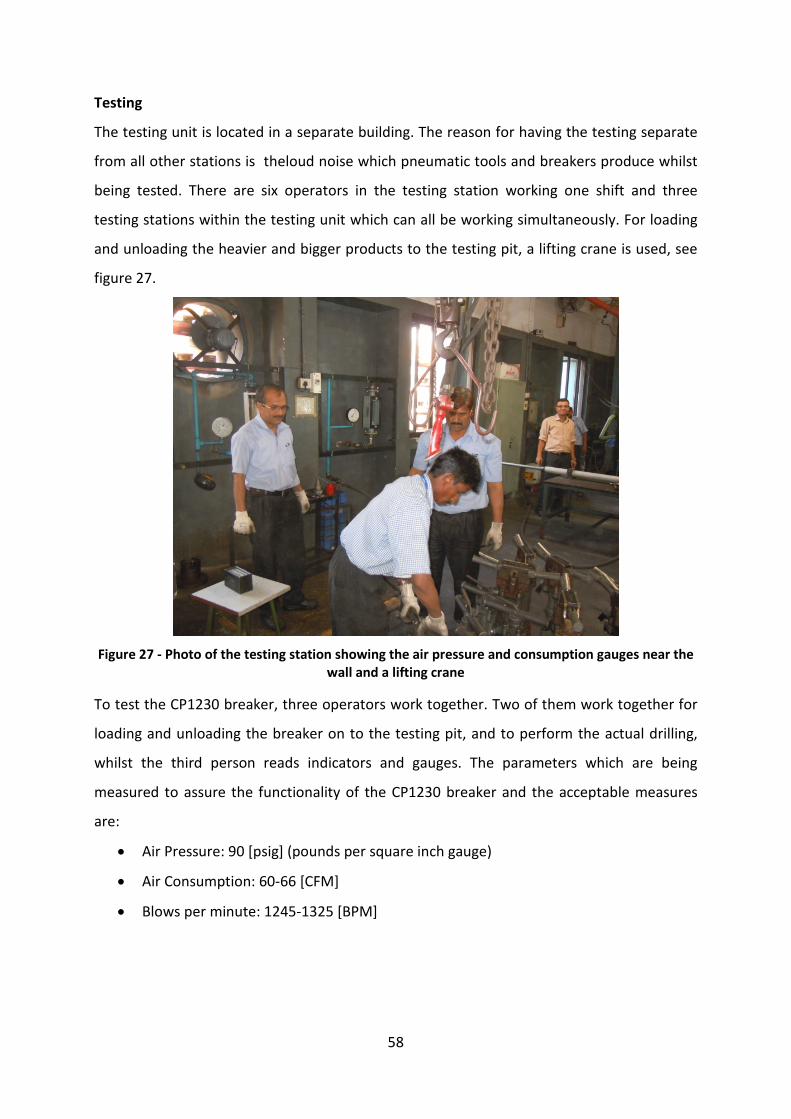
58
Testing
The testing unit is located in a separate building. The reason for having the testing separate
from all other stations is theloud noise which pneumatic tools and breakers produce whilst
being tested. There are six operators in the testing station working one shift and three
testing stations within the testing unit which can all be working simultaneously. For loading
and unloading the heavier and bigger products to the testing pit, a lifting crane is used, see
figure 27.
Figure 27 - Photo of the testing station showing the air pressure and consumption gauges near the
wall and a lifting crane
To test the CP1230 breaker, three operators work together. Two of them work together for
loading and unloading the breaker on to the testing pit, and to perform the actual drilling,
whilst the third person reads indicators and gauges. The parameters which are being
measured to assure the functionality of the CP1230 breaker and the acceptable measures
are:
• Air Pressure: 90 [psig] (pounds per square inch gauge)
• Air Consumption: 60-66 [CFM]
• Blows per minute: 1245-1325 [BPM]

59
Painting
The painting station is managed by two operators and run for one shift. The method used is
spray painting, the operators use small handheld paint guns connected with color retainers.
Two paint areas are setup, one for CP (Chicago Pneumatic brand) and one for TEX tools
(Atlas Copco brand). All CP tools are painted red and all TEX tools are painted black
regardless of the nature of the tool. Since all CP tools are painted with the same color,
different tools can be painted simultaneously. Tools are hanged on hooks and moved from
the painting area to the drying area of the station. One operator move and prepare the tools
and the a second operator spray-paints the tools, see figure 28.
Figure 28 - Photo of the painting station, showing installation of breakers on hooks and first
coating process
First step of the process is cleaning the tools and preparing the surface to be painted.
Second step is to cover the small part of the tools that is not painted with either tape or
grease if the area is too small for taping. Hereafter the tools are ready for primary color
coating (red oxide for CP). This is a transparent red used before the first coating of red paint
which is sprayed on twice. In between the coatings the tools need to dry. This is done either
by using a heat dryer or air drying. Both methods capable of accomplishing same result but
with different timings; heat drying takes 50% of the time air drying does.
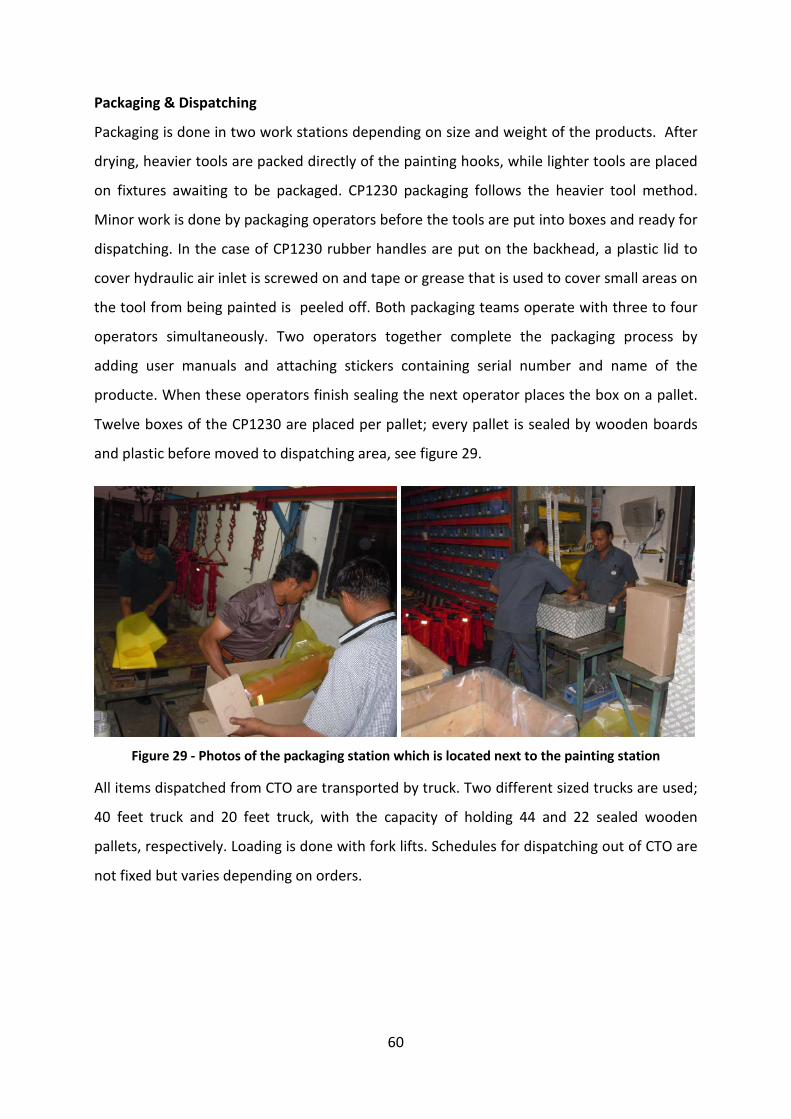
60
Packaging & Dispatching
Packaging is done in two work stations depending on size and weight of the products. After
drying, heavier tools are packed directly of the painting hooks, while lighter tools are placed
on fixtures awaiting to be packaged. CP1230 packaging follows the heavier tool method.
Minor work is done by packaging operators before the tools are put into boxes and ready for
dispatching. In the case of CP1230 rubber handles are put on the backhead, a plastic lid to
cover hydraulic air inlet is screwed on and tape or grease that is used to cover small areas on
the tool from being painted is peeled off. Both packaging teams operate with three to four
operators simultaneously. Two operators together complete the packaging process by
adding user manuals and attaching stickers containing serial number and name of the
producte. When these operators finish sealing the next operator places the box on a pallet.
Twelve boxes of the CP1230 are placed per pallet; every pallet is sealed by wooden boards
and plastic before moved to dispatching area, see figure 29.
Figure 29 - Photos of the packaging station which is located next to the painting station
All items dispatched from CTO are transported by truck. Two different sized trucks are used;
40 feet truck and 20 feet truck, with the capacity of holding 44 and 22 sealed wooden
pallets, respectively. Loading is done with fork lifts. Schedules for dispatching out of CTO are
not fixed but varies depending on orders.
61
5.2 Information flow
Information spreads within CTO electronically and manually. Different approaches are used
depending on function. Pattern of information flows of these functions are described below.
Orders
The logistics department of CTO receives production orders from the Power Tools
Distribution center (PTD) in Hoeselt, Belgium. PTD is the main distribution center of Atlas
Copco Group with the aim to supply end-customers just-in-time. PTD is maintaining a stock
of about 60,000 different articles, including tools, spare parts and accessories from all Atlas
Copco business units. 85% of Nasik CTO’s orders come from PTD and the remaining are
direct orders from end-customers located in closer regions. Telephone conferences are held
weekly between flow management in Nasik and CTO Sales Department in Kalmar, Sweden.
Stock levels of all CTO products are discussed and decisions regarding faster shipping for
urgent or pending orders are made. Purchase orders are received daily and can contain a
variety of 45 different products. PTD orders are expected to have a lead time of one week,
i.e. through the post C-stock flow (Dixit, 2012). Direct orders are received less frequently and
prioritized depending on urgency and available production capacity.
Planning
PTD provides CTO with forecasts on yearly consumption and prediction of sales which is
determined by the global sales team. These are projected with monthly figures to anticipate
production volumes with peaks and lows throughout the year and are primarily used by
sourcing team to foresee the availability of the raw material of key components. Because of
the extensive lead time of many key components, sourcing team needs to carefully balance
all material in the pipeline (WIP) with both immediate and future demand in focus.
Procurements of raw materials are trigged after reviewing the current stages of all WIP and
finished components. Calculated numbers of WIP units are used by the sourcing team to
keep in-house production processes and assembly in continuous motion.
Weekly production plans are setup for both pre and post C-stock operations. A daily morning
meeting is held where members of sourcing, production planning and flow teams discuss
process priorities, pending orders, backorders and raw material availability, which are the
key elements used to maintain production planning.
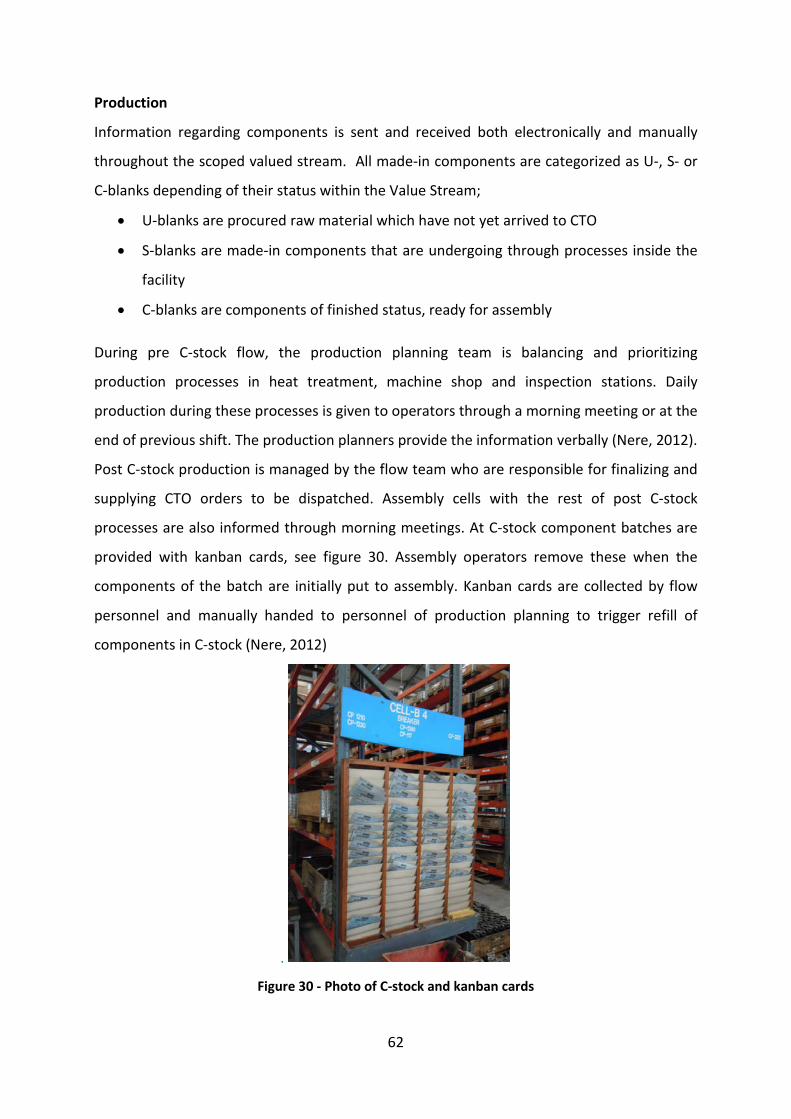
62
Production
Information regarding components is sent and received both electronically and manually
throughout the scoped valued stream. All made-in components are categorized as U-, S- or
C-blanks depending of their status within the Value Stream;
• U-blanks are procured raw material which have not yet arrived to CTO
• S-blanks are made-in components that are undergoing through processes inside the
facility
• C-blanks are components of finished status, ready for assembly
During pre C-stock flow, the production planning team is balancing and prioritizing
production processes in heat treatment, machine shop and inspection stations. Daily
production during these processes is given to operators through a morning meeting or at the
end of previous shift. The production planners provide the information verbally (Nere, 2012).
Post C-stock production is managed by the flow team who are responsible for finalizing and
supplying CTO orders to be dispatched. Assembly cells with the rest of post C-stock
processes are also informed through morning meetings. At C-stock component batches are
provided with kanban cards, see figure 30. Assembly operators remove these when the
components of the batch are initially put to assembly. Kanban cards are collected by flow
personnel and manually handed to personnel of production planning to trigger refill of
components in C-stock (Nere, 2012)
.
Figure 30 - Photo of C-stock and kanban cards
63
6 Value Stream Analysis The following chapter presents the current state of the CP1230 Value Stream, relevant information and calculations concerning the Value Stream, a discussion around the value adding and non-value adding activities and conclusively a recommended future state map with ‘kaizen’ improvements. The production flow presented here is splited into two categories; the first map representing activities from complete stock to customer (post C-stock ) and the second map, from raw material to complete cylinder stock (pre C-stock), i.e. the flow analysis is followed upstream, from customer to raw material.
6.1 Customer requirements
The first step of Value Stream Mapping is to identify the customer requirements, i.e. how
many products the customer wants in terms of volume and how often they want it i.e.,
delivered frequency. The following has been determined for both pre and post C-stock flows:
Post C-stock
PTD is identified as the main customer of the post C-stock flow. The demand form PTD are
reflections of yearly forecasting. These demands are constantly fluctuating; however, during
the moment of the analysis PTD required 1410 pieces of CP1230 breakers in 2012. In terms
of shipment, PTD requires shipments twice every week by sea and when needed, in case of
urgency, supplementary shipments are made by air. Delivery time by air is one week while
by sea is six weeks. Orders are seldom cancelled or adjusted because PTD is not the end
customer but a distribution center where further refined packaging and supplementary
equipment is supplied (Dixit, 2012).
• 1410 products per year (for year 2012).
• Shipment to be made 2 times a week.
• Quantities ranging from 15-40 products per order.
• Dispatching from facility done after maximum 10 days from order.
• Six week lead time from Mumbai harbor to PTD factory (by sea).
Pre C-stock
The in-house assembly is itself acting as the customer of this flow. C-stock is held for
primarily serve the assembly whenever required by a pull system. The C-stock applies as a
buffer of finished components which in theory, only shall carry close to two kanban
quantities, i.e. 30 components for the CP1230 cylinder. However the C-stock currently holds
much more than the theoretical and intended amount.

64
6.2 Current state maps
The following section presents the current state Value Stream Maps and describes
underlying information to complement an understanding of the state. The flows of post and
pre C-stock are presented separately. All calculations can be found in the appendix (see
10.12-10.16).
Post C-stock – Current state
Figure 31 - Current state map of the Post C-stock flow, see appendix 10.7 for full-scale size
The supply of the post C-stock flow is sourced from two supermarket stations. One
supermarket represents bought-in material and the other represents made-in components.
The supermarkets are a combination of kanban inventory cards and pull flow. The CP1230
cylinder is pulled from the flow about six times a month (according to 2012 forecast).
The assembly process is accountable for a majority of the accumulated lead time. The
complexity of the assembly process is much greater then remaining processes; therefore the
measuring method of cycle time (C/T) and change-over (C/O) time had a different approach.
All activities in assembly, such as lifting heavy components, torqueing, setting up sub-
assemblies are done simultaneously and therefore the C/T for each process is overlapping,
65
therefore, the calculation is based on the amount of complete assemblies during one shift
divided by the total processing time (see appendix 10.12). Assembly is operated by a two
men team who have been stationed in the cell their entire career, i.e. no rotation of staff has
been considered. After the assembly process the rest of the flow is a straight forward push
flow. Minor inventory develops through waiting for operations to be finished with other
products. After the last process, delivery to end customer PTD (through middle inventory in
Mumbai harbor) is displayed.
The monthly and weekly planning is not shared to the operators. They are informed through
morning meetings how many products they are supose to process in their shift. Tact time is
not defined as it varies depending on demand, increasing when work load is high and
decreasing when work load is low. This is a factor of generating variations in uptime, as shifts
are every so often being extended, i.e. uptime exceeding 100%, overtime.
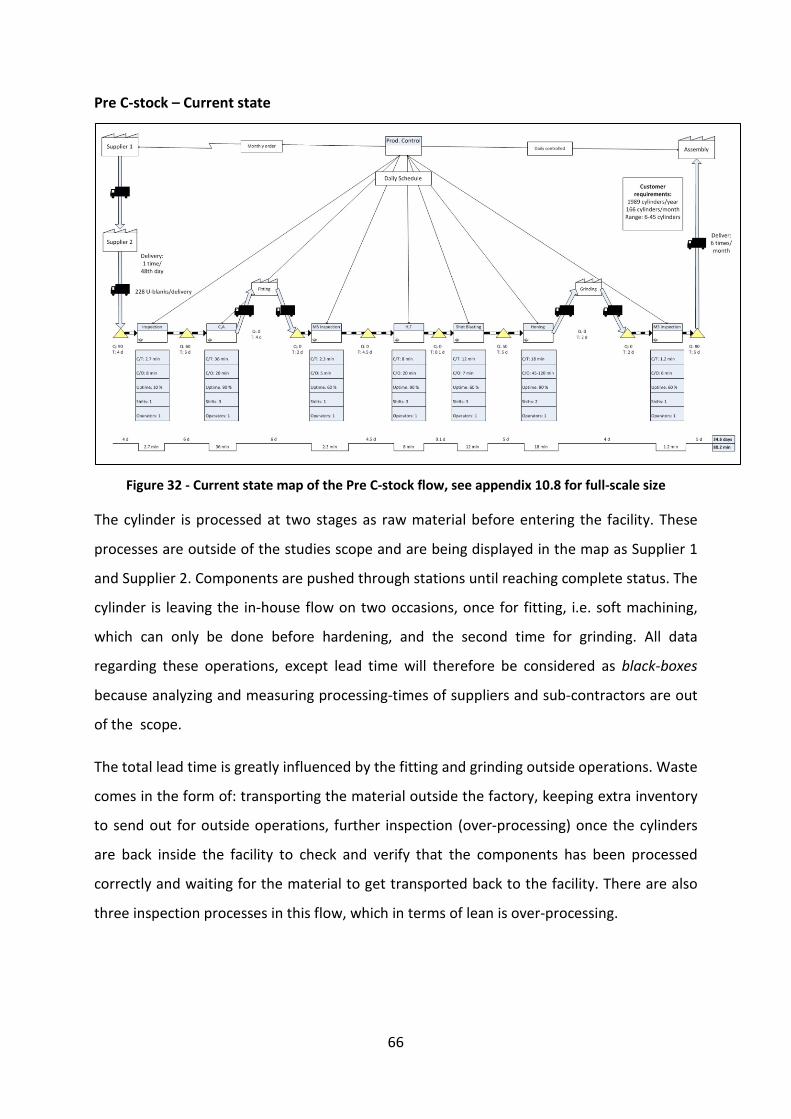
66
Pre C-stock – Current state
Figure 32 - Current state map of the Pre C-stock flow, see appendix 10.8 for full-scale size
The cylinder is processed at two stages as raw material before entering the facility. These
processes are outside of the studies scope and are being displayed in the map as Supplier 1
and Supplier 2. Components are pushed through stations until reaching complete status. The
cylinder is leaving the in-house flow on two occasions, once for fitting, i.e. soft machining,
which can only be done before hardening, and the second time for grinding. All data
regarding these operations, except lead time will therefore be considered as black-boxes
because analyzing and measuring processing-times of suppliers and sub-contractors are out
of the scope.
The total lead time is greatly influenced by the fitting and grinding outside operations. Waste
comes in the form of: transporting the material outside the factory, keeping extra inventory
to send out for outside operations, further inspection (over-processing) once the cylinders
are back inside the facility to check and verify that the components has been processed
correctly and waiting for the material to get transported back to the facility. There are also
three inspection processes in this flow, which in terms of lean is over-processing.
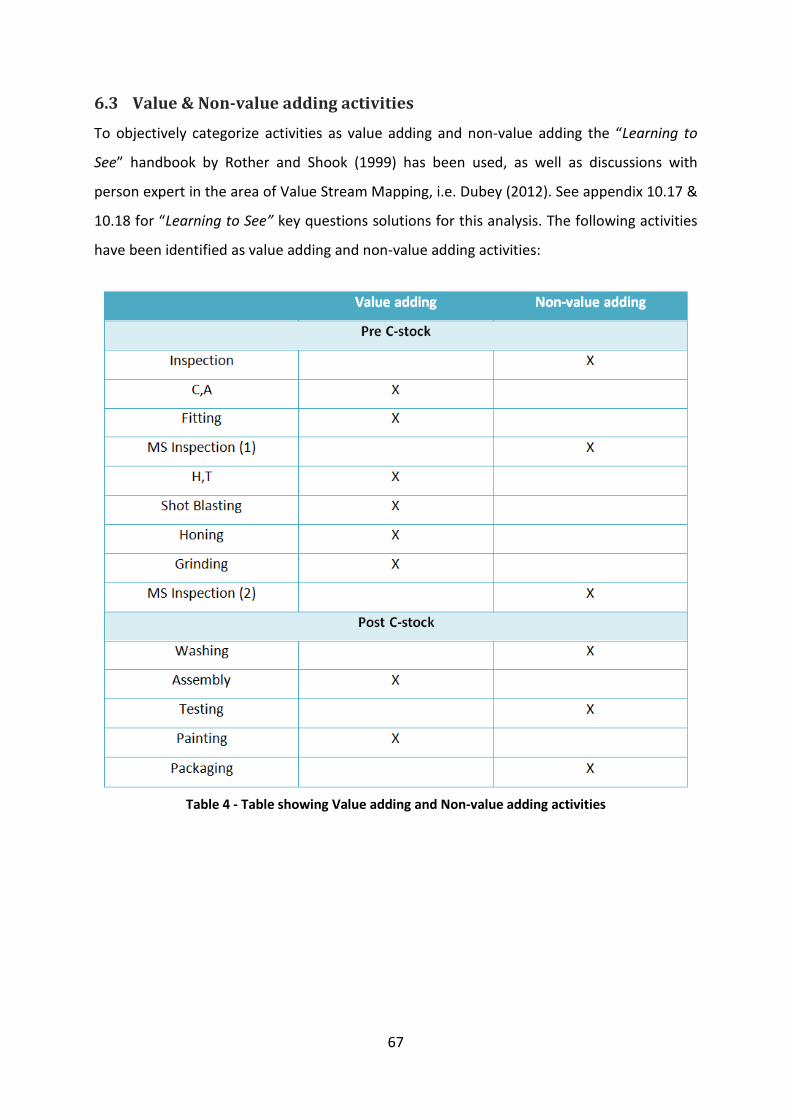
67
6.3 Value & Non-value adding activities
To objectively categorize activities as value adding and non-value adding the “Learning to
See” handbook by Rother and Shook (1999) has been used, as well as discussions with
person expert in the area of Value Stream Mapping, i.e. Dubey (2012). See appendix 10.17 &
10.18 for “Learning to See” key questions solutions for this analysis. The following activities
have been identified as value adding and non-value adding activities:
Table 4 - Table showing Value adding and Non-value adding activities
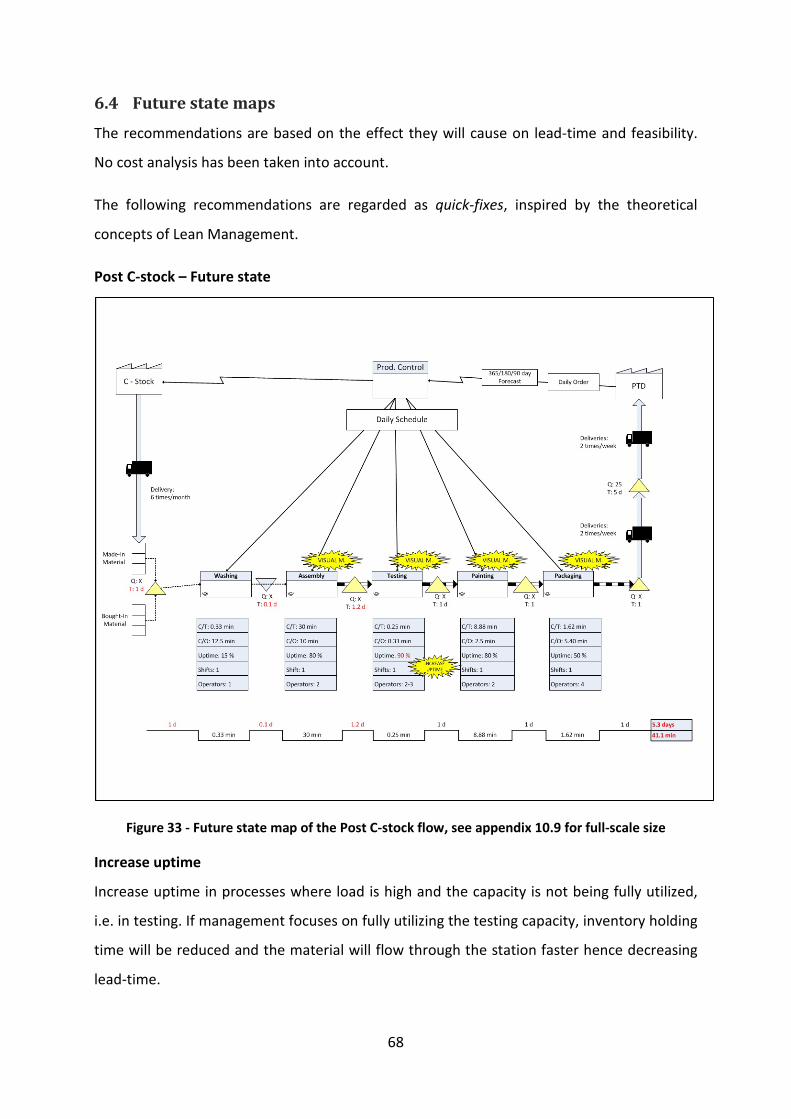
68
6.4 Future state maps
The recommendations are based on the effect they will cause on lead-time and feasibility.
No cost analysis has been taken into account.
The following recommendations are regarded as quick-fixes, inspired by the theoretical
concepts of Lean Management.
Post C-stock – Future state
Figure 33 - Future state map of the Post C-stock flow, see appendix 10.9 for full-scale size
Increase uptime
Increase uptime in processes where load is high and the capacity is not being fully utilized,
i.e. in testing. If management focuses on fully utilizing the testing capacity, inventory holding
time will be reduced and the material will flow through the station faster hence decreasing
lead-time.
69
Visual Management
Create boards displaying where certain tools are to be kept. The tools should not be stored
in shelves and cupboards but they should be visible and easily accessible all the time. this
will help to find tools easily and it will also make easier for operators to put the tools back in
correct palce. 5S method of lean managemnt can be adopted to organize tool handeling.
This will reduced the change-over time , however, the effect it on the change-over time is
not inlcuded in the future state Value Stream Map because it is difficult to estimate outcome
in numerical value. Improved quality and less variation will also be achieved by standardizing
and simplifying work methods and visually dispaying them in respetive work stations.
(Dubey, 2012).
Rotate personnel
An important aspect of lean is to keep the employees motivated and stimulated at work
(Womack & Jones, 2003). This can be achieved by rotating the operators of the assembly
cells. Some operators have been assembling in the same assembly cell, assembling one type
of product family for more than 15 years (Gangurde, 2012). If the operators rotate every
other month to different cells, assembling products of another product family, they will feel
more motivated and stimulated at work whilst also building on the individual competence of
each operator.
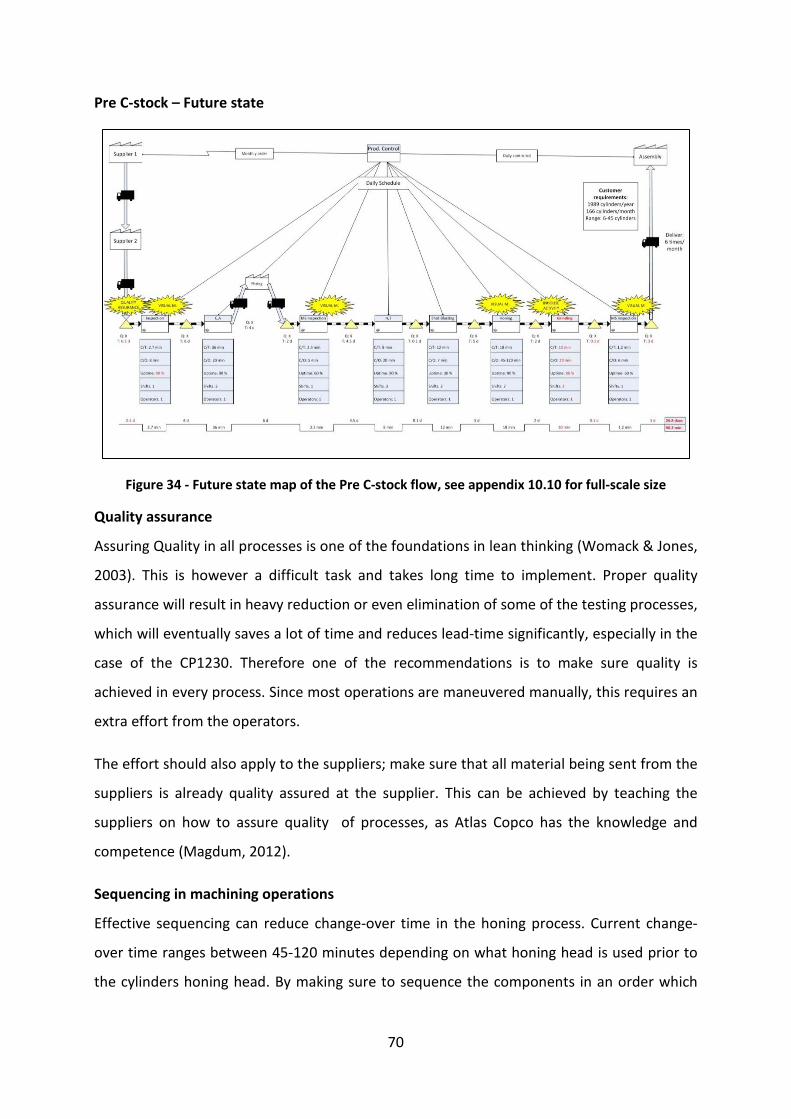
70
Pre C-stock – Future state
Figure 34 - Future state map of the Pre C-stock flow, see appendix 10.10 for full-scale size
Quality assurance
Assuring Quality in all processes is one of the foundations in lean thinking (Womack & Jones,
2003). This is however a difficult task and takes long time to implement. Proper quality
assurance will result in heavy reduction or even elimination of some of the testing processes,
which will eventually saves a lot of time and reduces lead-time significantly, especially in the
case of the CP1230. Therefore one of the recommendations is to make sure quality is
achieved in every process. Since most operations are maneuvered manually, this requires an
extra effort from the operators.
The effort should also apply to the suppliers; make sure that all material being sent from the
suppliers is already quality assured at the supplier. This can be achieved by teaching the
suppliers on how to assure quality of processes, as Atlas Copco has the knowledge and
competence (Magdum, 2012).
Sequencing in machining operations
Effective sequencing can reduce change-over time in the honing process. Current change-
over time ranges between 45-120 minutes depending on what honing head is used prior to
the cylinders honing head. By making sure to sequence the components in an order which
71
require little to none adjustment, one could reduce the change-over time significantly.
Analysis on this issue is advised as further research, see chapter 8.
The grinding operation which is currently sub-contracted can be done in-house since there is
a grinding machine in the machine shop. Competence on how to grind the cylinder is also
available since the operation has previously been completed in-house. The reason for
outsourcing the operation was because the organization wanted to use the machine for
other components and did not find it important enough for the cylinder to be processed in-
house. This should however be re-considered after having stated that the cylinder is a critical
component in terms of long lead time and turnover.
The processing and change-over times of the grinding operations in the future state are
assumptions and not actual measurements. The assumptions are made based on interviews
and discussions with operators and machine shop managers. The esmiated value is based on
their experiences as grinding operations perviously was done in-house. Therefore, it is to be
noted that the time stated in the future state map are not actual measured vaule.
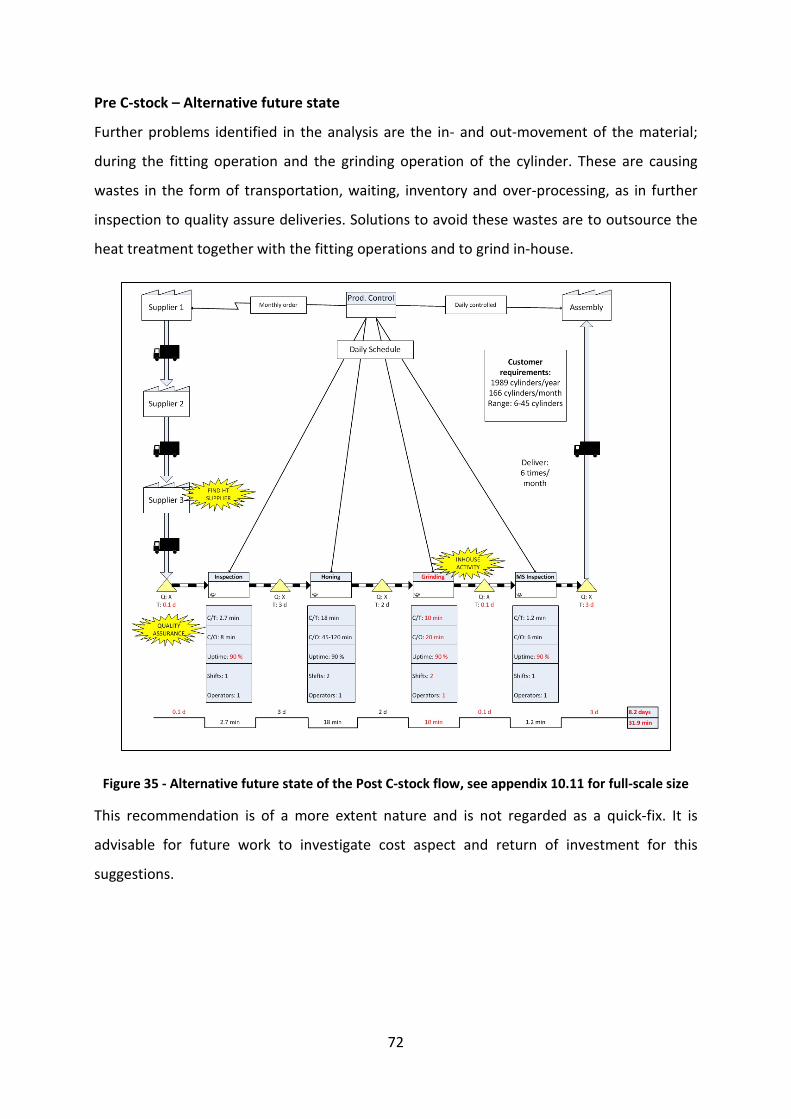
72
Pre C-stock – Alternative future state
Further problems identified in the analysis are the in- and out-movement of the material;
during the fitting operation and the grinding operation of the cylinder. These are causing
wastes in the form of transportation, waiting, inventory and over-processing, as in further
inspection to quality assure deliveries. Solutions to avoid these wastes are to outsource the
heat treatment together with the fitting operations and to grind in-house.
Figure 35 - Alternative future state of the Post C-stock flow, see appendix 10.11 for full-scale size
This recommendation is of a more extent nature and is not regarded as a quick-fix. It is
advisable for future work to investigate cost aspect and return of investment for this
suggestions.
73
7 Conclusions & Recommendations The following chapter describes the conclusions drawn from the study, the kaizen recommendations and a plan of action on how to go about implementing them.
7.1 Conclusions
The concept Lean advocates a future ideal state where products flow according to the tact
time, work in progress is minimum and activities and processes are initiated only when the
customer needs them to. This management philosophy has been used as a guideline in the
analysis of this study. The aim of the thesis was to reduce production lead time and
eliminate those activities that do not add value to the customer by identifying value adding
and non-value adding activities, to improve product quality within processes, reduce
wasteful operations such as transportation, over-processing, idle-time, and to simplify and
standardize work methods. These objectives all together would account for a reduction in
lead time, i.e. total time from material delivery to finished product dispatching, as this lead
time in case CTO is 25-30 % longer than operations with similar production in the plant in
Kalmar.
With these objectives in consideration, recommended future state maps have been created
by the authors (see appendix 10.8-10.11) to improve the current situation with the
assistance of supervisors at Atlas Copco, the Royal Institute of Technology and the Lean
Management Institute of India.
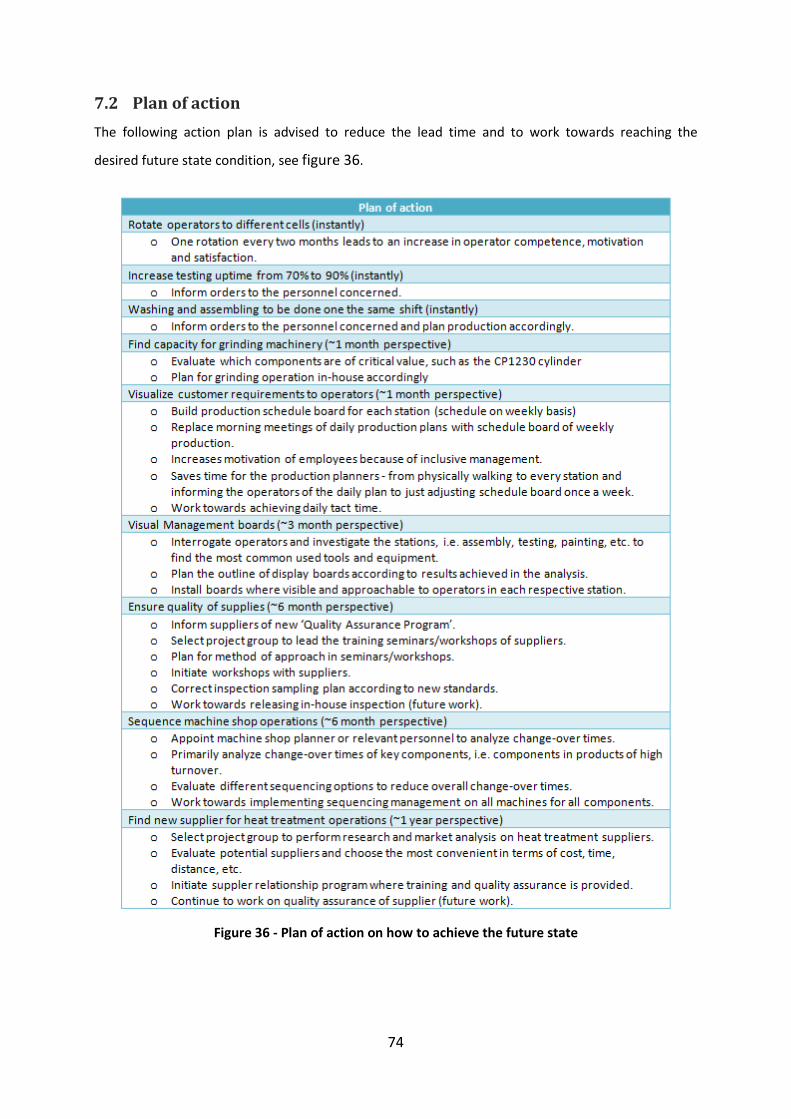
74
7.2 Plan of action The following action plan is advised to reduce the lead time and to work towards reaching the
desired future state condition, see figure 36.
Figure 36 - Plan of action on how to achieve the future state
75
7.3 Estimated outcome
The suggestions will allow for a reduction in lead time, according to the authors’ estimation,
of about 24,6% or 68,3% depending on which solution CTO chooses (see appendix 10.16 for
complete calculations). Furthermore, the suggestions will enhance group dynamics and
employee satisfaction by introducing the rotational program, i.e. varied tasks for the
individual, the visual management solution, which will simplify and standardize work
methods leading to a more consistent outcome in quality of each process and include
employees in management objectives making the employees feel part of the organizational
strategy. The identified non-value adding activities such as inspection, should be aimed to
release from the in-house operations in a long term perspectiveand emphasize shoul be
given on value adding activities. The insourcing of grinding operations will reduce wasteful
operations such as transportation, inventory and idle-time. Training initiatives for suppliers
will assure better quality and will reduce inspection, i.e. over-processing operations.
The implementation suggestion of strongest character is the outsourcing of heat treatment
which accounts for a heavy reduction in wasteful operations such as transportation,
inventory and idle-time. This suggestion alone accounts for the (large?) difference in the two
recommended solutions for the pre C-stock future state (see appendix 10.10-10.11). The
recommended action plan is specifically directed towards the targeted product and product
component; CP1230 and CP1230 cylinder. However, the idea is not only to sub-optimize one
single product flow, but to make use of the knowledge gained by implementing the
recommendations to achieve similar solutions for all product flows of (other) division, i.e.
“spreading the message” (Rother & Shook, 1999).
76
8 Discussion This chapter discusses the method, approach and outcome of the study, and reflects upon what could have been done differently and what difficulties were faced. The authors also highlight areas that can be developed and provides suggestions for further research.
8.1 Reflections
The authors believe that the purpose of the study is fulfilled. A thorough Value Stream
Analysis has been made by identifying value adding and non-value adding activities.
Improvement proposals have been given to reduce the total lead time and to improve the
overall flow.
A systematic approach has been used throughout the project and the work has been
conducted on site, close to the actual flow. This means that the risk of misinterpretation is
minimum as the authors constantly have been discussing their thoughts and perceptions
with the CTO staff and supervisors.
A high validity has been achieved by obtaining the information through various methods
and sources, including literature, own observations and interviews. To ensure a high degree
of reliability in the study, observations and measurements were done on several
occasions and an average value was adopted. There is little reason to believe that different
results were to be achieved if the study would have been conducted again by different
students.
It is important to emphasize that Value Stream Mapping is a tool to visualize the problem
areas and wastes, and not a tool to fix the problems. To optimize the visualized problems,
other Lean tools such as 5S, SMED, Root-cause analysis, Six Sigma or PDCA can
be used. Value Stream Mapping generates suggestions for improvement, which in turn calls
for resources to implement. If management is not prepared to spend resources the analysis
is useful (Dennis, 2007).

77
8.2 Critique
An important question to ask after a completed study is if something could have been done
differently (Collins & Hussey, 2009):
The authors believe that they should have had established a better contact with the
supervisor prior to the study but this was not possible as they were assigned a new
supervisor when the study had already been initiated. It would had simplified the start-up
phase of the study, however, the authors are very pleased with how the collaboration and
guidance have worked with the later assigned supervisorgiven that the supervisor entered
the work late and that both parties were in different countries so the communication was
limited.
The authors could have had cost perspective in the analysis and recommendations. This
would provide a higher degree of validity and reliability of the solutions whilst easing the
CTO’s decision making of implementing the recommendations. However, the time allocated
for the thesis is a limiting factor hence a cost analysis was difficult to include.
The mapping of the future state Value Stream could have been done differently, i.e. by
holding a workshop to develop a future state together with personnel involved in the Value
Stream. This would give a perspective and dynamic ideas and lead to the improvements
being anchored in the organization.
Information flow could have been analyzed in more detail as it would have brought a
perspective and possibly lead in discovering new opportunities for futher improvements.
The authors were unsure about how their reception and treatment would be at the facility
as they were the first students who had performed a research there. Although they felt very
appreciated and welcomed, it was difficult for the authors to explain the idea behind the
study since students do not pursue these types of work in India. One should not
underestimate cultural differences. For instance, scheduling the interview meetings, an
interview appointment was rarely kept. It was acceptable to knock on the door, without
notice, and try the luck on asking as many questions as possible to the interviewee. One
should also keep in mind that the organizational structure is more hierarchical in India than
78
in Sweden, which means that you may not receive answers to certain questions, but instead
hear the interviewees’ perception of what you should know.
Not being able to evaluate suppliersis another limitation in the study. A study visit to a
supplier or sub-contractor would have been significant in the analysis.
8.3 Future work
Concerns rose during the study which were not possible to examine by the authors, in the
context of the thesis, but which may be of interest to Atlas Copco. Recommendations for
further research are:
• How to implement pull system throughout the flow
• How to “spread the message”, as the recommendations only applies for the CP1230
• How to sequence all machining operations
A method on research succeeding this study is to “spread the message” as the
recommendations only apply for the CP1230. Doing this would be to focus on fellow critical
components of the CP1230 breaker. As shown in component listing with lead times (table 1);
the CP1230 valve case and fronthead are the components closest to the cylinder in terms of
extensive lead time. The fact that the components sharing post C-stock flows will develop
the opportunity to significantly further reduce the total lead time of the CP1230 breaker by
only taking on pre C-stock measures. Leading to CTO management being able to easier
evaluate the plan of actions created during this study by comparing the result in total lead
times (of the CP1230 breaker) with other high volume CTO products.

79
9 References Andersson, N. & Borgbrandt, J., 1998. Byggforskning - Processer och vetenskaplighet. Luleå: Luleå Tekniska Universitet.
Atlas Copco Group, 2012. Atlas Copco. [Online] Available at: http://www.atlascopco.com/se/AtlasCopcogroup/ [Accessed 31 January 2012].
Atlas Copco India, 2012. [Online] Available at: http://www.atlascopco.in/inus/Aboutus/incountry/ [Accessed 31 January 2012].
Atlas Copco, 2012. Atlas Copco Annual Report 2011, Stockholm: Atlas Copco.
Berglund, R., 2006. Smart lean: möjligheter att utnyttja Lean-konceptet för att skapa en god arbetssituation. Mölndal: IVF Industriforskning och utveckling.
Bicheno, J., 2006. Ny verktygslåda för Lean: för snabbt och flexibelt flöde. Göteborg: Revere.
Blücher, D., Öjmertz, B., Hamon, E. & Jarebrant, C., 2007. Effektivt byggande - utmana dina processer!: resurseffektiva tankesätt och principer - en introduktion till Lean i byggandet. Mölndal: IVF Industriforskning och utveckling.
Börnfelt, P.-O., 2006. Förändringskompetens på industrigolvet: Kontinuerligt förändringsarbete i gränslandet mellan lean production och socioteknisk arbetsorganisation. Göteborg: Arbetslivsinstitutet.
Callister, W. D. & Rethwisch, D. G., 2005. Fundamentals of Materials Science and Engingeering: An Integrated Approach. Oxford: John Wiley & Sons.
Collins, J. & Hussey, R., 2009. Business Research: A Practical Guide For Undergraduate & Postgraduate Students. Hampshire: Palgrave Macmillan.
Conti, R. et al., 2006. The effects on lean production on worker job stress. International Journal of Operations & Production Management, 26(9), pp. 1013-1038.
Dagens Industri, 2012. di.se. [Online] Available at: http://di.se/Default.aspx?pid=257119__ArticlePageProvider&epslanguage=sv&referrer=http%3A%2F%2Fwww.facebook.com%2Fl.php%3Fu%3Dhttp%253A%252F%252Fdi.se%252FArtiklar%252F2012%252F1%252F26%252F257119%252FEricsson-ramlar-fran-tredjeplatsen%252F%26h%3DJAQHCAgt [Accessed 31 Januari 2012].
Dennis, P., 2007. Lean production simplified: a plain language guide to the world's most powerful production system. New York: Productivity Press.
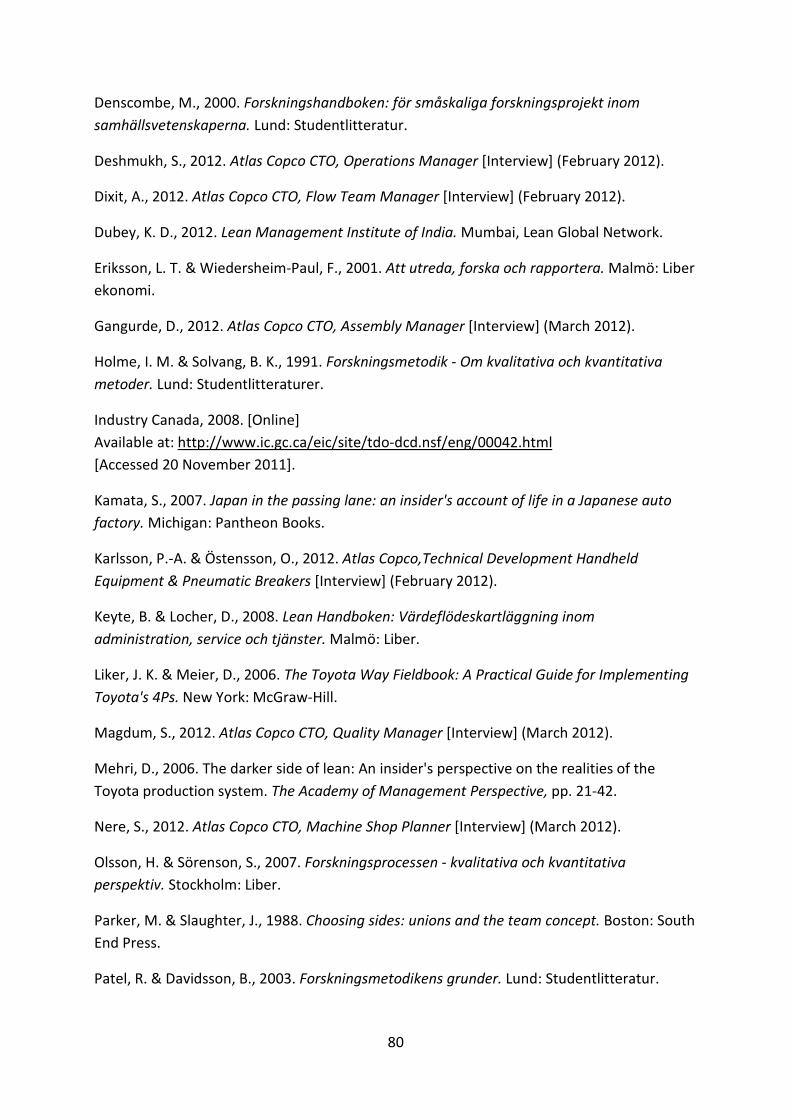
80
Denscombe, M., 2000. Forskningshandboken: för småskaliga forskningsprojekt inom samhällsvetenskaperna. Lund: Studentlitteratur.
Deshmukh, S., 2012. Atlas Copco CTO, Operations Manager [Interview] (February 2012).
Dixit, A., 2012. Atlas Copco CTO, Flow Team Manager [Interview] (February 2012).
Dubey, K. D., 2012. Lean Management Institute of India. Mumbai, Lean Global Network.
Eriksson, L. T. & Wiedersheim-Paul, F., 2001. Att utreda, forska och rapportera. Malmö: Liber ekonomi.
Gangurde, D., 2012. Atlas Copco CTO, Assembly Manager [Interview] (March 2012).
Holme, I. M. & Solvang, B. K., 1991. Forskningsmetodik - Om kvalitativa och kvantitativa metoder. Lund: Studentlitteraturer.
Industry Canada, 2008. [Online] Available at: http://www.ic.gc.ca/eic/site/tdo-dcd.nsf/eng/00042.html [Accessed 20 November 2011].
Kamata, S., 2007. Japan in the passing lane: an insider's account of life in a Japanese auto factory. Michigan: Pantheon Books.
Karlsson, P.-A. & Östensson, O., 2012. Atlas Copco,Technical Development Handheld Equipment & Pneumatic Breakers [Interview] (February 2012).
Keyte, B. & Locher, D., 2008. Lean Handboken: Värdeflödeskartläggning inom administration, service och tjänster. Malmö: Liber.
Liker, J. K. & Meier, D., 2006. The Toyota Way Fieldbook: A Practical Guide for Implementing Toyota's 4Ps. New York: McGraw-Hill.
Magdum, S., 2012. Atlas Copco CTO, Quality Manager [Interview] (March 2012).
Mehri, D., 2006. The darker side of lean: An insider's perspective on the realities of the Toyota production system. The Academy of Management Perspective, pp. 21-42.
Nere, S., 2012. Atlas Copco CTO, Machine Shop Planner [Interview] (March 2012).
Olsson, H. & Sörenson, S., 2007. Forskningsprocessen - kvalitativa och kvantitativa perspektiv. Stockholm: Liber.
Parker, M. & Slaughter, J., 1988. Choosing sides: unions and the team concept. Boston: South End Press.
Patel, R. & Davidsson, B., 2003. Forskningsmetodikens grunder. Lund: Studentlitteratur.
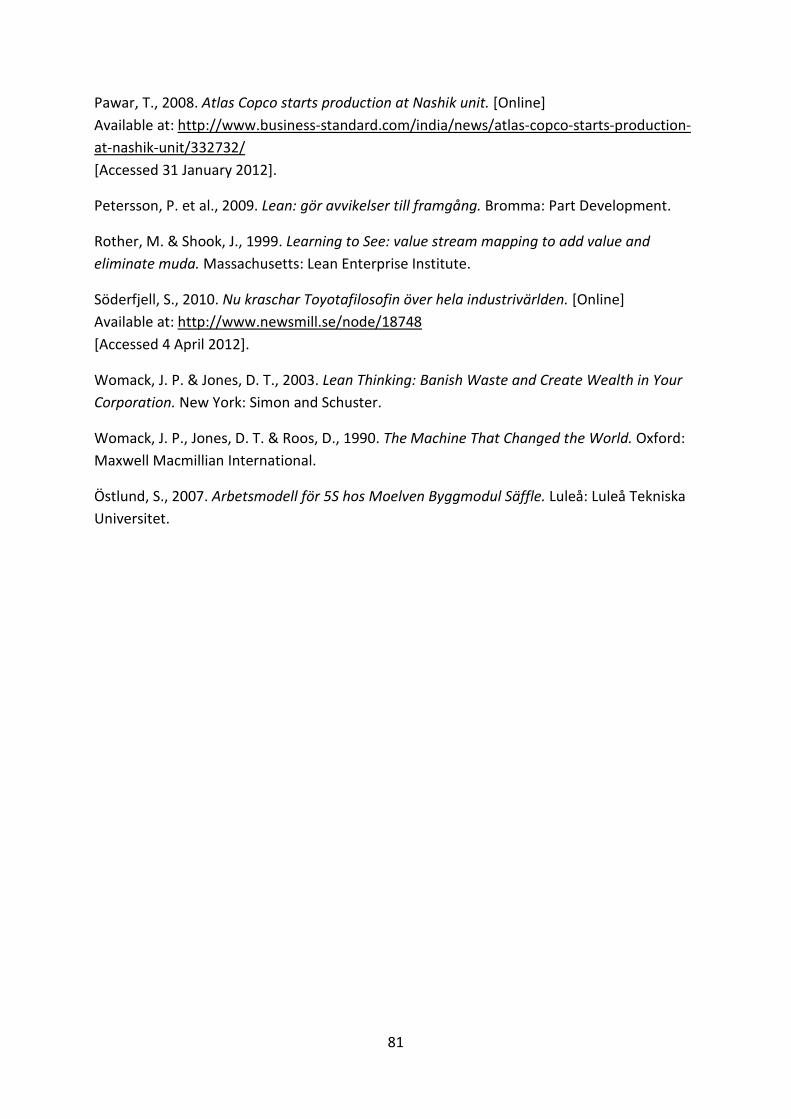
81
Pawar, T., 2008. Atlas Copco starts production at Nashik unit. [Online] Available at: http://www.business-standard.com/india/news/atlas-copco-starts-production-at-nashik-unit/332732/ [Accessed 31 January 2012].
Petersson, P. et al., 2009. Lean: gör avvikelser till framgång. Bromma: Part Development.
Rother, M. & Shook, J., 1999. Learning to See: value stream mapping to add value and eliminate muda. Massachusetts: Lean Enterprise Institute.
Söderfjell, S., 2010. Nu kraschar Toyotafilosofin över hela industrivärlden. [Online] Available at: http://www.newsmill.se/node/18748 [Accessed 4 April 2012].
Womack, J. P. & Jones, D. T., 2003. Lean Thinking: Banish Waste and Create Wealth in Your Corporation. New York: Simon and Schuster.
Womack, J. P., Jones, D. T. & Roos, D., 1990. The Machine That Changed the World. Oxford: Maxwell Macmillian International.
Östlund, S., 2007. Arbetsmodell för 5S hos Moelven Byggmodul Säffle. Luleå: Luleå Tekniska Universitet.
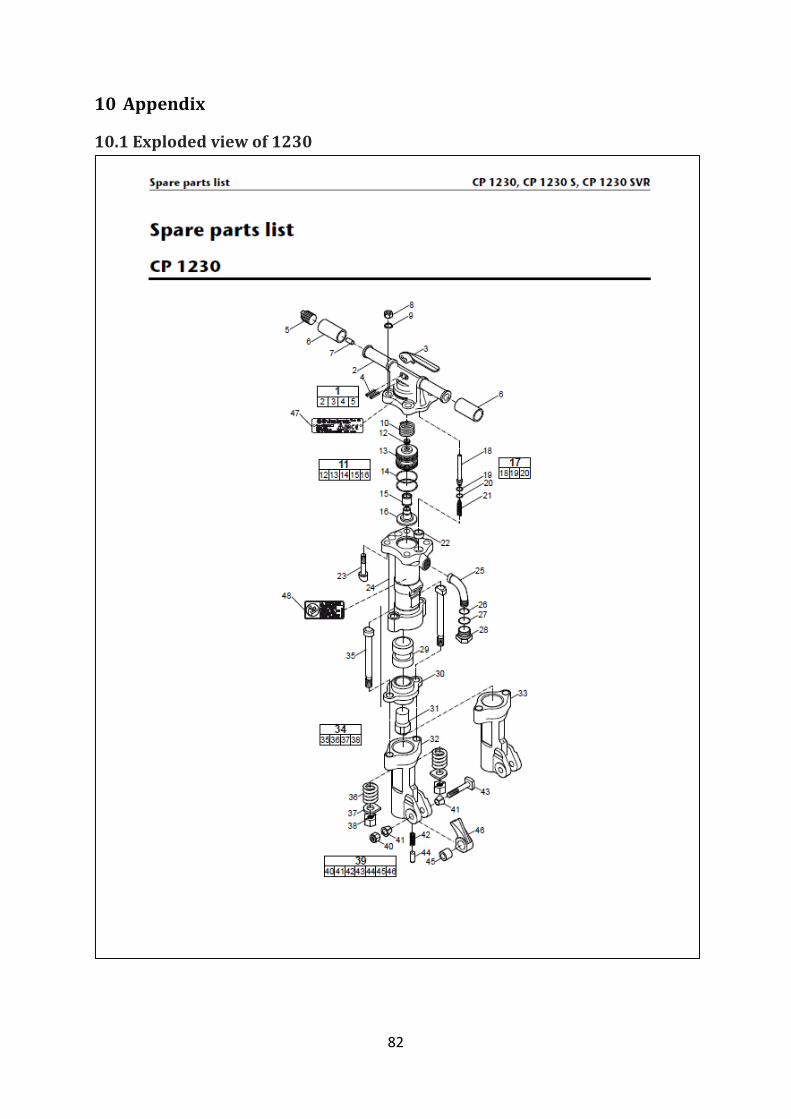
82
10 Appendix
10.1 Exploded view of 1230

83
10.2 Component listing
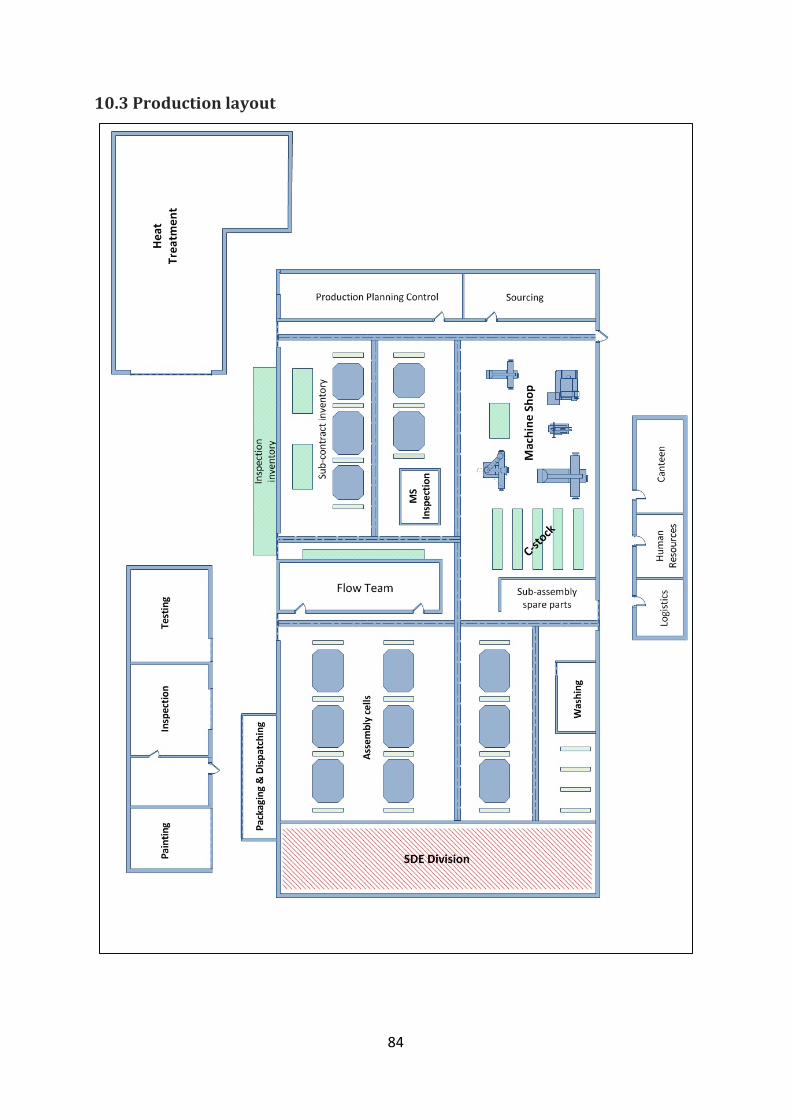
84
10.3 Production layout
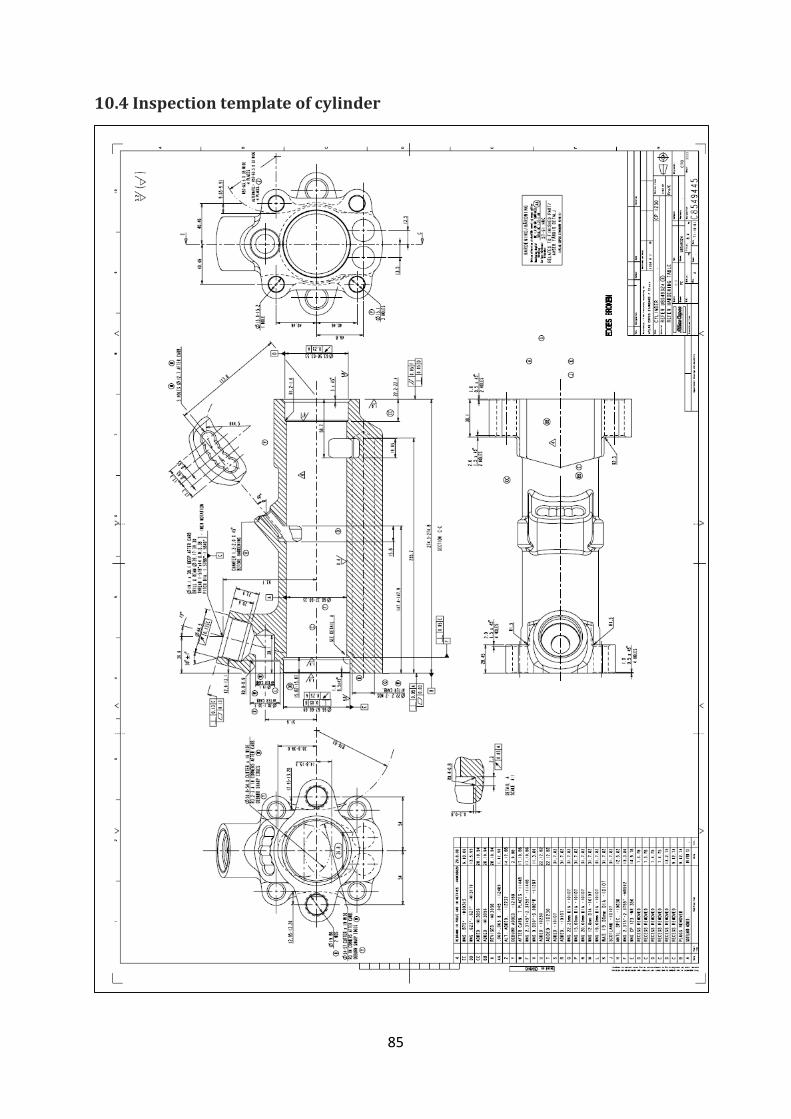
85
10.4 Inspection template of cylinder
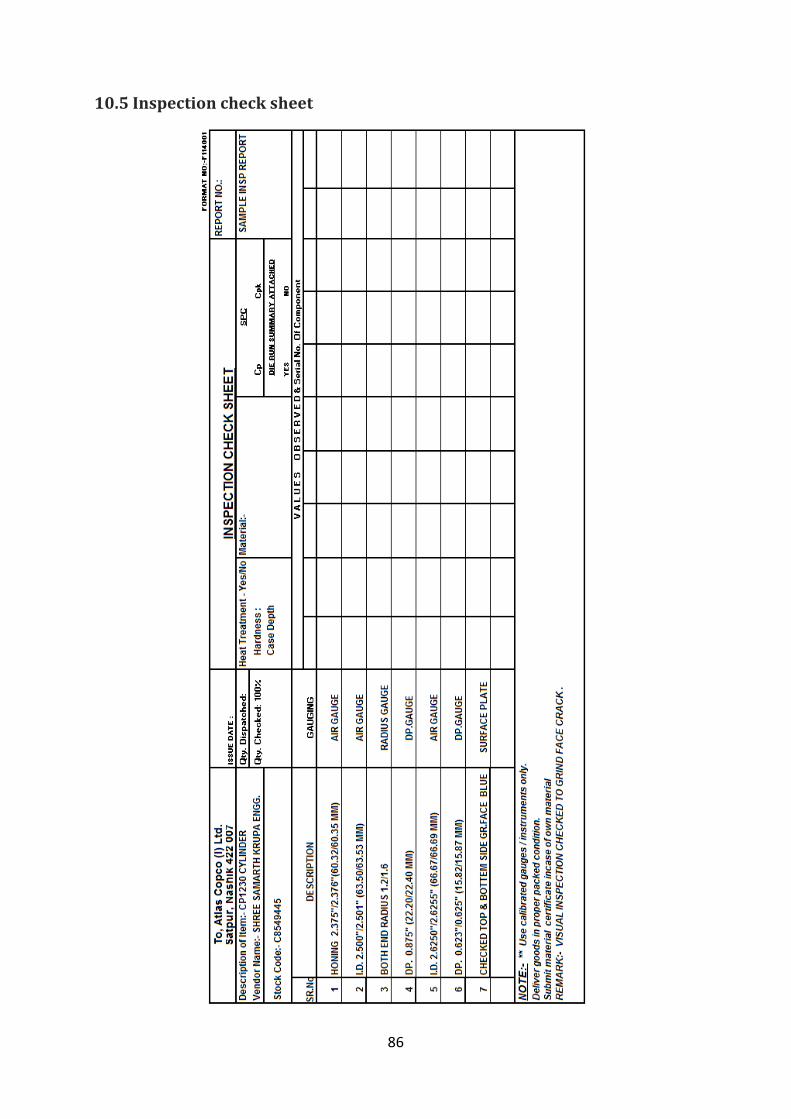
86
10.5 Inspection check sheet
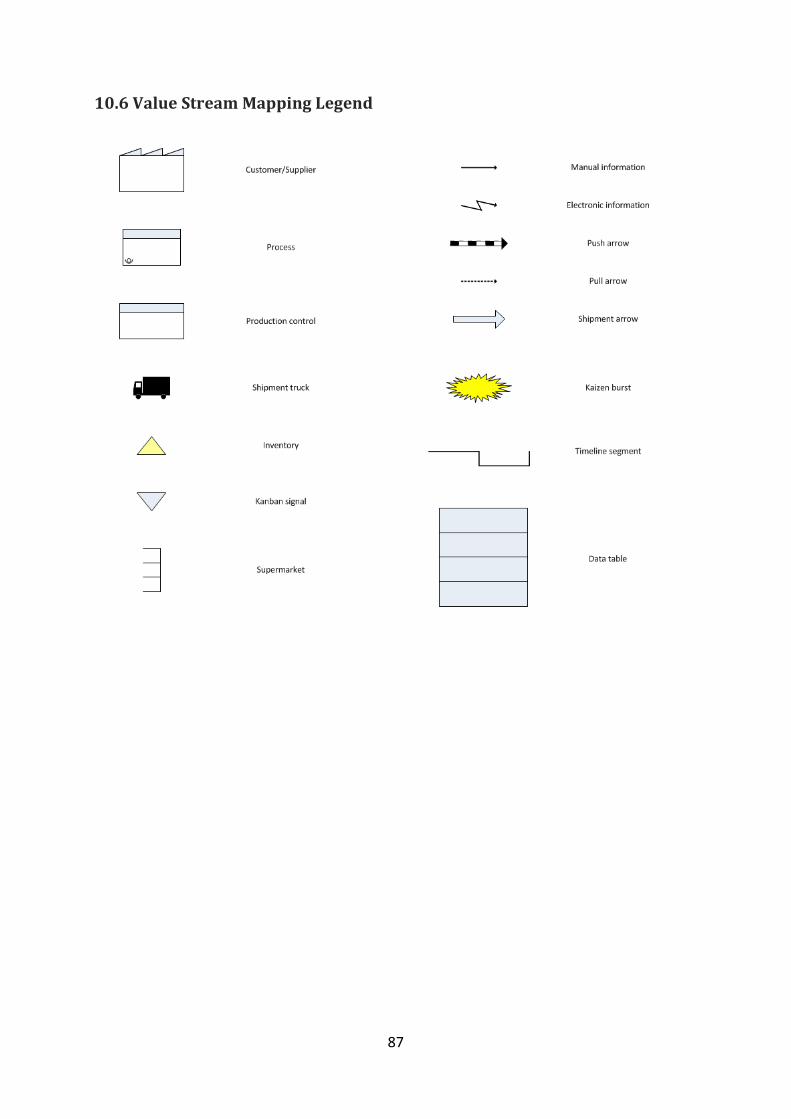
87
10.6 Value Stream Mapping Legend
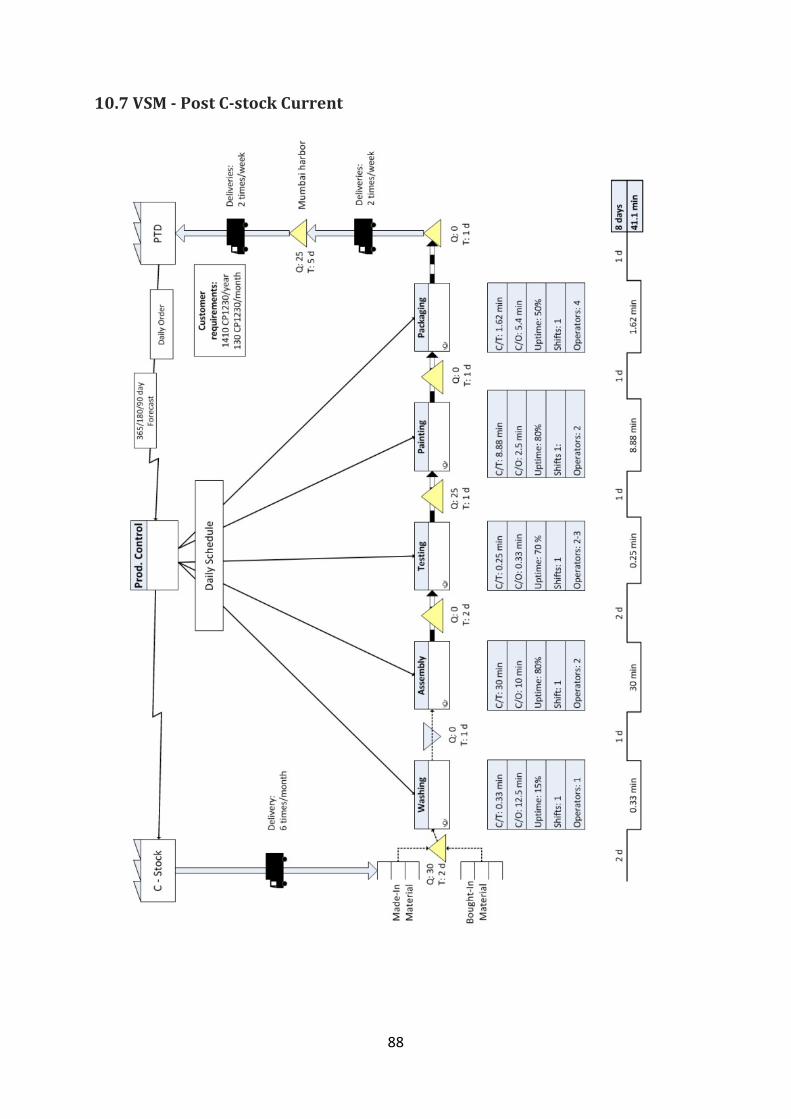
88
10.7 VSM - Post C-stock Current
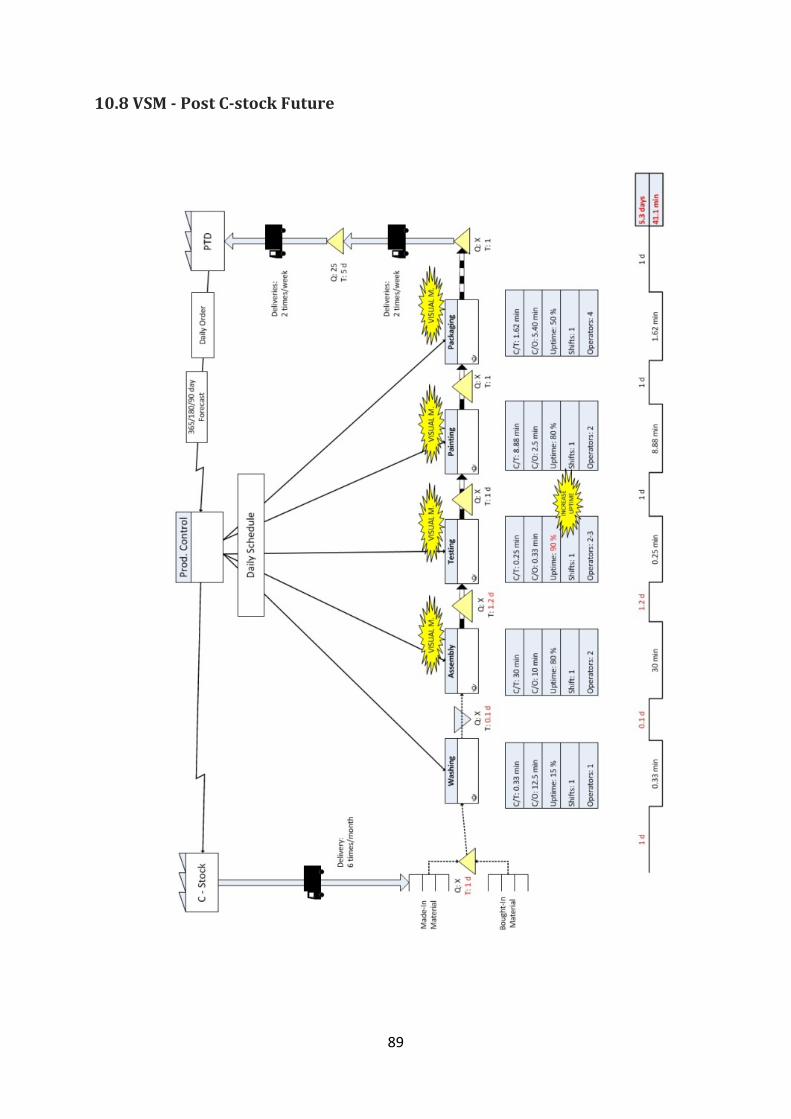
89
10.8 VSM - Post C-stock Future
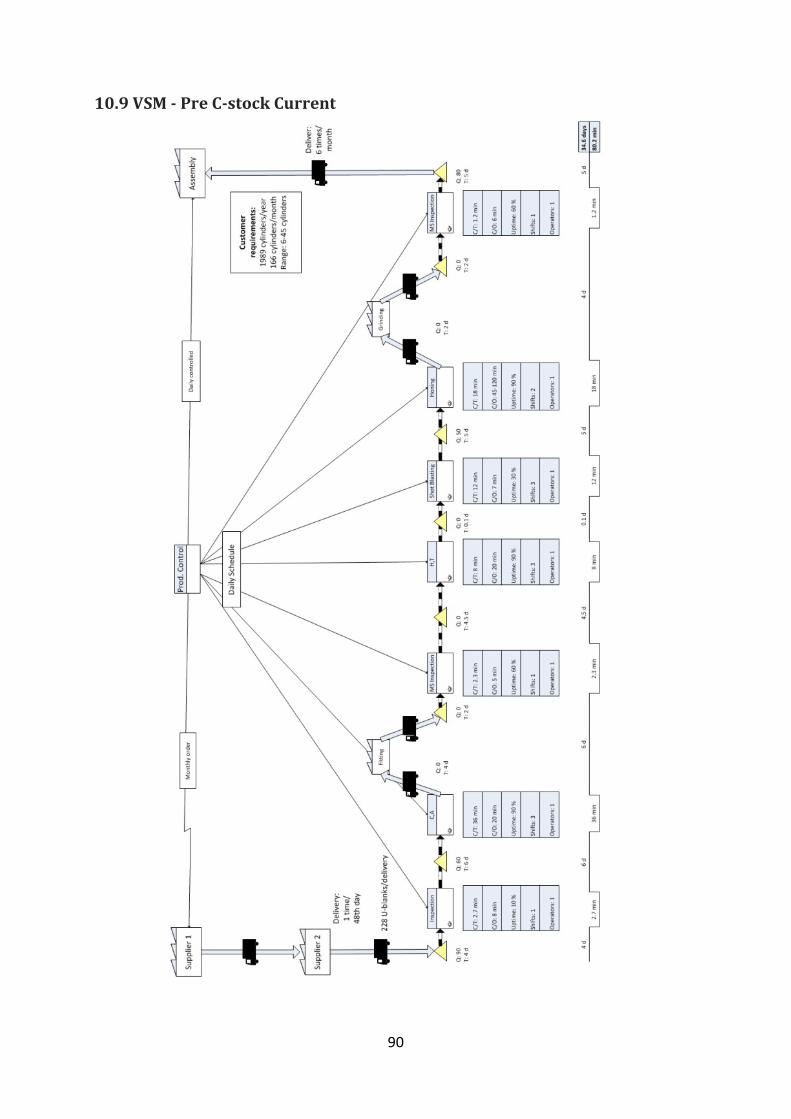
90
10.9 VSM - Pre C-stock Current
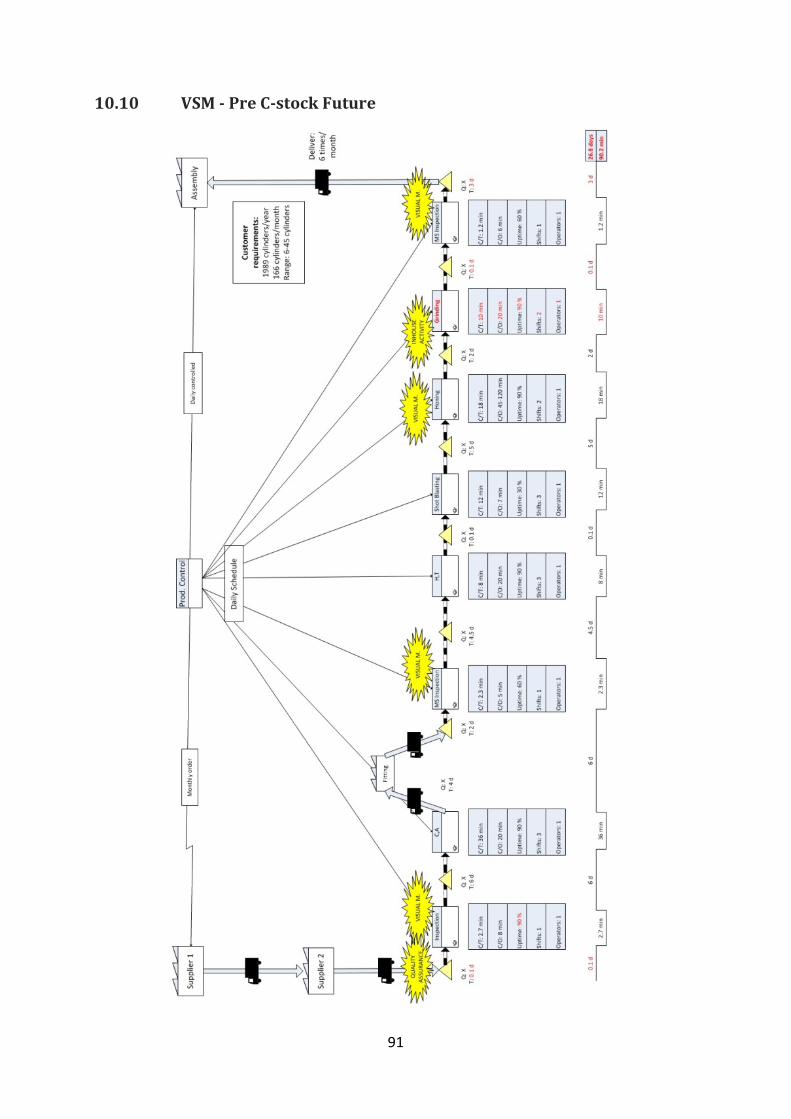
91
10.10 VSM - Pre C-stock Future
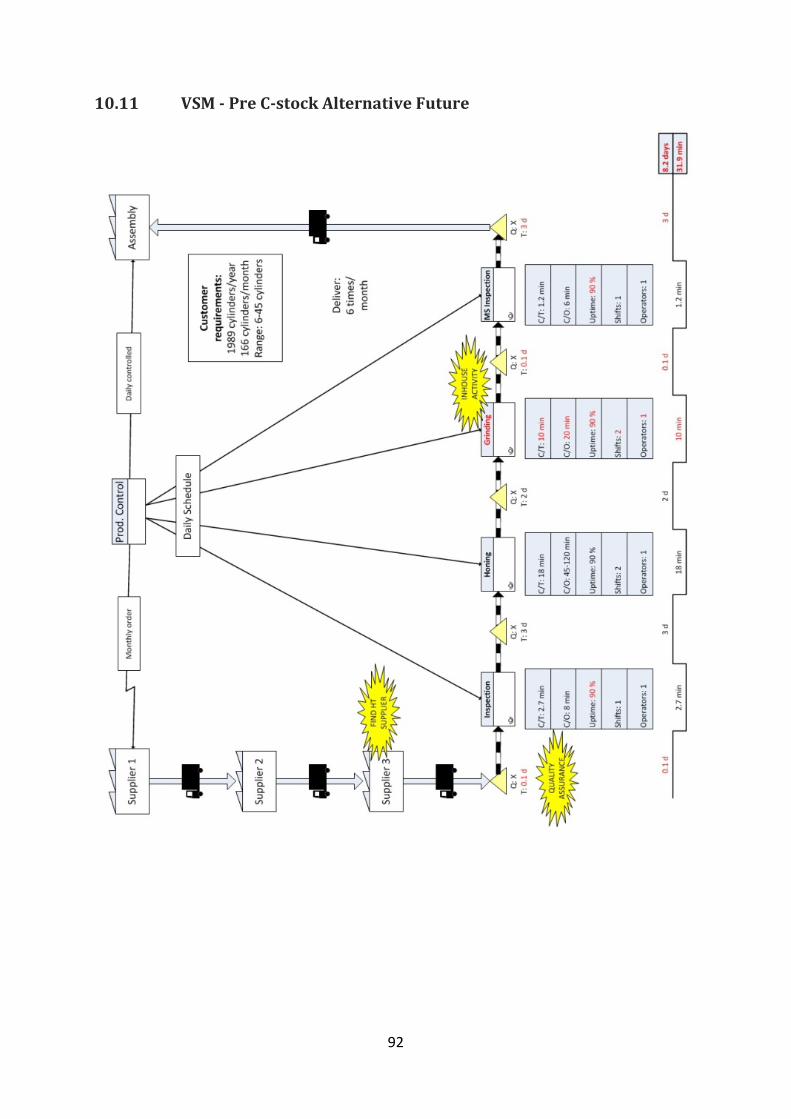
92
10.11 VSM - Pre C-stock Alternative Future
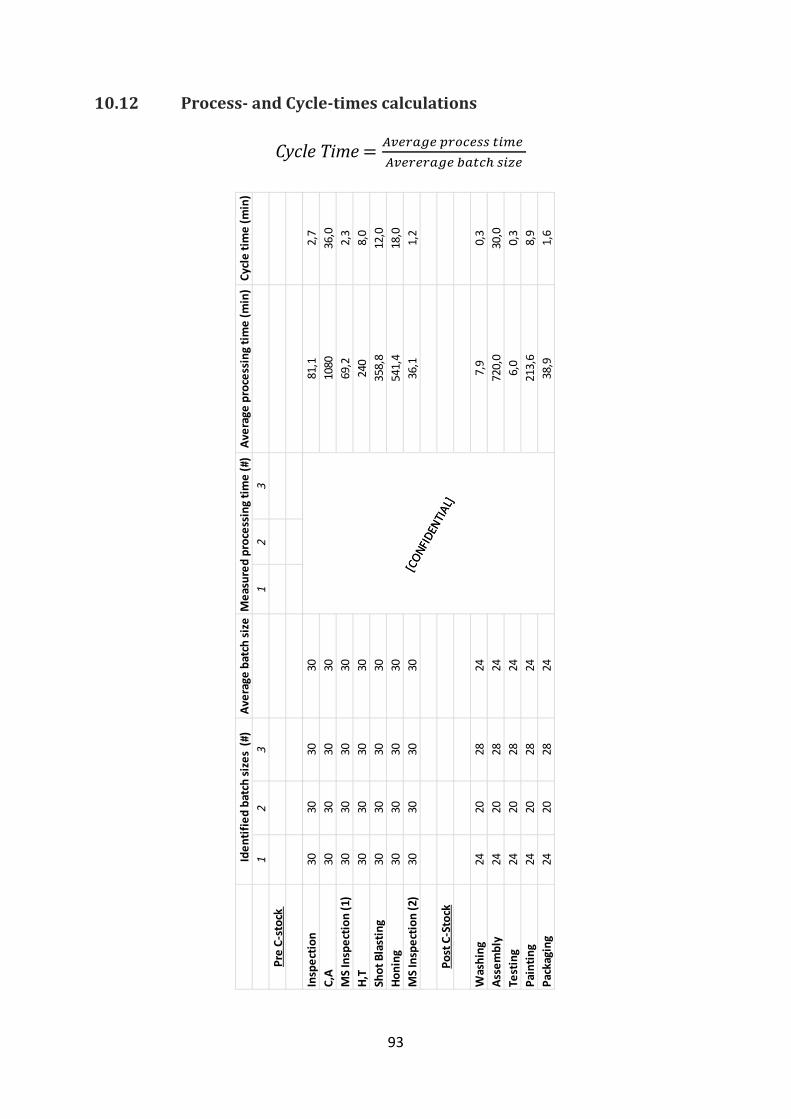
93
10.12 Process- and Cycle-times calculations
Iden
tifie
d ba
tch
size
s (#
)Av
erag
e ba
tch
size
Mea
sure
d pr
oces
sing
tim
e (#
)Av
erag
e pr
oces
sing
tim
e (m
in)
Cycl
e tim
e (m
in)
12
31
23
Pre
C-st
ock
[CON
FIDE
NTIA
L]
Insp
ectio
n30
3030
3081
,12,
7C,
A30
3030
3010
8036
,0M
S In
spec
tion
(1)
3030
3030
69,2
2,3
H,T
3030
3030
240
8,0
Shot
Bla
stin
g30
3030
3035
8,8
12,0
Honi
ng30
3030
3054
1,4
18,0
MS
Insp
ectio
n (2
)30
3030
3036
,11,
2
Post
C-S
tock
Was
hing
2420
2824
7,9
0,3
Asse
mbl
y24
2028
2472
0,0
30,0
Test
ing
2420
2824
6,0
0,3
Pain
ting
2420
2824
213,
68,
9Pa
ckag
ing
2420
2824
38,9
1,6
[CON
FIDE
NTIA
L]
Cycle Time = 𝐴𝑣𝑒𝑟𝑎𝑔𝑒 𝑝𝑟𝑜𝑐𝑒𝑠𝑠 𝑡𝑖𝑚𝑒 𝐴𝑣𝑒𝑟𝑒𝑟𝑎𝑔𝑒 𝑏𝑎𝑡𝑐ℎ 𝑠𝑖𝑧𝑒
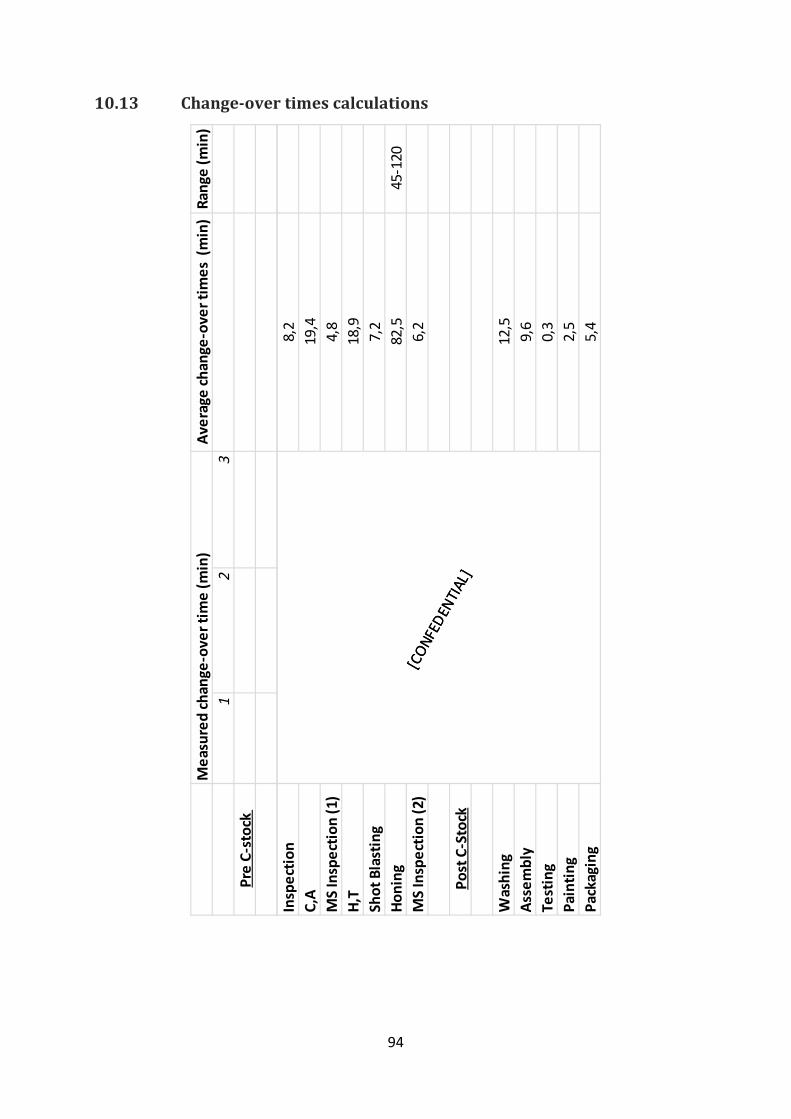
94
10.13 Change-over times calculations
Mea
sure
d ch
ange
-ove
r tim
e (m
in)
Aver
age
chan
ge-o
ver t
imes
(m
in)
Rang
e (m
in)
12
3Pr
e C-
stoc
k
[CON
FEDE
NTIA
L]
Insp
ectio
n8,
2C,
A19
,4M
S In
spec
tion
(1)
4,8
H,T
18,9
Shot
Bla
stin
g7,
2Ho
ning
82,5
45-1
20M
S In
spec
tion
(2)
6,2
Post
C-S
tock
Was
hing
12,5
Asse
mbl
y9,
6Te
stin
g0,
3Pa
intin
g2,
5Pa
ckag
ing
5,4
[CON
FEDE
NTIA
L]

95
10.14 Uptime calculations
M
easu
red
oper
atin
g tim
esAv
erag
e op
erat
ing
time
(min
)Av
aila
ble
time
(min
)U
ptim
e1
23
Pre
C-st
ock
[CON
FIDE
NTIA
L]
Insp
ectio
n40
,542
010
%C,
A11
29,8
1260
90%
MS
Insp
ectio
n (1
)25
3,9
420
60%
H,T
1134
,112
6090
%Sh
ot B
last
ing
125,
342
030
%Ho
ning
378,
442
090
%M
S In
spec
tion
(2)
252,
442
060
%
Post
C-S
tock
Was
hing
63,4
420
15%
Asse
mbl
y33
7,7
420
80%
Test
ing
294,
442
070
%Pa
intin
g33
4,8
420
80%
Pack
agin
g21
1,6
420
50%
[CON
FIDE
NTIA
L]
𝑈𝑝𝑡𝑖𝑚𝑒 =𝑂𝑝𝑒𝑟𝑎𝑡𝑖𝑛𝑔 𝑇𝑖𝑚𝑒𝐴𝑣𝑎𝑖𝑙𝑎𝑏𝑙𝑒 𝑇𝑖𝑚𝑒
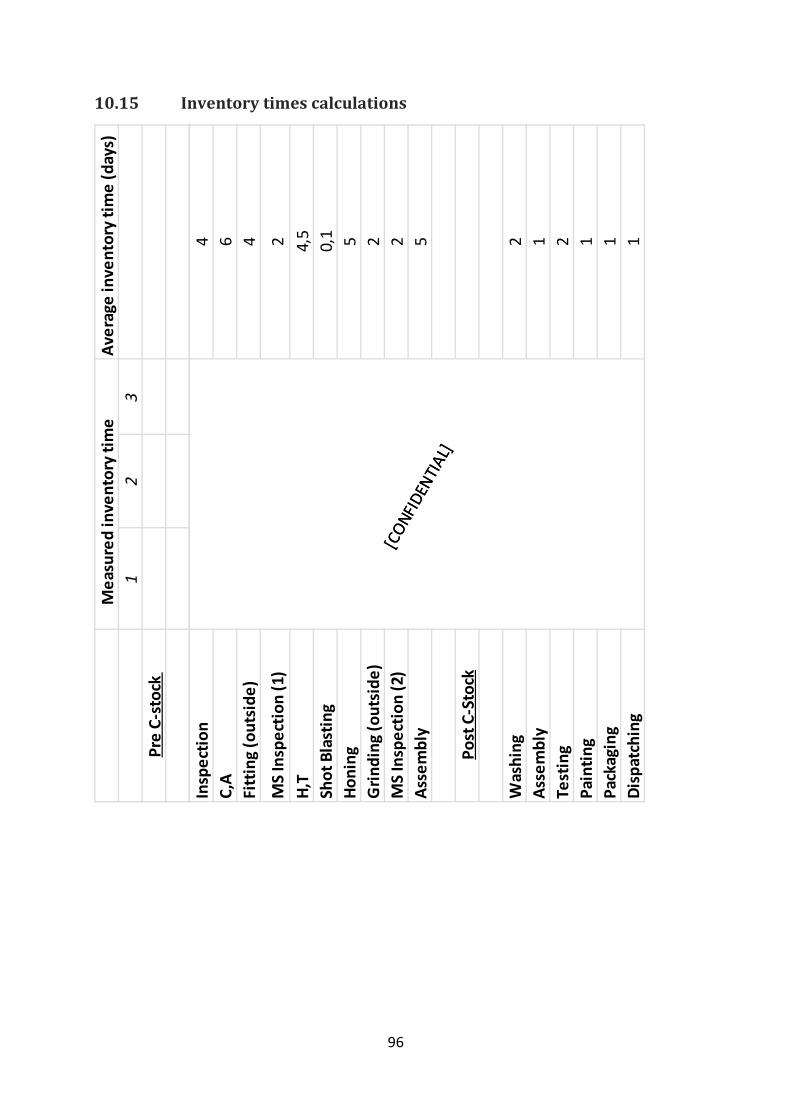
96
10.15 Inventory times calculations
M
easu
red
inve
ntor
y tim
eAv
erag
e in
vent
ory
time
(day
s)1
23
Pre
C-st
ock
[CON
FIDE
NTIA
L]
Insp
ectio
n4
C,A
6Fi
ttin
g (o
utsi
de)
4
MS
Insp
ectio
n (1
)2
H,T
4,5
Shot
Bla
stin
g0,
1Ho
ning
5G
rindi
ng (o
utsi
de)
2M
S In
spec
tion
(2)
2As
sem
bly
5
Post
C-S
tock
Was
hing
2As
sem
bly
1Te
stin
g2
Pain
ting
1Pa
ckag
ing
1Di
spat
chin
g1
[CON
FIDE
NTIA
L]
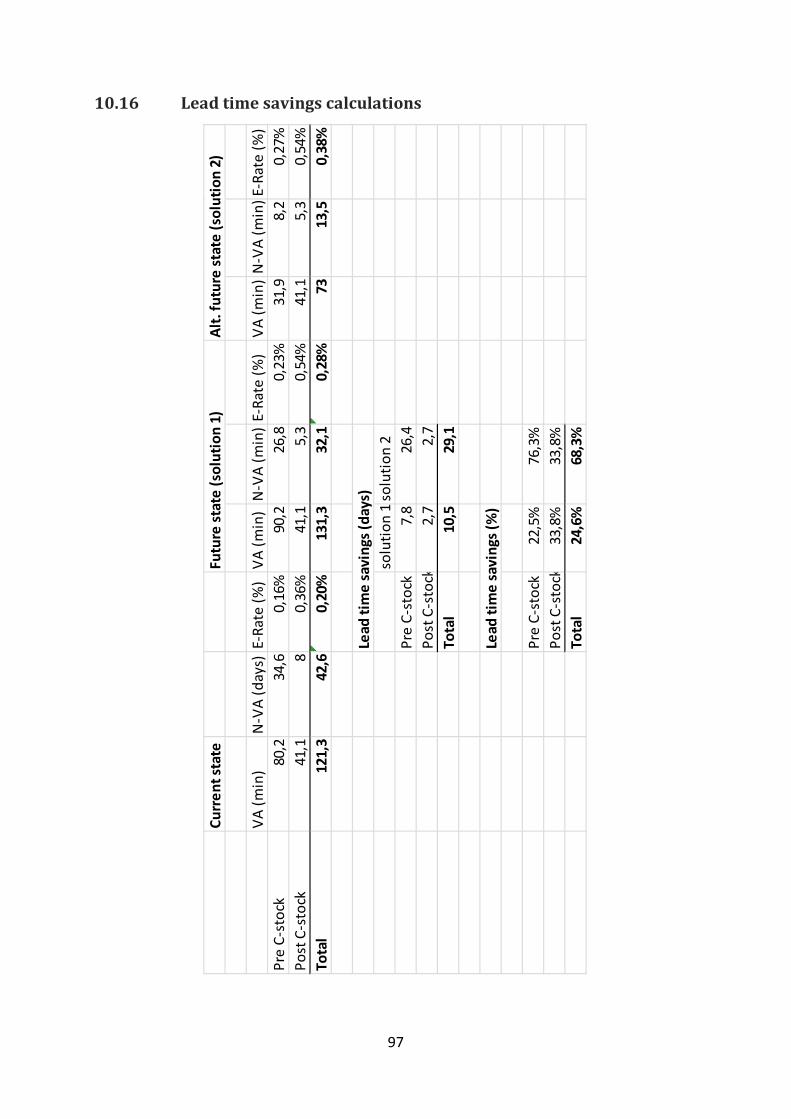
97
10.16 Lead time savings calculations
Curr
ent s
tate
Futu
re st
ate
(sol
utio
n 1)
Alt.
futu
re st
ate
(sol
utio
n 2)
VA (m
in)
N-V
A (d
ays)
E-Ra
te (%
)VA
(min
)N
-VA
(min
)E-
Rate
(%)
VA (m
in)
N-V
A (m
in)E
-Rat
e (%
)Pr
e C-
stoc
k80
,234
,60,
16%
90,2
26,8
0,23
%31
,98,
20,
27%
Post
C-s
tock
41,1
80,
36%
41,1
5,3
0,54
%41
,15,
30,
54%
Tota
l12
1,3
42,6
0,20
%13
1,3
32,1
0,28
%73
13,5
0,38
%
Lead
tim
e sa
ving
s (da
ys)
solu
tion
1so
lutio
n 2
Pre
C-st
ock
7,8
26,4
Post
C-s
tock
2,7
2,7
Tota
l10
,529
,1
Lead
tim
e sa
ving
s (%
)
Pre
C-st
ock
22,5
%76
,3%
Post
C-s
tock
33,8
%33
,8%
Tota
l24
,6%
68,3
%
98
10.17 Pre C-stock key questions for future state
1. What is the takt time?
With current customer demand a tact time of 84 minutes is calculated for the CP1230 cylinder.
𝑇𝑎𝑘𝑡 𝑡𝑖𝑚𝑒 = 𝐴𝑣𝑎𝑖𝑙𝑎𝑏𝑙𝑒 𝑡𝑖𝑚𝑒𝐶𝑢𝑠𝑡𝑜𝑚𝑒𝑟 𝑑𝑒𝑚𝑎𝑛𝑑 (𝑝𝑒𝑟 𝑠ℎ𝑖𝑓𝑡)
Available time= 420 min one shift)
Customer demand = 25 items every 5 days (gives five items per shift)
𝑇𝑎𝑘𝑡 𝑡𝑖𝑚𝑒 = 420 𝑚𝑖𝑛5 (𝑖𝑡𝑒𝑚𝑠 𝑝𝑒𝑟 𝑠ℎ𝑖𝑓𝑡)
= 84𝑚𝑖𝑛
2. Will you build to a finished goods supermarket from which the customer pulls, or directly to shipping?
Pre C-stock will supply the c-stock with finished components (CP1230 cylinder). The C-stock is functioning as a supermarket hence the pre c-stock flow will build to a supermarket and not directly for shipping.
3. Where can you use continuous flow processing?
Throughout the pre C-stock a continuous flow could be attempted at two stages where operations cycle times are not fare apart, therefore between hardening and shot blasting and between honing and the reinstalled in-house process of grinding. Remaining of processes is more efficient to be run as batch operations because of differences in cycle times and physical distances prohibiting an adjacent arrangement.
4. Where will you need to use supermarket pull systems (in order to control production of upstream processes)?
The C-stock is functioning as a supermarket for the CP1230 cylinder hence all upstream processes i.e. the whole pre C-stock flow is controlled by the C-stock.
5. At what single point in the production (the pacemaker process) will you schedule production?
The point of scheduling production through the pre C-stock will continue to vary (float) because of several factors. Primarily work in progress, raw material availability and validated demand thru confirmed purchased orders. Therefore a certain process of the pre C-stock flow will not be functioning as the pacemaker. Further, the remaining CTO production activities must be considered before a complete answer can be given.
99
6. How will you level the production mix (at the pacemaker process)?
The production mix is not considered since the scope is targeting one component through a multiple component flow. However a systematical product mix should be investigated to be applied at processes suggested to be streamed in continues flow (i.e. hardening, shot blasting, grinding and honing).
7. What increment of work will you consistently release and take away at the pacemaker process?
The pacemaker process of the pre C-stock flow is not recognized with the scheduling point of the production changing and depending on work in progress, raw material availability and purchase orders.
8. What process improvements will be necessary (for the Value Stream to flow as your future state-design specifies?
Improvements to obtain the future state Value Stream are except reinstating grinding operations focused to reducing change-over time and visual management.
100
10.18 Post C-stock key questions for future state
1. What is the takt time?
With current customer demand a tact time of 84 minutes is calculated for the CP1230 breaker. Both pre- and post C-stock takt time are calculated with the help of the same input parameters.
2. Will you build to a finished goods from supermarket from which the customer pulls, or directly to shipping?
The CTO division is mainly producing to maintain the stock levels of a central distribution center but within the scope the C-stock will be considered to build CP1230 breakers based on orders directly to shipping and not to a supermarket.
3. Where can you use continuous flow processing?
Throughout the post C-stock, continuous flow processing could be applied following assembly operations until reaching dispatching.
4. Where will you need to use supermarket pull systems (in order to control production of upstream processes?
A supermarket pull system is used from the start of Assembly operations to pull finished components. Upstream processes that are controlled thru his setup are only washing operations within the post C-stock. Considering both flows (pre- and post C-stock) the supermarket setup connecting the flows will “control” the C-stock turnover and by that have a controlling impact on entire pre C-stock processes. Because of extensive lead times and low agility of the pre C-stock operations, the upstream processes cannot not solely be controlled with the supermarket setup in.
5. At what single point in the production (the pacemaker process) will you schedule production?
Assembly operations will decide when components are pulled from C-stock and schedule post C-stock production.
6. How will you level the production mix (at the pacemaker process)?
Depending on total CTO order volumes and urgency the product mix will vary at assembly cells (pacemaker process). The actual production mix will constantly vary on a daily and weekly basis.
101
7. What increment of work will you consistently release and take away at the pacemaker process?
As the production mix is not constant through the assembly cells the increment of work that is constantly released cannot be determined in forehand for the post C-stock flow pacemaker process.
8. What process improvements will be necessary (for the Value Stream to flow as your future state-design specifies?
Increasing uptime at testing operations along with visual management throughout the post c-stock flow are improvements decided to achieve the future state post c-stock.


![Atlas Copco (India) Limited · 3. Atlas Copco International B.V. ACO0101339 4. Atlas Copco AB ACO0101595, ACO0101097, A 0005191 and 10177354 5. Atlas Copco [I] Ltd Charitable Foundation](https://img.pdfslide.us/doc/110x75/5ec4197bfe534e04f779e397/atlas-copco-india-limited-3-atlas-copco-international-bv-aco0101339-4-atlas.jpg)