Embed Size (px)
Citation preview

Tampa Convention Center • Tampa, Florida
Economic Justification of Resiliency Investments
Value Proposition of Resilience Investments
Nisha ThirumurthySenior Project Leader, Project Development and Finance
National Renewable Energy Laboratory (NREL)August 17, 2017

Energy Exchange: Connect • Collaborate • Conserve
• Energy security is of great concern to the US Government, especially the protection of critical DoD facilities.
• The question is how can we develop such projects in a cost effective manner.
• Suitable projects would ideally converge at the nexus of three areas shown in the figure.
Identify profitable value streams for energy
security investments
Establish viable financial
assessments and metrics for energy
security investments
Identify feasible procurement strategies and authorities to
implement energy security investments
There is a move in the DoD to develop cost-competitive, resilient and cleaner energy projects.

Energy Exchange: Connect • Collaborate • Conserve
Instead of trying to value resiliency before a catastrophic event occurs, find a way to pay for it today.
Future
Past
Present
• Past outage predictor of future outage? Yes, but the current system of coping with those might suffice.
• But what about catastrophic, once-in-a-lifetime events?
• How do you value something that hasn’t happened yet?
Capture value today through:• Utility rate savings• Ancillary services market
(demand response, resource adequacy, reg up/reg down)
Best strategy is to pay for it today to have resiliency tomorrow.
Energy Exchange: Connect • Collaborate • Conserve
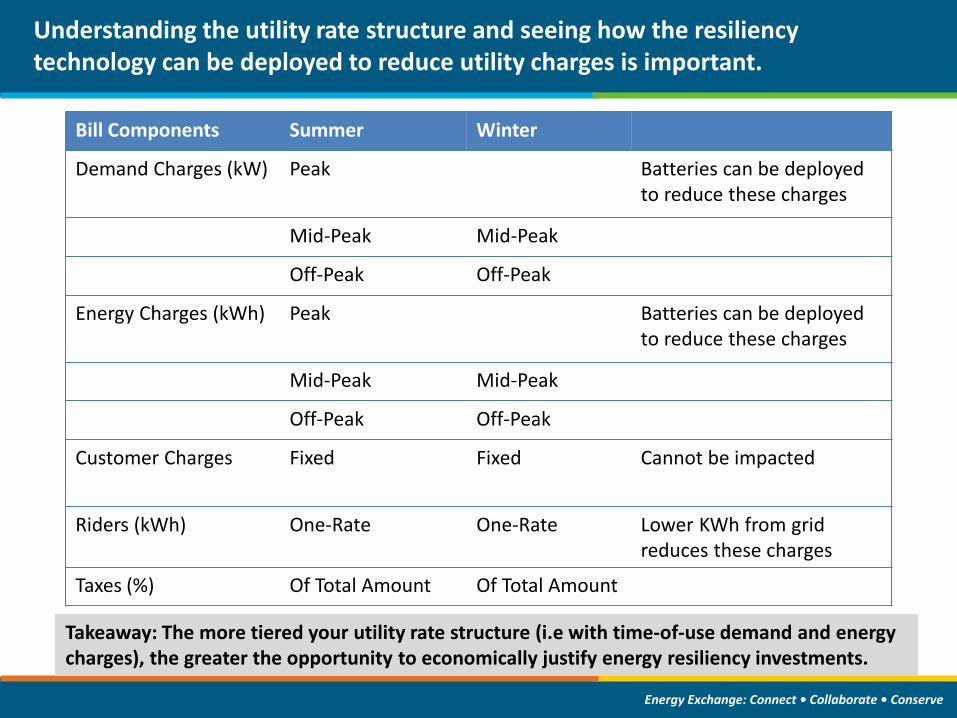
Bill Components Summer Winter
Demand Charges (kW) Peak Batteries can be deployed to reduce these charges
Mid-Peak Mid-Peak
Off-Peak Off-Peak
Energy Charges (kWh) Peak Batteries can be deployed to reduce these charges
Mid-Peak Mid-Peak
Off-Peak Off-Peak
Customer Charges Fixed Fixed Cannot be impacted
Riders (kWh) One-Rate One-Rate Lower KWh from grid reduces these charges
Taxes (%) Of Total Amount Of Total Amount
Takeaway: The more tiered your utility rate structure (i.e with time-of-use demand and energy charges), the greater the opportunity to economically justify energy resiliency investments.
Understanding the utility rate structure and seeing how the resiliency technology can be deployed to reduce utility charges is important.

Energy Exchange: Connect • Collaborate • Conserve
In this example, the battery is strategically charged during off-peak periods (orange) and then discharged during peak periods (red) to reduce peak demand.

Energy Exchange: Connect • Collaborate • Conserve
Example: PV + Battery combined with existing diesel genset extends probability of surviving outage at a lower or marginally higher cost
0%
20%
40%
60%
80%
100%
1 2 3 4 5 6 7 8 9 10 11 12 13 14
Prob
abili
ty o
f Sur
vivi
ng O
utag
e [%
]
Length of Outage [Days]
Base case
Generator Solar PV Storage Lifecycle Cost Outage
1. Base case 2.5 MW - - $20 million 5 days
2. Lowest cost solution 2.5 MW 625 kW 175 kWh $19.5 million 6 days
3. Proposed system 2.5 MW 2 MW 500 kWh $20 .1million 9 days
Lowest cost solution
Proposed system (given site goals & constraints)
NREL evaluated thousands of random grid outages and durations throughout the year and compared number of hours the site could survive with a diesel gensets and fixed fuel supply vs. gensets augmented with PV and battery

Energy Exchange: Connect • Collaborate • Conserve
• Operation for 66hr outage starting at 1900hrs, October 16th
• Critical load is 70% of site load (note gap between generation and load)
Dispatch Strategy
Battery Charging
Grid Outage
Combined operation of RE and diesel generators extends fuel for the outage (49% reduction in fuel used (due to PV/Energy storage systems)

Energy Exchange: Connect • Collaborate • Conserve
Innovations both on the market and technology side are adding additional value to resiliency investments
Market opportunities
going up
Technology costs going
down
Demand Response Resource AdequacyReg Up/Reg Down ServicesBlack Start Capability Payments
Energy Storage CostsSolar Technology Costs
The combination of improving market opportunities and decreasing technology costs are making resiliency investments more attractive

Energy Exchange: Connect • Collaborate • Conserve
Some electricity markets have specific needs that can make resiliency investments more valuable

Energy Exchange: Connect • Collaborate • Conserve
We can bring all of these aspects together along with other variables to determine the value of resiliency for individual projects.
Rate Analysis (Savings)
Diesel Fuel Cost Analysis (Savings)
Value Streams Analysis (Additional Revenues)
Data Streams Deliverables Procurement Pathways
Tariff structure/bills
Interval load data
Backup generator usage
Regulatory / Market research
Grants/incentives research Financial / Economic Model Development
System design scenarios and capital and O&M costs
RE resource analysis
Resiliency Duration Versus Cost Analysis
PPA ESPC
UESC UP
GSA EUL
Appropriation (MMRP, Milcon)
Grants (eg. CEC, ECIP etc)
AF Working Capital Funds
Econ
omic
Ana
lysi
s

Energy Exchange: Connect • Collaborate • Conserve
“Contract for differences” is another interesting model, however the opportunities for arbitrage to fund resiliency are not certain.
Source: Based on figure in Renewable Power Direct, 2015
Customer (eg. Installation)
Electricity Provider (eg. Utility)
Renewable Project Wholesale Market (eg. RTO)
$/MWh (Variable)
Power (MWh)
Power (MWh)
$/MWh (Variable)
$/M
Wh
(Fix
ed)
RECs
+ $
/MW
h (V
aria
ble)
$/M
Wh
(Var
iabl
e)
Pow
er (M
Wh)
1
2
3
1. Customer signs CFD with Renewable Generator at a fixed rate (“strike” price) for power. Generator delivers RECs plus variable settlement to Customer.
2. Renewable Generator sells power to Wholesale Market at “spot” price and settles with customer based on difference between “strike” and “spot” prices
3. Customer uses RECs and CFD settlement to offset carbon emissions and costs of retail power and fund resiliency projects

Energy Exchange: Connect • Collaborate • Conserve
Another approach – Customer Damage Function (CDF) – seeks to place a value today on future outage-related losses
– Based on customer survey of outage and cost information• Site-specific, depends on duration of interruption, situation in which
interruption occurs, customer activity• Used two hypothetical scenarios that vary in duration and situation in which
interruption occurs (emergency level)
Two scenarios• Scenario A• There is a power outage and the lack of power supply lasts for 1 hour, 4
hours, 8 hours or 24 hours. The base is not in an emergency situation.• Scenario B• There is an outage and a natural disaster or terrorist attack event I
simultaneously going on in the area. The lack of power supply lasts for 1 hour, 4 hours, 8 hours, or 24 hours and the base is under an emergency situation and has to remain operational.
Giraldez, J. World Renewable Energy Forum 5/17/2012NREL/PR 7A30 54985

Energy Exchange: Connect • Collaborate • Conserve
Surveys used at Miramar and Fort Belvoir identified the following costs related to outages.
Costs vary depending on scenario and outage duration
Giraldez, J. World Renewable Energy Forum 5/17/2012NREL/PR 7A30 54985
Suspended mission critical non-critical
operations
Impact on relief and rescue
missions
Personnel sent home from work
Overtime for emergency workers
Base security impacts
Infrastructure impacts (heat,
water, sewer, traffic lights)
Delays or failures in backup generation
Fuel for backup generators
Equipment damaged
Human lives put in danger Food spoilage Residential impacts
Curtailing commercial facility
operating hours
Energy Exchange: Connect • Collaborate • Conserve
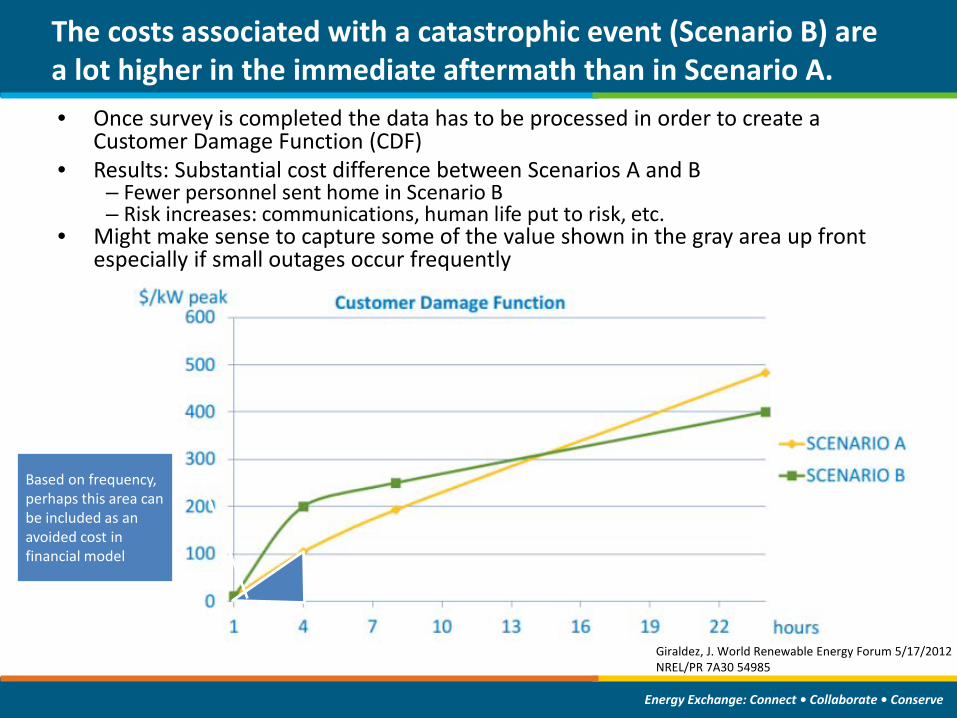
• Once survey is completed the data has to be processed in order to create a Customer Damage Function (CDF)
• Results: Substantial cost difference between Scenarios A and B– Fewer personnel sent home in Scenario B– Risk increases: communications, human life put to risk, etc.
• Might make sense to capture some of the value shown in the gray area up front especially if small outages occur frequently
Giraldez, J. World Renewable Energy Forum 5/17/2012NREL/PR 7A30 54985
The costs associated with a catastrophic event (Scenario B) are a lot higher in the immediate aftermath than in Scenario A.
Based on frequency, perhaps this area can be included as an avoided cost in financial model

Energy Exchange: Connect • Collaborate • Conserve
In certain markets, a combination of high utility rates and favorable market conditions could make investing in resiliency a more cost-effective option than the status quo
If utility rates in your area are low, then looking at arbitrage options through CFD might be worth investigating
Also looking at the losses incurred during routine outages and using that as part of your avoided cost (or savings) upfront might also be a valid consideration in some cases
Find a way to pay for resiliency today, so that it’s available when a catastrophic event occurs.
Giraldez, J. World Renewable Energy Forum 5/17/2012NREL/PR 7A30 54985

Energy Exchange: Connect • Collaborate • Conserve
APPENDIX

Energy Exchange: Connect • Collaborate • Conserve
The table provides some examples of the value that could be captured from resiliency investments in the CAISO region.
Possible to participate in several different markets:
http://www.caiso.com/documents/reliabilitydemandresponseresourceoverview.pdf
Ancillary Service Market Est. Value of Service Requirements
Day Ahead Energy Market $20-$40/MWh • Minimum 100 kW• Must be directly dispatchable
5 Minute Energy Market $15-$30/MWh • Minimum 100 kW• Must be directly dispatchable
Non-Spinning Reserves $2 to $10/MWh • Minimum continuous performance of 30 mins
Reliability Energy $950-1000/MW (onlyduring an emergency event)
• Minimum 500 kW• Able to deliver reliability energy in real-time
reaching full curtailment within 40 minutes • Minimum performance of 1 hour, up to 4
hours• Must be available for up to 15 events and/or
48 hours every 6 months

Energy Exchange: Connect • Collaborate • Conserve
DRAM (Demand Response Auction Mechanism):• Competitive annual
auction, still in early stages.
• Average weighted bids were– $87/MWh in 2014 – $50/MWh in 2015
• Must be dispatchable on a continuous basis for at least 60 minutes.
Ancillary Services: Resource Adequacy
CAISO- “2015 Annual Report on Market Issues and Performance”. May 2016.http://www.caiso.com/Documents/2015AnnualReportonMarketIssuesandPerformance.pdf
Total volume and bid prices for all resource adequacy services in 2015, during peak hours.

Energy Exchange: Connect • Collaborate • Conserve
Reg-Up/Reg-Down:• Prices for both regulation services roughly tripled due to change
in market procurement requirements, from about $5/MWh to about $15/MWh.
• Anecdotally around $10/MWh from LA AFB V2G pilot• Lot of paperwork and effortto become a wholesale market participant• Mutually exclusive with Demand Response• Metering/scheduling can be technically challenging
Ancillary Services
CAISO. “Q1 2016 Report on Market Issues and Performance.” June 13,2016.http://www.caiso.com/Documents/2016FirstQuarterReportMarketIssuesandPerformance.pdf

Energy Exchange: Connect • Collaborate • Conserve
Example CDF SurveyScenario A: 1. Outage due to minor event on the power grid 1 Hour 4 Hours 8 Hours 24 Hours
Mission impacts
Were mission critical functions affected? If so, what was the cost?What was the cost of re-starting mission activities?Were any human lives put in danger?Was any equipment damaged? Repaired/replaced? Estimated cost? Were any personnel ordered to remain or sent home? If so, how many? Was the security of the base affected?Other mission related costs due to loss of power?
Infrastructure impactsDid the natural gas, potable water, sewer systems, and traffic/ street/ parking lot lights, alarms remain functional? If not, what was the cost?Support personnel: Did the base have to pay overtime to police, firefighters, emergency response workers, or others to deal with the outage?Backup generatorsHow many of the backup diesel generators started? How long did it take? Did any backup systems fail to start? What was the fuel cost of running the backup generators?
Commercial facilitiesWere normal operating hours curtailed? If so, what was the economic impact?
Were any food/products spoiled? Estimated cost?
Residential facilitiesWhat would base residents be willing to pay to avoid a similar outage in the future?Other costs