Embed Size (px)
Citation preview
7/28/2019 Value of Fault Ride Through capability of Wind generation in UK.pdf
http://slidepdf.com/reader/full/value-of-fault-ride-through-capability-of-wind-generation-in-ukpdf 1/30
Page 1 of 30
Centre for Distributed Generation and
Sustainable Electrical Energy
Value of fault ride through capability
of wind generation in the UK
Summary report
T. Bopp and Prof G. Strbac
PO Box 88, Manchester, M60 1QD
October 2004
7/28/2019 Value of Fault Ride Through capability of Wind generation in UK.pdf
http://slidepdf.com/reader/full/value-of-fault-ride-through-capability-of-wind-generation-in-ukpdf 2/30
Value of fault ride through capability of wind generation in the UK
Page 2 of 30
Table of Contents
TABLE OF CONTENTS........................................................................................................ 2
EXECUTIVE SUMMARY..................................................................................................... 3
LIST OF FIGURES................................................................................................................. 7
LIST OF TABLES................................................................................................................... 7
1. INTRODUCTION............................................................................................................... 8
2. OBJECTIVES AND OVERVIEW OF THE APPROACH........................................... 11
MODELLING OF TECHNICAL AND ECONOMIC SYSTEM PERFORMANCE.................................................12
3. QUANTIFICATION OF THE VALUE OF FAULT RIDE THROUGH
CAPABILITY................................................................................................................... 18
STUDIED SCENARIOS...........................................................................................................................22
4. SENSITIVITY ANALYSIS.............................................................................................. 26
TOTAL INSTALLED WIND GENERATION CAPACITY OF 15GW .................................................... ..........26 GOVERNOR DROOP SETTING 2% ....................................................... .................................................. 27 I NERTIAL EFFECT OF WIND GENERATION ............................................................................................27
5. CONCLUSIONS ............................................................................................................... 28
6. REFERENCES.................................................................................................................. 30
7/28/2019 Value of Fault Ride Through capability of Wind generation in UK.pdf
http://slidepdf.com/reader/full/value-of-fault-ride-through-capability-of-wind-generation-in-ukpdf 3/30
Value of fault ride through capability of wind generation in the UK
Page 3 of 30
Executive summary
Although penetration of intermittent renewable resources and other forms of
distributed generation by 2020 and beyond, as described in the Energy White
Paper, may displace a significant amount of energy produced by large
conventional plant, there are concerns associated with the ability of these newgeneration technologies to withstand various disturbances and to provide
adequate system support services to ensure system security.
The design characteristics of conventional thermal and hydro generators
enable the plant to contribute to the provision of system support services
(dynamic voltage and frequency regulation) that is critical for a stable
operation of the system. Wind generation uses different technology from
conventional plant and generally, at the moment, is not able to provide a
similar range of support services to the system. At relatively low levels of
penetration this can usually be tolerated. However, operating the system withlarge amounts of such plant could pose major challenges in terms of sustaining
system integrity.
Hence, transmission network operators have recently set out a proposal that
specifies requirements for connecting of wind generation equipment to the
transmission network and these are detailed in the Grid Code consultation
document [NGC, SHETL, SPT, 2004]. In a number of countries, Grid Codes
have been reviewed to reflect the trend of increased levels of penetration of
wind generation. In addition to frequency and voltage control, communication,
dispatch, etc., one of the key issues is associated with the ability of this plantto maintain stable operation during faults on the transmission network, in
order to avoid widespread tripping of wind generation and loss of substantial
amounts of active power generation. This is known as fault ride through
capability.
In contrast to the current Grid Code proposal that demands mandatory fault
ride through capability for wind generation, this study examines the
consequences of increased levels of maximum credible instantaneous loss of
generation (from the current level of 1320MW), that is driven by the inability
of wind generation to withstand close by faults.
The primary objective of this investigation is to estimate the order of
magnitude of additional system cost that would need to be incurred in order to
accommodate wind generation of varying degree of the capability to withstand
faults on the UK transmission network. In other words, the analysis provides

7/28/2019 Value of Fault Ride Through capability of Wind generation in UK.pdf
http://slidepdf.com/reader/full/value-of-fault-ride-through-capability-of-wind-generation-in-ukpdf 4/30
Value of fault ride through capability of wind generation in the UK
Page 4 of 30
estimates of the value of various degrees of the wind turbine generator fault
ride through capability1.
In order for conventional plant to provide frequency response it must run part
loaded. Thermal units operate less efficiently when part loaded, with anefficiency loss of between 10% and 20%. In addition, in order to establish
feasibility of system operation, it will occasionally be required to curtail wind
generation2. This curtailed wind energy will need to be compensated by an
equivalent increase in the output from conventional plant, which will lead to
increase in fuel cost.
The cost associated with accommodating wind generation that is not fully
capable to ride through faults will therefore be composed of:
(i) Additional response cost, mainly fuel cost due to running the
conventional plant at lower efficiency and
(ii) Additional fuel cost due to the substitution of conventional generation
for wind generation curtailment, that occasionally may be necessary to
maintain the feasibility of system operation
Furthermore, operating an increased number of generators part loaded and
having to curtail some of wind generation will increase CO2 emissions.
To assess the cost and CO2 performance of the future UK generation system
we developed a simplified generic model of the system primary response
characteristics3 with 10GW of installed wind generation capacity. The analysis
involved a number of year round simulations of system operation necessary to
capture variations in wind and demand and to quantify the impact of key
factors, such as the degree of wind generation robustness, flexibility of
conventional generation system and the level of penetration of wind.
We estimated the additional cost to vary in the range of £14m to £21m per
annum in case the system is required to withstand loss of up to 5% of wind
1
This work adopts a cost based approach and it does not deal with Renewable Obligation issues andthe present arrangements for the provision of ancillary services and cost recovery mechanisms within NETA.2
The system will need to deal with losses of wind generation in addition to losses of conventional plant. Situations when low load conditions coincide with high outputs of wind will be most difficult todeal with. Clearly, the higher the wind output, the greater the need is for frequency response (due to theincrease in the amount of generation that may be lost). On the other hand, system inertia would tend to
be reduced during low load conditions, which will increase the speed of the initial frequency drop andmake the frequency containment task more demanding. Occasionally, the system will not be able to provide frequency response sufficiently fast and some wind generation will have to be curtailed.3 This analysis is based on the assumption that primary response service is provided by generation. Wehave excluded the contribution that frequency sensitive load disconnection can make in this context.

7/28/2019 Value of Fault Ride Through capability of Wind generation in UK.pdf
http://slidepdf.com/reader/full/value-of-fault-ride-through-capability-of-wind-generation-in-ukpdf 5/30
Value of fault ride through capability of wind generation in the UK
Page 5 of 30
generation in addition to the loss of conventional plant between 1000MW and
1320MW4 (this would correspond to the case of relatively robust but not fully
fault ride through capable plant). For potentially larger generation losses of up
to 30% of wind output (less robust wind generation) these additional costs
were found to be between £106m and £155m per annum.
The amount of wind generation curtailment for the potential instantaneous loss
of 30% of the total wind output was found to be less than 3% of the total
annual wind production, in the case of a partially flexible generation system.
Additional CO2 emissions were estimated to vary between about 0.5Mt and
4.5Mt per annum, depending on the degree of robustness of wind generators.
The results of a survey presented in the Grid Code consultation document[NGC, SHETL, SPT, 2004] suggest that the cost of equipment associated with
providing fault ride through capability is between 1% and 3% of the turbine
cost. This indicates that the cost of providing fault ride through capability is
likely to be lower than the associated value quantified in this study,
particularly if a large proportion of wind generation (more than 20%) can be
lost due to a fault on the transmission network. In other words the analysis
suggests that it would be cost efficient to invest in the equipment and solutions
necessary to enable wind generators to ride through faults, as demanded by the
proposed Grid Code. However, for reasonably robust wind generation
technology (if no more than 5% of wind output could be lost after a critical
fault on the network) the additional system cost seems to be similar to the costof developing wind turbine generators with the full fault ride through
capability.
If however more wind generation is to be installed with relatively low
robustness (if 20% or more of wind output can be lost due to a critical fault on
the transmission network) the overall system cost increase considerably, and
the case for enforcing Grid Code requirements would be even stronger. We
have quantified the additional costs for systems with 10GW and 15GW of
installed wind generation capacity.
Finally, the benefit of wind generation providing inertial effects was
estimated. Across the various cases considered, it was found that the primary
response cost could be reduced by 10% to 30% of the corresponding base case
cost. This is considered to be significant and this question should be
4Using our model we estimated the base level annual cost of response to be in order of £65m per year,
which is sufficiently close to the current response related expenditure, given that this study isconcerned with the additional cost.
7/28/2019 Value of Fault Ride Through capability of Wind generation in UK.pdf
http://slidepdf.com/reader/full/value-of-fault-ride-through-capability-of-wind-generation-in-ukpdf 6/30
Value of fault ride through capability of wind generation in the UK
Page 6 of 30
investigated further. It should be noted however that the proposed Grid Code
does not address plant inertia and that there is no incentive for its provision.
Overall, the work carried out clearly demonstrates that, if a significant amount
of wind generation with relatively low robustness is to be installed (with morethan 10% of wind generation output contributing to the maximum credible
loss), this would lead to a very considerable increase in system costs. These
additional costs would be significantly higher than the expected cost of
engineering necessary to provide fault ride through capability. The results of
the studies performed suggest that requiring sufficient fault ride through
capability for large wind farms would be economically efficient.
On the other hand, for connecting wind generation with relatively high
robustness (with less than 5% of wind output contributing to the maximum
credible loss) the increase in system cost was found to be in the same order of magnitude as the expenditure required to enable fault ride through capability.
However, in order to establish the implications of this more precisely, further
studies would be required with actual locations that may need to be restricted
and sizes of wind farms to be considered, including potential consideration of
inertial effects. Furthermore, it would be appropriate to consider the technical
and commercial potential of the demand side to provide increased volumes of
response services.

7/28/2019 Value of Fault Ride Through capability of Wind generation in UK.pdf
http://slidepdf.com/reader/full/value-of-fault-ride-through-capability-of-wind-generation-in-ukpdf 7/30
Value of fault ride through capability of wind generation in the UK
Page 7 of 30
List of Figures
FIGURE 2-1: FREQUENCY REGULATION SERVICES (FROM NGT SYS) .................................... 12 FIGURE 2-2: GENERIC SYSTEM TO MODEL PRIMARY FREQUENCY RESPONSE ......................... 14 FIGURE 2-3: PRIMARY RESPONSE CHARACTERISTICS FOR DIFFERENT DROOP SETTINGS........ 15
FIGURE 3-1: GROSS DEMAND PROFILE .................................................................................... 18 FIGURE 3-2: WIND OUTPUT PROFILE ....................................................................................... 18 FIGURE 3-3: PRIMARY RESPONSE REQUIREMENT CURVES ...................................................... 20 FIGURE 3-4: MARGINAL COST OF ELECTRICITY AND INCREASE IN CO2 EMISSIONS................ 22
List of Tables
TABLE 3-1: ADDITIONAL ANNUAL PRIMARY RESPONSE COST ................................................ 23 TABLE 3-2: WIND GENERATION CURTAILED ........................................................................... 23 TABLE 3-3: ADDITIONAL ENERGY COST DUE TO WIND GENERATION CURTAILMENT ............. 24
TABLE 3-4: ADDITIONAL CO2 EMISSIONS DUE TO ADDITIONAL PRIMARY RESPONSE PROVISION............................................................................................................................. 24 TABLE 3-5: ADDITIONAL CO2 EMISSIONS DUE TO WIND ENERGY CURTAILMENT................... 24 TABLE 3-6: ADDITIONAL COST OF FAULT RIDE THROUGH CAPABILITY .................................. 25 TABLE 4-1: PERCENTAGE INCREASE IN ADDITIONAL PRIMARY RESPONSE COST .................... 26 TABLE 4-2: CURTAILED WIND ENERGY AND NUMBER OF HALF HOURLY CURTAILMENT
PERIODS................................................................................................................ 26
7/28/2019 Value of Fault Ride Through capability of Wind generation in UK.pdf
http://slidepdf.com/reader/full/value-of-fault-ride-through-capability-of-wind-generation-in-ukpdf 8/30
Value of fault ride through capability of wind generation in the UK
Page 8 of 30
1. Introduction
1.1. An overriding objective in the operation of power systems is to maintain
security as widespread system blackouts are very costly and extremely
damaging for society. The technical performance of the generating plant,
particularly at times when the system experiences disturbances, plays a critical
role in maintaining system integrity. The design characteristics of
conventional thermal and hydro generators enable the plant to contribute to
the provision of system support (dynamic voltage and frequency regulation)
that is critical for a stable operation of the system.
1.2. An appropriate level of frequency regulation services (primary and secondary
response) and reserve capability are necessary to deal with disturbances
caused by outages of generators. Services related to system support are
provided through a mix of compulsory services (such as frequency responseand reactive support) defined by the Grid Code, and a spectrum of commercial
services (such as enhanced response service and standing reserve).
1.3. Although penetration of intermittent renewable resources and other forms of
distributed generation by 2020 and beyond, as described in the Energy White
Paper, may displace a significant amount of energy produced by large
conventional plant, there are concerns associated with the ability of these new
generation technologies to withstand various disturbances and to provide
adequate system support services to ensure system security.
1.4. Wind generation uses different technology to conventional plant and
generally, at the moment, is not able to provide a similar spectrum of support
services to the system. At relatively low levels of penetration this can usually
be tolerated. However, operating the system with large amounts of such plant
could pose major challenges in terms of sustaining system integrity.
1.5. Hence, transmission network operators have recently set out a proposal that
specifies requirements for connecting of wind generation equipment to the
transmission network and these are detailed in the Grid Code consultationdocument [NGC, SHETL, SPT, 2004]. In a number of countries, Grid Codes
have been reviewed to reflect the trend of increased levels of penetration of
wind generation.
1.6. In addition to frequency and voltage control, communication, dispatch, etc.,
one of the key issues is associated with the ability of wind generation to
maintain stable operation during faults on the transmission network, in order
to avoid widespread tripping of wind generation and losses of substantial

7/28/2019 Value of Fault Ride Through capability of Wind generation in UK.pdf
http://slidepdf.com/reader/full/value-of-fault-ride-through-capability-of-wind-generation-in-ukpdf 9/30
Value of fault ride through capability of wind generation in the UK
Page 9 of 30
amounts of active power generation. This is known as the fault ride through
capability. Quantification of the value of fault ride through capability of wind
generation in the future UK electricity system is the main subject of this
report.
1.7. For the duration of a fault on the transmission network, the voltage on the
faulted phases is assumed to be zero at the point of fault. Considering
relatively low transmission circuit impedances, such fault conditions can
cause a large transient voltage depression across wide network areas.
Conventional synchronous generators are expected to trip only if a permanent
fault occurs on the circuit they are directly connected to. However, other
electrically nearby generators that are connected to healthy circuits will
remain connected and stable after the faulted circuits are disconnected. At
present, the transmission system is operated to withstand a maximum sudden
or instantaneous infeed loss of 1320 MW (Sizewell B).
1.8. However, if the generation connected to healthy circuits would not remain
connected and stable during and after the fault is cleared, this generation will
be lost in addition to that disconnected by the original fault (up to 1320MW of
generation, conventional or renewable). Clearly, in this case the system would
be exposed to a loss of generation greater than the current maximum.
1.9. Conventional synchronous generating technology is capable of continuing to
operate through the transient voltage depression that accompanies secured
system fault events. Therefore, only generators connected to the faultynetwork section will be disconnected by protection actions and the fault will
not cause the coincident loss of synchronous generators connected to healthy
network sections. The transmission system is operated on this basis, and the
fault ride through requirement is designed to ensure that the existing level of
necessary resources is maintained to provide stability and security of the
system.
1.10. On the other hand, simple wind turbine technology including its dynamic
performance driven by the generator control design, does not readily possess
similar levels of robustness and could be susceptible to tripping if the voltagetransiently falls below a minimum level. This minimum transient voltage that
can be sustained (given the corresponding fault clearance time) is important,
as it would drive the amount of generation that would be lost for each
particular fault location (and system configuration). The lower the minimum
voltage that can be sustained is, the smaller the area affected by the fault
would be, and hence the lower the amount of generation that would be lost. A
number of studies [NGC, SHETL, SPT, 2004; Tyndall, 2003] have been

7/28/2019 Value of Fault Ride Through capability of Wind generation in UK.pdf
http://slidepdf.com/reader/full/value-of-fault-ride-through-capability-of-wind-generation-in-ukpdf 10/30
Value of fault ride through capability of wind generation in the UK
Page 10 of 30
carried out to determine the depth of the propagation of voltage depressions
for various fault locations and generation scheduling patterns5.
1.11. In summary, if the wind generation to be connected were not able to ride
through faults in a similar manner as conventional synchronous plant, thesystem would be exposed to a loss of generation greater than the current
credible maximum. In this context, the proposed Grid Code update to
incorporate wind generation, is based on the fundamental requirement that the
maximum largest loss of generation should not exceed 1320MW. This
effectively requires that wind generation must remain connected and be able
to ride through faults on the transmission network.
1.12. The impact of increased levels of instantaneous generation loss, driven by the
inability of wind generation to withstand close by faults, on system cost and
CO2 emissions is investigated in this study.
5Also, a factor to be considered is the amount of wind generation connected, as this may have an
impact on the actual level of transient voltage at the terminals of the generator due to voltage difference between the fault and the wind farm.

7/28/2019 Value of Fault Ride Through capability of Wind generation in UK.pdf
http://slidepdf.com/reader/full/value-of-fault-ride-through-capability-of-wind-generation-in-ukpdf 11/30
Value of fault ride through capability of wind generation in the UK
Page 11 of 30
2. Objectives and overview of the approach
Objectives
2.1. The primary objective of this study is to estimate the order of magnitude of
additional system cost that would need to be incurred in order toaccommodate wind generation with various degrees of robustness to withstand
faults on the UK transmission network. In other words, the analysis provides
estimates of the value of various degrees of the capability of wind turbine
generators to ride through faults on the transmission network.
2.2. For this purpose, we have developed a generic dynamic generation system
model to examine technical, economic and environmental performance of the
UK system operating with significant amount of wind generation (10GW and
15GW). This includes implicit modelling of different degrees of ability of
wind turbine generators to ride through to faults. This operation will requireadditional frequency regulation resources to be made available to enable the
system to cope with losses of generation significantly above the current
maximum instantaneous infeed loss of 1320MW. Respecting the physical
limits regarding the amount of generation loss that the system can handle in
this study, we quantify the additional fuel cost and CO2 emissions associated
with providing increased levels of frequency regulation services6.
2.3. The results of this work should also inform the debate associated with the
current Grid Code review in the UK. The current proposal includes a
mandatory fault ride through capability requirement into the Grid Code tokeep the maximum credible loss of generation at the present level (1320MW),
whereas this study examines the consequences of increased levels of
instantaneous generation losses, driven by the inability of wind generation to
withstand faults on the transmission network.
2.4. If a cost reflective pricing of frequency response were to be established, fault
ride through incapable plant would be responsible for the additional cost
required to provide increased levels of frequency response. In this case, the
operators of such plant would have a choice to either invest in fault ride
through capability or to cover the cost of increased frequency responserequirements. Furthermore, there may be times when the output of fault ride
through incapable plant would need to be preventively curtailed to ensure that
the maximum credible loss that the system can handle does not exceed its
physical limits. In this context, the study should enable the cost effectiveness
of the proposed Grid Code solution to fault ride through to be investigated.
6 This analysis is based on the assumption that primary response service is provided by generation. Wehave excluded the contribution that frequency sensitive load disconnection can make in this context.

7/28/2019 Value of Fault Ride Through capability of Wind generation in UK.pdf
http://slidepdf.com/reader/full/value-of-fault-ride-through-capability-of-wind-generation-in-ukpdf 12/30
Value of fault ride through capability of wind generation in the UK
Page 12 of 30
Modelling of technical and economic system performance
Frequency Response: Background
2.5. Frequency is managed by a combination of a) continuous and b) occasional
response services. These two services are illustrated in Figure 2-1.
Figure 2-1: Frequency regulation services (from NGT SYS)
2.6. Continuous response is provided by generation equipped with appropriate
governing systems that control their outputs to neutralise the frequencyfluctuations that may arise from relatively modest changes in demand and
generation. Traditionally, large synchronised generators instructed to operate
in frequency sensitive mode have provided this service.
2.7. The objective of occasional response is to contain significant and abnormal
frequency excursions caused by sudden mismatches in the generation/demand
balance e.g. loss of generation. Primary frequency response requires the most
rapid generator response. The generators must be capable of increasing their
active power output within 10 seconds of predefined system frequency
excursions, and be capable of maintaining this response for a further 20seconds. Generators that provide secondary frequency response services must
be capable of increasing their active power output within 30 seconds of
predefined system frequency excursions, and be able to maintain this response
for a further 30 minutes [Johnson, 1998; NGC GC, 2004]7.
7 The concept of primary and secondary response is devised for steam plant and this distinction is lessrelevant for gas fired plant.
7/28/2019 Value of Fault Ride Through capability of Wind generation in UK.pdf
http://slidepdf.com/reader/full/value-of-fault-ride-through-capability-of-wind-generation-in-ukpdf 13/30
Value of fault ride through capability of wind generation in the UK
Page 13 of 30
2.8. The system frequency drops sharply following a sudden loss of generation, as
illustrated in Figure 2-1. The rate of change of the frequency deviation
following the loss of generation is proportional to the magnitude of the loss
and inversely proportional to the kinetic energy stored in the power system.
This initial rate of frequency change df/dt can be calculated in accordance to
Equation 2-1 (∆ P denotes the amount of generation lost and E kinetic stands for the stored kinetic energy of the power system considering generation and
demand side).
kinetict
pu
E
P
dt
df
×
∆=
= 20
(2-1)
2.9. Given that the kinetic energy stored in the system is proportional to the
amount of rotating machines on the system, the most critical condition will be
at times of low demand. Assuming the existing limit of 1320MW for the
maximum credible loss of generation and assuming an average inertia
constant of H = 6 seconds, the maximum initial rate of the frequency drop,
observed during minimum load conditions (e.g. 20GW), would amount to
0.275Hz/s. Clearly, by increasing the loss of generation, the rate of change of
the frequency deviation will increase; and the time available for frequency
response to develop and to contain the frequency drop will reduce. Generators
operating in frequency sensitive mode (including load disconnections
triggered by low frequency relays) would need to react sufficiently fast not to
allow the frequency to drop below 49.2Hz (see Figure 2-1).
2.10. On the other hand, inertial effect decelerates the rate of change of the
frequency fall. As currently doubly fed induction generation based wind
turbines do not produce inertial effects this will have an adverse impact on the
system frequency performance and increase the need for frequency response
services.
Description of the model
2.11. To study the performance of the UK generation system, we developed ageneric model of the system primary response characteristics. The model is
used to estimate the maximum loss that the system can withstand and the
corresponding response requirement. The single busbar governor-turbine-
power system model shown in Figure 2-2 is used. All generators are modelled
as one lumped generator and the loss of generation is modelled as a
superimposed load change.
7/28/2019 Value of Fault Ride Through capability of Wind generation in UK.pdf
http://slidepdf.com/reader/full/value-of-fault-ride-through-capability-of-wind-generation-in-ukpdf 14/30
Value of fault ride through capability of wind generation in the UK
Page 14 of 30
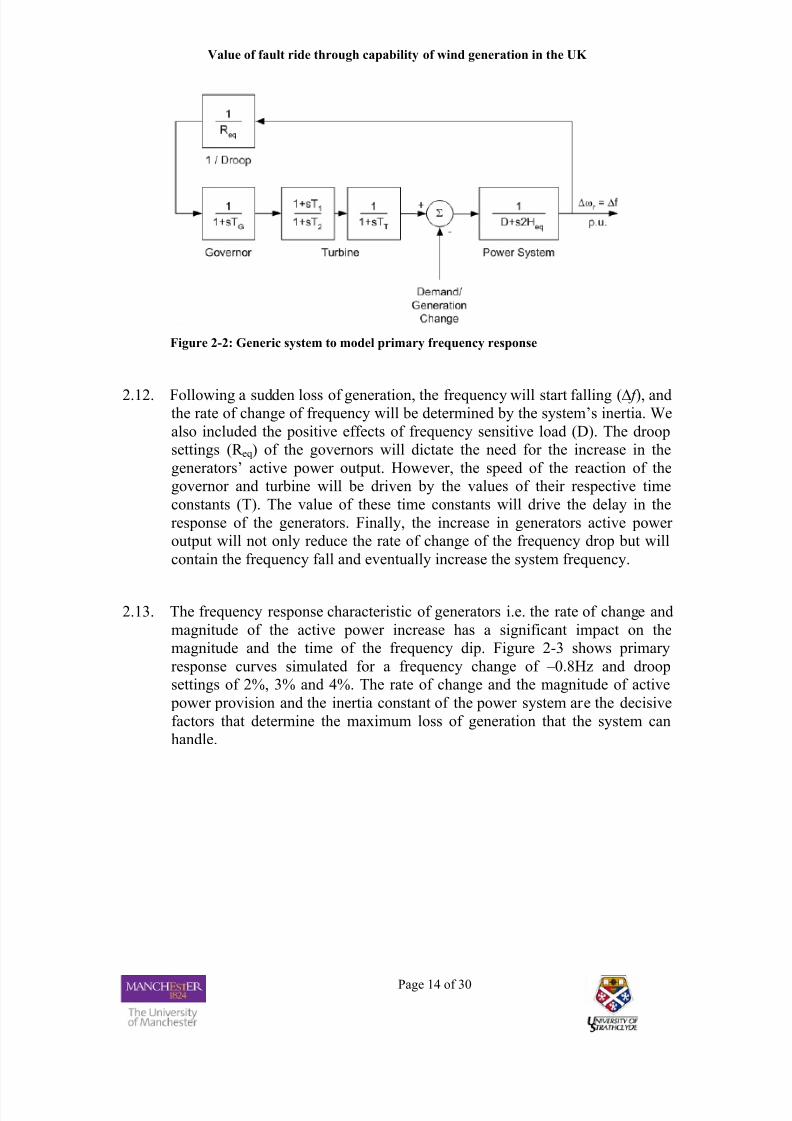
Figure 2-2: Generic system to model primary frequency response
2.12. Following a sudden loss of generation, the frequency will start falling (∆ f ), andthe rate of change of frequency will be determined by the system’s inertia. We
also included the positive effects of frequency sensitive load (D). The droop
settings (R eq) of the governors will dictate the need for the increase in the
generators’ active power output. However, the speed of the reaction of the
governor and turbine will be driven by the values of their respective time
constants (T). The value of these time constants will drive the delay in the
response of the generators. Finally, the increase in generators active power
output will not only reduce the rate of change of the frequency drop but will
contain the frequency fall and eventually increase the system frequency.
2.13. The frequency response characteristic of generators i.e. the rate of change and
magnitude of the active power increase has a significant impact on the
magnitude and the time of the frequency dip. Figure 2-3 shows primary
response curves simulated for a frequency change of –0.8Hz and droop
settings of 2%, 3% and 4%. The rate of change and the magnitude of active
power provision and the inertia constant of the power system are the decisive
factors that determine the maximum loss of generation that the system can
handle.

7/28/2019 Value of Fault Ride Through capability of Wind generation in UK.pdf
http://slidepdf.com/reader/full/value-of-fault-ride-through-capability-of-wind-generation-in-ukpdf 15/30
Value of fault ride through capability of wind generation in the UK
Page 15 of 30
Figure 2-3: Primary response characteristics for different droop settings
2.14. The parameters of the model have been chosen to reproduce frequency
profiles observed on the system.
Expected generation loss
2.15. The expected maximum loss that the system is required to withstand will
depend on the actual operating condition of the system, i.e. on the maximum
amount of conventional and wind generation that can be lost as a consequence
of faults. We therefore modelled various levels of fault ride through capability
of wind generation by introducing the wind power loss factor (WPLF) that
presents the proportion of the actual wind generation that will be disconnected
in case of a critical fault. We studied a system with 10GW of wind installed
and considered WPLF up to 30%.
2.16. Given the fluctuations in wind power output in time, the amount of generation
that would be actually lost will also vary. Hence when determining the amount
of response required, variations in wind and demand conditions need to be
taken into account. We have therefore carried out year round studies to
estimate the additional annual cost of providing an increased amount of
response necessary to accommodate 10GW of wind generation with various
WPLFs corresponding to different levels of wind generation robustness.
7/28/2019 Value of Fault Ride Through capability of Wind generation in UK.pdf
http://slidepdf.com/reader/full/value-of-fault-ride-through-capability-of-wind-generation-in-ukpdf 16/30
Value of fault ride through capability of wind generation in the UK
Page 16 of 30
2.17. Most critical conditions arise when low demand coincides with maximum
wind generation. During these conditions, a significant portion of demand will
be met by wind generation and leaving little room for conventional
generation. Consequently, the system frequency response capability will be
reduced (assuming that only conventional generation would provide this
service). Assuming that wind generation does not provide inertial effects, the
system’s inertia will be reduced, causing the frequency to fall relatively fast in
case of plant outages. On the other hand, the magnitude of potential
generation loss to be managed will be relatively high in these situations as the
amount of wind generation that can be lost would be proportional to the wind
generation output.
2.18. In the extreme, the condition can arise in which the demand for primary
response exceeds the system primary response capability. To maintain the
feasibility of system operation in such a situation, fault ride through incapable
wind generation must be curtailed to reduce the maximum credible loss and,
consequently, the primary response requirement. At the same time more
conventional generation would be brought onto the system to meet the energy
balance. This will increase the system inertia and the primary response
capability. These effects were taken into account when determining the
minimum amount of wind energy that may need to be curtailed to maintain
feasibility of system operation.
Additional system cost and CO2 emissions
2.19. It follows from the above discussion that in order to deal with the increased
generation losses driven by fault ride through incapable wind generation, the
system will need to provide for increased amounts of frequency response. In
order for conventional plant to provide reserve it must run part loaded.
Thermal units operate less efficiently when part loaded, with an efficiency
loss of between 10% and 20%. Since some of the generators will run part
loaded to provide response, some other units will need to be brought onto the
system to supply energy that was originally allocated to the plant that is now
running at reduced output. This usually means that plant with higher marginal
cost will need to run, and this is another source of cost.
2.20. The cost of provision of primary response is evaluated on the basis of reduced
efficiency of operation of conventional generators. Wind energy that may
need to be curtailed to maintain the feasibility of system operation, is valued
on the basis of the energy cost of conventional plant as this plant would need
to generate more electricity to compensate for the curtailed wind energy.

7/28/2019 Value of Fault Ride Through capability of Wind generation in UK.pdf
http://slidepdf.com/reader/full/value-of-fault-ride-through-capability-of-wind-generation-in-ukpdf 17/30
Value of fault ride through capability of wind generation in the UK
Page 17 of 30
2.21. Furthermore, operating an increased number of generators part loaded will
increase fuel cost and CO2 emissions. These were also evaluated.
2.22. Finally, sensitivity studies were carried out to consider the significance of the
inertial effect of wind turbine generators, generator droop settings (influencingrate of change and magnitude of primary response) and the penetration of
wind generation.
7/28/2019 Value of Fault Ride Through capability of Wind generation in UK.pdf
http://slidepdf.com/reader/full/value-of-fault-ride-through-capability-of-wind-generation-in-ukpdf 18/30
Value of fault ride through capability of wind generation in the UK
Page 18 of 30
3. Quantification of the value of fault ride through capability
3.1. The evaluation process, based on the developed response model, is composed
of the following steps that are carried out for each half hour of the year:
• Evaluate the net demand (ND) for the considered half hour. Net demand is
defined as the portion of gross demand that is supplied by conventional
generation.
• Evaluate the maximum credible loss (MCL) of generation for the
considered half hour.
• Given the above two parameters (ND and MCL), determine the primary
response (PR) required and if necessary enforce the system feasibility by
curtailing wind generation.
• Evaluate the cost of providing primary response, cost of wind energy
curtailed and resultant CO2 emissions, for the half hour considered.
Net demand
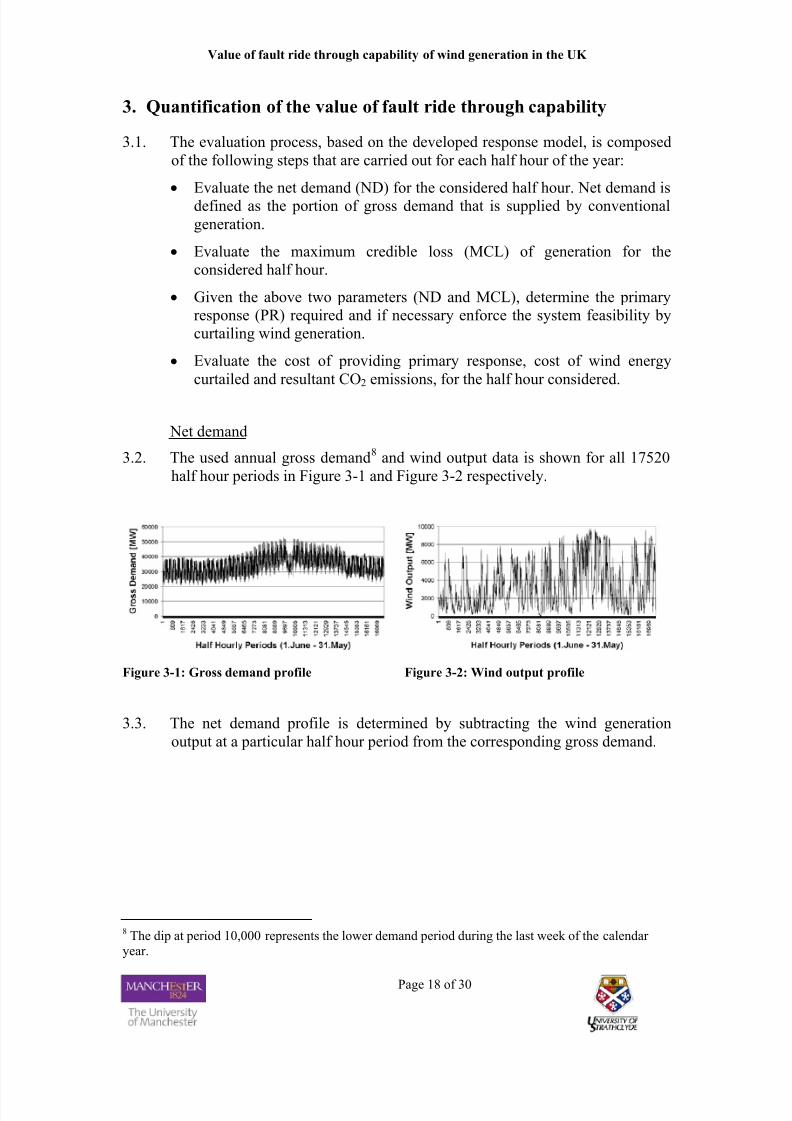
3.2. The used annual gross demand8 and wind output data is shown for all 17520
half hour periods in Figure 3-1 and Figure 3-2 respectively.
Figure 3-1: Gross demand profile Figure 3-2: Wind output profile
3.3. The net demand profile is determined by subtracting the wind generation
output at a particular half hour period from the corresponding gross demand.
8 The dip at period 10,000 represents the lower demand period during the last week of the calendar year.
7/28/2019 Value of Fault Ride Through capability of Wind generation in UK.pdf
http://slidepdf.com/reader/full/value-of-fault-ride-through-capability-of-wind-generation-in-ukpdf 19/30
Value of fault ride through capability of wind generation in the UK
Page 19 of 30
Evaluation of maximum credible loss
3.4. The maximum credible loss is modelled as the sum of the maximum expected
loss of conventional generation and a certain amount of wind generation. The
latter is modelled as the product of the actual wind output at the particular half
hour and the wind power loss factor (WPLF). The WPLF defines the
proportion of wind generation that could be lost as a result of a critical fault
on the transmission system. The WPLF will be driven by the location of wind
farms and the degree of fault ride through capability. For example, a WPLF of
10% represents a scenario in which up to 10% of the actual wind generation
output in the particular half hour could be lost due to a fault at a critical
location. A WPLF of 0% represents the situation where wind generation is a
fully compliant with the proposed grid code.
3.5. Two maximum credible loss criteria are used in this study: (i) MCL-high
assumes a 1320MW loss of conventional generation of plus the loss of wind
generation. (ii) MCL-low assumes a 1000MW loss of conventional generation
plus the loss of wind generation. However, MCL-low is considered to be
1320MW if the combined loss of conventional plant and wind generation add
up to a value lower than 1320MW.
3.6. The MCL-high will be relevant if the location of the critical fault is on the
circuit leading to Sizewell B in case a significant amount of wind power could
be lost as a result of such a fault. On the other hand, MCL-low represents a
situation with the location of the critical fault being elsewhere in the system,causing an outage of 1000MW of conventional generation plus a certain
amount of wind generation. This case is potentially relevant given the capacity
of a typical generating station of 2000MW and the circuit arrangements that
could credibly lead to a loss of 1000MW of conventional plant, following a
permanent fault on one of the outgoing circuits.
Response requirement evaluation
3.7. In practice, the flexibility of the generation system tends to vary with loading
conditions. At times of low demand, the system flexibility is generallyreduced, as less flexible plant dominates the generation mix, while during high
loading conditions more flexible plant is usually present. This would tend to
increase the difficulty and cost of maintaining sufficient response on the
system during low loading conditions.
3.8. Using the developed generic response model of the system, we derived the
system response required to meet various levels of generation losses. This was
carried out for two generation systems of different levels of flexibility: (i) high
7/28/2019 Value of Fault Ride Through capability of Wind generation in UK.pdf
http://slidepdf.com/reader/full/value-of-fault-ride-through-capability-of-wind-generation-in-ukpdf 20/30
Value of fault ride through capability of wind generation in the UK
Page 20 of 30
flexibility system (PR-high, optimistic scenario) in which all generators could
provide frequency response, and (ii) low flexibility system (PR-low) in which
only half of the total number of generators take part in providing the service.
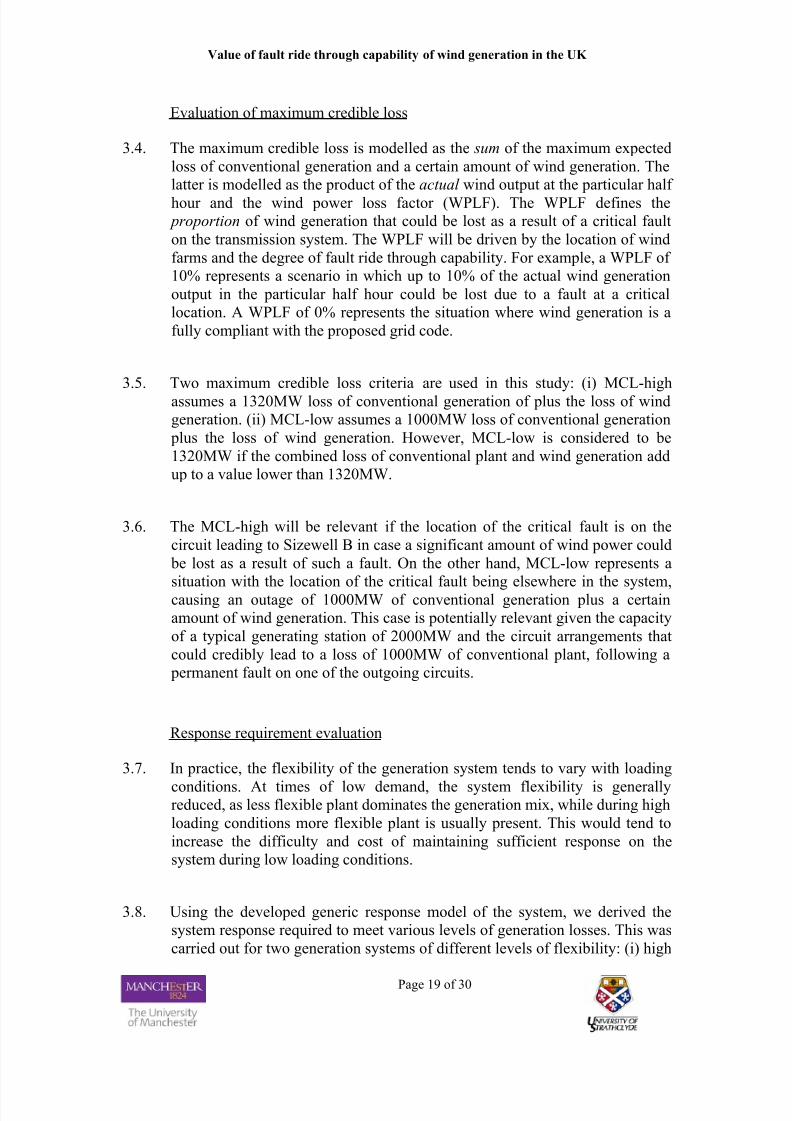
The resultant response requirement curves for generation losses of 1GW up to
4.5GW were evaluated as a function of net demand. This is shown in Figure
3-3.
Figure 3-3: Primary response requirement curves
3.9. Each curve in Figure 3-3 shows the primary response requirement for a given
loss and varying net demand. For instance, the high flexibility system (PR-
high) can withstand a loss of 3GW for net demands exceeding 15GW.
Feasible system operation cannot be maintained for lower net demands. In the
case of the low flexibility system (PR-low), the net demand must exceed
23GW so that a loss of 3GW could be withstood. The primary response
requirement to withstand a 3GW loss of generation decreases from 3.3GW to
2.4GW for a net demand increase from 15GW to 50GW respectively.
3.10. Three characteristic areas can be identified. Area A (below PR-low line)indicates feasible operation conditions for the low flexibility system. For any
given loading condition (net demand) and for a given instantaneous loss of
generation, the amount of primary response required to contain the frequency
drop caused by the loss can be determined from Figure 3-3. However, there is
a minimum net demand constraint for generation losses exceeding 1.75GW
that is indicated by the PR-line. The intersection points of the PR-low line
with the primary response curves for a given loss indicate the minimum net
demand required to be able to withstand a given loss.
C
A
B
7/28/2019 Value of Fault Ride Through capability of Wind generation in UK.pdf
http://slidepdf.com/reader/full/value-of-fault-ride-through-capability-of-wind-generation-in-ukpdf 21/30
Value of fault ride through capability of wind generation in the UK
Page 21 of 30
3.11. The intersection points of the primary response curves and the PR-low line
identify system conditions in which the maximum primary response capability
of the low flexibility system equals the primary response requirement. For the
same loss, the system operation is not feasible for lower net demands because
the primary response requirement would be increased but the primary
response capability would be reduced. There are two options to maintain
feasible operation for lower net demand conditions: (i) Reduction in
maximum critical loss. (ii) Increase in primary response capability.
3.12. For any point in area B (between PR-high and PR-low lines) the potential loss
of generation can be accommodated only in the high flexibility system.
However, this would present an infeasible region for the low flexibility
system. For instance, at a net demand level of 20GW, the low flexibility
system can withstand a loss of generation of about 2.75GW, while the high
flexibility system can handle a loss of about 4GW. As expected, the high
flexibility system can handle higher losses of generation than the low
flexibility system9.
3.13. During low net demand conditions, the system has a relatively low primary
response capability and low stored kinetic energy10. Therefore, high losses can
cause a rapid frequency drop, as can be seen from Equation 2-1. System
conditions can arise in which sufficient frequency response cannot be
provided to contain the frequency within the required limits. Such infeasible
operation conditions must be avoided. Hence, a certain amount of windgeneration from fault ride through incapable plant would need to be curtailed
to maintain the feasibility of system operation. Curtailing wind energy will
reduce the magnitude of the maximum instantaneous loss. More wind
generation will need to be curtailed in the PR-low situation than in the PR-
high situation. The reduced wind generation output will need to be
compensated by an equal increase in the output of conventional plant thus
burning more fuel increases operating cost and CO2 emissions. Using the
developed methodology we compute the minimum amount of wind generation
that needs to be curtailed in order to maintain the feasibility of system
operation and then quantify the increase in operating cost and CO2 emissions.
9 The response requirement curves produced by the generic model closely follow these given by NGT(for losses below 1320MW).10 The kinetic energy stored in the power system decreases by decreasing the amount of rotating plant.
Hence, the stored kinetic energy changes with net demand (that equals conventional generation). Themaximum frequency response that can be provided is limited by the amount of conventional generation plant connected, its capability and the operators’ willingness to provide frequency response service.The used frequency response model assumed that wind turbine generators do not provide an inertialeffect or frequency response.
7/28/2019 Value of Fault Ride Through capability of Wind generation in UK.pdf
http://slidepdf.com/reader/full/value-of-fault-ride-through-capability-of-wind-generation-in-ukpdf 22/30
Value of fault ride through capability of wind generation in the UK
Page 22 of 30
3.14. In area C (left of the PR-high line), even the high flexibility system is not
capable to withstand generation losses exceeding 2GW at all net demand
levels. The intersection points of the PR-high line with the primary response
curves for a given loss indicate the maximum loss that the system can
withstand at given net demand level.
Evaluation of cost and CO2 emissions due to increased response requirements
3.15. The evaluation of cost and CO2 performance of the system is carried out for
various WPLF, losses (MCL-high, MCL-low) and different levels of system
flexibility (PR-high, PR-low).
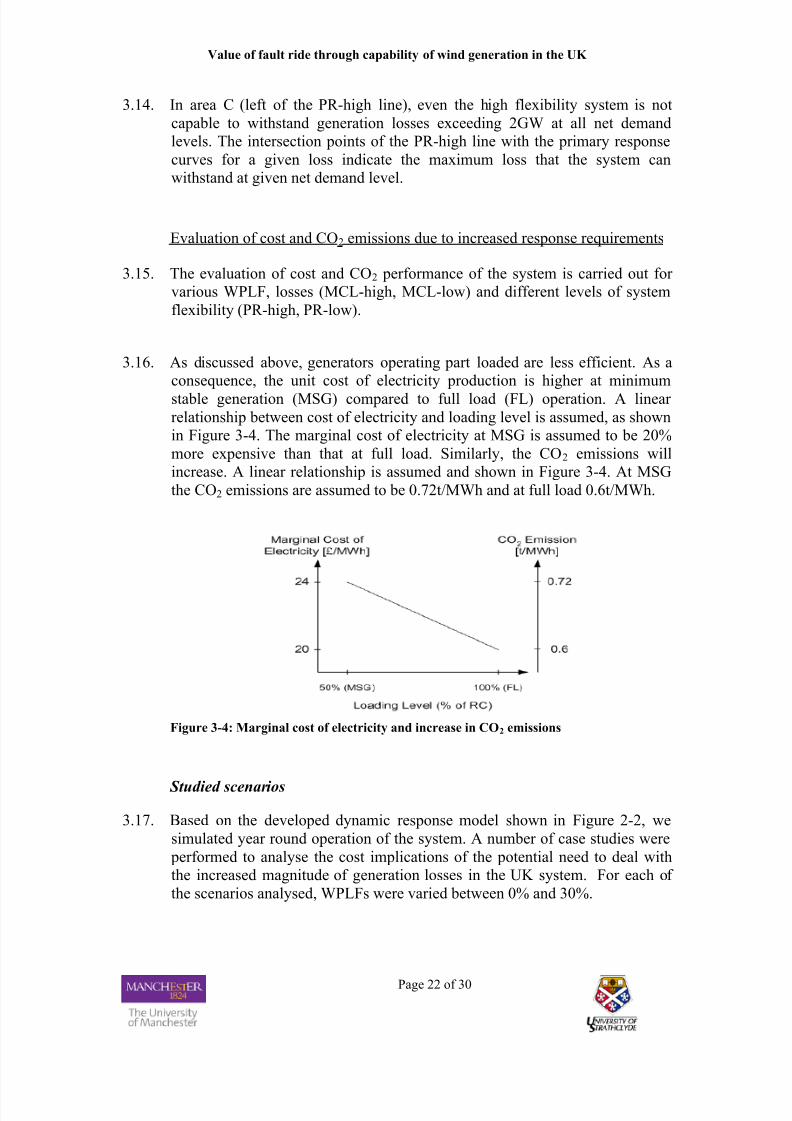
3.16. As discussed above, generators operating part loaded are less efficient. As a
consequence, the unit cost of electricity production is higher at minimum
stable generation (MSG) compared to full load (FL) operation. A linear
relationship between cost of electricity and loading level is assumed, as shown
in Figure 3-4. The marginal cost of electricity at MSG is assumed to be 20%
more expensive than that at full load. Similarly, the CO2 emissions will
increase. A linear relationship is assumed and shown in Figure 3-4. At MSG
the CO2 emissions are assumed to be 0.72t/MWh and at full load 0.6t/MWh.
Figure 3-4: Marginal cost of electricity and increase in CO2 emissions
Studied scenarios
3.17. Based on the developed dynamic response model shown in Figure 2-2, we
simulated year round operation of the system. A number of case studies were
performed to analyse the cost implications of the potential need to deal with
the increased magnitude of generation losses in the UK system. For each of
the scenarios analysed, WPLFs were varied between 0% and 30%.

7/28/2019 Value of Fault Ride Through capability of Wind generation in UK.pdf
http://slidepdf.com/reader/full/value-of-fault-ride-through-capability-of-wind-generation-in-ukpdf 23/30
Value of fault ride through capability of wind generation in the UK
Page 23 of 30
3.18. The resultant additional annual primary response cost11 and the total annual
wind energy curtailment are given in Table 3-1 and Table 3-2 respectively.
From Table 3-1, we observe that the additional annual response costs increase
with increasing WPLF. Clearly, the ability of wind generators to withstand
faults is a major driver of the additional response cost.
Scenario: MCL-high MCL-low
WPLF: PR-high PR-low PR-high PR-low Unit
30% 140.5 137.0 106.1 104.6 m£ p.a.
20% 94.4 94.3 63.7 63.7 m£ p.a.
10% 45.7 45.7 24.7 24.7 m£ p.a.
5% 21.4 21.4 14.3 14.3 m£ p.a.
0% 0.0 0.0 0.0 0.0 m£ p.a.
Table 3-1: Additional annual primary response cost
3.19. From Table 3-1, it can be seen that the additional annual primary response costis higher in the MCL-high case than in the MCL-low case. This indicates that
the magnitude of the critical loss is a primary cost driver, as expected. On the
other hand, the importance of the flexibility of the generation system, is less
significant. Clearly, the additional cost does not vary significantly with the
amount of generation that is available (capable) of providing response (PR-
high and PR-low cases).
3.20. The amount of wind generation curtailed in the course of one year is presented
in Table 3-2. The amount of wind generation that needs to be curtailed to
maintain feasibility of system operation is higher for MCL-high cases. In particular, for the PR-low case the curtailment can reach almost 0.9TWh,
which is equivalent to about 3% of the annual wind energy production. No
curtailment is necessary for low WPLFs (more robust wind generation plant).
Scenario: MCL-high MCL-low
WPLF: PR-high PR-low PR-high PR-low Unit
30% 6 850 879 170 1 715 362 160 MWh p.a.
20% 0 59 225 0 9 480 MWh p.a.
< 10% 0 0 0 0 MWh p.a.
Table 3-2: Wind generation curtailed
3.21. It can be observed from Table 3-1 that in the scenario MCL-high, PR-high,
WPLF of 30%, the value of the additional primary response cost is £140.5m,
while for PR-low, this amounts to £137m per annum12. This difference
11Using our model we estimated the base level annual cost of response to be in order of £65m per year
(for MCL of 1320MW).12 Note also that for lower values of WPLF there is no difference in cost between PR-high and PR-low.

7/28/2019 Value of Fault Ride Through capability of Wind generation in UK.pdf
http://slidepdf.com/reader/full/value-of-fault-ride-through-capability-of-wind-generation-in-ukpdf 24/30
Value of fault ride through capability of wind generation in the UK
Page 24 of 30
corresponds to operating conditions that fall in the area B (Figure 3-3).
Clearly, in the PR-high case more primary response is available and is used in
conditions of low demand and high wind output. In the PR-low case less
primary response is available and wind needs to be curtailed. Although the
response cost is higher in PR-high case, the amount of wind that would need
to be curtailed would be significantly less, as shown in Table 3-2.
3.22. Conventional generation will substitute for the curtailed wind energy. The
additional energy cost due to wind generation curtailment is costed at
20£/MWh.
Scenario: MCL-high MCL-low
WPLF: PR-high PR-low PR-high PR-low Unit
30% 0.14 17.6 0.03 7.2 m£ p.a.
20% 0 1.2 0 0.2 m£ p.a.
< 10% 0 0 0 0 m£ p.a.
Table 3-3: Additional energy cost due to wind generation curtailment
3.23. The CO2 emissions due to additional primary response provision and the
substitution of conventional generation for curtailed wind energy is shown in
Table 3-4 and Table 3-5 respectively. For comparison, the annual CO2
emissions associated with operation of a 500MW generator unit is expected to
be in the order of 2.2Mt/annum13.
Scenario: MCL-high MCL-low
WPLF: PR-high PR-low PR-high PR-low Unit
30% 4.2 4.1 3.1 3.1 mill t
20% 2.8 2.8 1.9 1.9 mill t
10% 1.3 1.3 0.7 0.7 mill t
5% 0.6 0.6 0.4 0.4 mill t
Table 3-4: Additional CO2 emissions due to additional primary response provision
Scenario: MCL-high MCL-low
WPLF: PR-high PR-low PR-high PR-low Unit
30% 0.0 0.5 0.0 0.2 mill t
<20% 0.0 0.0 0.0 0.0 mill t
Table 3-5: Additional CO2 emissions due to wind energy curtailment
3.24. The total value of the additional system cost (i.e. the annual cost of primary
response provision plus annual cost of wind energy curtailed) and the
13 This would be an average value of annual CO2 emitted by coal and gas fired plant.

7/28/2019 Value of Fault Ride Through capability of Wind generation in UK.pdf
http://slidepdf.com/reader/full/value-of-fault-ride-through-capability-of-wind-generation-in-ukpdf 25/30
Value of fault ride through capability of wind generation in the UK
Page 25 of 30
corresponding capitalised value (obtained by using conventional net present
value calculation) are presented in Table 3-6 a and b respectively.
3.25. For this purpose we used a discount rate of 7% and duration of 20 years and a
total installed wind power capacity of 10GW. The capitalised values of theadditional primary response cost in £/kW are given in Table 3-6 b. The
capitalised value of the total cost varies from ca 15£/kW (MCL-low,
WPLF5%) up to 163.8£/kW (MCL-high, WPLF30%).
Scenario: MCL-high MCL-low
WPLF: PR-high PR-low PR-high PR-low Unit
30% 140.6 154.6 106.1 111.8 m£ p.a.
20% 94.4 95.5 63.7 63.9 m£ p.a.
10% 45.7 45.7 24.7 24.7 m£ p.a.
5% 21.4 21.4 14.3 14.3 m£ p.a.
0% 0.0 0.0 0.0 0.0 m£ p.a.
(a) Annual cost
Scenario: MCL-high MCL-low
WPLF: PR-high PR-low PR-high PR-low Unit
30% 149.0 163.8 112.4 118.5 £/kW
20% 100.0 101.2 67.5 67.7 £/kW
10% 48.4 48.4 26.2 26.2 £/kW
5% 22.7 22.7 15.1 15.1 £/kW
0% 0.0 0.0 0.0 0.0 £/kW
(b) Capitalised cost
Table 3-6: Additional cost of fault ride through capability
3.26. The capitalised additional response costs given in Table 3-6 b correspond to
the value of fault ride through capability. In other words, the additional
investment in improving the fault ride through capability would be
economical provided the cost of equipping wind turbine generators to enable
fault ride through is less than the value given in the table.
3.27. The results of a survey presented in the Grid Code consultation paper [NGC,
SHETL, SPT, 2004] suggest that the cost of equipment associated with
providing fault ride through capability is in the order of 1% up to 3% of thewind turbine cost. This indicates that the cost of providing fault ride through
capability is lower than the associated value quantified in this study,
particularly for high WPLFs. This suggests that it would be cost efficient to
invest in equipment and solutions necessary to enable wind turbine generators
to ride through faults. However, for low WPLF the cost seems to be similar to
the value of fault ride through capability.
7/28/2019 Value of Fault Ride Through capability of Wind generation in UK.pdf
http://slidepdf.com/reader/full/value-of-fault-ride-through-capability-of-wind-generation-in-ukpdf 26/30
Value of fault ride through capability of wind generation in the UK
Page 26 of 30
4. Sensitivity analysis
4.1. In the context of the value of fault ride through capability investigated in this
study, there are a number of factors that can influence technical and economic
performance of the system with significant penetration of wind power. These
include the amount of wind capacity installed, dynamic frequencycharacteristics of conventional generators and the ability of wind generation to
provide inertial effects.
Total installed wind generation capacity of 15GW
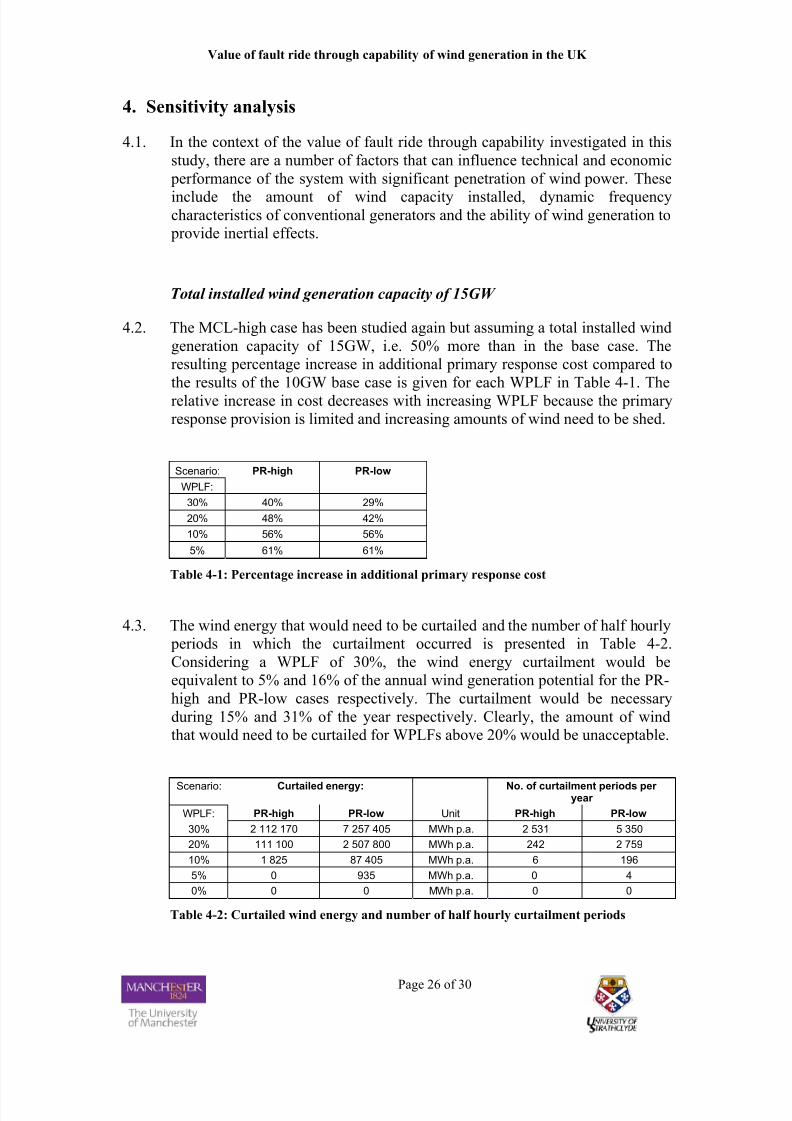
4.2. The MCL-high case has been studied again but assuming a total installed wind
generation capacity of 15GW, i.e. 50% more than in the base case. The
resulting percentage increase in additional primary response cost compared to
the results of the 10GW base case is given for each WPLF in Table 4-1. The
relative increase in cost decreases with increasing WPLF because the primary
response provision is limited and increasing amounts of wind need to be shed.
Scenario: PR-high PR-low
WPLF:
30% 40% 29%
20% 48% 42%
10% 56% 56%
5% 61% 61%
Table 4-1: Percentage increase in additional primary response cost
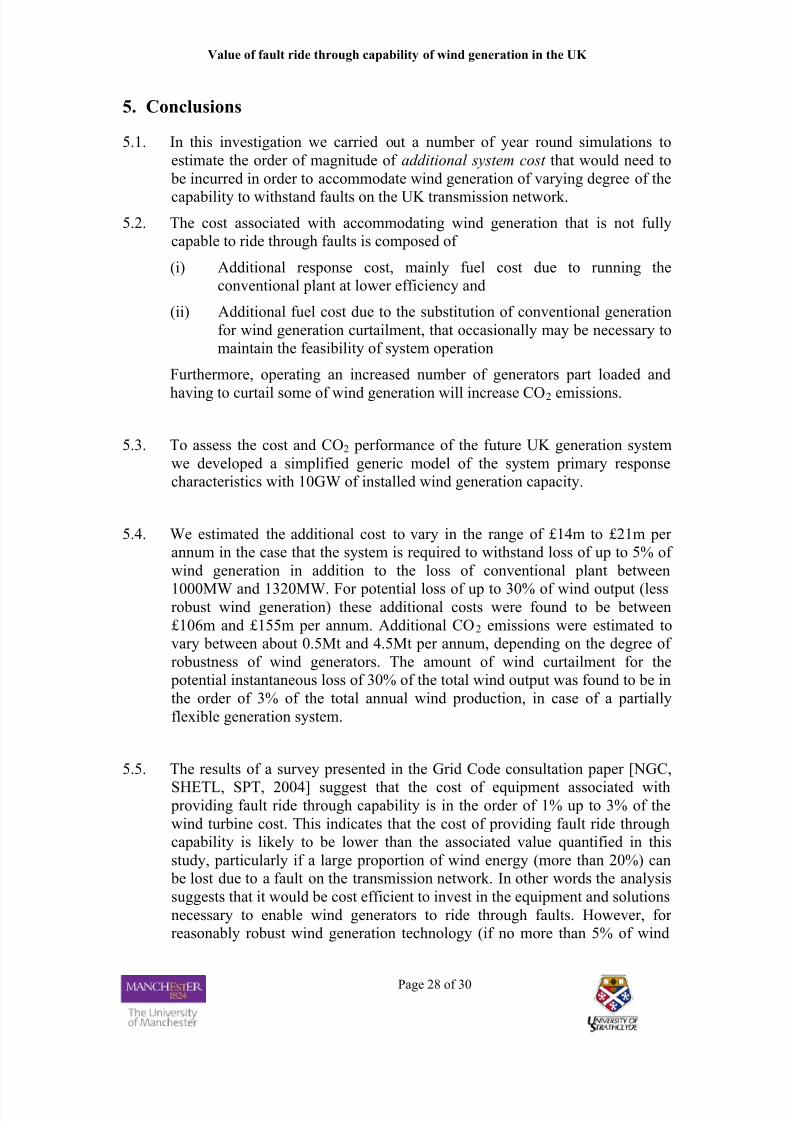
4.3. The wind energy that would need to be curtailed and the number of half hourly
periods in which the curtailment occurred is presented in Table 4-2.
Considering a WPLF of 30%, the wind energy curtailment would be
equivalent to 5% and 16% of the annual wind generation potential for the PR-
high and PR-low cases respectively. The curtailment would be necessary
during 15% and 31% of the year respectively. Clearly, the amount of wind
that would need to be curtailed for WPLFs above 20% would be unacceptable.
Scenario: Curtailed energy: No. of curtailment periods per year
WPLF: PR-high PR-low Unit PR-high PR-low
30% 2 112 170 7 257 405 MWh p.a. 2 531 5 350
20% 111 100 2 507 800 MWh p.a. 242 2 759
10% 1 825 87 405 MWh p.a. 6 196
5% 0 935 MWh p.a. 0 4
0% 0 0 MWh p.a. 0 0
Table 4-2: Curtailed wind energy and number of half hourly curtailment periods

7/28/2019 Value of Fault Ride Through capability of Wind generation in UK.pdf
http://slidepdf.com/reader/full/value-of-fault-ride-through-capability-of-wind-generation-in-ukpdf 27/30
Value of fault ride through capability of wind generation in the UK
Page 27 of 30
Governor droop setting 2%
4.4. The previous results considered that all primary response providing generators
have a droop setting of R = 4%. However, from Figure 2-3 it can be seen that
the droop setting has an impact on the primary response characteristic. The
case study corresponding to MCL-high and PR-high was repeated but with agovernor droop of 2%. The 50% lower droop setting resulted in about 27%
lower additional response costs. This indicates that lower droop settings and
the use of plant with faster response characteristics have the potential to
reduce the additional response cost.
Inertial effect of wind generation
4.5. Previous case studies were based on primary response requirement curves
shown in Figure 3-3, which have ignored any inertial effect that DFIG wind
generation could produce. Future developments, for instance the modificationof the DFIG wind turbine control, could enable wind generators to contribute
significantly to system inertia. Given the wide speed range of DFIGs, we
investigated the system benefit with a high inertia constant of 12s assumed for
wind generators. The increased system inertia decreases the gradient of the
frequency change and the primary response requirement. The identified
potential to reduce the additional primary response cost was in the range of
10% up to 30% of the corresponding base case cost. Also, the need to shed
wind decreased. A possible modification of DFIG wind turbine control to
enable inertial effect to be produced is proposed in [Ekanayake et al., 2003].
This work suggests that the cost of implementing this effect would be
negligible.
4.6. It should be noted however, that the proposed Grid Code does not impose any
requirements regarding plant inertia. Furthermore, it is not clear if wind
generators would be incentivised to provide inertial effects and what the level
of compensation would be.
4.7. It is also important to note that the secondary response requirements could not
be influenced by manipulating system inertia.
7/28/2019 Value of Fault Ride Through capability of Wind generation in UK.pdf
http://slidepdf.com/reader/full/value-of-fault-ride-through-capability-of-wind-generation-in-ukpdf 28/30
Value of fault ride through capability of wind generation in the UK
Page 28 of 30
5. Conclusions
5.1. In this investigation we carried out a number of year round simulations to
estimate the order of magnitude of additional system cost that would need to
be incurred in order to accommodate wind generation of varying degree of the
capability to withstand faults on the UK transmission network.
5.2. The cost associated with accommodating wind generation that is not fully
capable to ride through faults is composed of
(i) Additional response cost, mainly fuel cost due to running the
conventional plant at lower efficiency and
(ii) Additional fuel cost due to the substitution of conventional generation
for wind generation curtailment, that occasionally may be necessary to
maintain the feasibility of system operation
Furthermore, operating an increased number of generators part loaded and
having to curtail some of wind generation will increase CO2 emissions.
5.3. To assess the cost and CO2 performance of the future UK generation system
we developed a simplified generic model of the system primary response
characteristics with 10GW of installed wind generation capacity.
5.4. We estimated the additional cost to vary in the range of £14m to £21m per
annum in the case that the system is required to withstand loss of up to 5% of
wind generation in addition to the loss of conventional plant between
1000MW and 1320MW. For potential loss of up to 30% of wind output (lessrobust wind generation) these additional costs were found to be between
£106m and £155m per annum. Additional CO2 emissions were estimated to
vary between about 0.5Mt and 4.5Mt per annum, depending on the degree of
robustness of wind generators. The amount of wind curtailment for the
potential instantaneous loss of 30% of the total wind output was found to be in
the order of 3% of the total annual wind production, in case of a partially
flexible generation system.
5.5. The results of a survey presented in the Grid Code consultation paper [NGC,
SHETL, SPT, 2004] suggest that the cost of equipment associated with providing fault ride through capability is in the order of 1% up to 3% of the
wind turbine cost. This indicates that the cost of providing fault ride through
capability is likely to be lower than the associated value quantified in this
study, particularly if a large proportion of wind energy (more than 20%) can
be lost due to a fault on the transmission network. In other words the analysis
suggests that it would be cost efficient to invest in the equipment and solutions
necessary to enable wind generators to ride through faults. However, for
reasonably robust wind generation technology (if no more than 5% of wind
7/28/2019 Value of Fault Ride Through capability of Wind generation in UK.pdf
http://slidepdf.com/reader/full/value-of-fault-ride-through-capability-of-wind-generation-in-ukpdf 29/30
Value of fault ride through capability of wind generation in the UK
Page 29 of 30
could be lost after a critical fault on the network) the additional system cost
seems to be similar to the cost of developing wind turbine generators with a
full fault ride through capability.
5.6. If however more wind generation is to be installed with relatively lowrobustness (if 20% or more of wind output can be lost due to a critical fault on
the transmission network) the overall system cost increase considerably, and
enforcing Grid Code requirements would be clearly economically efficient.
We have quantified these costs for a system with 10GW and 15GW of
installed wind generation capacity.
5.7. Finally, the benefit of wind generation providing significant inertial effects
was estimated. Across the various cases considered, it was found that the
primary response cost could be reduced from 10% to 30% of the
corresponding base case cost. This is clearly significant and this questionshould be investigated further. It should be noted however that the proposed
Grid Code does not impose any requirements regarding plant inertia and that
there is no incentive for its provision.
5.8. Overall, the work carried out clearly demonstrates that, if a significant amount
of wind generation with relatively low robustness is to be installed (with more
than 10% of wind generation output contributing to the maximum credible
loss), this would lead to a very considerable increase in system costs. These
additional costs would be significantly higher than the expected cost of
engineering necessary to provide fault ride through capability. The results of the studies performed suggest that requiring sufficient fault ride through
capability for large wind farms would be economically efficient.
5.9. On the other hand, for connecting wind generation with relatively high
robustness (with less than 5% of wind generation output contributing to the
maximum credible loss) the increase in system cost was found to be in the
same order of magnitude as the expenditure required to enable fault ride
through capability. However, in order to establish the implications of this
more precisely, further studies would be required with actual locations that
may need to be restricted and sizes of wind farms to be considered, including potential consideration of inertial effects. Furthermore, it would be appropriate
to consider the technical and commercial potential for demand side to provide
increased volumes of response services.
7/28/2019 Value of Fault Ride Through capability of Wind generation in UK.pdf
http://slidepdf.com/reader/full/value-of-fault-ride-through-capability-of-wind-generation-in-ukpdf 30/30
Value of fault ride through capability of wind generation in the UK
Page 30 of 30
6. References
[Anderson, 1990] A low-order system frequency response model, Anderson, P.M.;
Mirheydar, M.; Power Systems, IEEE Transactions on Power Systems, Volume:
5, Issue: 3, Aug. 1990, Pages: 720 - 729
[Ekanayake et al., 2003], Ekanayake, J, Holdsworth, L and Jenkins, N. Control of
DFIG wind turbines. Power Engineer, vol. 17, no.1, 2003, pp. 28 – 32.
[Erinmez, 1999] NGC experience with frequency control in England and Wales-
provision of frequency response by generators, Erinmez, I.A.; Bickers, D.O.; Wood,
G.F.; Hung, W.W.; Power Engineering Society 1999 Winter Meeting, IEEE, Volume:
1, 31 Jan.-4 Feb. 1999, pp: 590 - 596 vol.1
[Johnson, 1998] Technical requirement and despatch of frequency response power
reserve services, Johnson, P.; IEE Colloquium on Economic Provision Of A
Frequency Responsive Power Reserve Service (98/190) , 5 Feb. 1998, Pages:1/1 – 1/4
[Kundur, 1994] Control of Active Power and Frequency Control, Chapter 11, Power
System Stability and Control, Prabha Kundur, McGraw Hill, ISBN 0-07-035958-X
[NGC, 2001] Response Requirements, Response Prices & Curves, The National Grid
company plc, Market Development: March 2001, download: 24.02.2004,
http://www.nationalgrid.com/uk/indinfo/balancing/pdfs/prices.pdf
[NGC, 2004] National Grid, Grid Code Consultation Document H/04, Grid Code
Changes to Incorporate New Generation Technologies and DC Inter-connectors
(Generic Provisions), 23.06.2004
[NGC GC, 2004] National Grid, Grid Code, Issue 2 - Revision 15 - 22nd March 2004,
http://www.nationalgrid.com/uk/indinfo/grid_code/mn_current.html
[NGC, SHETL, SPT, 2004] National Grid Company plc, Scottish Hydro-Electric
Transmission Ltd, Sp Transmission Ltd, Background to proposed changes to England
& Wales and Scottish Grid Codes Connection Conditions to Incorporate Non-
synchronous Generation Technologies, Supporting Paper for: NGC Consultation H/04
and SHETL & SPT consultation SA/2004, 23 June 2004
[Tyndall, 2003] Integrating Renewables and CHP into the UK Electricity System,
Tyndall Centre for Climate Change Research Project TC/IT 1.30, An Investigation of
the Impact of Renewables and CHP on the GB Central Generating System, X. Wu, N.
Jenkins, G. Strbac, The Manchester Centre for electrical Energy, UMIST, 2003
Notes from discussions with Dr. N Tleis and Dr. L Dale from NGT.