Embed Size (px)
Citation preview

OFFICIAL
Value for money metrics and reporting 2019
Annex to 2019 Global accounts
January 2020

Value for money metrics and reporting 2019 Annex to 2019 Global Accounts
1
OFFICIAL
Contents
1. Executive summary ........................................................................ 2
2. Introduction ..................................................................................... 5
3. Providers’ reporting in the 2019 accounts – key themes ............... 7
4. Regulatory approach .................................................................... 12
5. Value for Money performance – Sector analysis ......................... 13
Key themes from analysis ............................................................. 14
6. Sub-sector analysis ...................................................................... 21
Providers of supported housing and housing for older people ...... 24
London-based providers ............................................................... 24
Large scale voluntary transfers less than 12 years old ................. 25
Size of providers ........................................................................... 26
7. Annex A: Summary of Value for Money metrics and methodology
...................................................................................................... 28
Value for Money metrics and reporting 2019 Annex to 2019 Global Accounts
2
OFFICIAL
1. Executive summary
1.1 The Value for Money (VfM) Standard (the Standard) seeks to ensure that
boards of registered providers are optimising use of their assets and their
resources and that they can demonstrate to stakeholders their approach to
achieving and improving value for money in the delivery of their objectives. A
key aim of the Standard is to support improved effectiveness and efficiency
across the sector through enhanced transparency and accountability.
1.2 The regulator has defined a suite of standard metrics in the VfM metrics
technical note and publishes this information annually so that boards and
providers’ stakeholders can assess performance on these metrics and see
how individual providers compare to other organisations.
1.3 The analysis for 2019 has shown the following at a sector level:
• Performance has been broadly stable over the last three years.
• Operating efficiency indicators fell slightly. The overall operating margin and
the Return on capital employed (ROCE) fell by 5.6% and 0.6% respectively.
Meanwhile the Headline social housing cost (HSHC), has increased by
12.4% to £3,690 per unit (median) since 2017. The falling margins largely
reflect increasing reinvestment in existing stock across the country, and
lower receipts from first tranche sales in London and the South East,
combined with the ongoing rent reductions.
• There has been an increase in reinvestment in existing stock between 2017
and 2019, with providers across the cost distribution increasing their capital
expenditure.
• The average rate of new housing supply is consistent at around 1.5% of
existing stock, with some notable variation by size, region and transfer
status.
• The analysis shows variations in performance reported by different types of
registered providers. Particularly among smaller providers, these differences
are increased by the characteristics of specialist care and support providers.

Value for money metrics and reporting 2019 Annex to 2019 Global Accounts
3
OFFICIAL
1.4 As in 2018, the quality of reporting, both on the metrics and the extent to
which it met the Standard’s other requirements was mixed. The best reports
presented a clear set of strategic objectives and suitable aligned, measurable
targets. They reported historic performance against these targets and were
honest about the reasons where targets were not achieved. Future targets
and plans for achieving them were set out clearly, enabling understanding of
what the provider was intending to achieve and how it would know if it had
done it. Some included information enabling the reader to understand how
investment and maintenance decisions were taken.
1.5 Weaker reporting included features such as:
• vague or generic objectives which did not clearly relate to the provider’s
business plan or activities
• no targets, or targets that did not relate to the objectives
• no historic or intended future performance information, preventing
understanding of whether progress was being made
• limited or non-specific information on investment plans and decision-making
• a lack of objectives and targets relating to key aspects of a social housing
provider
• ignoring or failing to explain areas where performance did not meet target,
and how performance would be improved
• no or unsuitable benchmarking, and adjustment of measures to create
inconsistency.
1.6 In addition, we also identified cases where providers had adjusted information
from year to year, for example by reclassifying homes between categories or
adjusting cost allocations. If these are not supported by adequate explanation,
they create a suspicion of manipulation to create “better” results. By masking
year-on-year trends such adjustments can make it more difficult for both
internal and external stakeholders to achieve a realistic view of a provider’s
performance and thereby undermine efforts to improve it.

Value for Money metrics and reporting 2019 Annex to 2019 Global Accounts
4
OFFICIAL
1.7 The regulator adopts a co-regulatory approach. In the value for money context
this means that it seeks assurance from providers as to how they are meeting
the requirements of the Standard in terms of decision making and strategic
approach. Reporting can provide valuable additional assurance of how
effective this is in practice, as well as making the sector more transparent and
accountable to its tenants and other stakeholders.
Value for money metrics and reporting 2019 Annex to 2019 Global Accounts
5
OFFICIAL
2. Introduction
2.1 Registered providers are currently facing multiple competing pressures on
their resources – ensuring that tenants are safe, and homes are of a suitable
quality, increasing the supply of affordable homes, meeting more demanding
environmental standards. In this context, value for money is not a nice-to-
have or an add-on. It is fundamental to ensuring that scarce resources are
used efficiently and effectively, decisions are made on a sound basis, and
stakeholders understand how those decisions are made.
2.2 The regulator’s revised Value for Money Standard and supporting Code of
Practice1 were introduced in 2018. The purpose of the Standard is to
encourage providers to optimise the use of their assets and resources and
improve the efficiency, economy and effectiveness with which they work
towards their strategic objectives. The Standard does this by increasing the
transparency and accountability of providers.
2.3 Providers who are meeting the Standard will set clear strategic objectives
which relate to their business plan; have a clear approach to achieving value
for money in working towards those objectives; and set and monitor progress
against measurable targets for the objectives. Providers are independent
organisations and the regulator does not seek to influence what their strategic
objectives should be. However, the regulator does expect that providers
should be able to define precisely what they are seeking to achieve and to
objectively demonstrate whether they are achieving these objectives.
2.4 Providers are required to report publicly on historic performance against their
targets and plans for the future – including areas where performance has not
been up to expectations. In addition, the Standard requires providers to report
performance on a defined suite of metrics defined by the regulator against a
suitable peer group, to enable providers and stakeholders to compare
providers on a consistent basis. These metrics, and their calculation, are
summarised in Annex A.
1 https://www.gov.uk/guidance/regulatory-standards
Value for Money metrics and reporting 2019 Annex to 2019 Global Accounts
6
OFFICIAL
2.6 The reporting expectations in the Standard are an opportunity for providers to
demonstrate how they are delivering value for money in their activities. This is
important for the provider, the wider sector and external stakeholders,
including tenants, as it shows the provider’s commitment to making optimal
use of its assets and resources – including those subsidised by the taxpayer.
The regulator does not have a set format or right answer for this reporting and
would encourage providers to use whichever format would best aid
transparency in future. As long as the report captures all relevant
requirements – including explaining how performance has fallen short -
providers should not feel obliged to follow any one reporting model.
2.7 Similarly, the regulator does not have required benchmarks or targets for the
standard metrics. Some of them work against each other, and no provider is
likely to be in the “best” quartile on all measures. The expectation is that
providers will engage with the metrics and present information which
increases transparency and understanding.
2.8 In the first year that the Standard was in force, the regulator was mainly
concerned with the calculation and reporting of the defined metrics. Since
then, we have engaged with providers on the full range of requirements in the
Standard and have reflected our findings in regulatory judgements. We have
also reviewed reporting in this year’s accounts.
2.9 The remainder of this publication presents analysis of the standard metrics
data suite and commentary on how providers addressed the other reporting
requirements of the Standard. Value for money happens inside organisations,
in their strategic approach and decision making – and in the questions that
boards and executives ask of themselves.
2.10 Section 3 considers how providers have addressed the wider reporting
requirements of the Standard, beyond the standard metrics, including
definition of strategic objectives, and the setting and measurement of
associated targets. Section 4 sets out our regulatory approach. Section 5
presents the aggregate metrics results for the whole sector, including the
quartile distributions for each metric. Section 6 looks at the metric
performance for sub-sector groups, following the explanatory factors identified
in previous analysis of cost variation in the sector.
2.11 This analysis provides valuable information for providers and stakeholders to
understand how an individual organisation’s performance compares with the
sector as a whole and potentially with similar organisations.

Value for money metrics and reporting 2019 Annex to 2019 Global Accounts
7
OFFICIAL
3. Providers’ reporting in the 2019 accounts – key themes
3.1 This was the second year in which registered providers have been required to
meet the reporting requirements of the 2018 Value for Money Standard. In the
first year, given the limited time between the new Standard coming into force
and deadlines for completion of accounts, the regulator took a proportionate
view of providers’ responses and focussed mainly on the completion of the
regulator’s defined metrics.
3.2 In 2019, providers have had well over a year to adapt to the requirements of
the new Standard, and the regulator’s expectation is that providers should be
able to meet all the Standard’s reporting requirements including the clear
articulation of strategic objectives and measurement of performance against
the provider’s own targets.
3.3 Overall the regulator’s assessment of reporting in the 2019 accounts
demonstrates that registered providers have begun to embrace the reporting
requirements of the Standard. Although this year’s reports were in general of
higher quality compared to the reports looked at previously, only a small
number of registered providers met all the reporting requirements. This
section identifies key themes and issues emerging from our review of
providers’ accounts to support effective value for money reporting in future.
3.4 The regulator has not prescribed how providers should reflect the reporting
requirements of the Standard and does not want to discourage providers from
developing innovative formats that would better aid transparency of their
performance in future accounts. As long as the report captures all relevant
requirements, providers should not feel obliged to follow any one reporting
model.
3.5 In a move away from VfM self-assessments, the regulator requires boards to
publish a brief report that would enable a range of stakeholders to assess
their organisation’s performance against the delivery of their objectives. This
includes how they have performed against their own targets and against the
regulator’s metrics and being honest where performance needs to improve.

Value for Money metrics and reporting 2019 Annex to 2019 Global Accounts
8
OFFICIAL
3.7 Reports that provided the most valuable assurance in relation to their
organisation’s performance, published their strategic objectives and aligned
them with a suite of relevant measures and targets. They also demonstrated
how their organisation performed against each measure when compared to
the previous year, the actual year target and provided forecast targets over
the shorter term – this is the importance of the golden thread concept, which
allows stakeholders to follow an organisation’s performance from one year to
the next.
3.8 Our review this year had a focus on providers’ organisational strategies and
their own targets. Some providers included considered objective measures
and targets, reported performance against them and were honest where
targets were not achieved. Reports that were less clear tended to have
generic objectives meaning it is difficult to assess which targets related to
their objectives or how the registered provider would know if they met their
objectives. For example, some providers reported their performance using the
Sector Scorecard measures, but without indicating to which, if any, of their
strategic objectives each of these measures related, or what their target level
of performance was. This lack of transparency made it difficult for
stakeholders to assess a provider’s performance against its objectives.
3.9 A key element of the Standard requires registered providers to set out their
strategy for providing homes that meet a range of needs. Some reports did
this by including an overview of a registered provider’s investment strategy
that enabled stakeholders to understand the rationale for investment
decisions. For example, some reports assessed demand in the area of
operation to explain expenditure on new supply or used stock condition data
to justify the type of remedial investment required to existing housing stock.
These were accompanied by quantified measures and targets, for example on
maintenance or major repair costs per unit or new supply of social and non-
social housing units. Other comprehensive reports aligned their strategic
approach to asset management with related targets covering for example, fire
and gas safety and Decent Homes compliance
3.10 On the other hand, some reports provided limited information on investment
plans, omitting for example the type of new units forecast, the timeframe over
which units would be delivered or whether specific development plans
supported demand in the local area. Despite a general increased focus on
reinvestment to existing stock, we noted that some registered providers
omitted measures and targets relating to their current stock.

Value for money metrics and reporting 2019 Annex to 2019 Global Accounts
9
OFFICIAL
3.11 A significant minority of reports failed to address one of the Standard’s
specific expectations; a clear appraisal of how well an organisation had
performed against its own targets. Where outputs were published, they often
did not explain whether this performance had met prior expectations or had
fallen short of target. This provides limited assurance to stakeholders that
objectives are being met or more importantly that the organisation’s
performance is being challenged by the board themselves.
3.12 Benchmarking is a vital tool that can help drive improvement in the delivery of
value for money. It can identify where changes are potentially needed, and it
can also help to improve the efficiency of the organisation. In a drive to
support comparative analysis, we have published the VfM metrics at both a
sector and at a sub-sector level in order that providers have a mechanism
with which to compare their organisation’s performance against peers with
similar characteristics.
3.13 The Value for Money metrics Technical Regression Note2, demonstrates that
there are material differences in reported performance between different
groups of providers showing the value of benchmarking with organisations
that have similar business models or operating area. Those providers who do
not undertake peer comparisons with organisations in a similar position, make
it more difficult for boards and other stakeholders to make meaningful
judgements about the performance of their organisation.
3.14 Our review of providers’ accounts showed that a limited number of providers
are adjusting measures that are widely used amongst benchmarking clubs to
compare their own performance against. In order to promote consistency, we
would encourage providers who adjust common measures to explain the
rationale for doing so. Registered providers are reminded that the value for
money measures set out by the regulator must not be adjusted and should be
reported on the precise basis set out in the technical note3.
2 https://www.gov.uk/government/publications/value-for-money-summary-and-technical-reports 3 https://www.gov.uk/government/publications/value-for-money-metrics-technical-note

Value for Money metrics and reporting 2019 Annex to 2019 Global Accounts
10
OFFICIAL
3.15 In 2018, we wrote to 34 providers who did not apply the regulator’s measures
to calculate the metrics. In addition, we also contacted providers where data
quality issues were identified when compiling the value for money data
analysis. Despite improved reporting in this area, there is evidence that some
providers continue to publish their Headline Social Housing Cost on an
inconsistent basis. Most notably, this is often due to the movement of costs
that relate to social housing activities and recognising those costs as non-
social housing. We will continue to follow up data integrity issues with
providers over the forthcoming year which can be reflected as part of a
provider’s regulatory judgement.
3.16 Registered providers are reminded that the VfM Code of Practice4 amplifies
the requirements of the Standard. Our analysis of value for money reporting
suggests that few registered providers have made use of the range of
reporting approaches that are outlined in the Code. From time to time it may
be helpful to disclose the performance of activities; for example, reporting at a
disaggregated level of the business, or where there may be measurable plans
that are relevant to a merger or possibly where registered providers are
investing in non-social housing activities. Reporting at a more granular level
can enhance stakeholders’ understanding of the impact, social or otherwise,
that an organisation has in their area of operation. Our review of several
accounts indicates that there is anecdotal evidence to suggest that some of
this detail may be reported elsewhere.
3.17 Boards have a duty to balance economic and political risks when setting their
strategic objectives to ensure the long-term viability of their organisations.
Changes in the operating environment and to the economy can impact
registered providers’ performance, which means that from time to time they
are unable to meet their desired outcomes. Some providers did explain why
targets could not be met. For example, registered providers undertaking
planned development programmes in London and the South East were
unable to meet their development targets due to a slowdown in market sales
and this has been made transparent in the accounts we reviewed.
4 https://www.gov.uk/government/publications/value-for-money-code-of-practice

Value for money metrics and reporting 2019 Annex to 2019 Global Accounts
11
OFFICIAL
3.18 Some registered providers limited their reporting on their actual performance
only and did not provide performance targets meaning it is difficult to
determine whether the organisation had met their targets. It may be
uncomfortable for boards to report on activities or services that are not
performing as well as they had intended. However, transparency on this
matter is a requirement of the standard and open reporting provides the
regulator with assurance that the board has recognised and is tackling areas
of underperformance.

Value for Money metrics and reporting 2019 Annex to 2019 Global Accounts
12
OFFICIAL
4. Regulatory approach
4.1 The regulator has always made clear that it is for boards to decide how they
run their businesses and assure themselves that they are complying with the
regulatory standards. It is important that boards should understand the range
of factors that influence performance of their own organisation.
4.2 The demands on registered providers are increasing as the expectations from
government and tenants rise. The regulator will continue to seek assurance
that providers make the best use of their resources and their assets and have
clear plans in place to make ongoing improvements to the value for money in
their organisations.
4.3 The regulator will use the value for money metrics to identify cases which may
indicate a lack of assurance on value for money performance. In such cases
we may need to engage with registered providers to seek further assurance
that the organisation is meeting the requirements of the Standard.
4.4 Registered providers must ensure that the reporting undertaken in future
accounts meets all the reporting requirements of the Standard. Where we
identify year-on-year performance reporting weaknesses, we will reflect this in
our regulatory judgements.

Value for money metrics and reporting 2019 Annex to 2019 Global Accounts
13
OFFICIAL
5. Value for Money performance – Sector analysis 5
Table 1: Summary of sector trends (2017-2019) (Providers owning / managing more than 1,000 homes)
VfM metric Reinvestment
(%)
New supply (social)
(%)6
New supply (Non-social)
(%)
Gearing (%)
EBITDA MRI
interest cover (%)
Headline social
housing CPU (£K)
Operating margin
(social) (%)
Operating margin
(overall) (%)
Return on capital
employed (ROCE) (%)
Upper quartile
2019 8.7% 2.5% 0.13% 53.9% 238% £4.69 34.6% 30.8% 4.7%
2018 8.7% 2.3% 0.07% 53.1% 263% £4.50 37.1% 34.1% 5.4%
2017 8.6% 2.2% 0.03% 54.8% 278% £4.36 39.3% 36.0% 5.6%
Median
2019 6.2% 1.5% 0.00% 43.4% 184% £3.69 29.2% 25.8% 3.8%
2018 6.0% 1.2% 0.00% 42.9% 206% £3.40 32.1% 28.9% 4.1%
2017 5.6% 1.2% 0.00% 43.4% 212% £3.29 34.7% 31.4% 4.3%
Lower quartile
2019 4.2% 0.6% 0.00% 32.6% 139% £3.18 23.1% 20.0% 3.0%
2018 3.9% 0.5% 0.00% 33.1% 154% £3.01 25.5% 22.7% 3.3%
2017 3.7% 0.4% 0.00% 33.5% 174% £2.96 28.7% 25.0% 3.5%
Weighted average
2019 6.4% 1.7% 0.31% 46.7% 153% £4.12 30.5% 25.0% 3.6%
2018 6.2% 1.5% 0.23% 45.8% 174% £3.92 32.8% 27.6% 4.0%
2017 7.3%7 1.5% 0.22% 45.8% 169% £3.78 34.3% 29.7% 4.3%
5 Upper quartiles, medians and lower quartile figures represent the range for each individual metric. There is not a single cohort of ‘upper quartile’ or ‘lower
quartile’ providers across the full range of metrics. 6 New supply (social) is a measure of the number of new social units developed or acquired in the year divided by the total number of social units (including
leasehold) owned. 7 The 2017 reinvestment (weighted average) figure is materially impacted by L&Q’s 2017 merger with East Thames, with L&Q reporting £1.2bn of properties
acquired. Removing L&Q from the 2017 dataset reduces the weighted average to 6.4%.
Value for Money metrics and reporting 2019 Annex to 2019 Global Accounts
14
Key themes from analysis
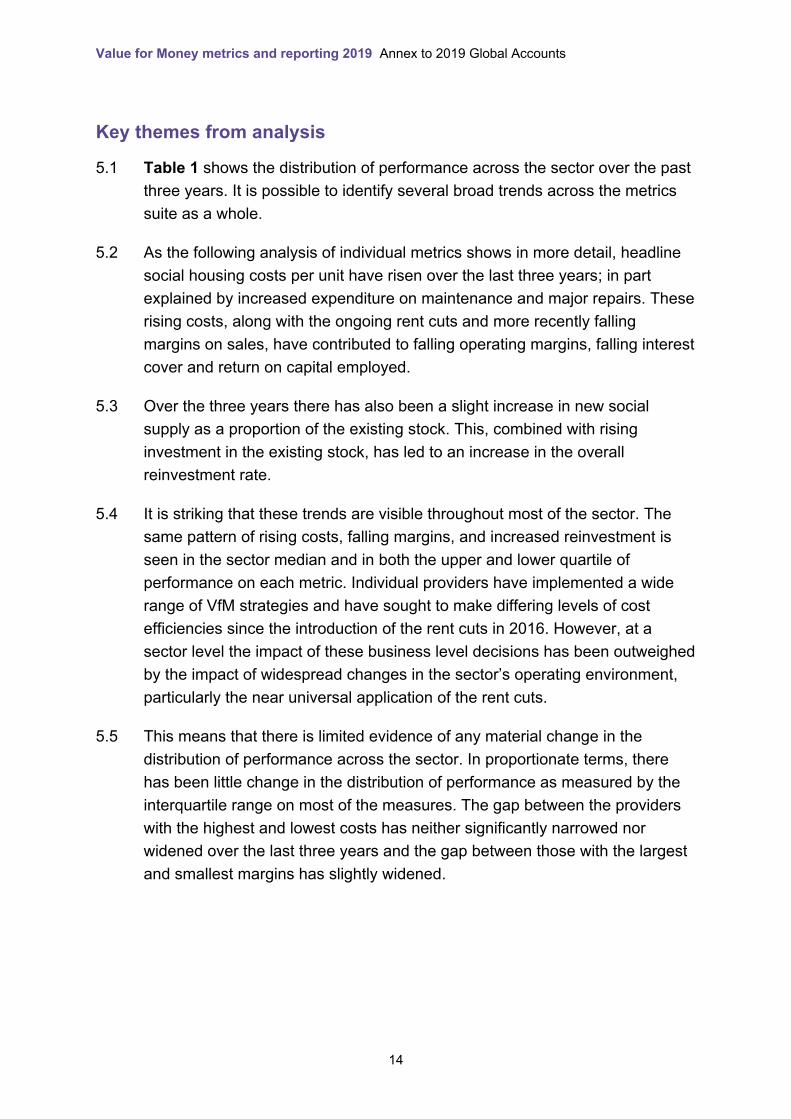
5.1 Table 1 shows the distribution of performance across the sector over the past
three years. It is possible to identify several broad trends across the metrics
suite as a whole.
5.2 As the following analysis of individual metrics shows in more detail, headline
social housing costs per unit have risen over the last three years; in part
explained by increased expenditure on maintenance and major repairs. These
rising costs, along with the ongoing rent cuts and more recently falling
margins on sales, have contributed to falling operating margins, falling interest
cover and return on capital employed.
5.3 Over the three years there has also been a slight increase in new social
supply as a proportion of the existing stock. This, combined with rising
investment in the existing stock, has led to an increase in the overall
reinvestment rate.
5.4 It is striking that these trends are visible throughout most of the sector. The
same pattern of rising costs, falling margins, and increased reinvestment is
seen in the sector median and in both the upper and lower quartile of
performance on each metric. Individual providers have implemented a wide
range of VfM strategies and have sought to make differing levels of cost
efficiencies since the introduction of the rent cuts in 2016. However, at a
sector level the impact of these business level decisions has been outweighed
by the impact of widespread changes in the sector’s operating environment,
particularly the near universal application of the rent cuts.
5.5 This means that there is limited evidence of any material change in the
distribution of performance across the sector. In proportionate terms, there
has been little change in the distribution of performance as measured by the
interquartile range on most of the measures. The gap between the providers
with the highest and lowest costs has neither significantly narrowed nor
widened over the last three years and the gap between those with the largest
and smallest margins has slightly widened.
Value for money metrics and reporting 2019 Annex to 2019 Global Accounts
15
OFFICIAL
5.6 The one exception to this picture is on reinvestment where the interquartile
range has narrowed over the past three years with reinvestment amongst the
lower quartile rising more quickly than in the upper quartile. However, across
the metrics suite there is limited evidence that the range of performance is
either narrowing or widening. The range of reported performance on the
metrics across the sector remains extremely wide.
Reinvestment and new supply
5.7 Table 1 also shows that in the three years to 2019, sector performance has
remained relatively consistent. The sector has continued to deliver a
significant number of new affordable homes for rent and market sale. The
delivery of new social homes as a percentage of total stock owned has
increased from 1.2% to 1.5% since 2017. Median reinvestment8 (which
includes both investment in the existing stock and new supply), has increased
from 5.6% to 6.2% over the same period.
5.8 There continues to be variance in new supply delivery, with the lower quartile
delivering homes equivalent to only 0.6% of their existing stock in 2019
compared to 2.5% for the upper quartile. Providers in the lower quartile tend
to generate lower operating margins, often from supported housing, and are
therefore less able to invest in new supply.
5.9 There is a minority of registered providers who deliver a modest level of new
supply (social). These tend to be registered providers with significant
supported housing or housing for older people stock and who typically have
higher costs and lower operating margins from which they can invest in new
units. Equally, large-scale voluntary transfer (LSVT) organisations, in
particular organisations that are still in their first five years after transfer, tend
to focus exclusively on investment in their existing stock to ensure they meet
their transfer commitments.
5.10 The development of new supply (social) as a proportion of existing stock
varies considerably across England. The highest levels of development are
delivered by providers based in the East of England9 and East Midlands. The
average median new supply (social) is 2.5% and 2.3% respectively.
8 Includes capitalised major repairs 9 We do not collect new supply data at a regional level; as such we have provided the data for
providers based in each region. A provider is said to be based in a singular region if over half the
stock they own is in that region. If a provider does not own over half their stock in a single region,
they are defined as a mixed provider.
Value for Money metrics and reporting 2019 Annex to 2019 Global Accounts
16
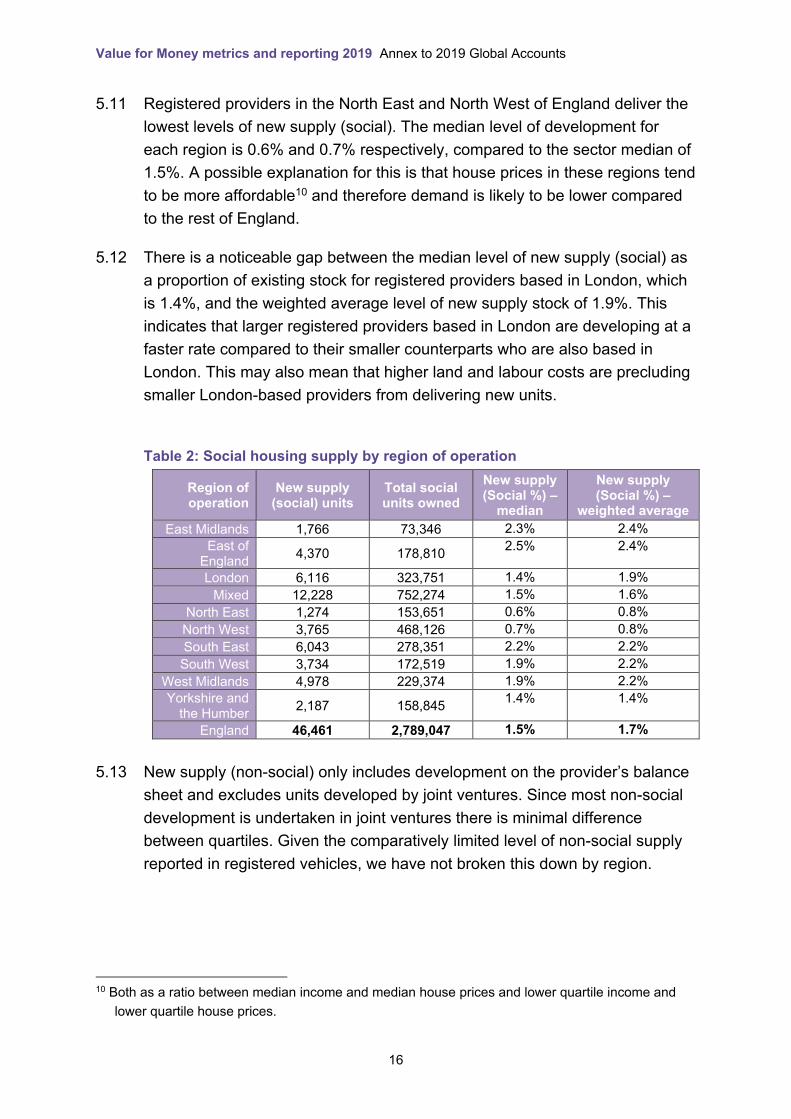
5.11 Registered providers in the North East and North West of England deliver the
lowest levels of new supply (social). The median level of development for
each region is 0.6% and 0.7% respectively, compared to the sector median of
1.5%. A possible explanation for this is that house prices in these regions tend
to be more affordable10 and therefore demand is likely to be lower compared
to the rest of England.
5.12 There is a noticeable gap between the median level of new supply (social) as
a proportion of existing stock for registered providers based in London, which
is 1.4%, and the weighted average level of new supply stock of 1.9%. This
indicates that larger registered providers based in London are developing at a
faster rate compared to their smaller counterparts who are also based in
London. This may also mean that higher land and labour costs are precluding
smaller London-based providers from delivering new units.
Table 2: Social housing supply by region of operation
Region of operation
New supply (social) units
Total social units owned
New supply (Social %) –
median
New supply (Social %) –
weighted average
East Midlands 1,766 73,346 2.3% 2.4%
East of England
4,370 178,810 2.5% 2.4%
London 6,116 323,751 1.4% 1.9%
Mixed 12,228 752,274 1.5% 1.6%
North East 1,274 153,651 0.6% 0.8%
North West 3,765 468,126 0.7% 0.8%
South East 6,043 278,351 2.2% 2.2%
South West 3,734 172,519 1.9% 2.2%
West Midlands 4,978 229,374 1.9% 2.2%
Yorkshire and the Humber
2,187 158,845 1.4% 1.4%
England 46,461 2,789,047 1.5% 1.7%
5.13 New supply (non-social) only includes development on the provider’s balance
sheet and excludes units developed by joint ventures. Since most non-social
development is undertaken in joint ventures there is minimal difference
between quartiles. Given the comparatively limited level of non-social supply
reported in registered vehicles, we have not broken this down by region.
10 Both as a ratio between median income and median house prices and lower quartile income and
lower quartile house prices.

Value for money metrics and reporting 2019 Annex to 2019 Global Accounts
17
OFFICIAL
5.14 Over the past three years the level of reinvestment in the sector has grown.
Overall, investment in development remains the largest contributor to the
reinvestment rate. However, as noted above, the level of reinvestment by the
lower quartile of providers has grown most rapidly and this metric shows a
narrowing of performance between quartiles, even though there is still a wide
gap between the levels of new supply delivered across the sector. Over the
past year increased investment in works to the existing stock has been the
main driver in year-on-year change in the reinvestment metric.
Table 3: Sector level reinvestment broken down by investment type
Sector
Reinvestment (Median)
Reinvestment (Weighted average)
Works to existing11 (Weighted average)
Development and other12
(Weighted average)
2018 6.03% 6.18% 1.16% 5.02%
2019 6.24% 6.45% 1.34% 5.11%
% Change
3.5% 4.5% 16.1% 1.8%
5.15 Table 3 shows that the weighted average sector figures for works to existing
units increased by 16.1% between 2018 and 2019. This compared to the
development and acquisition of new supply which increased by 1.8%. The
increase to works to existing housing stock accounted for 67% of the total
increase seen in the reinvestment metric (weighted average) over the same
period.
11 Includes works to existing (total housing properties) line only 12 Includes development of new properties (total housing properties), newly built properties acquired
(total housing properties), schemes completed (total housing properties) and capitalised interest
(total housing properties) lines

Value for Money metrics and reporting 2019 Annex to 2019 Global Accounts
18
Debt based metrics
5.16 Over the past three years, the weighted average EBITDA MRI interest cover
fell by 16%, as shown in
5.17 Table 1, due to increasing debt levels and the reduction in operating margin.
Despite the fall in the EBITDA MRI interest cover, overall the financial
capacity in the sector remains strong. There was consistent movement across
the distribution: median interest cover remains strong at 184% though lower
than the 212% reported in 2017. Registered providers in the lower quartile
reported interest cover of 139% while providers in the upper quartile remain
strong with an interest cover of 238% in 2019.
5.18 The gearing metric assesses how much debt a provider holds as a
percentage of their assets and highlights the degree of dependence on debt
finance; it can be restricted by registered provider’s lender’s covenants. As
shown in
5.19 Table 1, the distribution of gearing has held constant over the past two years
with the median at around 43%. Typical providers in the lower quartile include
small specialised organisations, while the most active developers and recent
stock transfers are concentrated in the upper quartile.
Headline social housing cost per unit
Table 4: Sector level headline social housing cost (HSHC) per unit by cost type
Weighted average
2019 2018 2017 18-19 % change
17-19 % change
Management £1,045 £1,016 £967 2.9% 8.2%
Service charges £626 £599 £560 4.6% 11.8%
Maintenance and major repairs £1,965 £1,828 £1,787 7.5% 10.0%
Other £481 £477 £466 0.8% 3.3%
HSHC £4,118 £3,919 £3,779 5.1% 9.0%
5.20 Table 4 shows that the sector’s cost per unit has increased by 9.0% over the
past three years. This is significantly ahead of general CPI inflation in the
economy as a whole, with the difference influenced by factors specific to the
sector. The increase has been driven by rising maintenance and major repairs
expenditure which has grown by 10.0% since 2017, with 7.5% of that increase
occurring between 2018 and 2019.

Value for money metrics and reporting 2019 Annex to 2019 Global Accounts
19
OFFICIAL
5.21 Our analysis shows that the HSHC (weighted average) has increased by £199
per unit since 2018 of which 69% (£137) relates to maintenance or major
repairs expenditure.
5.22 Management costs per unit also increased by 8.2% over the period 2017-
2019 This is likely to be influenced by upward pressure on wages.
Unemployment rates remained at 3.8% between August and October 2019,13
close to a 45-year low. This has helped support an increase in real wages.
The UK average total weekly earnings increased by 3.6% compared to 2018
(not adjusted for price inflation), and by 1.8% in real terms (after adjusting for
inflation). For those organisations with a significant number of staff at or near
the minimum wage, real costs of labour are likely to have risen by a higher
proportion following the introduction of the new Living Wage rate (which is
4.9% higher compared to 2018).
5.23 Movements in headline unit costs were concentrated in the middle of the
distribution. The median increased by £400 per unit from £3,290 in 2017 to
£3,690 per unit in 2019, while the lower quartile increased from £2,960 in
2017 to £3,180 in 2019, and the upper quartile increased from £4,360 to
£4,690 over the same period.
5.24 The scatter graph at Figure 1 shows that there remains a considerable level
of variation in the headline social housing costs across the sector. The mean14
headline social housing cost per unit is £4,120. This compares to the median
average cost per unit which is £3,690 and is denoted by the red line. The
difference between the median and the mean is driven by registered providers
with high levels of supported housing (2019 median: £8,460), housing for
older people (2019 median: £6,150) and London-based registered providers
(2019 median: £6,070).
5.25 Some of the variability in cost across the sector can be explained by
measurable provider characteristics, such as location and specialism. These
are explored further in section 2 on sub-sector analysis. However, the
regulator’s regression analysis has repeatedly shown that not all this variation
can be explained by measurable factors. Part of the unexplained variation is
likely to be due to the availability of data (for example on stock condition) but
13 Office for National Statistics – Unemployment rate (aged 16 and over, seasonally adjusted) –
December 2019 14 Weighted average meaning that cost lines are totalled for all providers in the sector and then
divided by the total social housing units owned and/or managed.

Value for Money metrics and reporting 2019 Annex to 2019 Global Accounts
20
part will be due to differences in operating efficiency between different
organisations.
Figure 1: HSHC per unit by total social stock owned and/or managed15
Efficiency-based metrics
5.26 The operating margin (overall), and the operating margin (social housing
lettings), have reduced across the distribution due to higher maintenance and
major repairs expenditure, social rent reductions and reducing sales profits.
The operating margin (social housing lettings), is higher than the operating
margin (overall), across all quartiles, as the margins on many non-social
housing activities are lower than those for the core lettings business. This
reinforces the need for clear decision-making in providers, when allocating
resources between different types of housing.
5.27 The return on capital employed assesses the degree of efficient investment of
capital resources and compares the operating surplus to total asset values.
The reduction in operating margin caused a reduction in ROCE across the
distribution, with the largest movement in the upper quartile. At a sector level,
the median ROCE fell from 4.1% in 2018 to 3.8% in 2019. The upper quartile
also fell from 5.4% in 2018 to 4.7% in 2019. This reflects the fact that there
are many London-based organisations in this quartile which have seen both
15 Red markers indicate supported housing (SH) and housing for older people (HOP) providers;
defined as providers with at least 30% SH stock or at least 30% HOP stock.

Value for money metrics and reporting 2019 Annex to 2019 Global Accounts
21
OFFICIAL
falling profits from shared ownership sales and a rise in their total asset value.
London based providers saw a 6.2% increase in asset values which is above
the sector wide increase in asset valuations of 4.7

Value for money metrics and reporting 2019 Annex to 2019 Global Accounts
21
OFFICIAL
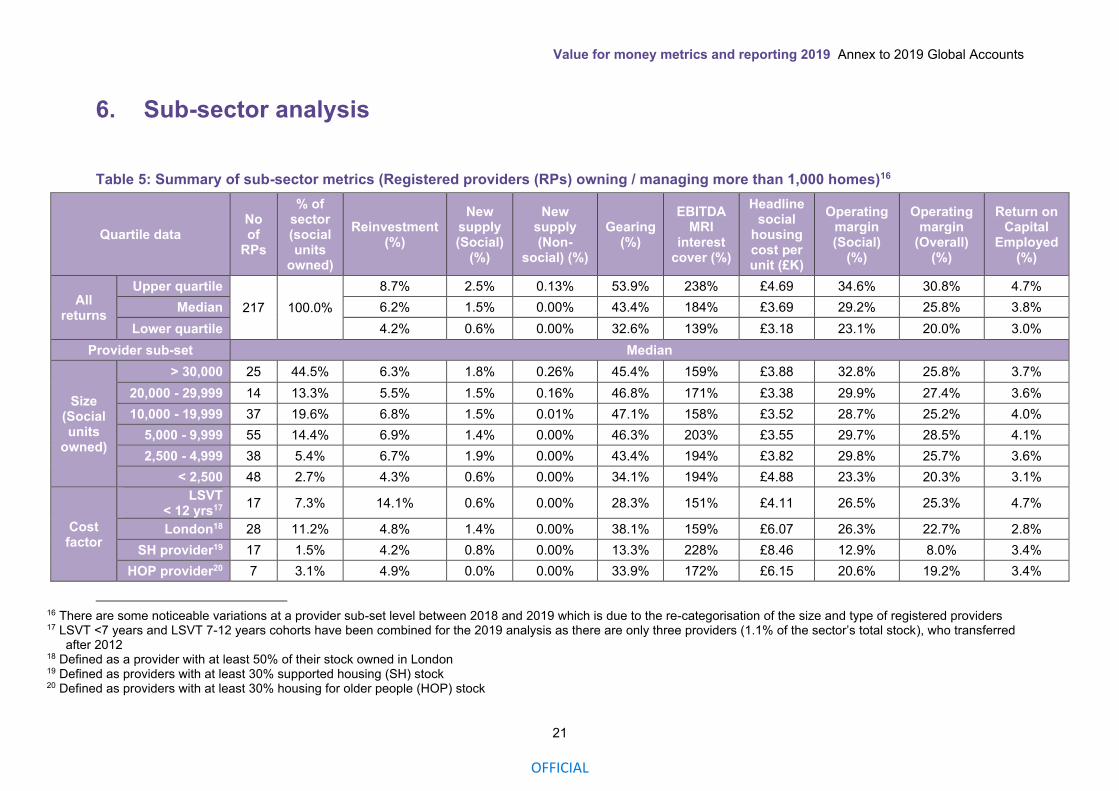
6. Sub-sector analysis
Table 5: Summary of sub-sector metrics (Registered providers (RPs) owning / managing more than 1,000 homes)16
Quartile data No of
RPs
% of sector (social units
owned)
Reinvestment (%)
New supply (Social)
(%)
New supply (Non-
social) (%)
Gearing (%)
EBITDA MRI
interest cover (%)
Headline social
housing cost per unit (£K)
Operating margin (Social)
(%)
Operating margin
(Overall) (%)
Return on Capital
Employed (%)
All returns
Upper quartile
217 100.0%
8.7% 2.5% 0.13% 53.9% 238% £4.69 34.6% 30.8% 4.7%
Median 6.2% 1.5% 0.00% 43.4% 184% £3.69 29.2% 25.8% 3.8%
Lower quartile 4.2% 0.6% 0.00% 32.6% 139% £3.18 23.1% 20.0% 3.0%
Provider sub-set Median
Size (Social units
owned)
> 30,000 25 44.5% 6.3% 1.8% 0.26% 45.4% 159% £3.88 32.8% 25.8% 3.7%
20,000 - 29,999 14 13.3% 5.5% 1.5% 0.16% 46.8% 171% £3.38 29.9% 27.4% 3.6%
10,000 - 19,999 37 19.6% 6.8% 1.5% 0.01% 47.1% 158% £3.52 28.7% 25.2% 4.0%
5,000 - 9,999 55 14.4% 6.9% 1.4% 0.00% 46.3% 203% £3.55 29.7% 28.5% 4.1%
2,500 - 4,999 38 5.4% 6.7% 1.9% 0.00% 43.4% 194% £3.82 29.8% 25.7% 3.6%
< 2,500 48 2.7% 4.3% 0.6% 0.00% 34.1% 194% £4.88 23.3% 20.3% 3.1%
Cost factor
LSVT < 12 yrs17
17 7.3% 14.1% 0.6% 0.00% 28.3% 151% £4.11 26.5% 25.3% 4.7%
London18 28 11.2% 4.8% 1.4% 0.00% 38.1% 159% £6.07 26.3% 22.7% 2.8%
SH provider19 17 1.5% 4.2% 0.8% 0.00% 13.3% 228% £8.46 12.9% 8.0% 3.4%
HOP provider20 7 3.1% 4.9% 0.0% 0.00% 33.9% 172% £6.15 20.6% 19.2% 3.4%
16 There are some noticeable variations at a provider sub-set level between 2018 and 2019 which is due to the re-categorisation of the size and type of registered providers 17 LSVT <7 years and LSVT 7-12 years cohorts have been combined for the 2019 analysis as there are only three providers (1.1% of the sector’s total stock), who transferred
after 2012 18 Defined as a provider with at least 50% of their stock owned in London 19 Defined as providers with at least 30% supported housing (SH) stock 20 Defined as providers with at least 30% housing for older people (HOP) stock

Value for Money metrics and reporting 2019 Annex to 2019 Global Accounts
22
6.1 Table 5 demonstrates that the reported performance on the VfM metrics differs
significantly according to the characteristics of the organisations. There are still
widespread variations within each of the groups identified, but there are also consistent
patterns according to the nature of each provider’s business, their geographical location
and size. Supported housing providers, organisations based in London and early years
transfer organisations all have distinctive common characteristics. The influence of size
on reported performance is more complex, but some size bands show material
divergence from sector averages.
6.2 Figures, 2, 3 and 4 below illustrate the range of performance for these different groups
for three of the metrics: reinvestment, housing supply (social) and headline social
housing cost per unit.
Figure 2: Reinvestment (medians) by cost factor and size21
21 Number in white indicates number of registered providers within the cohort. For example, there were 28
London-based providers in the 2019 dataset and 30 within the 2018 dataset.

Value for Money metrics and reporting 2019 Annex to 2019 Global Accounts
23
OFFICIAL
Figure 3: New supply (social) medians by cost factor and size
Figure 4: Headline social housing cost per unit medians by cost factor and size
6.3 The differences in reported performance between different sub-sectors demonstrates
the importance of ensuring that benchmarking is undertaken using a comparable peer
group. The rest of this section draws out some the key differences in performance
between different groups of providers.

Value for Money metrics and reporting 2019 Annex to 2019 Global Accounts
24
Providers of supported housing and housing for older people
6.4 Registered providers whose primary activity is the provision of supported housing and
housing for older people account for 11% of all registered providers, with more than
1,000 units. As a group, supported housing providers have significantly higher costs and
lower overall operating margins compared to the rest of the sector meaning that they
have more limited financial capacity with which to service debt for development. In
consequence, their level of gearing is much lower than the sector median, whilst social
housing supply and overall reinvestment rates are lower.
6.5 Similar patterns hold for those providers with significant levels of housing for older
people, albeit to a less exaggerated extent than for supported housing specialists.
Although their costs remain higher than the sector median, housing for older people
providers tend to have lower costs and stronger margins than the supported housing
providers. This translates into greater ability to access debt, and consequently higher
levels of reinvestment and new supply than their supported housing counterparts.
6.6 These patterns have, if anything, strengthened over the past year. Median unit cost for
supported housing providers has fallen year on year, although this is in part explained
by reclassification of some providers leading to change in the composition of the two
groups. A key driver that explains the 9.7% increase in the housing for older people
median unit cost and the 5.3% decrease in the supported housing median between
2018 and 2019 is the reclassification of a specialist provider from housing for older
people to supported housing. The delivery of new supply by supported housing
providers has fallen from 0.9% to 0.8% and by 0.2% for housing for older people
providers since 2018.
London-based providers
6.7 While registered providers based in the capital generate higher rates of rental income
compared to the rest of England, they are more likely to incur higher overhead costs.
This means they tend to have higher unit costs and lower operating margins. The
weighted average unit cost is 51% higher compared to the weighted average of £4,120
per unit for England and 69% higher compared to the south east – the second most
expensive region in England.
Value for Money metrics and reporting 2019 Annex to 2019 Global Accounts
25
OFFICIAL
6.8 The weighted average cost per unit for London-based registered providers is £6,200, an
increase of 9.1% from 2018 when the weighted average was £5,680. The profile of this
group has changed over the past three years which has had an impact on the average
cost base. This includes the addition of a specialist lease-based registered provider with
a very high cost base, which has crossed the 1,000 unit threshold and submitted an
Financial Viability Assessment (FVA) for the first time, and the impact of two mergers.
However, even when we controlled for these changes, the annual increase between
2018 and 2019 was 7.8%.
6.9 The vast majority of this increase has been driven by increased maintenance and major
repairs expenditure from £2,280 per unit in 2018 to £2,780 in 2019. In absolute terms,
London-based registered providers invest more in both existing stock and new
development, compared to registered providers in the rest of the country. However, their
median reinvestment level as a percentage of the value of the existing stock is lower
due to significantly higher property values in the capital.
6.10 Registered providers that are based in London have the largest gap between the
region’s median level of new supply (social), and the region’s weighted average level of
new supply (social). The median level of new supply (social) for London-based
providers increased from 1.0% in 2018 to 1.4% in 2019, while the weighted average
delivery of new supply (social), also increased from 1.6% to 1.9% over the same period.
This indicates that the largest registered providers based in London are developing at a
faster rate compared to smaller providers in the same region.
Large scale voluntary transfers less than 12 years old
6.11 LSVT organisations in their first 12 years after transfer typically have higher
reinvestment metrics compared to the rest of the sector due to significant works to
existing properties agreed as part of their transfer agreements. These providers also
have average property values that are significantly lower when compared to the rest of
the sector at the time of transfer.
6.12 Consequently, LSVT organisations that are less than 12 years old tend to have higher
unit costs compared to other types of organisations. Our analysis shows that 55% of an
LSVT’s unit cost is attributable to maintenance and major repair expenditure compared
to the sector average of 48%. The median cost of running an LSVT unit is £4,110
compared to the sector median of £3,690.
Value for Money metrics and reporting 2019 Annex to 2019 Global Accounts
26
6.13 The reinvestment in new and existing stock by LSVT organisations has increased from
9.8% in 2018 to 14.1% in 2019. This is partly due to a change in the composition of the
group. Since 2018, eight registered providers have moved out of this group as they are
older than 12 years. However, there have also been increases in the level of investment
by those providers that remain within this category. The large increase is also due to
higher reinvestment in existing stock by nine of the remaining 16 registered providers in
the group.
6.14 The new supply (social) units delivered by LSVT organisations fell by 0.2% in 2018 to
0.6% in 2019. However, this can also be explained by the reduced number of registered
providers in this group over the same period. Some of the most mature providers that
have moved out of this category had higher levels of supply than the more recent
transfers that remain within the group.
6.15 The regulator’s previous analysis has shown that there are no statistically significant
differences between older LSVTs (>12years since transfer) and traditional providers.
We have therefore not identified this group separately.
Size of providers
6.16 There is no clear, unambiguous relationship between size of provider and reported
performance on the metrics, once you control for other factors. Some of the size bands
that we have identified in Table 5 do have distinctive characteristics, particularly the
very largest providers (those with more than 30,000 properties) and the very smallest
(those with fewer than 2,500 units). However, much of the difference can be explained
by other factors rather than size per se, in particular, the amount of stock owned in
London, and the prevalence of supported housing.
6.17 The largest registered providers (with more than 30,000 properties) have a median cost
of £3,880 per unit compared to the sector median of £3,640 per unit. These registered
providers own 24.4% of their stock in London, where the median cost per unit is 64%
higher when compared to the sector median. This compares to registered providers with
between 1,000 to 30,000 units, who have a median cost per unit of £3,680 – however
only 10.2% of their stock is London-based.
6.18 At the other end of the size distribution, the smallest providers also have higher cost per
unit than the sector median. However, over one quarter of registered providers with less
than 2,500 units are categorised as supported housing or housing for older people.
Given the association between cost and supported housing stock it is therefore
unsurprising that the median cost per unit for a registered provider in this group is
£4,880. which is 32% above the sector median.
Value for Money metrics and reporting 2019 Annex to 2019 Global Accounts
27
OFFICIAL
6.19 The average new supply (social) as a percentage of total stock for the largest registered
providers is 1.8%, which is 18% higher when compared to the sector median. The fact
that the largest providers are disproportionately likely to operate in London, where
demand for new housing is greatest may be a contributory factor. These registered
providers have also developed significantly more new supply non-social properties
compared to the rest of the sector. This is likely to be, in part, due to the greater
capacity of the largest providers to diversify into more commercial activity. It may also
be due to the concentration of activity in London and the South East where, until the
recent market slowdown, the prospects for generating surpluses through market sales
were greatest.
6.20 The largest registered providers reinvested 6.3% of their assets’ value into new and
existing housing stock, which is 9.6% higher compared to 2018. This is consistent with
the concentration of their stock in London, given that providers in the capital have seen
large year-on-year increases, particularly in repairs and maintenance.
6.21 Conversely, registered providers with fewer than 2,500 units are less likely to develop at
the same rate as their counterparts. As a result, they also have lower levels of overall
reinvestment. However, as noted above these registered providers are predominantly
characterised by higher levels of care and support compared to most other groups. Over
a quarter of registered providers in this group are supported housing or housing for
older people organisations, some of whom provide very high levels of specialist care.
Reinvestment in existing housing stock per property within this group is £749 which is
5% above the sector average.
6.22 Strikingly, the cohort with the highest level of new supply (social) with a median of 1.9%
of existing stock is the registered providers who range between 2,500 to 4,999 units.
This cohort of registered providers is quite diverse and apart from their size band,
development does not appear to be driven by any other key variables such as
geographical location or proportion of supported housing stock. Of the 36 registered
providers that are included in this group in 2018 and 2019, over a third of them
increased their delivery of new supply units by 50%.
6.23 Our analysis of registered providers’ business plans suggest that this reflects the
profiling of registered providers’ capital programmes. Amongst these smaller
organisations there is a greater likelihood that development will be ‘lumpy’, as a single
scheme can lead to very high percentage variations in supply from one year to the next.
The largest providers are more likely to be able to smooth their development profile due
to a wider span of activity and the ability to phase long-term programmes.

Value for Money metrics and reporting 2019 Annex to 2019 Global Accounts
28
7. Annex A: Summary of Value for Money metrics and methodology
7.1 This publication, along with the VfM metrics dataset, provides registered providers with
a useful comparative baseline for annual reporting and monitoring of trends. The
dataset includes the metrics for all registered providers with more than 1,000 properties
at both a group and an entity level. For consistency, the metrics for individual registered
providers have been calculated on the basis set out in the regulator’s metrics technical
note22, using the FVA electronic accounts data submitted by registered providers.
7.2 Most of the metrics are set at a group level and take account of registered providers’
core activity, which for most registered providers is the provision of social housing
lettings. It also takes account of non-social housing activities in unregistered
subsidiaries and joint ventures23 which provides a comprehensive assessment of
registered providers’ performance. The exception to this is the delivery of new non-
social housing through joint ventures, which is excluded for consistency reasons.
7.3 We encourage registered providers to use the regulator’s published metrics to
benchmark and challenge performance against relative peer groups, both at a sector
and sub sector level. The latest VfM metrics dataset is available on the website with this
report24.
7.4 The analysis for 2019 is based on 217 registered providers compared to 230 in 2018
and 229 in 2017. The number of registered providers has reduced due to an increased
number of mergers and group restructures that have taken place over the last three
years. This also means that the number of very large registered providers (greater than
30,000 units), has increased and they now represent just over 45% of the total stock
owned and or managed in the sector.
7.5 Quoted quartile ranges apply to performance on individual metrics, so a provider may
be in the upper quartile for one metric and the lower quartile for another.
22 https://www.gov.uk/government/publications/value-for-money-metrics-technical-note 23 The VfM metrics are restricted to data derived from registered providers’ Annual Accounts regulatory returns –
FVA – New supply developed by joint ventures are therefore not included in the New supply (Non-social)
metric. 24 https://www.gov.uk/government/publications/2019-global-accounts-of-private-registered-providers
Value for Money metrics and reporting 2019 Annex to 2019 Global Accounts
29
OFFICIAL
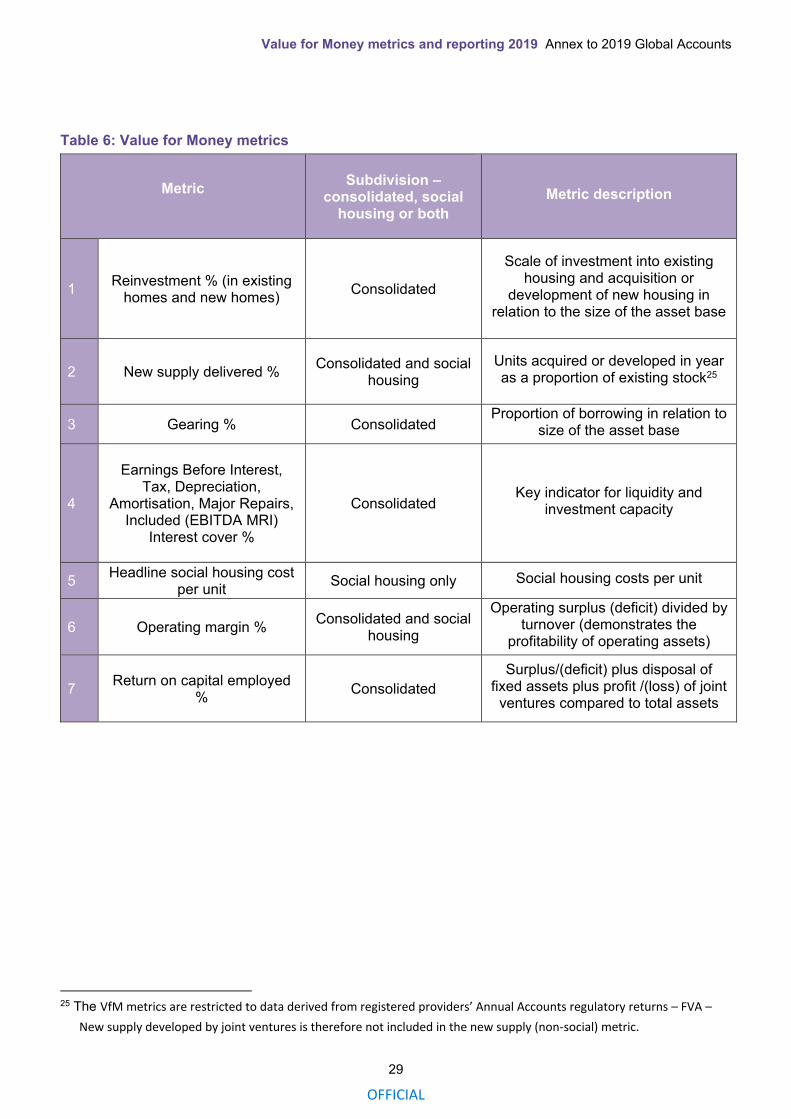
Table 6: Value for Money metrics
Metric
Subdivision –
consolidated, social housing or both
Metric description
1 Reinvestment % (in existing
homes and new homes) Consolidated
Scale of investment into existing housing and acquisition or
development of new housing in relation to the size of the asset base
2 New supply delivered % Consolidated and social
housing
Units acquired or developed in year as a proportion of existing stock25
3 Gearing % Consolidated Proportion of borrowing in relation to
size of the asset base
4
Earnings Before Interest,
Tax, Depreciation, Amortisation, Major Repairs,
Included (EBITDA MRI) Interest cover %
Consolidated Key indicator for liquidity and
investment capacity
5 Headline social housing cost
per unit Social housing only Social housing costs per unit
6 Operating margin % Consolidated and social
housing
Operating surplus (deficit) divided by turnover (demonstrates the
profitability of operating assets)
7 Return on capital employed
% Consolidated
Surplus/(deficit) plus disposal of fixed assets plus profit /(loss) of joint
ventures compared to total assets
25 The VfM metrics are restricted to data derived from registered providers’ Annual Accounts regulatory returns – FVA –
New supply developed by joint ventures is therefore not included in the new supply (non-social) metric.

© RSH copyright 2020
This publication is licensed under the terms of the Open Government Licence v3.0 except
where otherwise stated. To view this licence, visit nationalarchives.gov.uk/doc/open-
government-licence/version/3
Where we have identified any third party copyright information you will need to obtain
permission from the copyright holders concerned.
This publication is available at: www.gov.uk/rsh
Any enquiries regarding this publication should be sent to us via [email protected]
or call 0300 124 5225.
or write to:
Regulator of Social Housing
1st floor – Lateral
8 City Walk
Leeds LS11 9AT
RSH regulates private registered providers of social housing to promote a viable,
efficient and well-governed social housing sector able to deliver homes that meet a
range of needs.