Embed Size (px)
Citation preview
Segment Focus Agricultural Chemicals Overview 1
Fertilizer 1
Pesticide 3
Agricultural Chemicals Recent M&A Activity 5
Industry Updates 6
Agribusiness Industry Commodity Prices 9
Publicly Traded Agriculture Companies 10
Indices Performance 11
Historical EV / EBITDA Multiples 11
About Mercer Capital 12
Q1: Agriculture Machinery, Equipment, & Implements
Q2: Crops and Crop Services
Q3: Agriculture Real Estate
Q4: Agriculture Chemicals
SEGMENT FOCUS Agriculture Chemicals 2014
www.mercercapital.com
VALUE FOCUSAgribusiness Industry
Special Supplement
Fairness Opinions: Evaluating a Buyer’s Shares from the Seller’s Perspective
© 2015 Mercer Capital // www.mercercapital.com 1
Agricultural Chemicals OverviewAgricultural chemical producers and manufacturers experienced strong revenue growth in 2013
and 2014 due to record-high agricultural production and crop yields.1 The sharp decline in energy
prices over the second half of 2014 boosted profitability in the sector as well, creating a favorable
environment for industry participants.
Despite positive signals, the sector faces a number of potential headwinds exiting 2014. Deflated
agricultural commodity prices, due to a glut of supply, along with a strengthening U.S. dollar,
may decrease demand for industry products both domestically and abroad. New technological
advances, including genetically modified seeds, may also reduce the need for agricultural chem-
icals. The sector faces a number of factors affecting industry viability, creating a high level of
uncertainty going forward.
FertilizerThe fertilizer manufacturing industry produces fertilizer products, primarily consisting of phospho-
rous-based and nitrogen-based fertilizers. Nearly 80% of industry products are used for various
agricultural products, making the industry highly correlated with the general farming economy.
Despite fears that depressed commodity prices would lead farmers to lower their acreage
planted and reduce fertilizer use, fertilizer demand remained strong through 2014. The
Mosaic Company, the largest U.S. producer of phosphate fertilizer, saw expected 2014 fourth
quarter profits exceed expectations, buoyed by strong demand for crop nutrients through 2014
year-end.2
“Demand for potash and phosphates exceeded our expectations during the fourth
quarter… Customers came to the market in force, as they sought to position inven-
tory in anticipation of a strong spring season and increasing crop nutrient prices.”
— Mosaic Chief Executive Officer Jim Prokopanko3
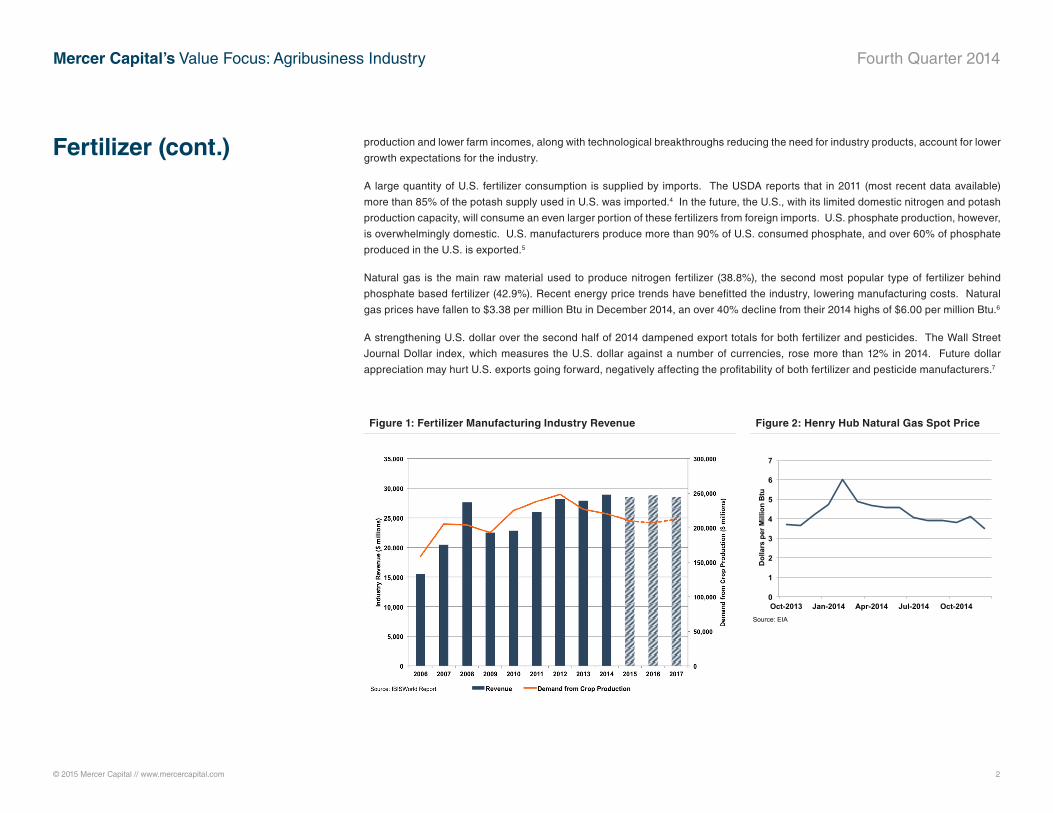
The near $29 billion industry is dominated by a handful of large multinational corporations. Four
fertilizer manufacturing companies comprise over 70% of overall market share due to factors
such as access to natural resources and key inputs, along with intense price competition. Rev-
enue growth is expected to grow 0.5% annually through 2017. Reduced demand from crop
Segment Focus
2014 Fourth Quarter
Agriculture Chemicals
BUSINESS VALUATION & FINANCIAL ADVISORY SERVICES
© 2015 Mercer Capital // www.mercercapital.com 2
Mercer Capital’s Value Focus: Agribusiness Industry Fourth Quarter 2014
production and lower farm incomes, along with technological breakthroughs reducing the need for industry products, account for lower
growth expectations for the industry.
A large quantity of U.S. fertilizer consumption is supplied by imports. The USDA reports that in 2011 (most recent data available)
more than 85% of the potash supply used in U.S. was imported.4 In the future, the U.S., with its limited domestic nitrogen and potash
production capacity, will consume an even larger portion of these fertilizers from foreign imports. U.S. phosphate production, however,
is overwhelmingly domestic. U.S. manufacturers produce more than 90% of U.S. consumed phosphate, and over 60% of phosphate
produced in the U.S. is exported.5
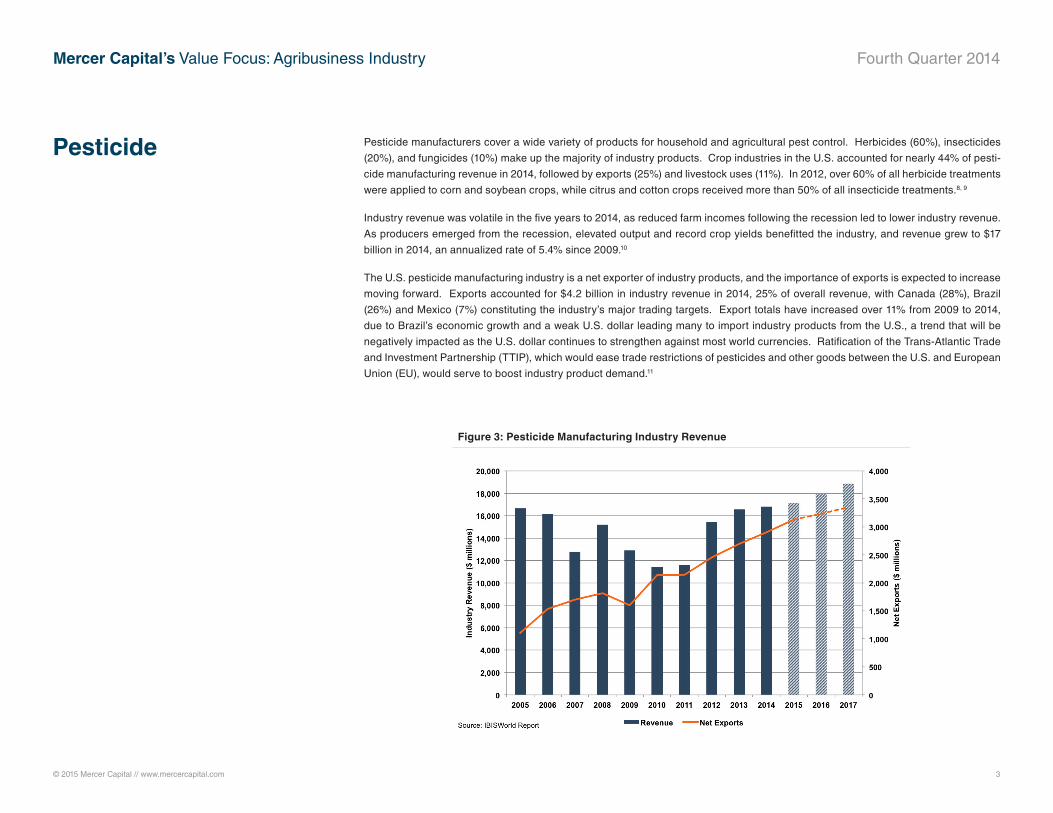
Natural gas is the main raw material used to produce nitrogen fertilizer (38.8%), the second most popular type of fertilizer behind
phosphate based fertilizer (42.9%). Recent energy price trends have benefitted the industry, lowering manufacturing costs. Natural
gas prices have fallen to $3.38 per million Btu in December 2014, an over 40% decline from their 2014 highs of $6.00 per million Btu.6
A strengthening U.S. dollar over the second half of 2014 dampened export totals for both fertilizer and pesticides. The Wall Street
Journal Dollar index, which measures the U.S. dollar against a number of currencies, rose more than 12% in 2014. Future dollar
appreciation may hurt U.S. exports going forward, negatively affecting the profitability of both fertilizer and pesticide manufacturers.7
Fertilizer (cont.)
0
1
2
3
4
5
6
7
Oct-2013 Jan-2014 Apr-2014 Jul-2014 Oct-2014
Dol
lars
per
Mill
ion
Btu
Source: EIA
Figure 1: Fertilizer Manufacturing Industry Revenue Figure 2: Henry Hub Natural Gas Spot Price
© 2015 Mercer Capital // www.mercercapital.com 3
Mercer Capital’s Value Focus: Agribusiness Industry Fourth Quarter 2014
Pesticide manufacturers cover a wide variety of products for household and agricultural pest control. Herbicides (60%), insecticides
(20%), and fungicides (10%) make up the majority of industry products. Crop industries in the U.S. accounted for nearly 44% of pesti-
cide manufacturing revenue in 2014, followed by exports (25%) and livestock uses (11%). In 2012, over 60% of all herbicide treatments
were applied to corn and soybean crops, while citrus and cotton crops received more than 50% of all insecticide treatments.8, 9
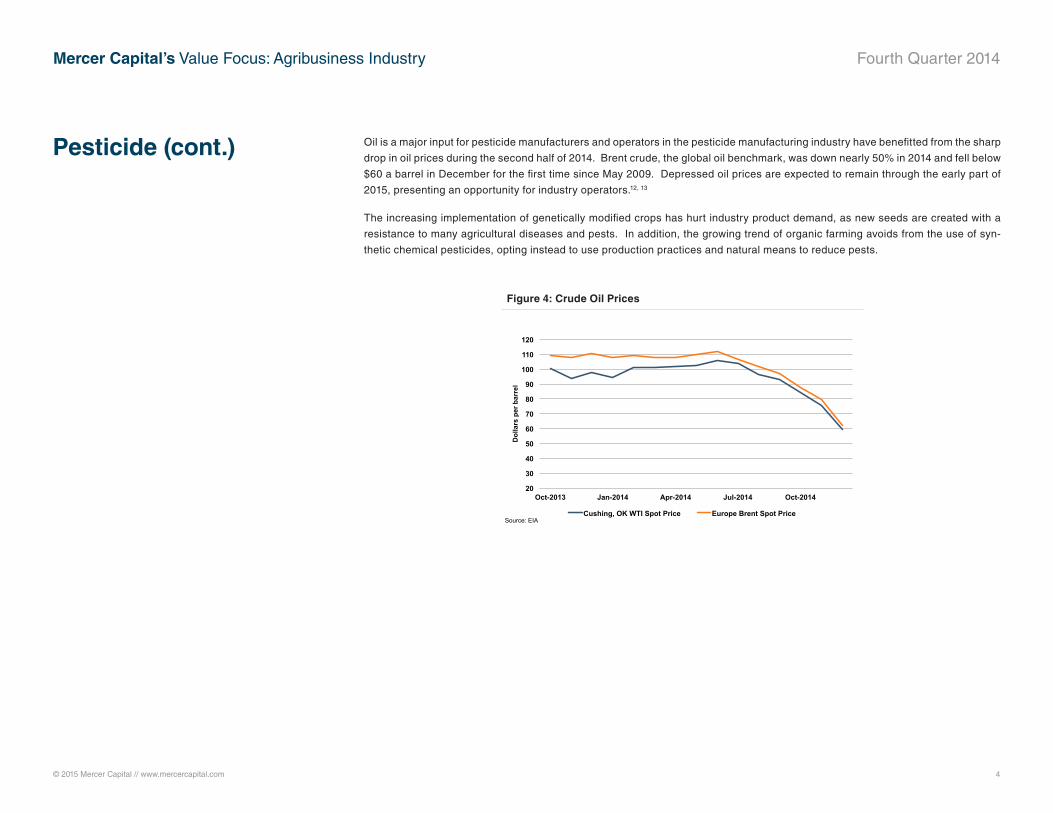
Industry revenue was volatile in the five years to 2014, as reduced farm incomes following the recession led to lower industry revenue.
As producers emerged from the recession, elevated output and record crop yields benefitted the industry, and revenue grew to $17
billion in 2014, an annualized rate of 5.4% since 2009.10
The U.S. pesticide manufacturing industry is a net exporter of industry products, and the importance of exports is expected to increase
moving forward. Exports accounted for $4.2 billion in industry revenue in 2014, 25% of overall revenue, with Canada (28%), Brazil
(26%) and Mexico (7%) constituting the industry’s major trading targets. Export totals have increased over 11% from 2009 to 2014,
due to Brazil’s economic growth and a weak U.S. dollar leading many to import industry products from the U.S., a trend that will be
negatively impacted as the U.S. dollar continues to strengthen against most world currencies. Ratification of the Trans-Atlantic Trade
and Investment Partnership (TTIP), which would ease trade restrictions of pesticides and other goods between the U.S. and European
Union (EU), would serve to boost industry product demand.11
Pesticide
Figure 3: Pesticide Manufacturing Industry Revenue
© 2015 Mercer Capital // www.mercercapital.com 4
Mercer Capital’s Value Focus: Agribusiness Industry Fourth Quarter 2014
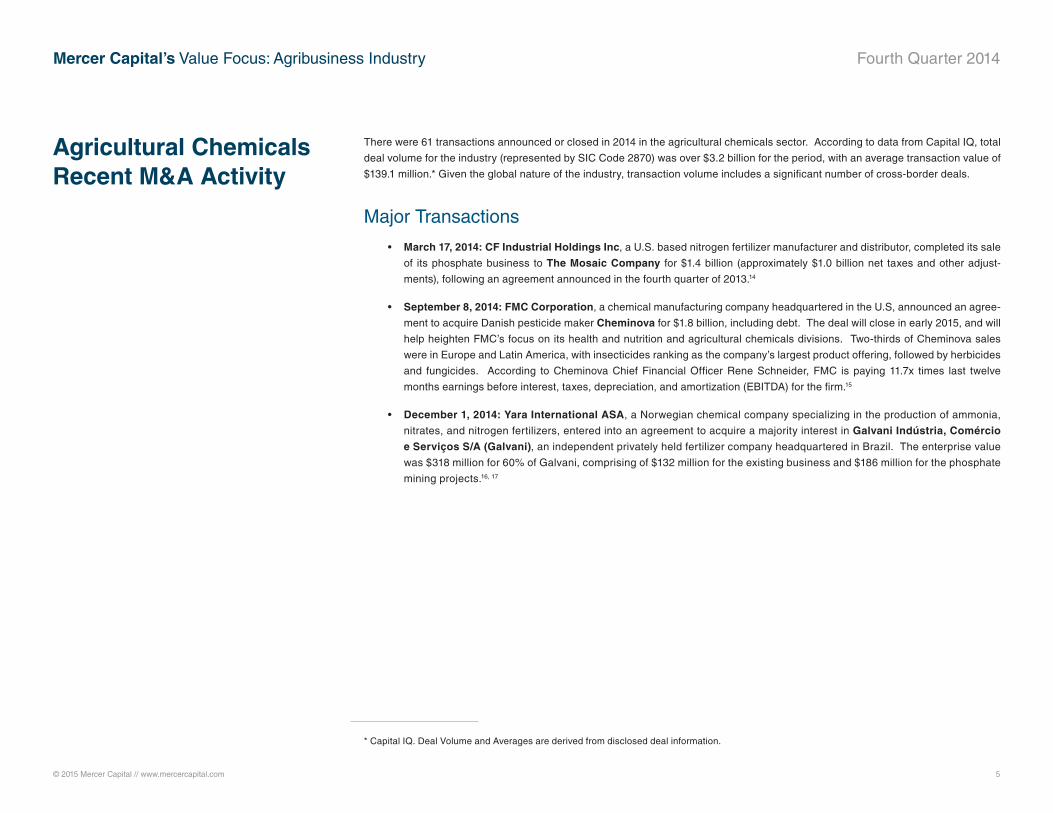
Pesticide (cont.) Oil is a major input for pesticide manufacturers and operators in the pesticide manufacturing industry have benefitted from the sharp
drop in oil prices during the second half of 2014. Brent crude, the global oil benchmark, was down nearly 50% in 2014 and fell below
$60 a barrel in December for the first time since May 2009. Depressed oil prices are expected to remain through the early part of
2015, presenting an opportunity for industry operators.12, 13
The increasing implementation of genetically modified crops has hurt industry product demand, as new seeds are created with a
resistance to many agricultural diseases and pests. In addition, the growing trend of organic farming avoids from the use of syn-
thetic chemical pesticides, opting instead to use production practices and natural means to reduce pests.
20
30
40
50
60
70
80
90
100
110
120
Oct-2013 Jan-2014 Apr-2014 Jul-2014 Oct-2014
Dol
lars
per
bar
rel
Cushing, OK WTI Spot Price Europe Brent Spot Price Source: EIA
Figure 4: Crude Oil Prices
© 2015 Mercer Capital // www.mercercapital.com 5
Mercer Capital’s Value Focus: Agribusiness Industry Fourth Quarter 2014
There were 61 transactions announced or closed in 2014 in the agricultural chemicals sector. According to data from Capital IQ, total
deal volume for the industry (represented by SIC Code 2870) was over $3.2 billion for the period, with an average transaction value of
$139.1 million.* Given the global nature of the industry, transaction volume includes a significant number of cross-border deals.
Major Transactions
• March 17, 2014: CF Industrial Holdings Inc, a U.S. based nitrogen fertilizer manufacturer and distributor, completed its sale
of its phosphate business to The Mosaic Company for $1.4 billion (approximately $1.0 billion net taxes and other adjust-
ments), following an agreement announced in the fourth quarter of 2013.14
• September 8, 2014: FMC Corporation, a chemical manufacturing company headquartered in the U.S, announced an agree-
ment to acquire Danish pesticide maker Cheminova for $1.8 billion, including debt. The deal will close in early 2015, and will
help heighten FMC’s focus on its health and nutrition and agricultural chemicals divisions. Two-thirds of Cheminova sales
were in Europe and Latin America, with insecticides ranking as the company’s largest product offering, followed by herbicides
and fungicides. According to Cheminova Chief Financial Officer Rene Schneider, FMC is paying 11.7x times last twelve
months earnings before interest, taxes, depreciation, and amortization (EBITDA) for the firm.15
• December 1, 2014: Yara International ASA, a Norwegian chemical company specializing in the production of ammonia,
nitrates, and nitrogen fertilizers, entered into an agreement to acquire a majority interest in Galvani Indústria, Comércio
e Serviços S/A (Galvani), an independent privately held fertilizer company headquartered in Brazil. The enterprise value
was $318 million for 60% of Galvani, comprising of $132 million for the existing business and $186 million for the phosphate
mining projects.16, 17
Agricultural Chemicals Recent M&A Activity
* Capital IQ. Deal Volume and Averages are derived from disclosed deal information.
© 2015 Mercer Capital // www.mercercapital.com 6
Mercer Capital’s Value Focus: Agribusiness Industry Fourth Quarter 2014
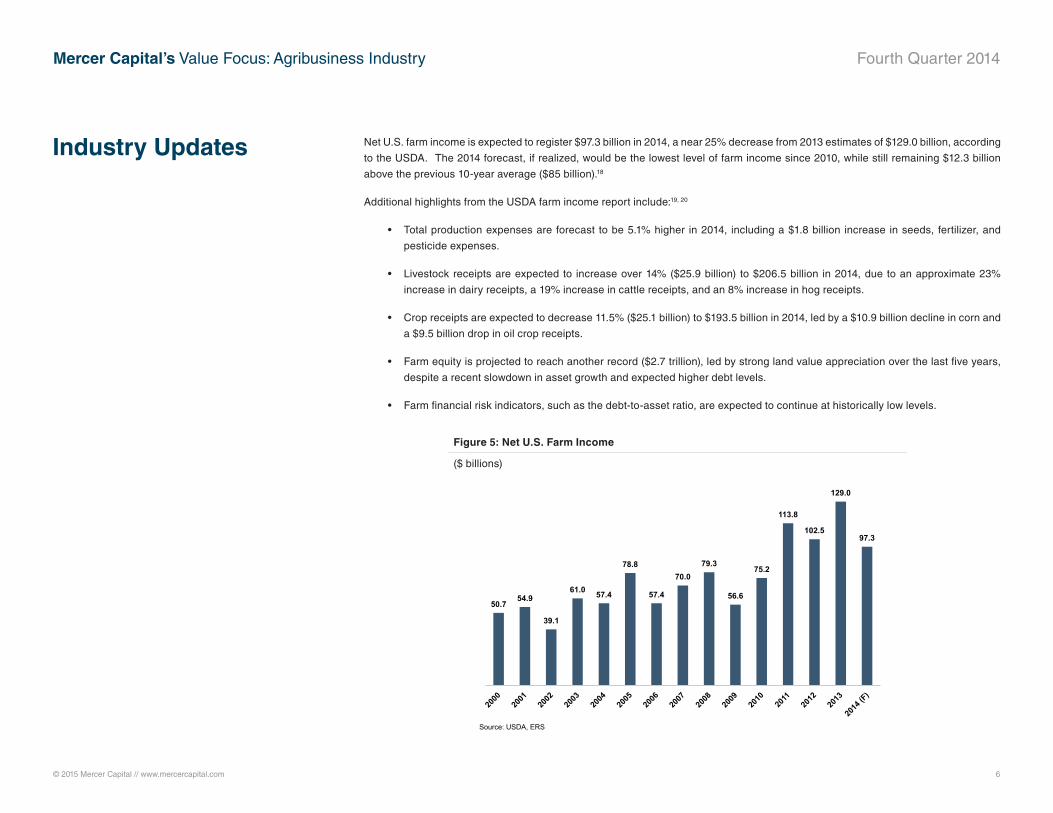
Industry Updates Net U.S. farm income is expected to register $97.3 billion in 2014, a near 25% decrease from 2013 estimates of $129.0 billion, according
to the USDA. The 2014 forecast, if realized, would be the lowest level of farm income since 2010, while still remaining $12.3 billion
above the previous 10-year average ($85 billion).18
Additional highlights from the USDA farm income report include:19, 20
• Total production expenses are forecast to be 5.1% higher in 2014, including a $1.8 billion increase in seeds, fertilizer, and
pesticide expenses.
• Livestock receipts are expected to increase over 14% ($25.9 billion) to $206.5 billion in 2014, due to an approximate 23%
increase in dairy receipts, a 19% increase in cattle receipts, and an 8% increase in hog receipts.
• Crop receipts are expected to decrease 11.5% ($25.1 billion) to $193.5 billion in 2014, led by a $10.9 billion decline in corn and
a $9.5 billion drop in oil crop receipts.
• Farm equity is projected to reach another record ($2.7 trillion), led by strong land value appreciation over the last five years,
despite a recent slowdown in asset growth and expected higher debt levels.
• Farm financial risk indicators, such as the debt-to-asset ratio, are expected to continue at historically low levels.
Figure 5: Net U.S. Farm Income
($ billions)
50.7 54.9
39.1
61.0 57.4
78.8
57.4
70.0 79.3
56.6
75.2
113.8
102.5
129.0
97.3
Source: USDA, ERS
© 2015 Mercer Capital // www.mercercapital.com 7
Mercer Capital’s Value Focus: Agribusiness Industry Fourth Quarter 2014
Industry Updates (cont.)
Negotiations involving the U.S. and EU for the TTIP could have a positive effect on U.S. agricultural chemical exports to the EU. Cur-
rent conflicting regulations diverge between the EPAs regulatory approach, which takes into account exposure and risk assessment,
in addition to hazard identification, and EU standards, regulation based on a hazard identification basis alone. Currently 82 pesticides
banned in the EU are allowed in the U.S. If ratified, the TTIP could reconcile regulatory differences between the two economies,
making the trade of pesticides, chemicals, and goods more efficient.21, 22
The Farm Bill, which has existed in various forms since the 1930s, is the most important piece of legislation affecting agribusiness. The
omnibus bill has generally provided various types of assistance to the agriculture industry, including income and commodity price sup-
port, farm credit and risk management, research, and economic development, along with appropriations for the Supplemental Nutrition
Assistance Program (SNAP). A Farm Bill is typically passed for a five year period, at the end of which it is renewed and updated.
The Agricultural Act of 2014 was signed into law in February of 2014, and will remain in effect through 2018. The bill appropriates $89.8
billion for crop insurance ($6 billion more than previous law), $44.4 billion for commodity programs ($14 billion less), $56 billion for con-
servation ($4 billion less), and $3.5 billion for trade assistance (no substantial change) from Fiscal Year 2013 through 2023. Perhaps
one of the most important changes that occurred in the new Bill relates to the Direct Payments program, a system that pays farmers
whether they incur losses or not. The elimination of Direct Payments is partially offset by higher payments for supplemental disaster
assistance. However, this change results in a net 15% decline in projected government payments to farmers.23, 24
© 2015 Mercer Capital // www.mercercapital.com 8
Mercer Capital’s Value Focus: Agribusiness Industry Fourth Quarter 2014
References and Data Sources
1 “Crop Production: 2014 Summary,” Online, Available, http://www.usda.gov/nass/PUBS/TODAYRPT/
cropan15.pdf, Accessed January 21, 2015.2 “Fertilizer Margins Boost Mosaic Profits,” Online, Available, http://www.agweb.com/article/fertilizer-mar-
gins-boost-mosaic-profits-blmg/, Accessed January 23, 2015.3 Ibid.4 Ibid.5 “Fertilizer Use & Markets.” Online, Available, http://www.ers.usda.gov/topics/farm-practices-management/
chemical-inputs/fertilizer-use-markets.aspx, Accessed January 23, 2015.6 “Natural Gas: Spot Prices,” Online, Available, http://www.eia.gov/dnav/ng/hist/rngwhhdm.htm, Accessed
January 22, 2015.7 “Dollar Ends Best Year in More Than a Decade,” Online, Available, http://www.wsj.com/articles/dollar-
ends-best-year-in-more-than-a-decade-vs-yen-euro-1420051643, Accessed January 22, 2015.8 USDA Pesticide Use in U.S. Agriculture, 1960-2008.9 Pesticide Manufacturing, IBISWorld, December 201410 Ibid.11 Ibid.12 “Petroleum and Other Liquids: Spot Prices,” Online, Available, http://www.eia.gov/dnav/pet/pet_pri_spt_
s1_d.htm, Accessed January 22, 2015.13 “Oil Prices Close at Five-Year Low on Glut Expectations,” Online, Subscription Requires, http://www.wsj.
com/articles/oil-rises-amid-reports-of-clashes-in-libya-1419849827, Accessed January 22, 2015.14 CF Industries Completes Sale of Phosphate Business to Mosaic,” Online, Available, http://www.market-
watch.com/story/cf-industries-completes-sale-of-phosphate-business-to-mosaic-2014-03-17, Accessed
January 23, 2015. 15 “FMC Buys Cheminova for $1.8 Billion and Revises Breakup,” Online, Available, http://www.bloomberg.
com/news/print/2014-09-08/fmc-to-buy-cheminova-for-1-8-billion-as-ceo-modifies-strategy.html,
Accessed January 23, 2015.
16 “Yara Expands in South America with $318 Million Purchase,” Online, Available, http://www.bloomberg.
com/news/2014-08-05/yara-expands-in-south-america-with-318-million-galvani-purchase.html, Accessed
January 23, 2015. 17 “Yara completes acquisition of majority position in Galvani, Brazil,” Online, Available, http://www.yara.
com/media/press_releases/1875735/press_release/201412/yara-completes-acquisition-of-majority-posi-
tion-in-galvani-brazil, Accessed January 23, 2015. 18 “2014 Farm Income Forecast,” Online, Available, http://www.ers.usda.gov/topics/farm-economy/farm-sec-
tor-income-finances/2014-farm-sector-income-forecast.aspx#.VD1pnfldU68, Accessed January 23, 2015.19 Ibid.20 “Farm Income and Wealth Statistics,” Online, Available, http://www.ers.usda.gov/data-products/farm-
income-and-wealth-statistics/value-added-years-by-state.aspx#.VMbKT_7F-ZN, Accessed January 26,
2015. 21 “Reports Says TTIP Would Undermine Toxic Pesticide Regulations,” Online, Available, http://www.man-
ufacturing.net/articles/2015/01/report-says-ttip-would-undermine-toxic-pesticide-regulations, Accessed
January 23, 2015.22 “The Window Is Closing on a Trans-Atlantic Trade Deal,” Online, Available, http://www.wsj.com/articles/
chris-cummings-the-window-is-closing-on-a-trans-atlantic-trade-deal-1421701781?KEYWORDS=TTIP,
Accessed January 23, 2015.23 “Agricultural Act of 2014: Highlights and Implications,” Online, Available, http://www.ers.usda.gov/agricul-
tural-act-of-2014-highlights-and-implications.aspx#.VD1sF_ldU68, Accessed January 22, 2015.24 “2014 Farm Bill Highlights,” Online, Available, http://www.usda.gov/documents/usda-2014-farm-bill-high-
lights.pdf, Accessed January 22, 2015.
Mercer Capital’s Value Focus: Agribusiness Industry Fourth Quarter 2014
© 2015 Mercer Capital // www.mercercapital.com // Data Source: Bloomberg 9
0!
100!
200!
300!
400!
500!
600!
700!
800!
900!
Pric
e ($
/bus
hel)!
800!
1000!
1200!
1400!
1600!
1800!
2000!
Pric
e ($
/bus
hel)!
300!
400!
500!
600!
700!
800!
900!
1000!
Pric
e ($
/bus
hel)!
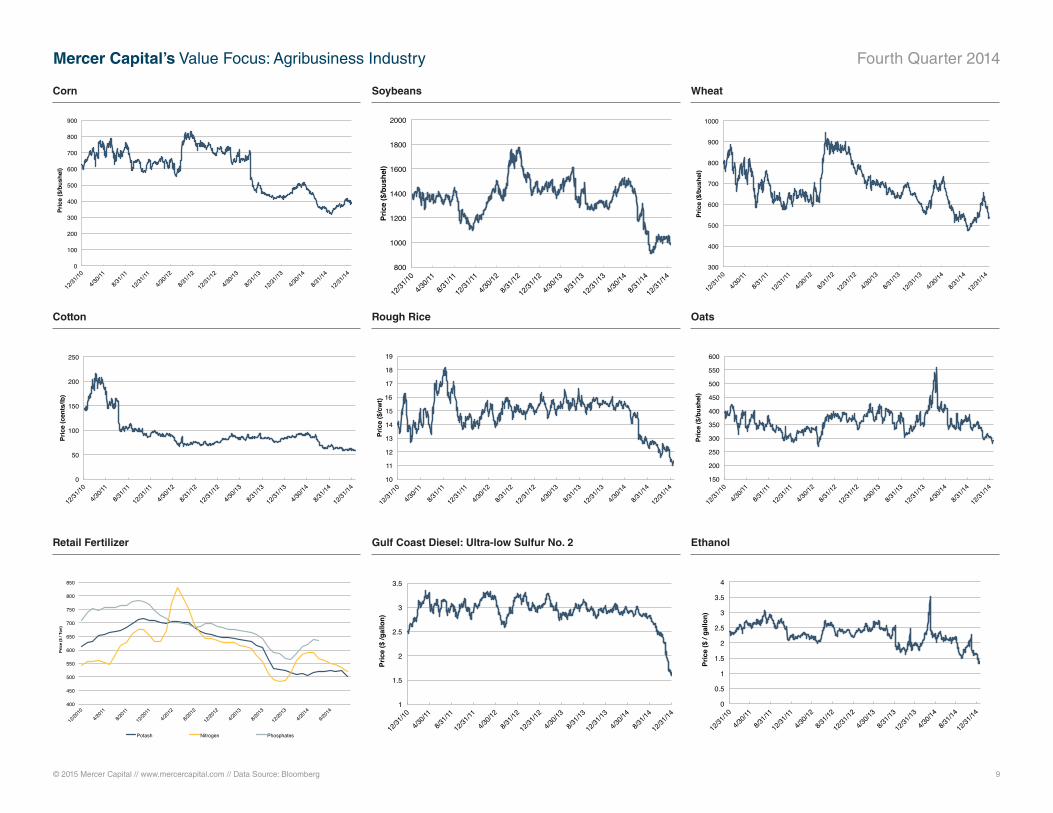
Corn Soybeans Wheat
0!
50!
100!
150!
200!
250!
Pric
e (c
ents
/lb)!
10!
11!
12!
13!
14!
15!
16!
17!
18!
19!
Pric
e ($
/cw
t)!
150!
200!
250!
300!
350!
400!
450!
500!
550!
600!
Pric
e ($
/bus
hel)!
Cotton Rough Rice Oats
400!
450!
500!
550!
600!
650!
700!
750!
800!
850!
Potash! Nitrogen! Phosphates!
Pric
e ($
/ To
n)!
1!
1.5!
2!
2.5!
3!
3.5!
Pric
e ($
/gal
lon)!
0!
0.5!
1!
1.5!
2!
2.5!
3!
3.5!
4!
Pric
e ($
/ ga
llon)!
Retail Fertilizer Gulf Coast Diesel: Ultra-low Sulfur No. 2 Ethanol
© 2015 Mercer Capital // www.mercercapital.com 10
Mercer Capital’s Value Focus: Agribusiness Industry Fourth Quarter 2014
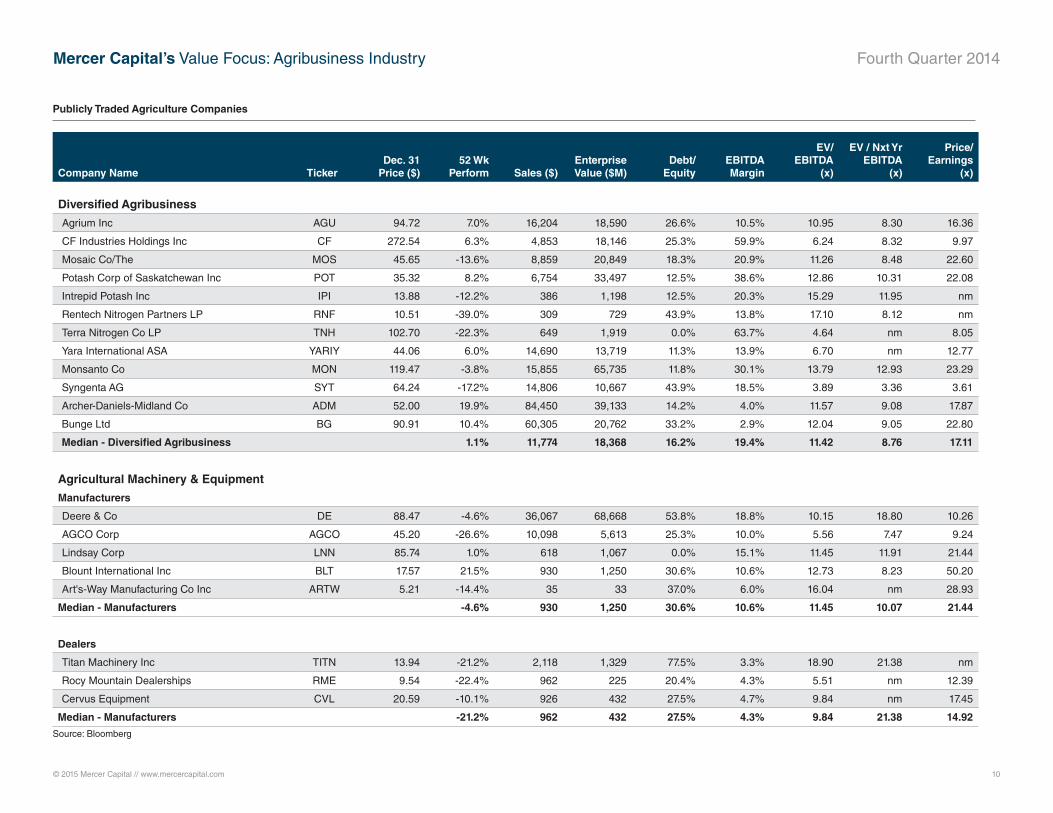
Company Name TickerDec. 31
Price ($)52 Wk
Perform Sales ($)Enterprise Value ($M)
Debt/Equity
EBITDA Margin
EV/EBITDA
(x)
EV / Nxt Yr EBITDA
(x)
Price/ Earnings
(x)
Diversified Agribusiness
Agrium Inc AGU 94.72 7.0% 16,204 18,590 26.6% 10.5% 10.95 8.30 16.36
CF Industries Holdings Inc CF 272.54 6.3% 4,853 18,146 25.3% 59.9% 6.24 8.32 9.97
Mosaic Co/The MOS 45.65 -13.6% 8,859 20,849 18.3% 20.9% 11.26 8.48 22.60
Potash Corp of Saskatchewan Inc POT 35.32 8.2% 6,754 33,497 12.5% 38.6% 12.86 10.31 22.08
Intrepid Potash Inc IPI 13.88 -12.2% 386 1,198 12.5% 20.3% 15.29 11.95 nm
Rentech Nitrogen Partners LP RNF 10.51 -39.0% 309 729 43.9% 13.8% 17.10 8.12 nm
Terra Nitrogen Co LP TNH 102.70 -22.3% 649 1,919 0.0% 63.7% 4.64 nm 8.05
Yara International ASA YARIY 44.06 6.0% 14,690 13,719 11.3% 13.9% 6.70 nm 12.77
Monsanto Co MON 119.47 -3.8% 15,855 65,735 11.8% 30.1% 13.79 12.93 23.29
Syngenta AG SYT 64.24 -17.2% 14,806 10,667 43.9% 18.5% 3.89 3.36 3.61
Archer-Daniels-Midland Co ADM 52.00 19.9% 84,450 39,133 14.2% 4.0% 11.57 9.08 17.87
Bunge Ltd BG 90.91 10.4% 60,305 20,762 33.2% 2.9% 12.04 9.05 22.80
Median - Diversified Agribusiness 1.1% 11,774 18,368 16.2% 19.4% 11.42 8.76 17.11
Agricultural Machinery & Equipment
Manufacturers
Deere & Co DE 88.47 -4.6% 36,067 68,668 53.8% 18.8% 10.15 18.80 10.26
AGCO Corp AGCO 45.20 -26.6% 10,098 5,613 25.3% 10.0% 5.56 7.47 9.24
Lindsay Corp LNN 85.74 1.0% 618 1,067 0.0% 15.1% 11.45 11.91 21.44
Blount International Inc BLT 17.57 21.5% 930 1,250 30.6% 10.6% 12.73 8.23 50.20
Art's-Way Manufacturing Co Inc ARTW 5.21 -14.4% 35 33 37.0% 6.0% 16.04 nm 28.93
Median - Manufacturers -4.6% 930 1,250 30.6% 10.6% 11.45 10.07 21.44
Dealers
Titan Machinery Inc TITN 13.94 -21.2% 2,118 1,329 77.5% 3.3% 18.90 21.38 nm
Rocy Mountain Dealerships RME 9.54 -22.4% 962 225 20.4% 4.3% 5.51 nm 12.39
Cervus Equipment CVL 20.59 -10.1% 926 432 27.5% 4.7% 9.84 nm 17.45
Median - Manufacturers -21.2% 962 432 27.5% 4.3% 9.84 21.38 14.92
Source: Bloomberg
Publicly Traded Agriculture Companies
© 2015 Mercer Capital // www.mercercapital.com 11
Mercer Capital’s Value Focus: Agribusiness Industry Fourth Quarter 2014
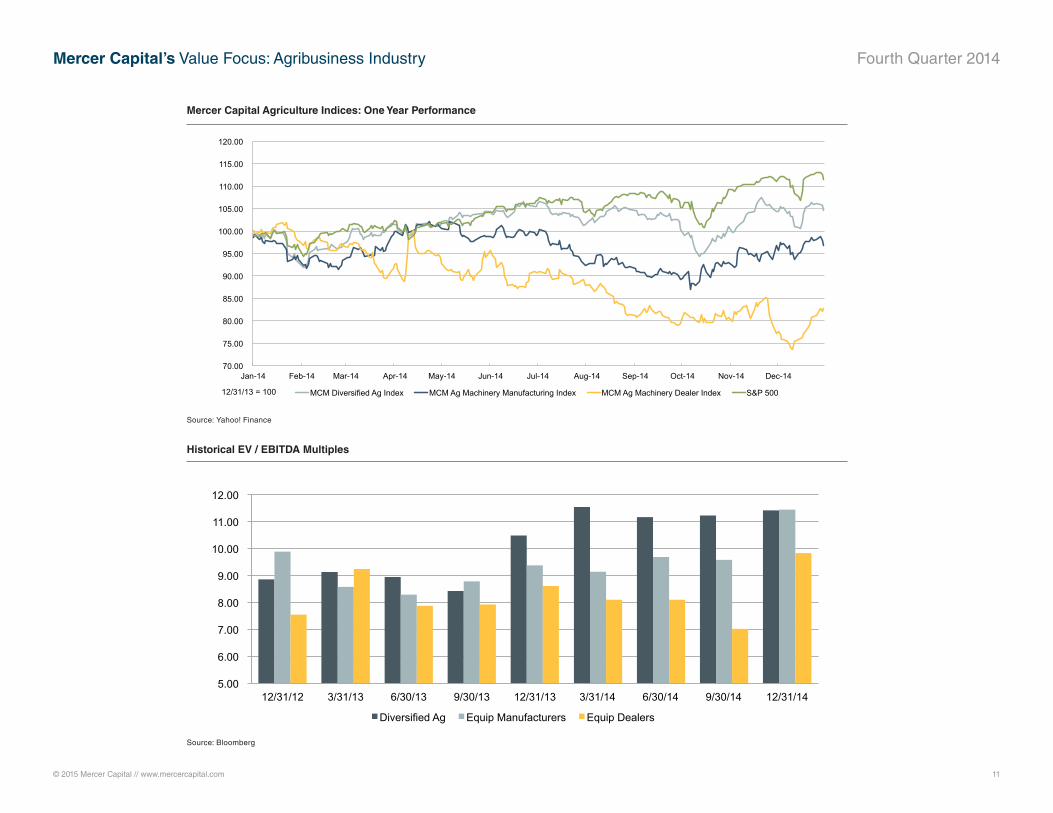
70.00
75.00
80.00
85.00
90.00
95.00
100.00
105.00
110.00
115.00
120.00
Jan-14 Feb-14 Mar-14 Apr-14 May-14 Jun-14 Jul-14 Aug-14 Sep-14 Oct-14 Nov-14 Dec-14
MCM Diversified Ag Index MCM Ag Machinery Manufacturing Index MCM Ag Machinery Dealer Index S&P 500 12/31/13 = 100
Mercer Capital Agriculture Indices: One Year Performance
5.00
6.00
7.00
8.00
9.00
10.00
11.00
12.00
12/31/12 3/31/13 6/30/13 9/30/13 12/31/13 3/31/14 6/30/14 9/30/14 12/31/14
Diversified Ag Equip Manufacturers Equip Dealers
Historical EV / EBITDA Multiples
Source: Yahoo! Finance
Source: Bloomberg
Mercer CapitalAgribusiness Industry Services
Contact Us
Copyright © 2015 Mercer Capital Management, Inc. All rights reserved. It is illegal under Federal law to reproduce this publication or any portion of its contents without the publisher’s permission. Media quotations with source attribution are encouraged. Reporters
requesting additional information or editorial comment should contact Barbara Walters Price at 901.685.2120. Mercer Capital’s Industry Focus is published quarterly and does not constitute legal or financial consulting advice. It is offered as an information service to
our clients and friends. Those interested in specific guidance for legal or accounting matters should seek competent professional advice. Inquiries to discuss specific valuation matters are welcomed. To add your name to our mailing list to receive this complimentary
publication, visit our web site at www.mercercapital.com.
Mercer Capital has expertise providing business valuation and financial advisory services to companies in the agribusiness industry.
Industry Segments
Mercer Capital serves the following industry segments:
• Agriculture Machinery, Equipment, & Implements
• Crop and Crop Services
• Agriculture Real Estate
• Agriculture Chemicals
Contact a Mercer Capital professional to discuss your needs in confidence.
Nicholas J. Heinz, [email protected]
Matthew R. Crow, CFA, [email protected]
Timothy R. Lee, [email protected]
Laura J. Stevens, [email protected]
Mercer Capital5100 Poplar Avenue, Suite 2600Memphis, Tennessee 38137901.685.2120 (P)
www.mercercapital.com
BUSINESS VALUATION & FINANCIAL ADVISORY SERVICES
Services Provided
• Valuation of agriculture companies
• Transaction advisory for acquisitions and divestitures
• Valuations for purchase accounting and impairment testing
• Fairness and solvency opinions
• Litigation support for economic damages and valuation and shareholder
disputes
© 2015 Mercer Capital // www.mercercapital.com 13
Mercer Capital’s Value Focus: Agribusiness Industry Fourth Quarter 2014
Fairness OpinionsEvaluating a Buyer’s Shares from the Seller’s PerspectiveM&A activity in the U.S. (and globally) has accelerated in 2014 after years of gradual
improvement following the financial crisis. According to Dealogic, M&A volume where the
target was a U.S. company totaled $1.4 trillion YTD through November 10, the highest YTD
volume on record and up 43% from the same period last year. Excluding cross-border
acquisitions, domestic-only M&A was $1.1 trillion, which represented the second highest
YTD volume since 1999 and up 27% from last year. Healthcare and telecommunications
were the first and second most targeted sectors.
The improvement has taken a long time even though corporate cash is high, financing costs
are very low and organic revenue growth in most industries has been sluggish. Aside from
improving confidence, another key foundation for increased M&A activity fell into place
in 2013 when equity markets staged a strong rally as the S&P 500 rose 30% (32% with
dividends) and the Russell 2000 increased 37% (39%). The absence of a meaningful pull-
back in 2014 and a 12% advance in the S&P 500 and 2% in the Russell 2000 have further
supported activity.
The rally in equities, like low borrowing rates, has reduced the cost to finance acquisitions
because the majority of stocks experienced multiple expansion rather than material growth
in EPS. It is easier for a buyer to issue shares to finance an acquisition if the shares trade
at rich valuation than issuing “cheap” shares. As of November 24, the S&P 500’s P/E based
upon trailing earnings (as reported) was 20.0x compared to 18.2x at year-end 2013, 17.0x at
year-end 2012 and 14.9x at year-end 2011. The long-term average P/E since 1871 is 15.5x
(Source: http://www.multpl.com).
High multiple stocks can be viewed as strong acquisition currencies for acquisitive com-
panies because fewer shares have to be issued to achieve a targeted dollar value. As
such, it is no surprise that the extended rally in equities has supported deal activity this
year. However, high multiple stocks may represent an under-appreciated risk to sellers
who receive the shares as consideration. Accepting the buyer’s stock raises a number of
questions, most which fall into the genre of: what are the investment merits of the buyer’s
shares? The answer may not be as obvious as it seems, even when the buyer’s shares are
actively traded.
Our experience is that some, if not most, members of a board weighing an acquisition pro-
posal do not have the background to thoroughly evaluate the buyer’s shares. Even when
financial advisors are involved there still may not be a thorough vetting of the buyer’s shares
because there is too much focus on “price” instead of, or in addition to, “value.”
A fairness opinion is more than a three or four page letter that opines as to the fairness from
a financial point of a contemplated transaction; it should be backed by a robust analysis of
all of the relevant factors considered in rendering the opinion, including an evaluation of the
shares to be issued to the selling company’s shareholders. The intent is not to express an
opinion about where the shares may trade in the future, but rather to evaluate the invest-
ment merits of the shares before and after a transaction is consummated.
Key questions to ask about the buyer’s shares include the following:
• Liquidity of the Shares. What is the capacity to sell the shares issued in the merger?
SEC registration and even NASDAQ and NYSE listings do not guarantee that large
blocks can be liquidated efficiently. Generally, the higher the institutional ownership, the
better the liquidity. Also, liquidity may improve with an acquisition if the number of shares
outstanding and shareholders increase sufficiently.
© 2015 Mercer Capital // www.mercercapital.com 14
Mercer Capital’s Value Focus: Agribusiness Industry Fourth Quarter 2014
• Profitability and Revenue Trends. The analysis should consider the buyer’s historical
growth and projected growth in revenues, and operating earnings, (usually EBITDA
or EBITDA less capital expenditures) in addition to EPS. Issues to be vetted include
customer concentrations, the source of growth, the source of any margin pressure and
the like. The quality of earnings and a comparison of core vs. reported earnings over a
multi-year period should be evaluated.
• Pro Forma Impact. The analysis should consider the impact of a proposed transaction
on revenues, EBITDA, margins, EPS and capital structure. The per share accretion and
dilution analysis of such metrics as earnings, EBITDA and dividends should consider
both the buyer’s and seller’s perspectives.
• Dividends. In a yield starved world, dividend paying stocks have greater attraction than
in past years. Sellers should not be overly swayed by the pick-up in dividends from
swapping into the buyer’s shares; however, multiple studies have demonstrated that a
sizable portion of an investor’s return comes from dividends over long periods of time.
If the dividend yield is notably above the peer average, the seller should ask why? Is it
payout related, or are the shares depressed? Worse would be if the market expected a
dividend cut. These same questions should also be asked in the context of the prospects
for further increases.
• Capital Structure. Does the acquirer operate with an appropriate capital structure given
industry norms, cyclicality of the business and investment needs to sustain operations?
Will the proposed acquisition result in an over-leveraged company, which in turn may
lead to pressure on the buyer’s shares and/or a rating downgrade if the buyer has rated
debt?
• Balance Sheet Flexibility. Related to the capital structure should be a detailed review
of the buyer’s balance sheet that examines such areas as liquidity, access to bank
credit, and the carrying value of assets such as deferred tax assets.
• Ability to Raise Cash to Close. What is the source of funds for the buyer to fund the
cash portion of consideration? If the buyer has to go to market to issue equity and/or
debt, what is the contingency plan if unfavorable market conditions preclude floating an
issue?
• Consensus Analyst Estimates. If the buyer is publicly traded and has analyst coverage,
consideration should be given to Street expectations vs. what the diligence process
determines. If Street expectations are too high, then the shares may be vulnerable once
investors reassess their earnings and growth expectations.
• Valuation. Like profitability, valuation of the buyer’s shares should be judged relative to
its history and a peer group presently as well as relative to a peer group through time
to examine how investors’ views of the shares may have evolved through market and
profit cycles.
• Share Performance. Sellers should understand the source of the buyer’s shares
performance over several multi-year holding periods. For example, if the shares have
significantly outperformed an index over a given holding period, is it because earnings
growth accelerated? Or, is it because the shares were depressed at the beginning of the
measurement period? Likewise, underperformance may signal disappointing earnings,
or it may reflect a starting point valuation that was unusually high.
• Strategic Position. Assuming an acquisition is material for the buyer, directors of the
selling board should consider the strategic position of the buyer, asking such questions
about the attractiveness of the pro forma company to other acquirers.
• Contingent Liabilities. Contingent liabilities are a standard item on the due diligence
punch list for a buyer. Sellers should evaluate contingent liabilities too.
The list does not encompass every question that should be asked as part of the fairness
analysis, but it does illustrate that a liquid market for a buyer’s shares does not necessarily
answer questions about value, growth potential and risk profile.
We at Mercer Capital have extensive experience in valuing and evaluating the shares (and
debt) of financial and non-financial service companies garnered from over three decades
of business. Feel free to contact us to discuss your situation in confidence.
Jeff K. Davis, CFA