Embed Size (px)
Citation preview
This article was downloaded by: [University of West Florida]On: 09 October 2014, At: 21:28Publisher: Taylor & FrancisInforma Ltd Registered in England and Wales Registered Number: 1072954 Registered office: Mortimer House,37-41 Mortimer Street, London W1T 3JH, UK
Production Planning & Control: The Management ofOperationsPublication details, including instructions for authors and subscription information:http://www.tandfonline.com/loi/tppc20
Value creation through collaborative supply chain:holistic performance enhancement road mapPongsak Holimchayachotikula, Ridha Derrouicheb, David Damandc & Komgrit Leksakulaa Faculty of Engineering, Department of Industrial Engineering, Chiang Mai University,Chiang Mai, 50200, Thailand.b Saint-Etienne School of Management ESC – UMR 5600, 51–52 Cours Fauriel, BP 29, SaintEtienne, 42009, France.c HuManis-EM Strasbourg Business School, 61 avenue de la Forêt Noire, Strasbourg, F-67085,France.Published online: 03 Apr 2013.
To cite this article: Pongsak Holimchayachotikul, Ridha Derrouiche, David Damand & Komgrit Leksakul (2014) Value creationthrough collaborative supply chain: holistic performance enhancement road map, Production Planning & Control: TheManagement of Operations, 25:11, 912-922, DOI: 10.1080/09537287.2013.780313
To link to this article: http://dx.doi.org/10.1080/09537287.2013.780313
PLEASE SCROLL DOWN FOR ARTICLE
Taylor & Francis makes every effort to ensure the accuracy of all the information (the “Content”) containedin the publications on our platform. However, Taylor & Francis, our agents, and our licensors make norepresentations or warranties whatsoever as to the accuracy, completeness, or suitability for any purpose of theContent. Any opinions and views expressed in this publication are the opinions and views of the authors, andare not the views of or endorsed by Taylor & Francis. The accuracy of the Content should not be relied upon andshould be independently verified with primary sources of information. Taylor and Francis shall not be liable forany losses, actions, claims, proceedings, demands, costs, expenses, damages, and other liabilities whatsoeveror howsoever caused arising directly or indirectly in connection with, in relation to or arising out of the use ofthe Content.
This article may be used for research, teaching, and private study purposes. Any substantial or systematicreproduction, redistribution, reselling, loan, sub-licensing, systematic supply, or distribution in anyform to anyone is expressly forbidden. Terms & Conditions of access and use can be found at http://www.tandfonline.com/page/terms-and-conditions
Value creation through collaborative supply chain: holistic performance enhancement roadmap
Pongsak Holimchayachotikula, Ridha Derrouicheb*, David Damandc and Komgrit Leksakula
aFaculty of Engineering, Department of Industrial Engineering, Chiang Mai University, Chiang Mai 50200, Thailand; bSaint-EtienneSchool of Management ESC – UMR 5600, 51–52 Cours Fauriel, BP 29, Saint Etienne 42009, France; cHuManis-EM Strasbourg
Business School, 61 avenue de la Forêt Noire, Strasbourg F-67085, France
(Received 12 October 2011; final version received 16 February 2013)
This paper proposes an integrated novel framework between B2B-SCM using data mining techniques such asK-Means based on particle swarm intelligence (particle swarm optimisation) and association rule. It constructsrelationship rules of holistic performance enhancement road map. The data-set of relationships between enterprise andits direct customers of the case study organisations in France was used for demonstration. The experiment resultsshow how domain managers powerfully utilise the graphical analysis results to provide the holistic performanceimprovement and weakness resolution relationship rules. In the long run, organisations are able to use this frameworkto design and adjust their units to conform the exact customer needs. This paper introduces and explains a new ideaof measuring value added along the supply chain from a collaborative perspective. The extended model is adaptedfrom our previous model and from balanced scorecard model. It provides a tool to measure tangible and intangiblevalue between partners.
Keywords: supply chain collaboration; value creation; holistic performance enhancement road map K-Means; particleswarm intelligence; association rules
1. Introduction
In recent decade, many global organisations haveextensively integrated performance measurement andmanagement system (PMM) to supply chain management(SCM) which is time completive weapon. On the otherhands, they have also accumulated a ton of data fromPMM reports which came from each unit in SCM. Theseresult from the lack of holistic performance improvement(PM) which takes advantage from the right direction ofcollaborative PM. They still independently and individu-ally build their performance up; some of their linkages ofperformance attributes between supply chain (SC) unitsstill lack vital information extraction to improve theirs.Consequently, each SC unit does not have the applicableholistic PM roadmap development together. This leads tothe primary question of this article which is ‘How can weextract the vital information from a ton of PMM databaseusing data mining (DM) theory and concept?’
However, the DM concept and theory are applicabledirectly to marketing and business problems, but the PMMin SCM problem structure and database does not differfrom the former. Clustering and association rules have
been becoming the popular techniques in business researchfield. The PMM in SCM researches is still not certain oftangible and intangible benefits these may achieve. To pro-mote the use of the integration between K-Means base onparticle swarm optimisation (PSO) and association ruleswith PMM in SCM context is the challenge. All saidbefore is why DM concept and theory should be consid-ered as the potential approach to the PMM in SCM.
Therefore, this article proposes the implementation anddeployment of holistic performance enhancement road mapusing K-Means base on PSO and association rules for B2B-SCM context. The rest of this paper is organised as follows.The second section illustrates the fundamental of this researchand reviews-related literatures. The methodology of the pro-posed means is described in the third section. Results and dis-cussion are provided in the fourth section. The fifth sectionintroduces and explains a new idea of measuring value addedalong the SC from a collaborative perspective. The extendedmodel is adapted from our previous model and from balancedscorecard (BSC) model. It provides a tool to measure tangibleand intangible value between partners. Finally, the conclusionsand further research direction are warped up in the fifth section.
*Corresponding author. Email: [email protected] article was originally published with errors. This version has been corrected. Please see Corrigendum http://dx.doi.org/10.1080/09537287.2013.815387
Production Planning & Control, 2014Vol. 25, No. 11, 912–922, http://dx.doi.org/10.1080/09537287.2013.780313
� 2013 Taylor & Francis
Dow
nloa
ded
by [
Uni
vers
ity o
f W
est F
lori
da]
at 2
1:28
09
Oct
ober
201
4
2. Context and literature review
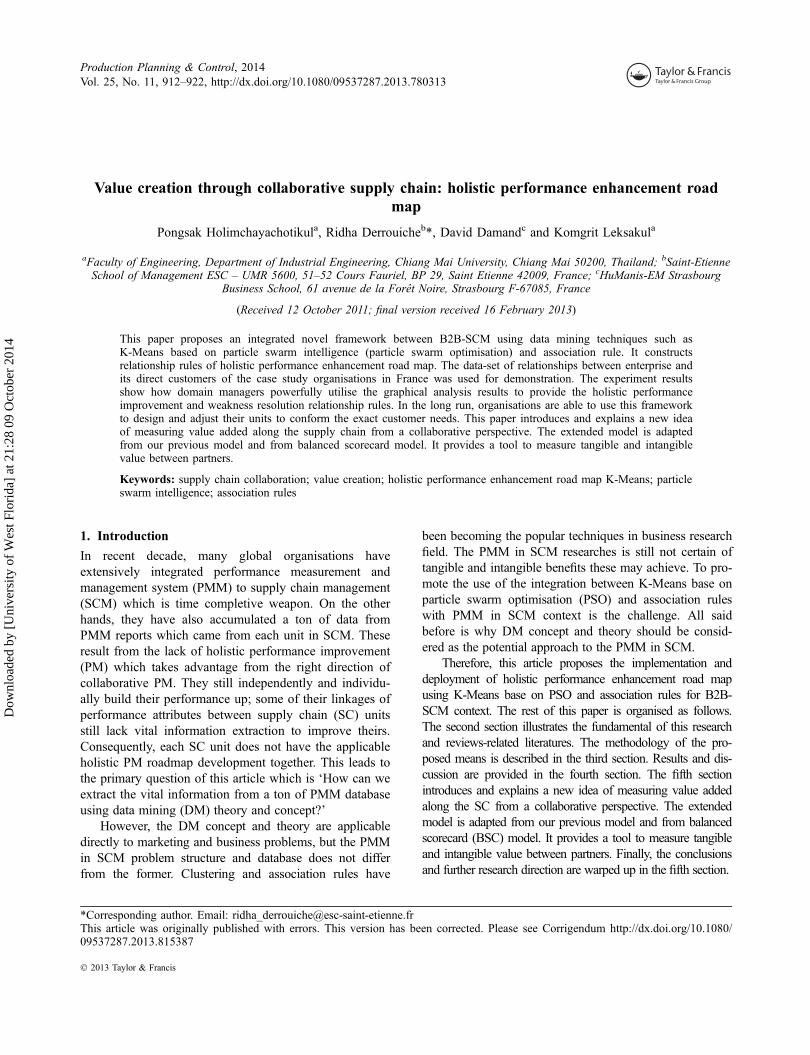
SC collaboration is often defined as two or more enter-prises working together to create a competitive advantageand higher profits that cannot be achieved by actingalone (Simatupang Togar and Sridharan 2005). In thispaper, the term collaboration is chosen to describe theclose cooperation among autonomous partners involvedin joint efforts to effectively meet end customer needswith lower costs (Figure 1).
The advent of SC collaboration creates the need, atinter-enterprises level, to pay special attention to theunderstanding of collaboration in order to prepare thepartners to create collaborative efforts successfully(Lambert, Knemeyer, and Gardner 2004). This sectionpresents a review of literature relevant to this research.This embraces many subjects in relative to main cores ofthe study which are momentarily described as follows.
2.1. A framework for measuring impact ofcollaboration on B2B-SCM interaction
The academic review and the empirical studies related tointernal and external collaborations led us to note thatthe different research analysed do not agree on a sameset of attributes to characterise the various relations.Even more, the attributes used to characterise a samerelation are often not the same ones.
Indeed several authors developed this question undervarious points of view such as: the degree of engagement
in a relation (Morgan and Hunt 1994), the long-termorientation of a relation (Ganesan 1994), the dependencebetween the partners (Crowston 1994; Lusch and Brown1996), the degree of exchange and share information (Lee,Padmanabhan, and Whang 1997; Li 2002), the duration ofthe relation (Ching, Holsapple, and Whinston, 1996), itsformalisation (Venkatraman and Bensaou 1996) and thecentralisation of decisions (Angeles and Nath 2001). Theconfidence between partners (Doney and Cannon 1997)appears as an important variable for analysing relationship(Uzzi 1997). The table below (Table 1) synthesises andclassifies the various studies according to the attributesused.
In these works, it is obvious that the majority ofresearches on the collaborative relations do not agree ona unique set of criteria (attributes) to typify relationsbetween partners of the same SC. After analysing theindependent attributes that can characterise a relation,this research will give a brief presentation of variousframeworks characterising a relation.
The outline proposed in this subsection climaxesdiverse scopes which can portray each type of relation; itis based on the above mentioned two levels: the contextof the relation and its performance (Figure 2). The chieflevel is composed of the following five dimensions:(1) climate of the relation, (2) structure of the relation,(3) information technologies (IT) used and (4) life cycleof the relation and external context. The subsequent levelis based on dual attributes: ‘the perceived satisfaction of
Figure 1. SC collaboration (Matopoulos et al. 2007).
Production Planning & Control 913
Dow
nloa
ded
by [
Uni
vers
ity o
f W
est F
lori
da]
at 2
1:28
09
Oct
ober
201
4

the relation’ and ‘the perceived effectiveness of therelation’. In this framework, the same dimensions andattributes can be used to analyse different types of rela-tions; their differences rely on the maturity level for eachattribute: the different dimensions of this frameworkexplain different degrees of collaboration between part-ners (Derrouiche et al. 2010).
2.2. Sequencing association rules
To discovery sequencing association rules (Agrawal,Imielinski, and Swami 1993) is a noteworthy DMapproach. There are some evidences of the trend ofassociation rule in many business researches. Thisreview indicated that association rule techniques usedin various business, but rather rely on the popularused in SCM in performance measurement have notdone very much. For example: depend on organisa-tional strategies which mainly concentrated onimprovement of customer service levels as well as
reduction of operational costs in order to maintainprofit margins. Therefore, Ko, Tiwari and Mehnen(2010) summarised the findings by a systematic reviewof existing research papers concerning the applicationof soft computing techniques to SCM. The amount ofstudies in the SCM area using soft computingapproaches rose significantly and reached a peak in2008, while some areas in SCM that had rarely beenexposed in existing papers, such as customer relation-ship management and reverse logistics. So they canbring the association rule DM techniques to applica-tions in the SC for example.
The greater the uncertainties in supply and demandand globalisation of the market in complex internationalsupply network relationships have led to higher exposureto risks in the SC. Therefore, He and Song (2009) usedassociation rules application for managing SC risk. Sup-plier selection is not only a significant work in SCM butalso a complex decision-making problem which includesboth qualitative and quantitative factors. Xu and Lin
Relation context
Relation ClimateCommitment
ConfidencePower Sharing
Goal Compatibility and Solidarity
Conflicts IntensityConflicts Solving
Relation StructureFlexibility
FormalizationReconfiguration Efforts
Control ActivitiesParticipation
Exchange InformationInterdependence
Finality (Objectives)Centralization of Decisions
DurationSales Turnover
IT Used in the Relation
Levels of IT UsedSatisfaction about IT Used
Negative Opinion
ContronationOpportunistBeing warySubmission
Non compatibleIntense
Negigence
ControlledRigid
ExplicitMinimum
ControlledIndividualized
OccasionalWeak
ContractorCentralized
ShortLess
LimitedNot useful at all
Not satisfied at all
Positive Opinion
CooperationCommittedEntrustingEquitable
CompatibleRare
Cooperative
CollaborativeFlexible
NormativeMaximumLiberated
ParticipativeFrequentIntensive
ComplementarySharedLong
Important
HighVery useful
Very satisfied
Performance perceivedPerceived SatisfactionPerceived effectiveness
Limited performanceNot benefit at all
Not efficiect at all
High performanceVery benefit Very efficiect
Figure 2. The framework to analyse a dyadic relation and to evaluate its performance.
914 P. Holimchayachotikul et al.
Dow
nloa
ded
by [
Uni
vers
ity o
f W
est F
lori
da]
at 2
1:28
09
Oct
ober
201
4
(2009) viewed the problem of ranking the candidatesupplier and mining a large of database of shipmentusing association rule mining. The paper has employed anumerical example for the integrated method for suitablesupplier set.
2.3. K-Means algorithm
K-Means is one of the modest unsupervised learningalgorithms that solved the famous clustering problem.The procedure like this is a basic practice to establish agiven data-set through a certain number of clusters(assume k clusters) fixing a priori (Ben-David, Pl, andSimon 2007; Borah and Ghose 2009). The chief idea isto outline k centroids, one for each cluster. These cen-troids should be placed in a cunning method on theground of dissimilar site which gives different results.So, the better choice is to place them as much as possi-ble far away from each other. The next step is to takeeach point belonging to a given data-set and associate itto the nearest centroid. When no point is pending, thefirst step is completed and an early group age is done.At this point, it is necessary to re-calculate k new cen-troids as bar centres of the clusters resulting from theprevious step. After obtaining these k new centroids, anew binding has to be done between the same data-setpoints and the nearest new centroid. A loop has beengenerated. As a result of this loop, one may notice thatthe k centroids change their location step by step untilno more changes are done. In other words centroids donot move any more. Finally, this algorithm aims at mini-mising an objective function, in this case a squared errorfunction.
2.4. Particle swarm intelligence
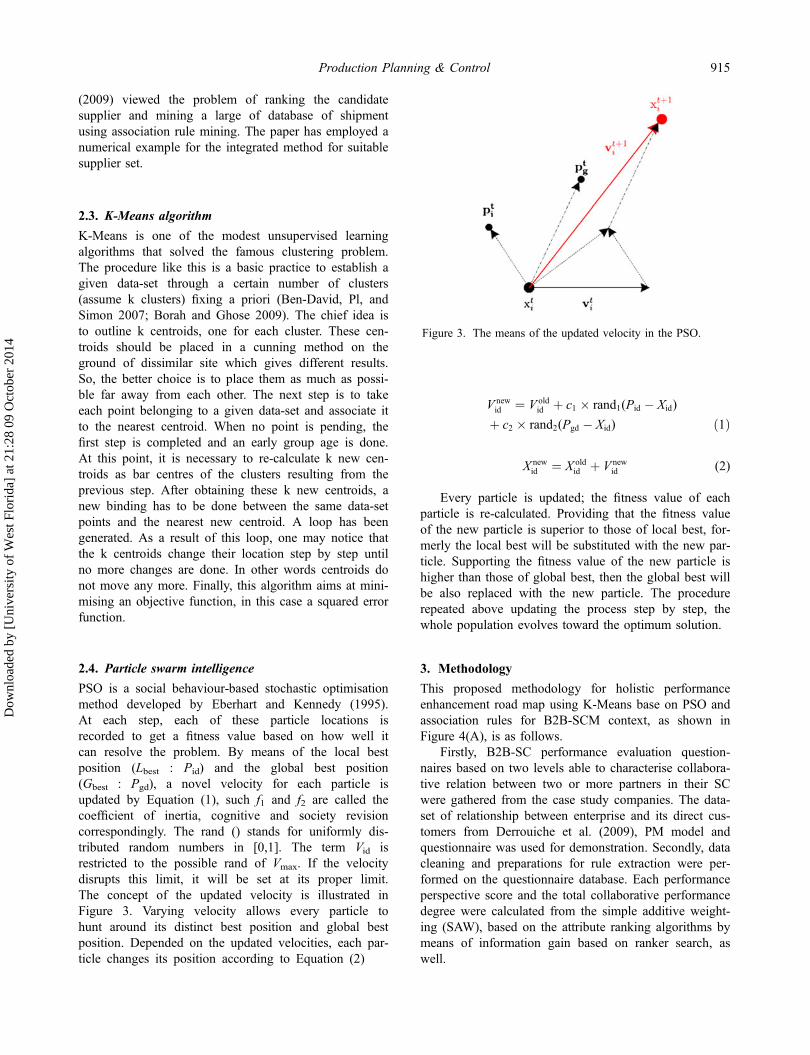
PSO is a social behaviour-based stochastic optimisationmethod developed by Eberhart and Kennedy (1995).At each step, each of these particle locations isrecorded to get a fitness value based on how well itcan resolve the problem. By means of the local bestposition (Lbest : Pid) and the global best position(Gbest : Pgd), a novel velocity for each particle isupdated by Equation (1), such f1 and f2 are called thecoefficient of inertia, cognitive and society revisioncorrespondingly. The rand () stands for uniformly dis-tributed random numbers in [0,1]. The term Vid isrestricted to the possible rand of Vmax. If the velocitydisrupts this limit, it will be set at its proper limit.The concept of the updated velocity is illustrated inFigure 3. Varying velocity allows every particle tohunt around its distinct best position and global bestposition. Depended on the updated velocities, each par-ticle changes its position according to Equation (2)
V newid ¼ V old
id þ c1 � rand1(Pid � Xid)
þ c2 � rand2(Pgd � Xid) ð1Þ
X newid ¼ X old
id þ V newid (2)
Every particle is updated; the fitness value of eachparticle is re-calculated. Providing that the fitness valueof the new particle is superior to those of local best, for-merly the local best will be substituted with the new par-ticle. Supporting the fitness value of the new particle ishigher than those of global best, then the global best willbe also replaced with the new particle. The procedurerepeated above updating the process step by step, thewhole population evolves toward the optimum solution.
3. Methodology
This proposed methodology for holistic performanceenhancement road map using K-Means base on PSO andassociation rules for B2B-SCM context, as shown inFigure 4(A), is as follows.
Firstly, B2B-SC performance evaluation question-naires based on two levels able to characterise collabora-tive relation between two or more partners in their SCwere gathered from the case study companies. The data-set of relationship between enterprise and its direct cus-tomers from Derrouiche et al. (2009), PM model andquestionnaire was used for demonstration. Secondly, datacleaning and preparations for rule extraction were per-formed on the questionnaire database. Each performanceperspective score and the total collaborative performancedegree were calculated from the simple additive weight-ing (SAW), based on the attribute ranking algorithms bymeans of information gain based on ranker search, aswell.
Figure 3. The means of the updated velocity in the PSO.
Production Planning & Control 915
Dow
nloa
ded
by [
Uni
vers
ity o
f W
est F
lori
da]
at 2
1:28
09
Oct
ober
201
4
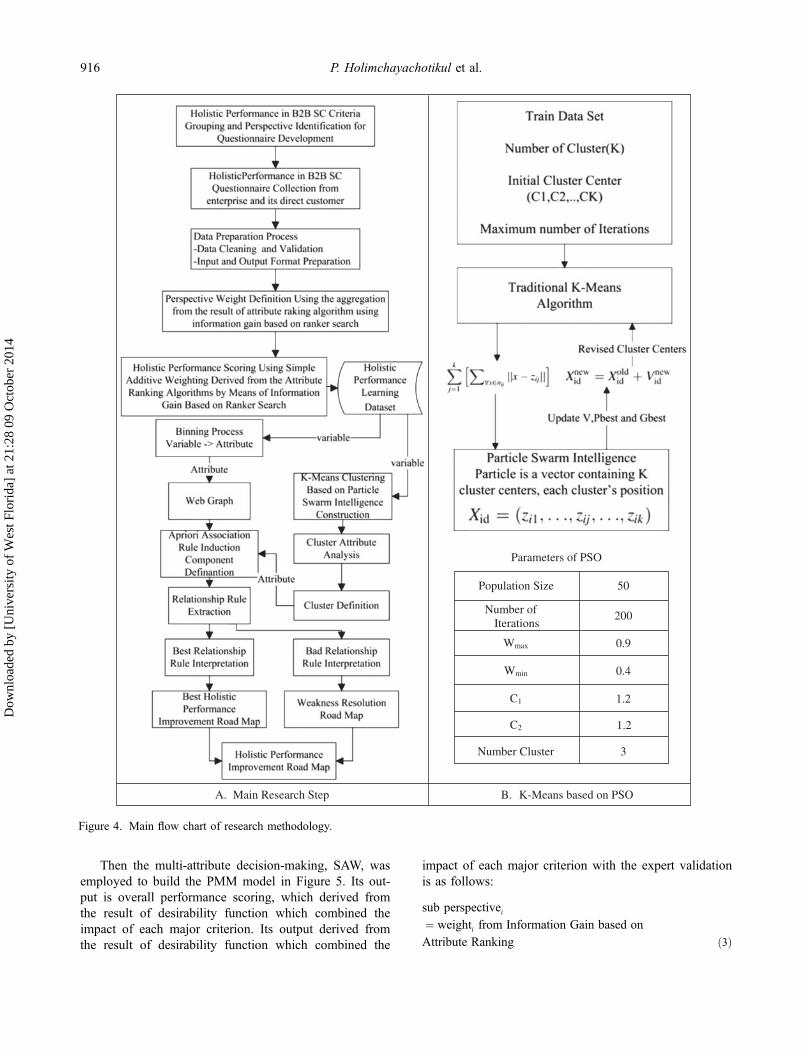
Then the multi-attribute decision-making, SAW, wasemployed to build the PMM model in Figure 5. Its out-put is overall performance scoring, which derived fromthe result of desirability function which combined theimpact of each major criterion. Its output derived fromthe result of desirability function which combined the
impact of each major criterion with the expert validationis as follows:
sub perspectivei¼ weighti from Information Gain based on
Attribute Ranking ð3Þ
Parameters of PSO
Population Size 50
Number of Iterations
200
Wmax 0.9
Wmin 0.4
C1 1.2
C2 1.2
Number Cluster 3
A. Main Research Step B. K-Means based on PSO
Figure 4. Main flow chart of research methodology.
916 P. Holimchayachotikul et al.
Dow
nloa
ded
by [
Uni
vers
ity o
f W
est F
lori
da]
at 2
1:28
09
Oct
ober
201
4

weight of sub perspectivei
¼ sub perspectivei
�Xn
i¼1
sub perspectivei (4)
weight of minor perspectivej
¼Xn
i¼1
weight of sub prespectiveij
8j : j ¼ 1; . . . ; m
(5)
weight of major perspectivek
¼Xmj¼1
weight of minor prespectivejk
8k : k ¼ 1; . . . ; p
(6)
Overall Performance Scorel ¼XMk¼1
weight of major prespectivelk(mlk)normal from 3rd step
8k : k ¼ 1; . . . ; p ð7Þ
Desirability function
yl ¼ fd(Overall Performance Scorel) (8)
di ¼ ftarget(yl) ¼0 y\Ly�LT�L
� �L\y\T
U�yU�T
� �T\y\U
0 U[y
8>><>>:
(9)
Thirdly, K-Means based on PSO was opted for per-formance cluster construction, using parameter setting inFigure 4(B), and the domain experts defined the perfor-mance of each cluster based on the statistical informa-tion. Before web graph and association rules process,fixed-width binning method was used as attribute typeconvertor from continuous (Variable) to discrete value(Attribute). Fourthly, web graph analysis was performedon this data to confirm the strong perspective relation-ship. Next, sequencing association rule was deployed toextract performance perspective relationship rules foreach relationship type. The quality of each recognisedrule is tested and, from numerous rules, only those thatare statistically very strong and contain vital informationare selected. Last but not least, these rules are interpreted
Figure 5. PMM and performance cluster model.
Production Planning & Control 917
Dow
nloa
ded
by [
Uni
vers
ity o
f W
est F
lori
da]
at 2
1:28
09
Oct
ober
201
4

by domain experts and studied by domain engineers tobuild a holistic performance perspective enhancementroad map. Furthermore, the final rule set of extractedrules contains very interesting information relating toSCs and also point out the critical existing SC attributeimprovement.
After the data-set of relationship between enterpriseand its direct customer questionnaire gathering accordingto Derrouiche et al. (2009), PMM model was constructedfollowing SAW approach based on the attribute rankingalgorithms by means of information gain based on rankersearch. The overall performance was also calculated by
Table 1. Synthesis of different attributes used in the literature review.
Table 2. PMM and performance cluster model results.
918 P. Holimchayachotikul et al.
Dow
nloa
ded
by [
Uni
vers
ity o
f W
est F
lori
da]
at 2
1:28
09
Oct
ober
201
4

desirability function. At this stage, the overall perfor-mance and minor criteria value were obtained as theK-Means based on PSO inputs. In this research, thenumber of cluster was assigned as three clusters due tothe industry performance. There are cluster A (highperformance), cluster B (low performance) and cluster C(medium performance). There are many recent researchesthat have compared traditional K-Means and many kindsof K-Means based on PSO in many benchmarking UCIMachine Learning Repository databases such as Iris,Wine, Diabetes and etc (Chandra, Satapathy, and Orissa2009). Therefore, K-Means based on PSO was used ascluster method of this research.
4. Results and discussion
Performance cluster model was built by K-Means basedon PSO which used parameters following 200 iterations,50 particles, 0.9 of Wmax 0.4 of Wmin and 1.2 for both ofC1 and C2. After performance of cluster model construc-tion of this setting, the experimental result showed thatthis process consumed approximately 0.759 s of compu-tational time and the percentage membership volume ineach cluster was 50, 29 and 11%.
From Table 2, it is found that the top minor per-spective impacts on holistic performance score to thebest relationship types are engagement and commit-ment, confidence, power exerted, compatibility andsolidarity and interdependence while the top minor per-spective impacts on holistic performance score to theworst relationship types are engagement and commit-ment, confidence, power exerted, time experience andturnover. The maximum holistic performance score is68.0651 from cluster A (best relationship) while theminimum of holistic performance score is 39.5327from cluster B (worst relationship). Primarily, the dif-ference of top minor perspective values between clus-ter A (best relationship) and cluster B (worstrelationship) can provide and guide the domain manag-ers. One of main contribution of performance clustermodel is to answer the question ‘Where we are inindustry in term of B2B-SCM performance’.
If they are member of cluster B (worst relationship),they should improve some of minor perspective perfor-mances such as engagement and commitment, confi-dence, power exerted, finance and the others in order tomove their position to better position in the new cluster.This holistic PM tendency was proposed from the meanof each cluster analysis. In real practice, domain manag-ers should concern and take into account the standarddeviation of minor perspectives in each cluster the prosand cons of the expected results of mean analysis usage.To know and learn from the repeated event and patternwhich happened in their PMM model is the promising
way to understand why the hidden relationship amongminor perspectives.
Fixed-width binning method was used as attributetype convertor from continuous (Variable) to discretevalue (Attribute). Five was assigned as bin number forthis process. As a result, this stage obtained the new dis-crete minor perspective factors, for example, the holisticover performance was converted into 5 bins, matrix plotamong the holistic overall performance bin, cluster num-ber, relationship type and the top impact of minor per-spective bin factors which were conducted to investigate‘Why do their performance perform like that?’ What ismore, the domain mangers and experts in this B2B-SCMcan use the graphical matrix to find the approximatedways to move the performance position as they designed,for instance, their present performance position in clusterA with worst relationship; they can efficiently use thischart to understand how member in cluster A gives goodperformance in term of B2B-SCM and sustains their bestrelationship by keeping the both level of engagementand IT utilisation at fifth bin. On the other hand, we canunderstand how member in cluster B gives bad perfor-mance by using the matrix plot of worst relationship. Wecan notice that both levels of engagement and IT utilisa-tion of cluster B with worst relationship performed atfirst bin.
Finally, the sequencing association rules method wasaccomplished based on the two data-sets. The formerwas the best relationship and the later was the worstrelationship data-set to develop the B2B-SCM PM roadmap and recognise the top softness and glitches betweenenterprise and its direct customers. In this research, thevalue support and confidence was assigned as 40 and80%, respectively. Consequently, the sequencing associa-tion prototype model delivered that the attentive ruleshave also purely taken out following 40% of minimumsupport and 80% of minimum confidence constructionelement of sequencing association rule induction.
5. Extended framework: exploring value creation usingbalanced scorecard perspective
This section introduces and explains the concept of mea-suring value added along the SC from a collaborativeperspective. The extended model is adapted from ourprevious model (Figure 2) and from BSC model (Brewerand Speh 2000; Kaplan and Norton 1996). It provides atool to measure tangible and intangible value betweenpartners (Figure 6).
According to Clements Michael and Price Nigel(2007), value added refers to any additional value cre-ated at a particular stage of production by key produc-tion factors including: tangible value added through rawmaterial transformation, labour and capital goods, andintangible value added through intellectual capital (use
Production Planning & Control 919
Dow
nloa
ded
by [
Uni
vers
ity o
f W
est F
lori
da]
at 2
1:28
09
Oct
ober
201
4

of knowledge assets) and relational exchange i.e. thebuilding of collaborative relationships. The BSCproposed by Kaplan and Norton (1996) which is intro-duced by Brewer and Speh (2000) as a viable basis todevelop a framework assists in the measurement of tan-gible and intangible value added in SCs from the transferpricing perspective. Brewer and Speh (2000) highlighthow a BSC approach can improve the SC throughimproving collaboration and leveraging the knowledgeof SC partners, redesigning products and processes,improving information management to compliment deci-sion-making and better monitor the external market.
In our context, we introduce Brewer and Speh’s (2000)framework to replace the second level of our previousframework ‘Performances perceived: Perceived satisfac-tion and Perceived effectiveness’ by ‘Total Value-Added:Tangible Value-added and Intangible Value-added’.
Of course, this is just a first draft of a tool to mea-sure a total value-added tangible and intangible valuebetween partners. The problem of the performance isvery difficult to fix in such a case, because in mostcases, it is not possible to get a quantitative measure ofthe performance of one interaction. This point could beimproved by proposing key performance indicators, notfor a process or an activity, but for an interaction.
6. Conclusion
This article has designated and constructed the novelapplication of holistic performance enhancement roadmap using K-Means based on PSO and association rulesfor B2B-SCM developing relationship rules of theholistic performance attribute enhancement road map.Subsequently, the implementation of the result is pro-longed for the B2B-SCM development road map strate-gies to endorse the right way for holistic performanceupgrading, to solve the conflict among the attributes andto eradicate the weakness issues. It is powerful and easyfor the B2B-SCM invokers to implement since the out-comes are revealed in the energetic rules and the basicgraphical matrix plot, which derived from the results of
binning and K-Means based on PSO and expert valida-tion. This demonstration is constructed by a qualitativeand very subjective method by which domain managersreflect the role of each performance perspective and itsinfluence on the performance. There are many factsregarding the association rules procedure, for instance,the fundamental success aspect of this method relies onthe quality of the primary database, data cleaning anddata preparation. The fuzzy theory can be practical tomodel the subjective perspectives before the associa-tion rule process. The future research is to modifyand upgrade this framework using the other modernevolutionary and fuzzy theory.
This paper has introduced the concept of measuringvalue added along the SC from a collaborative perspec-tive. The extended model was adapted from our previousmodel and from BSC. Of course, it was just a first draftof a tool to measure tangible and intangible valuebetween partners. The problem of the performance isvery difficult to fix in such a case, because in mostcases, it is not possible to get a quantitative measure ofthe performance of one interaction. This point could beimproved by proposing key performance indicators, notfor a process or an activity, but for an interaction.
AcknowledgementFinancial support was provided by the Thailand Research Fund(TRF) through the Royal Golden Jubilee (RGJ) PhD Program(PHD/0090/2553).
Notes on contributorsPongsak Holimchayachotikul is a PhDstudent at Department of IndustrialEngineering, Chiang Mai University,Thailand. He was also Eramus Mundusdoctoral student at Department of MaterialsEngineering and Operations ManagementUniversity of Naples ‘Federico II’, Italy in2010. He received MEng in IndustrialEngineering and BEng in Computer
Engineering at Chiang Mai University, Thailand in 2008 and2006, respectively. His research interests include performance
Figure 6. A collaborative SC BSC framework.
920 P. Holimchayachotikul et al.
Dow
nloa
ded
by [
Uni
vers
ity o
f W
est F
lori
da]
at 2
1:28
09
Oct
ober
201
4

measurement system, supply chain and logistics management,advanced data mining, optimisation, decision-making formanagement and applied operations research.
Ridha Derrouiche is currently an assistantprofessor of Supply Chain Managementand Operations Management at Saint-Etienne School of Management (SESOM).He is a member of the UMR 5600 andLSTI laboratory (Saint-Etienne-France). Hegot his PhD in Industrial Engineering in2007 at the University Lumière Lyon II.His research interests are mainly related tosupply chain management, performance and
value creation through collaborative. Before joining SESOM,he was the director of the Franco-Thai ICT Centre and lecturerat Chiang Mai University (Thailand). He was the Ethics-Fedassistant project coordinator (Euro THai Implementation ofCooperative Study-For Economic Development). He hasparticipated in several research and educational projects.
David Damand is an associate professor inSupply Chain Management at EMStrasbourg Business School, France. He is amember of the HuManis laboratory(Humans and Management in Society). Hisresearch addresses the applications ofproduction planning and control and theoryof inventive problem-solving in the area ofmanagement and design of production
systems. Most of his research is undertaken in partnership withcompanies.
Komgrit Leksakul graduated from AsianInstitute of Technology, with a DEng degreein Industrial Engineering, since 2005. He iscurrently an associate professor at theDepartment of Industrial Engineering atChiangMai University. His main researchinterests are in the fields of deterministicand stochastic Optimisation, application ofneural network and fuzzy system. Besides
the Industrial Engineering field, he is currently interested inadvance manufacturing including micro-electro-mechanicalsystem and plasma technology.
References
Agrawal, R., T. Imielinski, and A. Swami. 1993. “MiningAssociation Rules between Sets of Items in Large Dat-abases.” In Proceedings of the 1993 ACM SIGMOD (ACMSpecial Interest Group on Management of Data), 207–216,Washington, DC.
Angeles, R., and R. Nath. 2001. “Partner Congruence in Elec-tronic Data Interchange Enabled Relationships.” Journal ofBusiness Logistics 22 (2): 109–127.
Ben-David, S., D. Pl, and H. U. Simon. 2007. “Stability ofK-Means Clustering.” Lecture Notes in Artificial Intelli-gence and Bioinformatics (LNAI) 4539: 20–34.
Borah, S., and M. K. Ghose. 2009. “Performance Analysis ofAIM-K-Means and K-Means in Quality Cluster Genera-tion.” Journal of Computing 1 (1): 175–178.
Brewer, P. C., and T. W. Speh. 2000. “Using the BalancedScorecard to Measure Supply Chain Performance.” Journalof Business Logistics 21 (1): 75–93.
Chandra, S. N., A. Satapathy, and B. Orissa. 2009. “Perfor-mance Comparisons of PSO Based Clustering.” InterJRIComputer Science and Networking 1: 18–23.
Ching, C., C. W. Holsapple, and A. B. Whinston. 1996.“Toward IT Support for Coordination in Network Organiza-tions.” Information and Management 30 (4): 179–199.
Clements Michael, D. J., and J. Price Nigel. 2007. “A TransferPricing Apparatus for Measuring Value Added along theSupply Chain: Reflections for Internet Based.” Inter-Organ-isational Relationships 4: 2–20.
Crowston, K. 1994. A Taxonomy of Organizational Dependen-cies and Coordination Mechanism. Accessed July 2011.http://www.ccs.mit.edu/papers/CCSWP174.html.
Derrouiche, R., P. Holimchayachotikul, N. Chakpitak, G. Neu-bert, and A. Bouras. 2009. Enhancing Performance in B2BSupply Chain Collaboration Using Simulation. Interna-tional Conference on Integrated Design and Production(CPI’09), Fes, Morocco, October 19–21.
Derrouiche, R., G. Neubert, A. Bouras, and M. Savino. 2010.“B2B Relationship Management: A Framework to ExploreImpact of Collaboration.” International Journal of Produc-tion Planning & Control (IJPPC) 21 (6): 528–546.
Doney, P. M., and J. P. Cannon. 1997. “An Examination of theNature of Trust in Buyer–Seller Relationships.” Journal ofMarketing 61: 35–51.
Eberhart, R., and J. Kennedy. 1995. “New Optimizer UsingParticle Swarm Theory.” In Proceedings of the Interna-tional Symposium on Micro Machine and Human Science,39–43, Nagoya, Japan.
Ganesan, S. 1994. “Determinants of Long Term Orientation inBuyer–Seller Relationships.” Journal of Marketing 58 (2):1–19.
He, B. H., and G. F. Song. 2009. “Knowledge Managementand Data Mining for Supply Chain Risk Management.” InInternational Conference on Management and ServiceScience, MASS 2009, Wuhan, China.
Kaplan, R. S., and D. P. Norton. 1996. Translating Strategyinto Action: The Balanced Scorecard. Boston, MA: Har-vard Business School Press.
Ko, M., A. Tiwari, and J. Mehnen. 2010. “A Review of SoftComputing Applications in Supply Chain Management.”Applied Soft Computing Journal 10: 661–674.
Lambert, D. M., A. M. Knemeyer, and J. T. Gardner. 2004.“Supply Chain Partnerships: Model Validation and Imple-mentation.” Journal of Business Logistics 25 (2): 21–42.
Lee, H. L., V. Padmanabhan, and S. Whang. 1997. “Informa-tion Distortion in a Supply Chain: The Bullwhip Effect.”Management Science 43 (4): 546–558.
Li, L. 2002. “Information Sharing in a Supply Chain with Horizon-tal Competition.”Management Science 48 (9): 1196–1212.
Lusch, R. F., and J. R. Brown. 1996. “Interdependency, Con-tracting and Relational Behavior in Marketing Channels.”Journal of Marketing 60: 19–38.
Matopoulos, A., M. Vlachopoulou, V. Manthou, and B. Manos.2007. “A Conceptual Framework for Supply Chain Collab-oration: Empirical Evidence from the Agri-Food Industry.”Supply Chain Management: An International Journal 12(3): 177–186.
Production Planning & Control 921
Dow
nloa
ded
by [
Uni
vers
ity o
f W
est F
lori
da]
at 2
1:28
09
Oct
ober
201
4

Morgan, R., and S. Hunt. 1994. “The Commitment Trust Theoryof Relationship Marketing.” Journal of Marketing 58: 20–38.
Simatupang Togar, M., and R. Sridharan. 2005. “An IntegrativeFramework for Supply Chain Collaboration.” InternationalJournal of Logistics Management 16 (2): 257–274.
Uzzi, B. 1997. “Social Structure and Competition in Inter FirmNetwork: The Paradox of Embeddedness.” AdministrativeScience Quarterly 42: 35–67.
Venkatraman, N., and M. Bensaou. 1996. “Inter-OrganizationalRelationships and Information Technology: A ConceptualSynthesis and a Research Framework.” European Journalof Information Systems 5 (2): 84–91.
Xu, X., and J. Lin. 2009. “An Integrated Method to Discover-ing Key Suppliers in Supplier Chain Management.” Journalof Computational Information Systems 5: 1445–1452.
922 P. Holimchayachotikul et al.
Dow
nloa
ded
by [
Uni
vers
ity o
f W
est F
lori
da]
at 2
1:28
09
Oct
ober
201
4