Embed Size (px)
Citation preview

Value-Creation in Strategic Alliance Portfolios and
the Moderating Role of Environmental Munificence
Kimin Kim
Strategy and Organization Area
Desautels Faculty of Management
McGill University, Montreal
August 2010
A thesis submitted to McGill University in partial fulfillment of the requirements of the degree
of Doctor of Philosophy
© Kimin Kim 2010

ii
This page left intentionally blank.

iii
Abstract
Prior research on alliance portfolios has concentrated primarily on the
focal firm as the recipient of benefits or bearer of risks derived from its alliance
portfolio. However, since partners co-create benefits and share the risks together
with the focal firm, positive or negative values may be created and shared
between the focal firm and its partners. In this thesis, we posit that value-creation
occurs between the focal firm and the partners in an alliance portfolio, and
examine how the portfolio configuration (i.e., the size, diversity, and density)
influences the stock market’s valuation of the partners following the
announcements of a major event involving the focal firm. Furthermore, we
examine how environmental munificence moderates the relationship between the
portfolio configuration and the stock market’s valuation of the partners.
To test the hypotheses we map two sets of alliance portfolios of 120 focal
firms in the U.S. Internet sector: during 1995-1999 for a high munificence
environment and during 1999-2003 for a low munificence environment. Using
event study methods, we find that firms that allied to a focal firm that maintains
higher portfolio diversity and/or higher portfolio density are likely to enjoy
greater abnormal returns when the focal firm announces corporate events. We also
find that portfolio density is likely to be associated with higher abnormal returns
in low munificence environments than in high munificence environments.
This doctoral thesis advances alliance portfolio research and event study
research by investigating performance implications of the portfolio configuration

iv
from the perspective of the impact on partners rather than the focal firm.
Moreover, our findings provide practitioners with prescriptive guidance and
assistance with respect to alliance-related decision-makings.
v
Résumé
Les recherches précédentes sur les portefeuilles d'alliances sont
principalement concentrées sur les firmes focales en tant que récipiendaires de
bénéfices ou porteuses des risques dérivés de leurs portefeuilles d'alliances.
Cependant, comme les partenaires co-produisent les bénéfices et partagent les
risques ensemble, et avec la firme focale, des valeurs positives ou négatives
peuvent être créées et partagées entre la firme focale et ses partenaires. Dans cette
thèse, nous postulons que, dans un portefeuille d'alliances, il y a production de
valeur-création entre la firme focale et ses partenaires. Nous examinons comment
la configuration du portefeuille (i.e., sa grandeur, sa diversité et sa densité)
influence l'évaluation boursière des partenaires après l'annonce d'un évènement
majeur impliquant la firme focale. En outre, nous examinons comment la
munificence de l'environnement modère la relation entre la configuration du
portefeuille et l'évaluation en bourse des partenaires.
Afin de tester nos hypothèses, nous considérons deux groupes de
portefeuilles d'alliances de 120 firmes focales oeuvrant dans le secteur de
l'Internet aux États-Unis durant la période 1995-1999 pour un environnement de
haute munificence et la période 1999-2003 pour un environnement de faible
munificence.
À l'aide de la méthode d'étude d'évènements, nous constatons que les
firmes qui se sont associées à une firme focale qui maintient un plus grand degré
de diversité et/ou de densité dans son portefeuille sont susceptibles de jouir d'une
plus grande rentabilité anormale lors de l'annonce d'évènements corporatifs par la

vi
firme focale. Nous constatons aussi que la densité du portefeuille est
probablement associée à une plus grande rentabilité anormale dans un
environnement de faible munificence que dans un environnement de haute
munificence.
En examinant les implications de la performance de la configuration du
portefeuille du point de vue de son impact sur les partenaires plutôt que sur la
firme focale, cette thèse contribue à la recherche sur les portefeuilles d'alliances
ainsi que la recherche sur les études d'évènements. De plus, nos résultats profitent
aux praticiens en leur fournissant une meilleure compréhension des portefeuilles
d'alliances et de la performance qui facilitera la prise de décision au regard des
alliances.

vii
Acknowledgements
It has been a long journey; it started in 2001 when my then-employer KT
(Korea Telecom) agreed to support me in my pursuit of a PhD (thanks KT!). This
initial phase of my doctorate, during which I wholeheartedly explored the
intellectual frontiers of the field, was interrupted in 2005 when KT requested that
I come back to work in Korea. I resumed my studies in 2009, and am now
approaching the finish line as I submit this thesis. In this long journey, I have met
many extraordinary individuals to whom I would like to express my appreciation.
First and foremost, the completion of this thesis would not have been
possible without the insightful guidance and instruction of my supervisors,
Professors Jan Jörgensen and Wonseok Oh, who have always been ready to give
thoughtful advice and warm encouragement. They have helped me to more clearly
consider other standpoints, think deeper, and pursue better solutions, not just in
research but also in life. Working with them was an invaluable learning
experience. I am very fortunate to have them and remain deeply indebted to them.
It has been a great honor as well to learn from all my committee members:
Professors Michael Carney, Jorge Niosi, and Hamid Etemad. Their valuable
comments and feedback, in different stages of my doctoral studies, have allowed
me to advance, improve, and enrich this work. The diverse perspectives that I
have learned from them will allow me to go beyond this thesis and develop new
directions for my future research.
I would also like to express my appreciation to Professors Jin Nam Choi,
Robert David, Margaret Graham, Mary Dean Lee, Henry Mintzberg, Paola Perez-

viii
Aleman, and George Alex Whitmore. In the classes, seminars, and workshops that
they led, these extraordinary scholars have given me both the inspiration and the
aspiration to become an academic of similar standing. My fellow PhD students
have never made me feel alone in the journey. Being in the “same boat,” they
have never been reluctant to help me, either intellectually or emotionally. Some of
them have left the program to pursue other interests, many have graduated, and
others remain; but all of them will be with me in my memory. Thanks are due to
Ms. Stella Scalia, Mr. Pierre Cambron, Mr. Hector Cantor, and Mr. Antero
Branco, whose excellent administrative and technical services have allowed me to
more easily pursue my research.
I express my gratitude to my parents and parents-in-law. They survived
through the war when still very young and worked very hard throughout their
entire lives. They have encouraged me to meet any challenge and have always
given me their unconditional support. They will remain my models for continued
progress in the school of life. I extend thanks to Gibo Shim, Kyungim Min,
Kyungjoon Min, and Joonkeun Kim, all dear friends in Korea who have taken
care of my parents as they do their own. I am deeply indebted to them.
Finally, I must thank my wife, Jeong Hwa Seo. Marrying her has been my
greatest achievement. I cannot express in words my appreciation for all she has
done to support me during this long journey. My children, Hyunteh and Gyoorie,
have likewise always supported me in their own unique ways. I know that they
have long (and patiently) waited for this moment, and I am so glad that we can
finally share the joy of completion of my PhD together.

ix
TABLE OF CONTENTS
Chapter 1. Introduction 1
Chapter 2. Literature Review 7
2.1. Motivations for alliance formation 7
2.2. Strategic alliances and firm performance 10
2.2.1. Dyadic alliances and firm performance 12
2.2.2. Alliance networks and firm performance 19
2.2.3. Alliance Portfolios and firm performance 22
2.3. Environmental munificence 26
Chapter 3. Theory and Hypotheses 33
3.1. Value-creation in alliance portfolios 33
3.2. The configuration of alliance portfolios 35
3.2.1. Portfolio size 36
3.2.2. Portfolio size and environmental munificence 38
3.2.3. Portfolio diversity 39
3.2.4. Portfolio diversity and environmental munificence 43
3.2.5. Portfolio density 44
3.2.6. Portfolio density and environmental munificence 47
Chapter 4. Data and Methods 51
4.1. Research setting 51
4.2. Sample and data 52
4.3. Methods 56
4.4. Variable description 57
4.4.1. Dependent variable: partners’ abnormal returns 57
4.4.2. Independent variables 58
4.4.3. Moderator: environnemental munificence 61
x
4.4.4. Interaction variables 61
4.4.5. Control variables 62
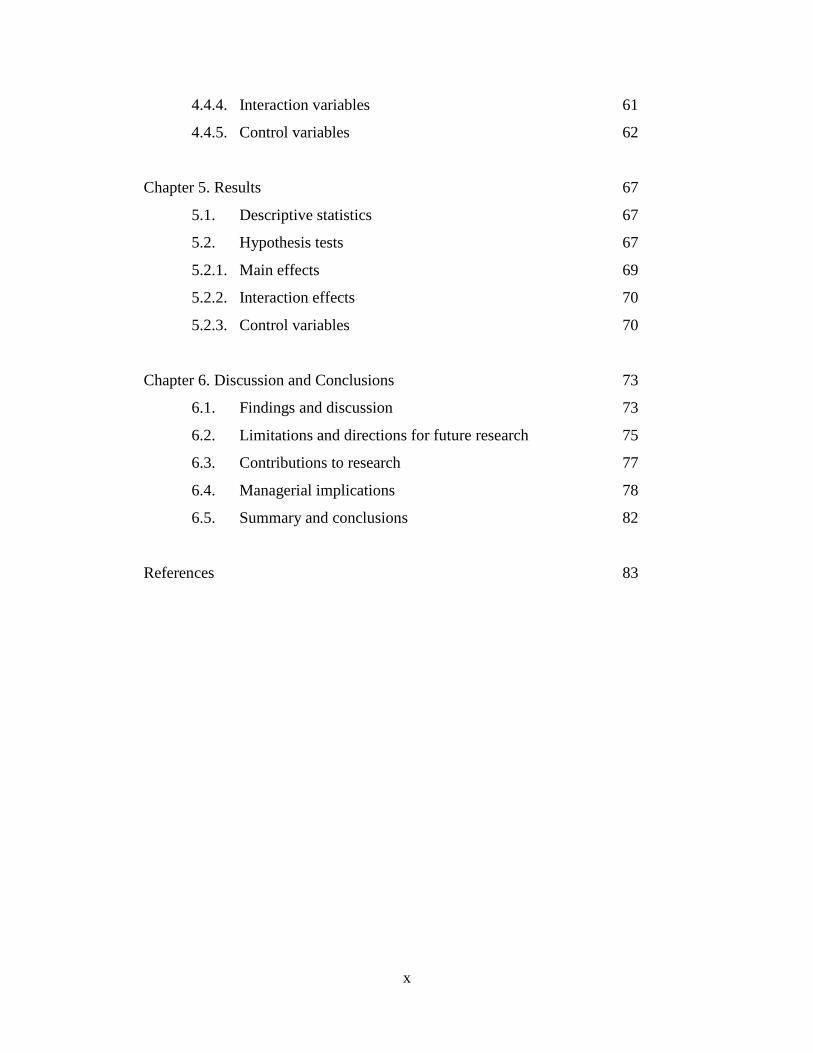
Chapter 5. Results 67
5.1. Descriptive statistics 67
5.2. Hypothesis tests 67
5.2.1. Main effects 69
5.2.2. Interaction effects 70
5.2.3. Control variables 70
Chapter 6. Discussion and Conclusions 73
6.1. Findings and discussion 73
6.2. Limitations and directions for future research 75
6.3. Contributions to research 77
6.4. Managerial implications 78
6.5. Summary and conclusions 82
References 83

xi
List of Tables
Table Page
Table 1. Key perspectives on the motivations for alliance formation 8
Table 2. Key empirical research on the performance implications of
strategic alliances 15
Table 3. Key empirical research on the role of environmental munificence 31
Table 4. Sample and data 55
Table 5. Differences between high and low environmental munificence 62
Table 6. Descriptions of variables 65
Table 7. Means, standard deviation, and correlations 68
Table 8. Results of regression analysis 69
List of Figures
Figure Page
Figure 1. Three analysis levels: Dyadic, Networks, and Portfolios 11
Figure 2. Theoretical framework and hypotheses 49
Figure 3. Research setting 52
Figure 4. Results of hypothesis tests 71

xii
This page left intentionally blank.

- 1 -
Chapter 1. Introduction
Strategic alliances have long been touted as a corporate resource, which
can affect the growth, performance, or even survival of firms. The strategic
significance of such inter-organizational forms has grown rapidly in recent years
as business environments have become increasingly turbulent and competitive.
The formation of strategic alliances (Gulati & Gargiulo, 1999; Pfeffer, 1987) and
their impacts on firm performance (Baum, Calabrese, & Silverman, 2000; Stuart,
2000) have long been investigated from varied perspectives including transaction
cost economics (Williamson, 1975, 1985), resource dependence perspective
(Pfeffer, 1981, 1987; Pfeffer & Salancik, 1978), resource-based view (Barney,
1991; Eisenhardt & Schoonhoven, 1996; Wernerfelt, 1984), social capital theory
(Coleman, 1988; Knoke, 2009; Koka & Prescott, 2002), and social network
theory (Burt, 1992; Granovetter, 1985; Gulati, 1998).
The levels of analysis in prior research are, however, also varied. In the
present study, we review extant research on strategic alliances and firm
performance across the three levels of analysis: micro- (i.e., dyadic alliances),
macro- (i.e., alliance networks), and mezo-level (i.e., alliance portfolios). And, for
the purpose of the study, we concentrate on the alliance portfolios which are
comprised of “all the alliances of the focal firm” (Hoffmann, 2007), and their
association with firm performance.
Although variations exist in their specific objectives and expectations,
firms generally engage in alliances in pursuit of creating benefits and sharing of
- 2 -
risks (Das & Teng, 1999; Mitchell & Singh, 1996). Strategic alliances are fraught
with risk and typically require a significant amount of resources and commitment
for long periods of time (White & Lui, 2005). Given that directly or indirectly
allied firms within an alliance portfolio are “in the same boat” in that they co-
create the rewards and share the risks (Das & Teng, 1999), any major event,
whether positive or negative, that impacts on one firm is likely to impact on
others. In particular, an event that is strategically important to a focal firm may
influence the investors’ valuations of not only the focal firm itself but also the
partner firms with which the focal firm allied. For example, if Yahoo! announces
that its earnings are strikingly lower (or higher) than expected, this performance is
likely to shatter (or boost) investors’ confidence in the alliance initiatives formed
by Yahoo! and, subsequently, negatively (or positively) affect the expected
profitability of its alliance partners. Consequently, a value-creation and a risk-
sharing will take place among the firms embedded in an alliance portfolio.
Previous studies have revealed that the structure and composition of
alliance portfolios have an important performance implication for the focal firm
because they play a crucial role in mobilizing and activating resources within, as
well as across, its firm boundaries (Dyer & Singh, 1998; Gulati, 1998; 1999). By
contrast, little is known about how the configuration of the focal firm’s alliance
portfolio influences the future profitability of its partner firms who determine, to a
large extent, the structural and relational characteristics of the alliance portfolio
(Stuart, 2000).
The thesis therefore examines the following research questions:
- 3 -
• How does the size of the alliance portfolio affect the value of the
partners upon the announcement of new events by the focal firm?
• What role does the partners’ diversity play in creating value for them?
• To what extent does the alliance portfolio density impact the value of
the partner firms?
Our study seeks to fill this void to shed light on the alliance portfolio from the
perspective of the impact on partners rather than the focal firm or rivals.
The extant literature indicates that when environmental munificence, the
given level of resources in a particular environment (Randolph & Dess, 1984;
Staw & Szwajkowski, 1975), is high (resources available outside the firm are
abundant), the firm can exploit the resources to its own benefit and, therefore,
becomes more capable and competent (Castrogiovanni, 1991). In contrast, when
environmental munificence is low (resources are scarcely available), the firm is
forced to compete more intensely, and consequently, its performance or even
survival can be jeopardized (Khandwalla, 1973; Staw & Szwajkowski, 1975).
Drawing on this perspective, Park and Mezias (2005) assess how environmental
munificence governs the stock market’s reaction to e-commerce alliances by
focusing on two distinct periods, that is, before and after the technology sector
crash in 2000.
Extending this line of research, we examine the following additional
research question:
- 4 -
• How does environmental munificence moderate the interplay between
the properties of alliance portfolios and the valuation of the partner
firms?
To address these questions, we first explore the essential configuration
parameters of the alliance portfolio which most affect the valuation of the partners
that are members of the alliance portfolio. Then, based on the event study method,
we investigate how the configuration parameters affect the market value of the
partners following the announcement of a new major event involving the focal
firm. Furthermore, through the lens of environmental munificence, we examine
whether the relationship between portfolio characteristics and the stock market
reaction to partner firms is moderated by the extent of environmental munificence.
This study makes the following contributions to research. First, contrary to
most event studies in the strategy literature which have focused only on the
valuation impact on a focal firm, we identify the extent to which value-creation
taken place between a focal firm and its partner firms upon the occurrence of a
major event involving the focal firm. Second, our research contributes to the
literature on alliance portfolios by monitoring the partners’ valuation in
conjunction with a focal firm’s alliance portfolio. By conceptualizing the alliance
portfolio as the ego-network, our study seeks to explore the recursive and
cooperative dynamics embedded in the alliance portfolio with particular reference
to the partners’ valuation. Finally, we uncover how environmental munificence
moderates the impact of the properties of alliance portfolios on the stock market’s
reactions to the partner firms when a focal firm announces corporate events. This

- 5 -
approach helps to integrate two research streams: the effects of portfolio alliances
on firm performance and the impact of environmental munificence on value-
creation.
The results of this study provide practitioners with a deeper understanding
of the value of the proposed alliances contingent on the configuration of the
alliance portfolios of the potential partner firms, thus help executives or managers
identify the alliance partners that can maximize their firm’s value. In addition, our
study gives hints to practitioners regarding the better timing to enter into alliances
with a particular partner, in terms of the level of environmental munificence.
Moreover, the results imply practical guidelines as to how to construct and
configure an alliance portfolio in such a way that creates as much value as
possible.
The thesis is structured as follows. The second chapter surveys the major
streams of research, i.e., the motivation for alliance formation, performance
implications of strategic alliances across three levels of analysis, and
environmental munificence, all of which provide concerted theoretical building
blocks for this research. The third chapter outlines the research model and
presents the research hypotheses. The fourth chapter details data and methods,
and the fifth chapter describes the results of the study. In the final chapter, the
thesis concludes with a discussion of the results, contributions and implications,
and limitations as well as directions for future research.

- 6 -
This page left intentionally blank.

- 7 -
Chapter 2. Literature Review
2.1. Motivations for alliance formation
Strategic alliances, which are commonly defined as voluntary
arrangements between firms involving exchange, sharing, or co-development of
products, technologies, or services (Gulati, 1998), have been one of the central
topics in the management research for several decades. When strategic alliances
emerged and increased as one of the popular inter-organizational forms in the
early 1980s, many researchers began to investigate the motivations for alliance
formation; why do firms engage in strategic alliances? Diverse perspectives have
contributed to theoretical and empirical explanations of alliance formation (for a
review, see Auster, 1994; Barringer & Harrison, 2000; Glaister & Buckley, 1996;
Ireland, Hitt, & Vaidyanath, 2002; Kogut, 1988). Table 1 summarizes key
perspectives and their explanations of the motivation for alliance formation.
Viewing strategic alliances as hybrid governance structures, transaction
cost economics posits that firms establish strategic alliances in order to reduce
transaction costs (Hennart, 1988, 1991; Williamson, 1975, 1985). According to
transaction cost economics, organizations exist to mediate economic transactions
among members inside or outside of the organization (Ulrich & Barney, 1984).
Since strategic alliances are more efficient than markets or hierarchies when they
minimize the transaction costs (Jarillo, 1988), they are the product of a firm’s

- 8 -
activities to minimize the sum of its transaction costs (Barringer & Harrison,
2000).
Table 1. Key perspectives on the motivation for alliance formation
Perspective Motivation Representative research
Transaction cost economics
To reduce transaction costs Hennart (1988, 1991), Williamson (1975, 1985)
Resource dependence theory
To maximize power and/or autonomy
Pfeffer (1987), Pfeffer & Salancik (1978)
Resource-based view To acquire resources Das & Teng (2000), Eisenhardt & Schoonhoven (1996), Stuart (2000), Wernerfelt (1984)
Organizational ecology To survive environmental conditions over time
Aldrich (1979), Hannan & Carroll (1992), Hannan & Freeman (1989), Miner, Amburgey, & Stearns (1990)
Institutional theory To appear legitimate and conform to social norms
Baum & Oliver (1991), Dimaggio & Powell (1983), Kraatz (1998)
Positioning school To strengthen competitive position
Harrigan (1987, 1988), Porter (1980, 1985)
Organizational learning perspective
To absorb knowledge, thus to increase competencies and ultimately add value to the firm
Doz (1996), Doz & Hamel (1998), Gulati (1999), Inkpen & Crossan (1995), Inkpen & Tsang (2005), Kogut (2000), Powell, Koput, & Smith-Doerr (1996), Prahalad & Hamel (1990)
The resource dependence theory asserts that firms establish linkages with
other firms to maximize power, mitigate environmental control, and acquire

- 9 -
resources (Pfeffer, 1981, 1987; Pfeffer & Salancik, 1978). In order to survive,
organizations need to obtain resources from the environment, which is uncertain
and unstable (Katz & Kahn, 1966). One way organizations cope and try to gain
power is to establish inter-organizational linkages to acquire resources and
information about their environment, coordinate competitive interdependence, or
reduce competitive uncertainty (Pfeffer, 1987).
The resource-based view of the firm suggests that strategic alliances are
formed in the quest for resources (Eisenhardt & Schoonhoven, 1996; Stuart,
2000). According to the resource-based view, the firm is a collection of
heterogeneous resources (Barney, 1991; Penrose, 1959; Wernerfelt, 1984), and
sustained resource heterogeneity is a potential source of competitive advantage
(Das & Teng, 2000). Therefore, a firm forms strategic alliances to develop a
collection of value-creating resources that the firm cannot create independently
(Lavie, 2006; Park, Mezias, & Song, 2004).
Diverse explanations in the strategy and organization literature also help
us to understand motivations of firms to form alliances. It has been suggested that
firms enter into strategic alliances to survive environmental conditions over time
(Aldrich, 1979; Hannan & Carroll, 1992; Hannan & Freeman, 1989; Miner,
Amburgey, & Stearns, 1990), to appear legitimate and conform to social norms
(Baum & Oliver, 1991; Dimaggio & Powell, 1983; Kraatz, 1998), to strengthen
competitive position by influencing industry structure (Harrigan, 1987, 1988;
Porter, 1980, 1985), and to absorb knowledge that is difficult to obtain by other
means (Doz, 1996; Gulati, 1999; Inkpen & Crossan, 1995; Kogut, 2000; Powell,

- 10 -
Koput, & Smith-Doerr, 1996), thus to increase core competencies and ultimately
add value to the firm (Doz & Hamel, 1998; Prahalad & Hamel, 1990).
Having reviewed key perspectives on motivations for alliance formation,
all of which pertain directly or indirectly to firm survival (resource dependence,
organizational ecology, institutional theory) or other measures of performance
(transaction costs, resource-based view, positioning school and organizational
learning), we turn to the literature focusing on the relationship between alliances
and performance.
2.2. Strategic alliances and firm performance
As explanations for the motivation for strategic alliances began to be
provided, a question soon followed; what are the consequences of strategic
alliances? To provide answers to this question, varied perspectives have long
examined performance implications of alliances accruing to the participating
firms in alliances. This literature review focuses on those studies that investigate
the relationship between strategic alliances and firm performance.
Extant studies on this research theme can be categorized in three streams
based on the levels of analysis: (1) micro-level or single, dyadic alliances, (2)
macro-level or alliance networks, and (3) meso-level or alliance portfolios. Figure
1 illustrates the three analysis levels. There are six firms in total, and four dyadic
alliances are established among five firms; one firm (F) is not connected any other
firms (or isolated). From the focal firm’s perspective, every firm that has at least

- 11 -
one dyadic alliance has its own alliance portfolio; thus we have five alliance
portfolios. For example, the dotted triangle in Figure 1 shows firm B’s alliance
portfolio, which is composed of B as the focal firm and its partners A, C, and D.
By contrast, all these entities, including isolated firm F, and alliance relationships
together constitute an alliance network, the dashed line rectangle (for the
illustration of dyadic alliances and alliance networks, see also Das & Teng, 2002:
447).
Figure 1. Three analysis levels: Dyadics, Networks, and Portfolios
Note: Individual firms: A, B, C, D, E, F.
Dyadic alliances: A-B, B-C, B-D, D-E.
Alliance Portfolios: (A-B), (B+A+C+D), (C-B), (D-B-E), (E-D).
An Alliance Network: A, B, C, D, E, F, A-B, B-C, B-D, D-E,
(A-B), (B+A+C+D), (C-B), (D-B-E), (E-D).

- 12 -
From varied perspectives, the three research streams related to these levels
of analysis together help us to understand diverse aspects of relationships between
strategic alliances and firm performance. An overview of key empirical research
on the performance implications of strategic alliances is presented in Table 2.
2.2.1. Dyadic alliances and firm performance
Researchers have found that strategic alliances have significant effects on
the performance of participating firms. Concerning the unit of analysis, however,
early studies on strategic alliances were mostly focused on the single, individual
and dyadic alliances (e.g., Dyer & Singh, 1998; Madhok & Tallman, 1998).
Insights from this approach have enhanced our understanding of dyadic alliances.
Several research strands have shown that properties of individual dyadic alliances
are associated with firm performance. Some concentrate on (a) the strength of ties,
while others focus on (b) the attributes of the partners to which a focal firm ties.
In the social network literature, one of the considerable debates is between
two opposite perspectives on the strength of ties 1
1 In social network literature, the “strength of ties” often referred to as a key characteristics of the “relational embeddedness,” as compared to the “structural embeddedness” (Gulati, 1998; Rowley, Behrens, & Krackhardt, 2000). We review it detailedly in chapter 2.2.2.
: “strength of strong ties” versus
“strength of weak ties” (Kilduff & Tsai, 2003; Lin, 2001). The debate was
triggered by Granovetter’s seminal article (1973), in which he argued that more
diverse information is likely to derive from weak ties than from strong ties.
However, Granovetter also pointed out that strong ties may play an important role,
- 13 -
remarking that “weak ties provide people with access to information and
resources beyond those available in their own social circles; but strong ties have
greater motivation to be of assistance and are typically more easily available”
(1982: 113). On the other hand, subsequent research has followed which finds
evidence for the argument of the strength of strong ties (Krackhardt, 1992; Nelson,
1989). Ever since Granovetter identified and proposed the strength of weak ties
(1973), a large volume of research has been dedicated to contend which argument
has better evidence.
Several studies examined dyadic tie strength or the “linkage intensity” in
the context of inter-firm settings (Hoffmann, 2007). For example, strong ties
enhance coordination and resource sharing while weak ties enlarge ability to
access to diverse information (Uzzi, 1996). Furthermore, strong ties appear to be
important for exploitation and weak ties for exploration, though weak ties
generally enhance profitability (Rowley, Behrens, & Krackhardt, 2000). Although
the strength of dyadic ties research is focus on a single relationship level of
analysis, it has been frequently involved to examine the performance implications
of alliance networks and alliance portfolios as well (Wassmer, 2010).
Some researchers have explained that performance differentials of focal
firms are derived from their partners’ attributes such as reputation, capabilities,
and rivalry. For instance, Stuart and his colleagues find that young firms with
prominent partners go to IPO faster and earn greater valuations at IPO than firms
that lack such connections (Stuart, Hoang, & Hybels, 1999). Similarly, firms with
large and innovative alliance partners perform better than otherwise comparable
- 14 -
firms that lack such partners (Stuart, 2000). Also, alliances with potential rivals
have positive effects on biotech startups’ initial performance, because those
alliances provide more opportunity for learning and less risk of intra-alliance
rivalry (Baum, Calabrese, & Silverman, 2000).
These studies have offered a rich perspective on what benefits accrue from
alliances. However, this perspective may not fully explain the impact of alliances
on firm performance, because the analysis is conducted mostly at the dyadic level
thus each alliance considered as an isolated event rather than as an interdependent
element in a set of multiple alliances (Lavie, 2007).

- 15 -
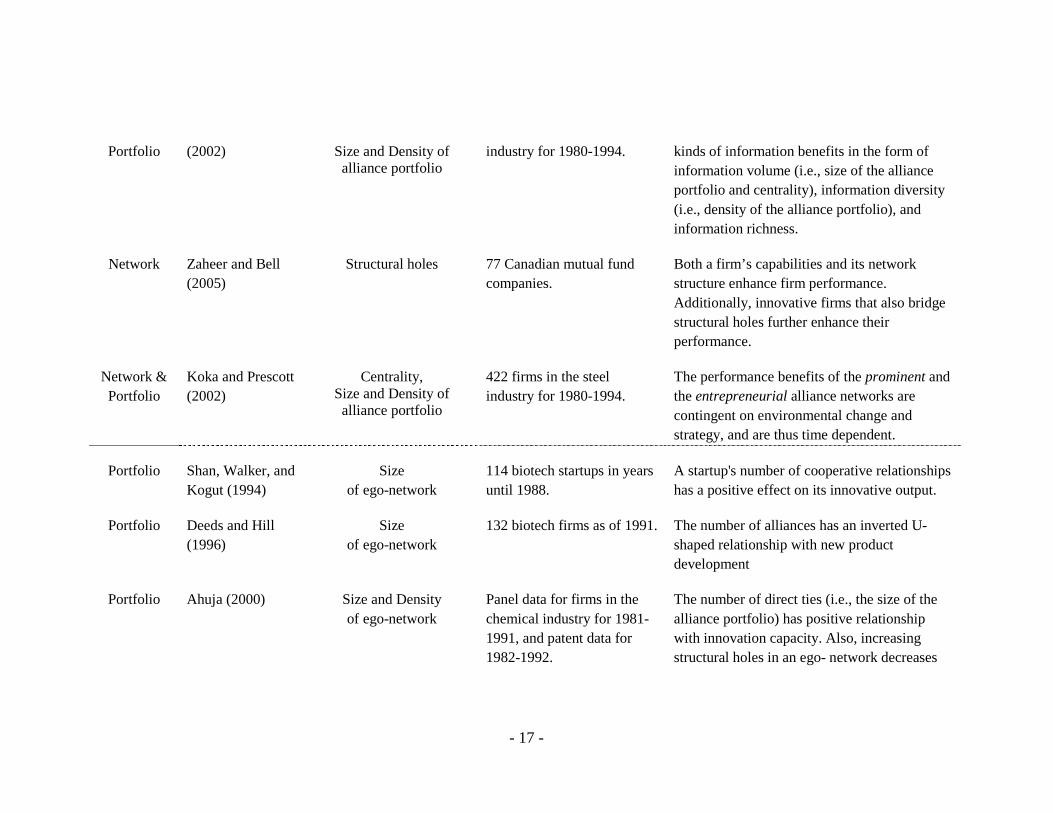
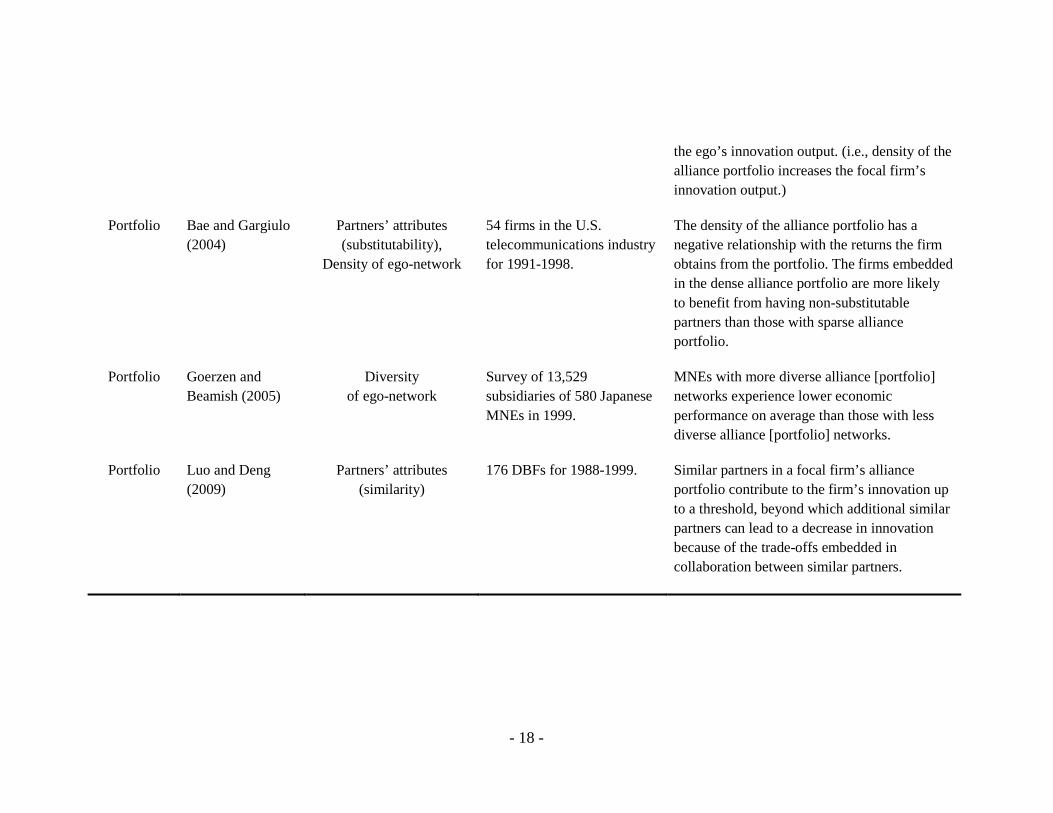
Table 2. Key empirical research on the performance implications of strategic alliances
Level of analysis Authors Explanations for
performance differential Data and sample Main proposals/findings
Dyad Uzzi (1996) Strength of ties
43 interviews from 23 New York apparel firms.
Arm’s-length ties (i.e., weak ties) encourage wide access to information circulating in the market; embedded ties (i.e., strong ties) enhance benefits from trust, joint problem solving and thick information exchange, which in turn enhance coordination and resource sharing.
Dyad Stuart, Hoang, and Hybels (1999)
Partners’ attributes (status)
IPO data of 301 DBF (dedicated biotechnology firms) for 1978-1991.
Young and small firms with prominent strategic alliance partners and organizational equity investors go to IPO faster and earn greater valuations at IPO than firms that lack such connections.
Dyad Stuart (2000) Partners’ attributes (capabilities)
Patent citation data among 150 firms in the semiconductor industry for 1985-1991.
Firms (especially young and small firms) with large and innovative alliance partners perform better than otherwise comparable firms that lack such partners.
Dyad & Portfolio
Rowley, Behrens, and Krackhardt (2000)
Strength of ties, Density of ego-network
Secondary data on the 132 semiconductor firms and 138 steel firms for 1990-1997.
There is a general positive relationship between the number of weak ties and ROA. However, strong ties are important for exploitation, and

- 16 -
weak ties for exploration. Additionally, density of ego-network does not have any significant effect on ROA.
Dyad & Portfolio
Baum, Calabrese, and Silverman (2000)
Partners’ attributes (rivalry),
Size of alliance portfolio
142 Canadian biotech startups for 1991-1996.
Startups can enhance their early performance by establishing alliances with potential rivals that provide more opportunity for learning and less risk of intra-alliance rivalry. Also, their initial performance increases with the size of its alliance network at founding.
Network Powell, Koput, and Smith-Doerr (1996)
Centrality 225 DBFs for 1990-1994. The greater the firm’s centrality in an alliances network, the more rapid its subsequent growth.
Network Gulati (1999) Centrality 166 firms in new materials, industrial automation, and automotive products for 1908-1989.
Firms that are centrally located in the alliance network are more likely to form new alliances.
Network McEvily and Zaheer (1999)
Structural holes Field data from 227 job shop manufacturers located in the Midwest U.S.
Firms embedded in geographical clusters that maintain a network rich in bridging ties to regional institutions are well-positioned to access new information, ideas, and opportunities.
Network & Koka and Prescott Centrality, 422 firms in the steel Social capital yields three distinctly different
- 17 -
Portfolio (2002) Size and Density of alliance portfolio
industry for 1980-1994. kinds of information benefits in the form of information volume (i.e., size of the alliance portfolio and centrality), information diversity (i.e., density of the alliance portfolio), and information richness.
Network Zaheer and Bell (2005)
Structural holes 77 Canadian mutual fund companies.
Both a firm’s capabilities and its network structure enhance firm performance. Additionally, innovative firms that also bridge structural holes further enhance their performance.
Network & Portfolio
Koka and Prescott (2002)
Centrality, Size and Density of alliance portfolio
422 firms in the steel industry for 1980-1994.
The performance benefits of the prominent and the entrepreneurial alliance networks are contingent on environmental change and strategy, and are thus time dependent.
Portfolio Shan, Walker, and Kogut (1994)
Size of ego-network
114 biotech startups in years until 1988.
A startup's number of cooperative relationships has a positive effect on its innovative output.
Portfolio Deeds and Hill (1996)
Size of ego-network
132 biotech firms as of 1991. The number of alliances has an inverted U-shaped relationship with new product development
Portfolio Ahuja (2000) Size and Density of ego-network
Panel data for firms in the chemical industry for 1981-1991, and patent data for 1982-1992.
The number of direct ties (i.e., the size of the alliance portfolio) has positive relationship with innovation capacity. Also, increasing structural holes in an ego- network decreases
- 18 -
the ego’s innovation output. (i.e., density of the alliance portfolio increases the focal firm’s innovation output.)
Portfolio Bae and Gargiulo (2004)
Partners’ attributes (substitutability),
Density of ego-network
54 firms in the U.S. telecommunications industry for 1991-1998.
The density of the alliance portfolio has a negative relationship with the returns the firm obtains from the portfolio. The firms embedded in the dense alliance portfolio are more likely to benefit from having non-substitutable partners than those with sparse alliance portfolio.
Portfolio Goerzen and Beamish (2005)
Diversity of ego-network
Survey of 13,529 subsidiaries of 580 Japanese MNEs in 1999.
MNEs with more diverse alliance [portfolio] networks experience lower economic performance on average than those with less diverse alliance [portfolio] networks.
Portfolio Luo and Deng (2009)
Partners’ attributes (similarity)
176 DBFs for 1988-1999. Similar partners in a focal firm’s alliance portfolio contribute to the firm’s innovation up to a threshold, beyond which additional similar partners can lead to a decrease in innovation because of the trade-offs embedded in collaboration between similar partners.

- 19 -
2.2.2. Alliance networks and firm performance
While the causes and consequences of dyadic inter-firm relationships have
long been the main focus of the studies on strategic alliances, less attention has
been paid to the structure of large strategic alliance networks at the holistic level
resulting from numerous dyadic alliances (Gemser, Leenders, & Wijnberg, 1996;
Gulati, 1998; Knoke, Yang, & Granados, 2002; Nohria, 1992). Apart from the
direct dyadic ties between two firms, firms are typically involved in the complex
network of indirectly connected relationships, through “partners of partners” by
participating in various alliances with different partners (Knoke, Yang, &
Granados, 2002).
Research on the macro-level alliances networks is more recent including
what has been termed as the alliance web (Doz & Hamel, 1998), the alliance
network (Baum, Calabrese, & Silverman, 2000; Koka & Prescott, 2002), the
alliance constellation (Das & Teng, 2002; Gomes-Casseres, 1996), the networks
of strategic alliances (Hargedoorn & Schakenraad, 1992), or the strategic alliance
network (Knoke, 2001; Knoke, Yang, & Granados, 2002). Theories of social
embeddedness, social capital, and social network, among many others, have
provided diverse theoretical and empirical explanations on these complex
networks.
Triggered by the seminal work by Mark Granovetter (1985), a new
research approach called the “new economic sociology” has emerged in academic
circles (Swedberg, 2003). As its name indicates, the new economic sociology
- 20 -
analyzes core economic phenomena with the help of sociological approaches,
mainly social network theory, organization theory, and cultural sociology
(Swedberg, 2003). Granovetter’s embeddedness theory, as the central concept of
the new stream, posits that an “economic action” is in principle always
“embedded” in some form or another of “social structure” (1985). The concept of
social embeddedness provides theoretical basis for further research on social
capital and social network perspectives on strategic alliances.
Through the social structure (i.e., the social ties), actors – be they
individuals, groups, or organizations – exchange resources such as wealth,
information, knowledge, status, prestige, power, or access to others. Since social
ties serve as conduits of resources, an actor’s performance may depend on his
possession and control of the social ties (Burt, 1992). Therefore, possession and
control of the social ties create strategic advantages for actors. In this vein, social
capital theorists argue that an actor’s potential resources are inherent in the actor’s
social ties (Kilduff & Tsai, 2003). Further, it has been argued that “something
about the structure of the player’s network and the location of the player’s
contacts in the social structure of the arena provides a competitive advantage in
getting higher rates of return on investment” (Burt, 1992: 8).
In a similar vein, the social network framework suggests that a firm’s
strategic conduct within an industry is influenced not only by the properties of
their direct relationships, but also by the collective structure of inter-firm
relationships (Madhavan, Koka, & Prescott, 1998). Therefore, in contrast to the
traditional theoretical framework in management, which attributes the
- 21 -
performance differentials to the individual firm’s internal resources and
capabilities (the resource-based view), the social network perspective suggests
that the extent to which firms are embedded within networks of relationships
helps determine their performance (Gulati, 1998; Uzzi, 1996). In this vein, Gulati
(2007) named this network embeddedness as the “network resource” in a sense
that it arises outside a firm’s boundaries and within its social networks distinct
from the resources that reside within a firm’s boundaries. Further, he made it clear
that two distinct components of network resources are relevant that accrue to firm
performance: the relational component and the structural component (Gulati,
1998, 2007). Relational embeddedness refers to direct ties a firm links to others,
and studies on this theme have focused mainly on investigating the effect of
strength of ties on organizational performance, as we reviewed earlier. Structural
embeddedness, in turn, refers to the structural position actors occupy in the
overall network, and researchers have examined the relationship between firm
performance and various structural properties such as centrality (Freeman, 1978;
Ibarra, 1993), density (Coleman, 1988), and structural holes (Burt, 1992).
To date, evidence from the structural embeddedness perspective has
covered various benefits derived from the firms’ structural properties within
alliance networks. For example, centrality increases firms’ growth (Powell, Koput,
& Smith-Doerr, 1996) and social capital (Koka & Prescott, 2002); density
increases firms’ innovation output (Ahuja, 2000) and social capital (Koka &
Prescott, 2002); and structural holes increase firms’ returns and access to
information (Burt, 1992; McEvily & Zaheer, 1999).
- 22 -
Notably, however, extant research contains opposite claims on the
network structure: an “open network” versus a “closed network” (Lin, Cook, &
Burt, 2001). Both approaches are largely grounded on and developed from social
capital theory. The open network or the structural holes argument is that social
capital is created by a network in which actors can broker connections between
otherwise disconnected segments (Burt, 1992), whereas the closed network
argument is that social capital is created by a network of strongly interconnected
elements (Coleman, 1988). Varied theoretical and empirical studies have followed
which support either one of the claims or explain them as contingent on other
factors (e.g., Ahuja, 2000; McEvily & Zaheer, 1999; Zaheer & Bell, 2005).
However, the network perspective also may offer only a partial account of the
impact of alliances on firm performance, because it focuses mainly on ties while
assuming away differences in the inherent attributes of actors (Lavie, 2007).
2.2.3. Alliance Portfolios and firm performance
As strategic alliances have become an important strategic resource for
firms, most firms are engaged in multiple alliances with different partners.
Although extant research stream has predominantly focused on either simple
dyadic alliances or complex alliance networks, several researchers have pointed
out that a set of multiple alliances as a level of analysis raises new and important
issues for further research (Gulati, 1998, 2007; Kale & Singh, 2009; Khanna,
1998; Lavie, 2007; Parise & Casher, 2003; Wassmer, 2010). This unit of analysis
- 23 -
refers to the alliance portfolio, which is commonly defined as the aggregate of all
direct strategic alliances of a focal firm (Bae & Gargiulo, 2004; Doz & Hamel,
1998). From the social network perspective, this is akin to the notion of the
egocentric network (Das & Teng, 2002; Lavie, 2007), which encompasses the
focal firm (ego), its set of partners (alters), and their connecting ties (Wasserman
& Faust, 1994). In other words, an alliance portfolio considers an alliance
network from the perspective of a focal firm – i.e., focusing on all alliances that
the focal firm has (Hoffmann, 2007).
Ozcan and Eisenhardt (2009) posit that the level of analysis for alliance
portfolios is theoretically important in several aspects. First, firms establish
alliances in the context of building portfolios, thus the logic of portfolio building
is central to understanding alliance formation. Second, portfolios have aggregate
properties that affect performance but are not meaningful for single ties. Lastly,
portfolios are engines of network evolution; firms adjust their portfolios, thereby
changing the networks in which they operate.
To implement strategies successfully and maximize the benefits from
alliances, firms often rely not only on single high-profile alliances but also on
several coordinated alliances (Gomes-Casseres, 1996). What really matters is not
the success or failure of a single alliance but that the firm will accomplish its
strategic goals with the bundle of its alliances, thus placing the structure and
strategic orientation of the whole alliance portfolio at the center of interest
(Hoffmann, 2007: 828). In this light, researchers have investigated what are the
- 24 -
characteristics of the high-performing portfolios and how to build and manage the
high-performing portfolios.
The characteristics or properties of alliance portfolios are referred as the
portfolio configuration (Hoffmann, 2007; Lavie, 2007; Wassmer, 2010), to which
researchers have recently started to give attention. The portfolio configuration
determines the quality and quantity of external resources the focal firm can access,
thereby influencing its performance (Baum, Calabrese, & Silverman, 2000;
Hoffmann, 2007). Several authors have sought to identify the key elements of the
portfolio configuration. Hoffmann (2007) posits that the alliance portfolio
configuration is comprised of four parameters: the number, dispersion,
redundancy, and the linkage intensity of alliances within the alliance portfolio.
Adding partner-related characteristics to Hoffman’s parameters, Wassmer (2010)
later denotes the alliance portfolio configuration as a complex concept comprising
four dimensions: the size, the structural, the relational, and the partner dimensions.
An alliance portfolio, by definition, embraces the characterisitcs of both
dyadic alliances and alliance networks. Therefore, the elements of portfolio
configuration include those from multiple and mixed levels. For instance,
relational properties (i.e., the strength of ties) and partner atributes (i.e., diversity
of partners) comprise the characteristics of dyadic alliances. In contrast, the size
and the structural properties (i.e., density) of alliance portfolios target the
properties of egocentric networks. These elements of alliance portfolios, alone or
mixed, are reported to affect the focal firm’s performance (for a review, see
Wassmer, 2010).
- 25 -
Stuart and his coauthors (1999) and Stuart (2000), for example, assert that
strategic alliances are access relationships, and therefore the advantages which a
focal firm derives from a portfolio of strategic coalitions depend on the resource
profiles of its alliance partners. Ahuja (2000) finds that the number of partners
(i.e., the size of the alliance portfolio) and density of the alliance portfolio affect
the firm’s capacity to innovate. Baum, Calabrese and Silverman (2000) suggest
that startups can enhance their early performance by establishing many alliances,
and especially by allying with potential rivals that provide more opportunity for
learning and less risk of intra-alliance rivalry. Goerzen and Beamish (2005)
investigate the impact of the diversity of the alliance portfolio on fhe firm’s
performance and find a negative relationship between them. Koka and Prescott
(2002; 2008) have examined the performance implications of network centrality
and size, density, and diversity of a firm’s alliacne portfolio.
Although prior research offers a clear description of the characteristics of
the high-performing portfolio configurations, however, it is not yet clear whether
the benefits accrue to all members of the portfolio. Previous findings have been
limited to only one particular member of the portfolio, the focal firm. An alliance
is established between two or more firms, thus an alliance portfolio is comprised
of multiple firms: a focal firm and its partner firms. Therefore, it can be inferred
that the benefits and the risks derived from an alliance portfolio accrue to all the
member firms in the alliance portfolio, i.e., not only the focal firm but also its
partners.
- 26 -
Surprisingly, however, extant research on the performance implications of
alliance portfolios has concentrated on the focal firm. In a few exceptions, some
researchers shift their focus from focal firms to their rival firms, and test the
impact of focal firms’ alliance announcements (Oxley, Sampson, & Silverman,
2009) or increases in R&D expenditure (Zantout & Tsetsekos, 1994) on their
rivals’ market valuation. In the present study, we seek to shift the focus from the
focal firms to alliance partners, and fill this gap in extant research by investigating
how the configuration of the alliance portfolio influences the expected
profitability of partner firms.
2.3. Environmental munificence
The environment can be viewed as a stock of resources (Aldrich, 1979),
and organizations must import resources from their environments in order to
function (Katz & Kahn, 1966). Therefore, the environment and its interaction with
the organization constitute one of the central research issues in the management
literature (Cyert & March, 1963; Pfeffer & Salancik, 1978; Thompson, 1967).
Environments are multidimensional, and the range of dimensions is indeed wide.
For example, Child (1972) identifies three important environmental conditions:
illiberality, variability, and complexity. Aldrich (1979) reviews previous studies
and codifies six dimensions: capacity, homogeneity-heterogeneity, stability-
instability, concentration-dispersion, domain consensus-dissensus, and turbulence.
Dess and Beard (1984) and McArthur and Nystrom (1991) propose three

- 27 -
dimensions as a more parsimonious set: munificence, dynamism, and complexity.
Similarly, Rajagopalan, Rasheed, and Datta (1993) list three aspects of the
environment: uncertainty, complexity, and munificence.
All these diverse dimensions may be considered almost equally important
in examining the environmental influence. However, Castrogiovanni has
recommended that researchers find and examine a few environmental elements
which are more salient to a given research topic (1991: 543-544, quotation marks
in original).
In a sense, environment is “everything else” outside of a particular
organization (Boulding, 1978). It is impossible to examine
everything, however, and some environmental elements are more
relevant to a particular organization and to the particular issue at
hand than others (cf. Osborn & Hunt, 1974). Thus, theorists have
found it useful to stratify environment according to levels of
specificity, immediacy, and relevance to the organizational
phenomenon of interest (cf. Beard & Dess, 1988; Child, 1972; Dill,
1958; McKelvey, 1982; Starbuck, 1976; Ulrich, 1987).
Following his recommendation for parsimony and salience, we concentrate solely
on the dimension of environmental munificence as the most relevant to our
research.
Environmental munificence is defined as “the extent to which the industry
can support present organizations, enable the present organizations to grow and
prosper, and enable new organizations to gain entrance into the industry”

- 28 -
(Randolph & Dess, 1984: 121). In other words, it is the scarcity or abundance of
critical resources needed by firms operating within an environment
(Castrogiovanni, 1991), thus it has a critical effect on firm behaviors and
outcomes (Dess & Beard, 1984; Wan & Hoskisson, 2003).
As presented in Table 3, research has demonstrated significant
relationships between environments, strategy, and the performance of
organizations (Hansen & Wernerfelt, 1989; Porter, 1980; Scherer & Ross, 1990).
In the strategic management literature, two streams exist in this research area:
those which examine the direct environmental influences on strategy, and those
which focus on the moderating role of the environment in the relationship
between strategy and performance outcomes (Rajagopalan, Rasheed, & Datta,
1993). The same may be said of the research streams on environmental
munificence.
The direct impact of environmental munificence on organizational
strategic behaviors and performance has been the subject of a limited number of
studies. Staw and Szwajkowski (1975), for example, have suggested that the less
munificent the organization’s environment, the more likely it engages in legally
questionable activities, because when the organization’s environment is less
munificent the organization exerts more effort to obtain resources from that
environment. Koberg (1987) has also investigated the relationship between the
level of environmental munificence and organizational behaviors, and posited that
declines in the level of environmental munificence bring about changes in budgets,
planning and control systems, equipment and facilities, and departmentation in

- 29 -
schools. Baum and Wally (2003) have recently asserted that high munificence
environments allow firms to speed up strategic decision-making, thus enhancing
firm performance.
Strategy is considered to be under the control of managers, while
environments are considered to be constraints in that in certain situations
managers cannot proactively change (Pfeffer & Salancik, 1978). Thus, much of
the strategic management literature has considered environments as moderators of
the relationship between strategy and performance (Prescott, 1986). Examining
the effect of environmental munificence on firms, prior research supports the
moderating effect of the environmental munificence on firm strategy in regards to
firm performance. For example, McArthur and Nystrom (1991) find that there is
no direct effect of environemntal munificene on firm performance but there is a
significant positive effect by environmental munificene on the strategy-
performance relationship. Goll and Rasheed (1997, 2004) show that environmetal
munificence moderates the relationship between rationality and performance and
that rationality is strongly associated with performance in a high munificent
environment. Payne and his colleages also find that environmental munificence
has no direct impact on firm performance but it affects performance in the three-
way interaction with firm specialization and rivalry intensity (Payne, Kennedy, &
Davis, 2009). Wan and Yiu (2009) find that corporate acquisitions in high
munificence environments are negatively related to firm performance, because
firms may act imprudently in high munificence environments (Lubatkin &
Chatterjee, 1991) thus engage in inappropriate acquisitions which easily lead to
- 30 -
hurting firm performance. The authors find also that, on the contrary, the same
relationship is positive in low munificence environments because firms can get
significant benefits from low munificence environments by taking new
opportunities through corporate acquisitions (Chattopadhyay, Glick, & Huber,
2001; Meyer, 1982).
Although a large volume of research has investigated the relationship
between environmental munificence and organizational performance, relatively
few empirical studies have examined the effect of environmental munificence on
the stock market response (Park & Mezias, 2005). In the present study, we seek to
make an empirical contribution by examining how environmental munificence
moderates the effect of alliance portfolio properties on the stock market valuation
of the alliance partners in response to major corporate events announced by the
focal firm.
- 31 -
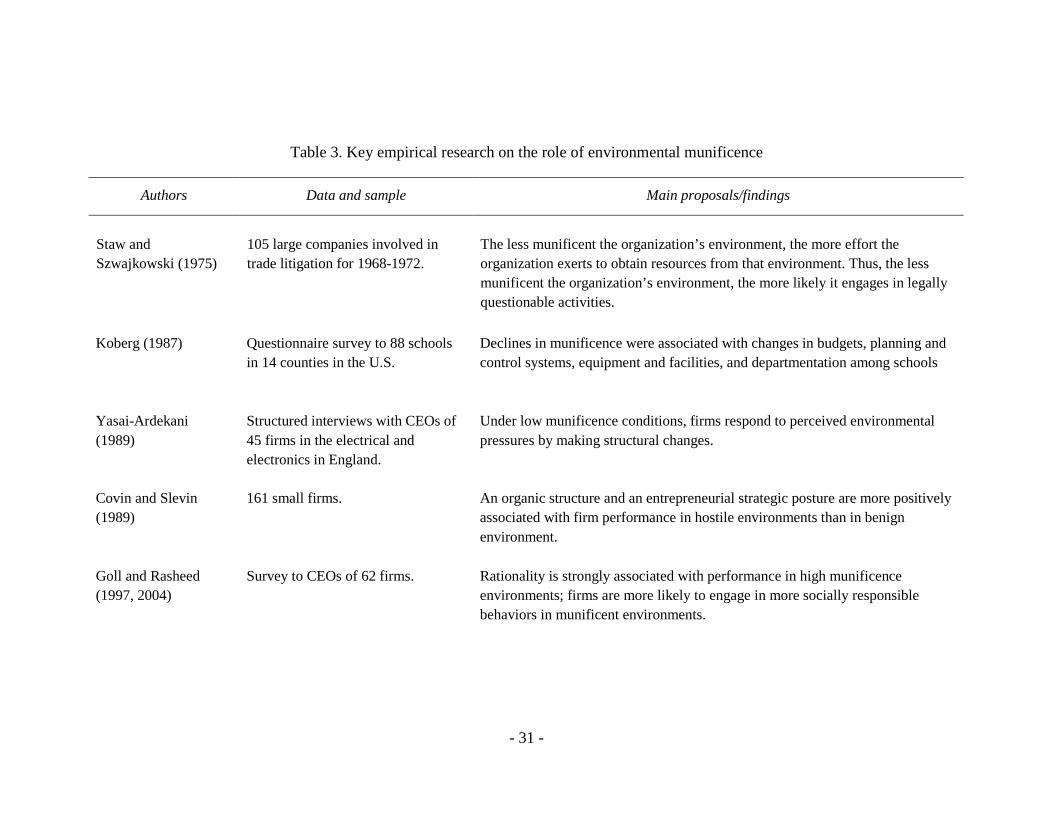
Table 3. Key empirical research on the role of environmental munificence
Authors Data and sample Main proposals/findings
Staw and Szwajkowski (1975)
105 large companies involved in trade litigation for 1968-1972.
The less munificent the organization’s environment, the more effort the organization exerts to obtain resources from that environment. Thus, the less munificent the organization’s environment, the more likely it engages in legally questionable activities.
Koberg (1987) Questionnaire survey to 88 schools in 14 counties in the U.S.
Declines in munificence were associated with changes in budgets, planning and control systems, equipment and facilities, and departmentation among schools
Yasai-Ardekani (1989)
Structured interviews with CEOs of 45 firms in the electrical and electronics in England.
Under low munificence conditions, firms respond to perceived environmental pressures by making structural changes.
Covin and Slevin (1989)
161 small firms. An organic structure and an entrepreneurial strategic posture are more positively associated with firm performance in hostile environments than in benign environment.
Goll and Rasheed (1997, 2004)
Survey to CEOs of 62 firms. Rationality is strongly associated with performance in high munificence environments; firms are more likely to engage in more socially responsible behaviors in munificent environments.

- 32 -
Wan and Hoskisson (2003)
799 firms in western Europe. In more munificent environments, there is a negative relationship between product diversification and performance; in less munificent environments, there is a positive relationship between product diversification and performance.
Baum and Wally (2003)
Survey to 318 firms for 1996-2001. The greater the environmental munificence, the higher the firm’s performance; the greater the environmental munificence, the faster the strategic decision-making.
Park and Mezias (2005)
408 alliance announcements of 75 e-commerce firms for 1995-2001.
Stock market responds more favorably to alliances during the less munificent period. Stock market response to alliance partner and type is also affected by the change in environmental munificence between the two periods.
Payne, Kennedy, and Davis (2009)
Survey to 1,030 SMEs. Environmental munificence moderates the relationship between firm specialization and firm performance; performance increases with firm specialization, at a faster rate with increased munificence.
Latham (2009) Survey to 137 software executives for 2001-2003.
In low munificence environments, smaller firms adopt revenue generating strategies but larger firms adopt cost reduction strategies.
Wan and Yiu (2009) 234 M&As among 78 firms in Hong Kong and Singapore for 1994-2002.
In low munificence environments, acquisitions are positively related to firm performance, but the same relationship in high munificence environments is negative in comparison.
Rosenzweig (2009) Web survey to 50 manufacturers. Environmental munificence weakens the relationship between e-collaboration and performance.
- 33 -
Chapter 3. Theory and Hypotheses
3.1. Value-creation in alliance portfolios
Strategic alliances are both access relationships and pathways for the
exchange of resources and signals that convey social status and recognition
(Stuart, 2000). The following metaphor may clarify this inter-firm relationship.
Surely this patterned exchange looks more like a marriage than a
one-night stand, but there is no marriage license, no common
household, no pooling of assets (Powell, 1990: 301).
However, alliances are fraught with risks as well as benefits, and typically require
a significant amount of resources and commitment for long periods of time
(White & Lui, 2005). When outcomes from alliances are positive, the alliances
convey social capital, but when they obstruct strategic actions, they produce
“social liability”, i.e., negative social capital (Leenders & Gabbay, 1999: 3).
When positive or negative outcomes are produced from dyadic alliances,
those outcomes may be shared between two firms, whether evenly or unevenly
(Khanna, 1998). Therefore, the benefits and the risks which derive from an
alliance portfolio may accrue not only to a focal firm but also to all the other firms
within the alliance portfolio (i.e., the partners of the focal firm). Since the partners
of a focal firm within an alliance portfolio are interdependent and affect one
another, they together create synergies or conflicts (Parise & Casher, 2003), which
make the total value created in the alliance portfolio greater or smaller than the

- 34 -
sum of the values created by individual dyadic alliances in the portfolio (Vassolo,
Anand, & Folta, 2004). In other words, since allied firms are “in the same boat” in
that they co-create rewards and share the risks (Das & Teng, 1999), value-
creation, whether positive or negative, will occur among those firms in the
corporate marriage (Oxley, Sampson, & Silverman, 2009).
The market signaling perspective posits that investors may respond to
corporate announcements by buying or selling the stock (Asquith & Mullins,
1986). For example, investors react to corporate announcements such as dividends
and earnings announcements (Eddy & Seifert, 1992), mergers and acquisitions
(Datta, Pinches, & Narayanan, 1992), strategic alliances (Das, Sen, & Sengupta,
1998), lawsuits (Bhagat, Brickley, & Coles, 1994), proactive layoffs (Lee, 1997),
and corporate name changes (Lee, 2001). Such corporate announcements can
generate positive abnormal returns when investors expect great potential in the
firm’s action, or negative abnormal returns when investors disapprove of
managerial decisions (Asquith & Mullins, 1986).
We posit that, when a firm announces major events which are strategically
important to the firm, the announcements may have impact on its partner firms, i.e.
all the firms in the same boat, as well as the announcing firm itself. For example,
if Yahoo! announces that its earnings are noticeably higher than expected, this
performance is likely to boost investors’ confidence in the alliance initiatives
formed by Yahoo! as well as Yahoo! itself. Thus, subsequently, the
announcement will positively affect the expected future profitability of its alliance
partners. In the same vein, when an event negatively affects the stock price of the
- 35 -
announcing firm, it also is likely to have a negative effect on the stock prices of
partner firms.
By this line of thinking, we presume that a corporate announcement in an
efficient capital market influences the investors’ valuation of not only the
announcing firm itself but also its partner firms as reflected in their stock prices.
3.2. The configuration of alliance portfolios
Firms establish and maintain alliances expecting these will enhance
performance. However, all alliances may not have an equal value for performance.
For instance, at the dyadic alliance level, whom to ally with and whether to seek
strong or weak alliances may be major determinants of firm performance (Baum,
Calabrese, & Silverman, 2000; Uzzi, 1996).
Together with these findings, firm performance can be better understood
by also examining strategic alliance networks in which the firm is embedded
(Gulati, 1998; Gulati, Nohria, & Zaheer, 2000). However, all alliance networks,
like dyadic alliances, may not be equally valuable for firm performance. For
example, at a collective network level, central positioning in the network may also
be a major determinant of firm performance (Burt, 2001; Powell, Koput, &
Smith-Doerr, 1996).
As such, all alliance portfolios may not contribute equally to performance.
It is the portfolio configuration that determines the performance differentials
(Baum, Calabrese, & Silverman, 2000; Hoffmann, 2007). The portfolio
- 36 -
configuration is comprised of varied parameters such as the number, dispersion,
redundancy, and the strength of ties within the alliance portfolio (Hoffmann,
2007), or the size, structural, and relational characteristics of ties within the
alliance portfolio, and partner-related characteristics (Wassmer, 2010). Among
these, we select three characteristics as essential parameters of the alliance
portfolio configuration: (a) the size, (b) diversity, and (c) density of the alliance
portfolio. We believe that these parameters best represent the structured properties
of the unit of ego-network, and thus most affect performance of the partners
which are embedded in the alliance portfolio. Further, we believe also that these
parameters affect stock market valuation to the partners in the same alliance
portfolio when a focal firm announces major corporate events.
3.2.1. Portfolio size
One of the essential configuration parameters of alliance portfolios is the
size of the portfolio. Most prior studies suggest that the bigger the size of an
alliance portfolio the better the focal firm’s performance. Since firms possessing a
large alliance portfolio have better access to large volume of external resources
and information (Gulati, 1999; Koka & Prescott, 2002; 2008), they may yield
better performance than those with a smaller alliance portfolio. Evidence also
suggests that the size of the portfolio has a positive effect on innovative output
(Ahuja, 2000; Baum, Calabrese, & Silverman, 2000; Shan, Walker, & Kogut,
- 37 -
1994) or an inverted U-shaped relationship with new product development (Deeds
& Hill, 1996).
However, we may need different lenses when we examine performance of
a focal firm that possesses an alliance portfolio if we investigate the performance
of partners embedded in the alliance portfolio. Also, if we shift our perspective
from a focal firm to its partners, the predominant argument may not necessarily be
true at the shifted perspective. Regarding the size of alliance portfolios, we argue
that the small size may be more valuable especially in the value creation of the
partners in an alliance portfolio for the following reasons.
In alliance portfolios, both value-creation mechanisms and value-
appropriation mechanisms are in play (Lavie, 2007). Value-appropriation
mechanisms determine the relative share of benefits to individual partners
(Khanna, Gulati, & Nohria, 1998) and competition for the distribution of benefits
increases conflicts between partners, which may lead to alliance failure (Park &
Russo, 1996). Therefore, as the number of dyadic alliances increases in an
alliance portfolio, i.e., as the size of an alliance portfolio increases, the potential
for multilateral conflicts also increases. Moreover, as the number of partners in an
alliance portfolio increase, so do coordination costs, monitoring costs, and
managerial complexity (Gulati & Singh, 1998).
By contrast, small alliance portfolios may provide firms with better
environment to have frequent interactions than large ones (Kraatz, 1998). Also,
the increasing chances of interactions may lead to formation of direct ties between
otherwise indirectly connected firms. Then, the newly established stronger ties

- 38 -
make it easier for the firms to share and exchange complex knowledge and
valuable information (Hansen, 1999; Krackhardt, 1992; Uzzi, 1996). The
potential for direct dyadic interactions between any two parties in an alliance
portfolio is likely to decline as network size grows. Subsequently, investors in an
efficient capital market will perceive that the firms embedded in small alliance
portfolios have better chances to enhance their future performance. Consequently,
we argue for the negative relationship between the size of an alliance portfolio
and performance of the partners embedded in the alliance portfolio.
Hypothesis 1a: When a focal firm announces corporate events, the partner firms’
abnormal returns will be negatively associated with the size of the alliance
portfolio.
3.2.2. Portfolio size and environmental munificence
However, investor perceptions on the portfolio size may be contingent on
environmental munificence. Munificent environments provide firms with
abundant resources necessary to sustain growth and stability (Dess & Beard,
1984). Thus, even without alliances with others, in munificent environments firms
can easily secure resources to improve brand awareness, create demand, and
secure future growth (Aldrich, 1979; Pfeffer, 1987; Randolph & Dess, 1984).
Thus, in a munificent environment, strategic alliances may signal weakness
because firms are not trying to operate independently even though resources are

- 39 -
plentiful. Therefore, alliance announcements in the period of low environment
munificence result in higher abnormal returns than those in the period of high
environment munificence (Park & Mezias, 2005).
Firms find it more difficult and have fewer options to obtain resources in a
less munificent environment (Castrogiovanni, 1991; Dess & Beard, 1984).
Therefore, a firm possessing a large set of partners in low munificence may signal
strength because firms may more easily obtain resources thus more likely to
sustain growth. By contrast, it is quite likely that, in munificent environments,
being a member of a large alliance portfolio thus possessing a great number of
indirectly allied partners may signal weakness. Consequently, we argue the
following:
Hypothesis 1b: The negative relationship between portfolio size and partners’
abnormal returns will be stronger in high munificence environments than in low
munificence environments.
3.2.3. Portfolio diversity
Diversity of the alliance portfolio is the breadth, dispersion, heterogeneity,
or dissimilarites among the partners in an alliance portfolio (Goerzen & Beamish,
2005; Hoffmann, 2007). Research on partner diversity was investigated initially at
the individual level. However, prior studies have conflicting arguments on the
relationship between partner diversity and performance. For example, Granovetter

- 40 -
demonstrates that job-seekers find better jobs faster when they maintain diverse
acquaintances (1973). On the other hand, people are more likely to learn complex
things from others when they are embedded in a homophilous social circle
(Bandura, 1977), because individuals in homophilic relationships share common
characteristics (e.g., beliefs, values, and education) that make communication and
relationship formation easier and more frequent (McPherson, Smith-Lovin, &
Cook, 2001).
Exploration of the effects of the partner similarity at the inter-firm
alliances level has also been researched. Darr and Kurtzberg (2000) have shown
that collaboration between similar partners leads to better knowledge transfer,
because their identies and routines are similar so that they can cooperate and
coordinate easier. Also, social similarity within a network promotes frequent
communications as well as liking and intimacy between actors (Rogers, 1995). On
the other hand, others have argued that collaboration between partners possessing
dissimilar resources are likely to enhance firm performance by integrating
complementary resources (Das & Teng, 2000; Harrison, Hitt, Hoskisson, &
Ireland, 2001).
The literature review therefore shows opposing and inconclusive results
about the effects of partner diversity on performance, at many different levels of
analysis such as the individual, inter-personal, intra-, and inter-organizational.
This may result from the studies’ focus on the dyad relations rather than the social
contexts in which such a dyad embedded (Luo & Deng, 2009: 1006). It may also
be due to the studies’ focus only on the focal firms. We attempt to advance the

- 41 -
debate and enlarge the perspective by examining the phenomenon at the level of
the alliance portfolio and from the viewpoint of the partners of a focal firm.
Diversity of the alliance portfolio can affect the performance of partners in
several aspects. First, a diverse portfolio provides the firms with access to various
benefits including information, knowledge, technologies, skills, and markets,
which are new and fresh that homogeneous portfolios may not provide. Firms
with diverse partners may have access to a variety of ideas and perspectives (Burt,
1992; Granovetter, 1982). In this vein, “a portfolio of alliances consisting of ties
to organizations in a variety of different market niches may be more valuable than
an otherwise similar portfolio of alliances with firms in the same or similar niches”
(Stuart, 2000: 809). Furthermore, information and innovations are spread faster
and effectively in diverse (or “heterophilious” in his own use) networks (Rogers,
1995). The benefits derive from a diverse alliance portfolio, in turn, may provide
the firms with better chances to solve the problems, enhance social capital, and
explore new business opportunities (Fleming & Sorenson, 2001; Koka & Prescott,
2002; 2008; March, 1991).
Second, a diverse portfolio may facilitate creation of synergies among the
partners by combining complementary resources and capabilities (Madhok &
Tallman, 1998). A firm establishes alliances with other firms in its own industry
as well as across industries for strategic and social purposes (Eisenhardt &
Schoonhoven, 1996). When a focal firm has multiple partners that operate in the
same product markets or offer similar services and thus play a similar role in its
alliance portfolio, multilateral competition evolves in the alliance portfolio (Lavie,

- 42 -
2007: 1195). Given that alliance partners that operate in the same industry or in
the same market niche may be the current or the potential rivals who compete
with one another for limited resources and markets (Baum, Calabrese, &
Silverman, 2000), suspicion may replace trust in their relationship (Inkpen &
Tsang, 2005) and the looming competition may hinder collaboration between
them (Luo & Deng, 2009).
Either synergy- or conflict-creating interdependencies can occur between
partners within an alliance portfolio (Parise & Casher, 2003). Synergies between
partners in an alliance portfolio occur when partners affect one another positively,
while conflicts occur when partners affect one another negatively. According to
Parise and Casher (2003), conflicts are created because partners are rivals in an
industry or they promote competing technologies. Subsequently conflicts may be
more likely to occur in the alliance portfolios comprised of current or potential
rivals. On the other hand, in diverse portfolios that are composed of partners
across industries and market niches, cooperation rather than competion may
encourgae collaboration between partners, and thus synergies may be more likely
to occur. Integrating these insights, we suggest that diversity of an alliance
portfolio will have a positive effect on the partners in the alliance portfolio.
Hypothesis 2a: When a focal firm announces corporate events, the partner firms’
abnormal returns will be positively associated with diversity of the alliance
portfolio.

- 43 -
3.2.4. Portfolio diversity and environmental munificence
Firms secure resources from their environments in order to survive (Katz
& Kahn, 1966), and they can more easily obtain such needed resources in high
munificence than in low munificence environments (Randolph & Dess, 1984).
Therefore, the less munificent a firm’s environment the more effort the firm will
be required to exert in order to obtain outside resources (Staw & Szwajkowski,
1975). Competition for resources thus tends to be more intense in low
munificence environments than in high munificence environments (Dess & Beard,
1984).
When an alliance portfolio is composed of firms that operate in the same
industry (hence the alliance portfolio has low diversity) and that thus the firms
need the same kinds of resources, multilateral competition for inputs tends to
develop (Lavie, 2007) in the alliance portfolio. Since, as argued above, general
competition for resources tends to be more severe in low munificence than high
munificence environments (Dess & Beard, 1984), multilateral competition in
alliance portfolios may be correspondingly more severe under conditions of low
munificence. This intensified multilateral competition may create more serious
conflicts and less effective synergies within the portfolio. In contrast, under high
munificence, diversity of alliance portfolios may not be as important. Since firms
in the latter condition can more easily secure outside resources, conflicts may also
be less likely to occur in alliance portfolios assembled in a munificent context.
Thus, we suggest the following:
- 44 -
Hypothesis 2b: The positive relationship between portfolio diversity and partners’
abnormal returns will be stronger in low munificence environments than in high
munificence environments.
3.2.5. Portfolio density
Firms exchange varied resources through inter-firm ties, and the extent to
which the firms are embedded within the networks of the ties affects their
performance (Gulati, 1998; Uzzi, 1996). However, with regard to the rents that a
firm can generate from the structure of its alliance network, controversy surrounds
the effects of the connections between alliance partners: the “Burt rent”, versus
the “Coleman rent” (Bae & Gargiulo, 2004; Burt, 1992; Coleman, 1988; Kogut,
2000).
Burt explores the notion of the “structural holes,” defining it as “the
separation between nonredundant contacts” and a “relationship of nonredundancy
between two contacts” (1992). In turn, he posits that these structural holes create
a competitive advantage for an actor whose relationships span the holes. To
support his argument, he takes the notion of tertius gaudens from the work of
Georg Simmel, which literally means “the third who benefits” (Simmel, (1922)
1955). Tertius gaudens can be thought of as the third actor in a triad relation, who
can play the other actors off each other for his or her own benefit. He concludes
that actors (or “players” in his own use) with contact networks optimized for
- 45 -
structural holes enjoy high rates of return on their investment, because they know
about, have a hand in, and exercise control over more rewarding opportunities.
On the contrary, assuming that a certain kind of social structure is
especially important in facilitating some forms of social capital, Coleman argues
that social capital is effectively generated in densely connected networks (1988).
According to the author, a densely connected network facilitates the existence of
the obligations, expectations and social norms. Also, in a densely connected ego
network, partners of the ego coordinate each other to help the ego (Coleman,
1990). Thus, densely connected networks are the essential means for creating and
maintaining social capital, and subsequently enhancing performance (Coleman,
1988; Lin, Cook, & Burt, 2001).
These two conflicting arguments suggest that a firm can generate two
different types of rents depending on how its alliance portfolio is composed.
Whereas the Burt rent advocates the benefits of sparse portfolios full of structural
holes, the Coleman rent advocate densely connected portfolios. In a sense,
however, it seems that Burt is looking at the brokering location of a firm in a
large alliance network while Coleman is instead talking about property of an
individual firm’s alliance portfolio. In another sense, it seems that Burt argues the
rent is more effectively generated across alliance portfolios, whereas Coleman
argues the rent is more effectively generated within an alliance portfolio (Oh,
Choi, & Kim, 2005). Nevertheless, both view the phenomenon “from a focal
firm’s perspective” (Kogut, 2000). Shifting the perspective away from the focal
firm to its partner firms, however, we suggest that the partners who are embedded
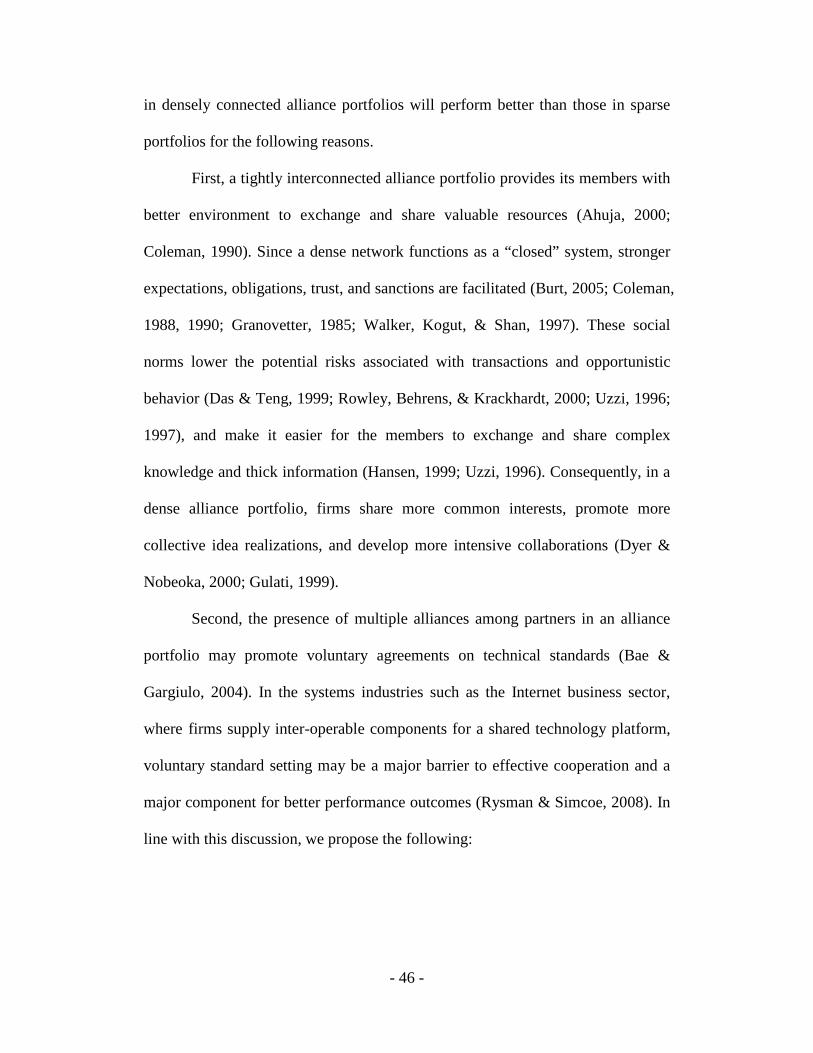
- 46 -
in densely connected alliance portfolios will perform better than those in sparse
portfolios for the following reasons.
First, a tightly interconnected alliance portfolio provides its members with
better environment to exchange and share valuable resources (Ahuja, 2000;
Coleman, 1990). Since a dense network functions as a “closed” system, stronger
expectations, obligations, trust, and sanctions are facilitated (Burt, 2005; Coleman,
1988, 1990; Granovetter, 1985; Walker, Kogut, & Shan, 1997). These social
norms lower the potential risks associated with transactions and opportunistic
behavior (Das & Teng, 1999; Rowley, Behrens, & Krackhardt, 2000; Uzzi, 1996;
1997), and make it easier for the members to exchange and share complex
knowledge and thick information (Hansen, 1999; Uzzi, 1996). Consequently, in a
dense alliance portfolio, firms share more common interests, promote more
collective idea realizations, and develop more intensive collaborations (Dyer &
Nobeoka, 2000; Gulati, 1999).
Second, the presence of multiple alliances among partners in an alliance
portfolio may promote voluntary agreements on technical standards (Bae &
Gargiulo, 2004). In the systems industries such as the Internet business sector,
where firms supply inter-operable components for a shared technology platform,
voluntary standard setting may be a major barrier to effective cooperation and a
major component for better performance outcomes (Rysman & Simcoe, 2008). In
line with this discussion, we propose the following:

- 47 -
Hypothesis 3a: When a focal firm announces corporate events, the partner firms’
abnormal returns will be positively associated with density of the alliance
portfolio.
3.2.6. Portfolio density and environmental munificence
When environmental munificence is high thus resources available outside
the firms are abundant, it is relatively easy for firms to survive; hence they
become more able to pursue goals other than survival (Castrogiovanni, 1991), and
they can generate slack resources which allow them to fund strategic activities
such as organizational innovation and conflict resolution (Dess & Beard, 1984).
By contrast, when environmental munificence is low thus resources are
scarcely available, organizations devote greater attention to understanding and
mastering threats and seeking survival (Khandwalla, 1973). Since they are forced
to compete intensely for more resources (Dess & Beard, 1984; Yasai-Ardekani,
1989), organizations may even be impelled to commit illegal acts (Staw &
Szwajkowski, 1975). Therefore, to secure survival, a firm may have stronger
incentives to contemplate “self-interest-seeking with guile” and risk “opportunism”
within its alliance portfolio in a low munificence environment than in a high
munificence environment (Williamson, 1993). For instance, between the U.S. soft
drink manufacturers and their independent bottlers, contracting norms were
opportunistically violated when external environments changed to be competitive
and hostile (Muris, Scheffman, & Spiller, 1992).

- 48 -
Changes in the external environment and the resulting changes in
the strategies of Coca-Cola and Pepsi-Cola raised the costs of
contracting between them and their independent bottlers.
Throughout the 1980’s, in particular during the so-called “Cola
Wars,” there was a need for rapidly changing strategies, in the
form of new product introductions, packaging, promotion deals,
advertising content, and pricing. A failure to make strategy
changes would create a considerable competitive disadvantage.
However, many independent bottlers not only refused to
participate in the various programs, but opportunistically extracted
“special concessions” in exchange for participation (Wathne &
Heide, 2000: 40, quotation marks in original).
However, strong social norms such as trust and obligations which are
facilitated within densely connected alliance portfolios (Burt, 2005; Coleman,
1990) significantly lower the possibility of those opportunistic behaviors among
the firms in the alliance portfolios (Das & Teng, 1999; Uzzi, 1996; 1997). In line
with this discussion, we propose the following:
Hypothesis 3b: The positive relationship between portfolio density and partners’
abnormal returns will be stronger in low munificence environments than in high
munificence environments.
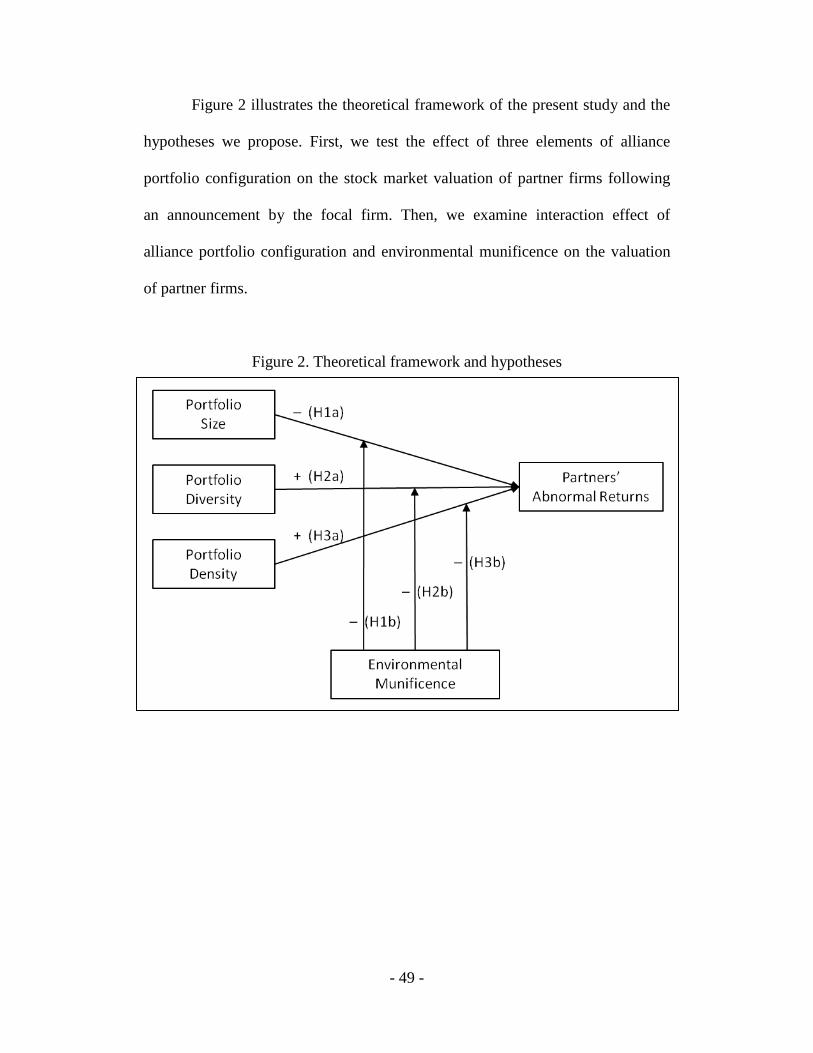
- 49 -
Figure 2 illustrates the theoretical framework of the present study and the
hypotheses we propose. First, we test the effect of three elements of alliance
portfolio configuration on the stock market valuation of partner firms following
an announcement by the focal firm. Then, we examine interaction effect of
alliance portfolio configuration and environmental munificence on the valuation
of partner firms.
Figure 2. Theoretical framework and hypotheses

- 50 -
This page left intentionally blank.
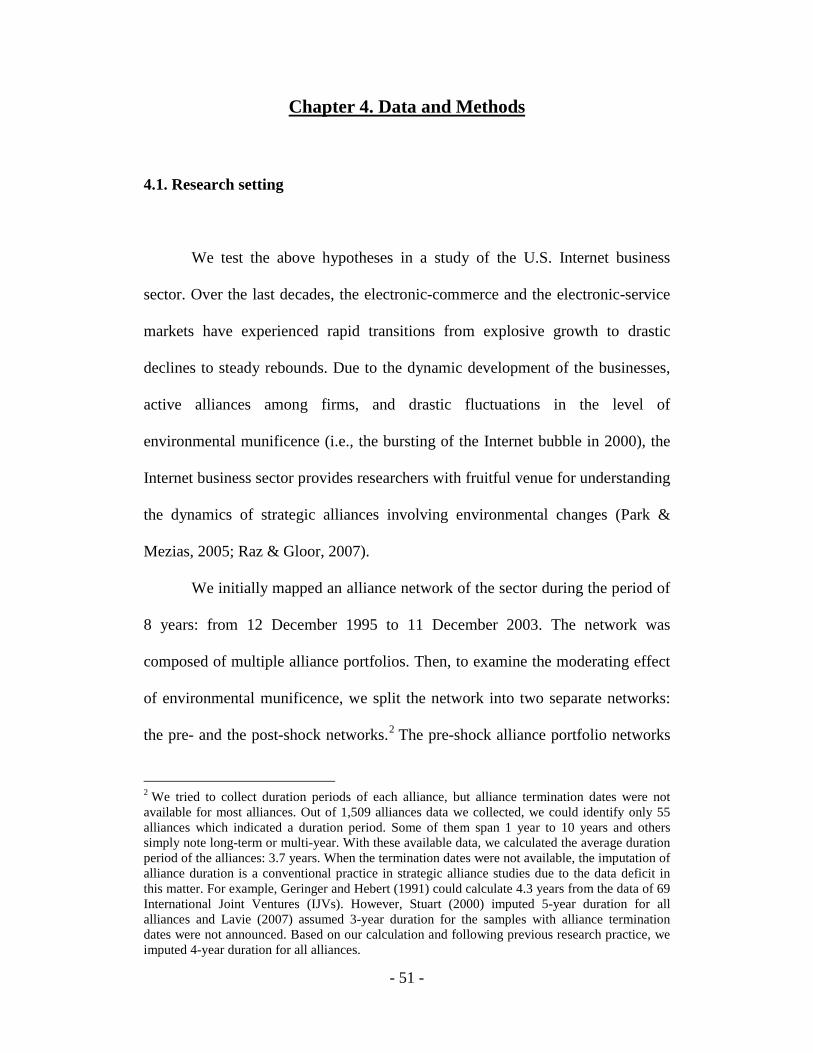
- 51 -
Chapter 4. Data and Methods
4.1. Research setting
We test the above hypotheses in a study of the U.S. Internet business
sector. Over the last decades, the electronic-commerce and the electronic-service
markets have experienced rapid transitions from explosive growth to drastic
declines to steady rebounds. Due to the dynamic development of the businesses,
active alliances among firms, and drastic fluctuations in the level of
environmental munificence (i.e., the bursting of the Internet bubble in 2000), the
Internet business sector provides researchers with fruitful venue for understanding
the dynamics of strategic alliances involving environmental changes (Park &
Mezias, 2005; Raz & Gloor, 2007).
We initially mapped an alliance network of the sector during the period of
8 years: from 12 December 1995 to 11 December 2003. The network was
composed of multiple alliance portfolios. Then, to examine the moderating effect
of environmental munificence, we split the network into two separate networks:
the pre- and the post-shock networks.2
2 We tried to collect duration periods of each alliance, but alliance termination dates were not available for most alliances. Out of 1,509 alliances data we collected, we could identify only 55 alliances which indicated a duration period. Some of them span 1 year to 10 years and others simply note long-term or multi-year. With these available data, we calculated the average duration period of the alliances: 3.7 years. When the termination dates were not available, the imputation of alliance duration is a conventional practice in strategic alliance studies due to the data deficit in this matter. For example, Geringer and Hebert (1991) could calculate 4.3 years from the data of 69 International Joint Ventures (IJVs). However, Stuart (2000) imputed 5-year duration for all alliances and Lavie (2007) assumed 3-year duration for the samples with alliance termination dates were not announced. Based on our calculation and following previous research practice, we imputed 4-year duration for all alliances.
The pre-shock alliance portfolio networks

- 52 -
were identified for the period from 12 December 1995 to 11 December 1999, in
which the level of environmental munificent was relatively high. The post-shock
alliance portfolio networks were identified for the period from 12 December 1999
to 11 December 2003, in which the level of environmental munificent was
relatively low.
Then we collected data on corporate events during the three months just
after the date of the mapping of networks: from 12 December 1999 to 10 March
2000 for the pre-shock period, and 12 December 2003 to 10 March 2004 for the
post-shock period. Figure 3 exhibits the research setting.
Figure 3. Research setting
4.2. Sample and data

- 53 -
As the first step, we collected data on strategic alliances between 120 focal
firms and their partners. The focal firms were selected mainly from the
component firms of the Dow Jones Internet Index (DJINET).3
We broadly defined a strategic alliance so that it included joint R&D,
research consortia, long-term sourcing agreements, OEM contracts, licensing,
joint marketing, shared distribution, equity swaps, and equity joint ventures
(Auster, 1994; Contractor & Lorange, 1988; Yoshino & Rangan, 1995).
The focal firms
included retailers such as Amazon.com and e-Bay, portals such as Yahoo! and
Google, software firms such as VeriSign and Macromedia, and others such as
AOL and Akamai Technologies. But we excluded telecommunications companies
such as AT&T and MCI WorldCom, and hardware firms such as IBM and Intel.
Also, following the methodology used in previous studies, quasi Internet business
firms, such as Dell Computers, 800flowers.com and Microsoft, were excluded
because their business operations were based on their stronger off-line
organizations rather than on-line ones (e.g., Park & Mezias, 2005; Park, Mezias,
& Song, 2004).
3 We found that a number of Internet sector-specific stock price indices have been published by various institutions, and that each institution endeavors to compose best samples in order to reflect and predict the stock prices of the Internet firms. Therefore, we decided to adopt the component firms of the index(es). We examined appropriateness of varied Internet Indexes including the DJINET, the Bloomberg E-commerce Indexes, the Fortune e-50, and the TheStreet.com Internet Sector Index. Though we had considered combining component firms from multiple indexes, we chose the DJINET as the only base for the selection of sample firms for some reasons. First, the DJINET covers both ‘e-commerce’ and ‘e-service’ firms. On the other hand, other indexes are composed of either only pure e-commerce firms or wide range of firms including net hardware firms and net telecommunication firms. We believe the DJINET best represents the Internet industry. Second, the DJINET is the first ‘Internet Index’ and has been regularly published since 1997, while others have intermittently. Lastly, DJINET maintains consistent and objective methodology to select its sample firms. A firm can be a sample only when at least 50% of its annual sales/revenue generated from the Internet, its stock has a trading history of at least three months, its market capitalization is at least $100 million, its average three-month trading stock price is at least $10 and it passes liquidity tests for sufficient trading activity (for details of DJINET, see http://indexes.dowjones.com/mdsidx/index.cfm?event=showInternet.)

- 54 -
Following previous studies (e.g., Gulati, 1995; Park, Mezias, & Song, 2004),
however, we excluded temporary cooperative arrangements such as one-week
joint sales promotions, since those short-term events are decided by relatively
insignificant tactics rather than long-term corporate strategy.
We searched the records of alliances formed by each focal firm from 12
December 1995 to 11 December 2003 in the SDC Platinum database. Then, in
order to ensure more complete coverage of publicly announced alliances (Anand
& Khanna, 2000; Lavie, 2007), we collected alliances announcements from the
Lexis/Nexis database and Factiva database, and complemented and corrected the
SDC data. Following this work, we tracked a corporate history including name
changes, mergers, acquisitions, and spin-offs from Mergent Online and Hoover’s
Company Records, and made additional corrections. In total, we identified 774
dyadic alliances in the pre-shock period between 83 focal firms and unique
partner firms, and 659 in the post-shock period between 81 focal firms and 340
partners. With these alliances data, we mapped two separate alliances networks.
In turn, from the Lexis/Nexis database, we collected records of public
announcements made by focal firms during the three month periods of 12
December 1999 to 10 March 2000 (the pre-shock period) and 12 December 2003
to 10 March 2004 (the post-shock period). We searched and selected firm-specific
announcements including profit statements, strategic alliances, mergers and
acquisitions, stock splits, lawsuits, and layoffs. To control for potential
confounding effects (McWilliams & Siegel, 1997), we excluded any
announcements coinciding with any other announcements surrounding the three
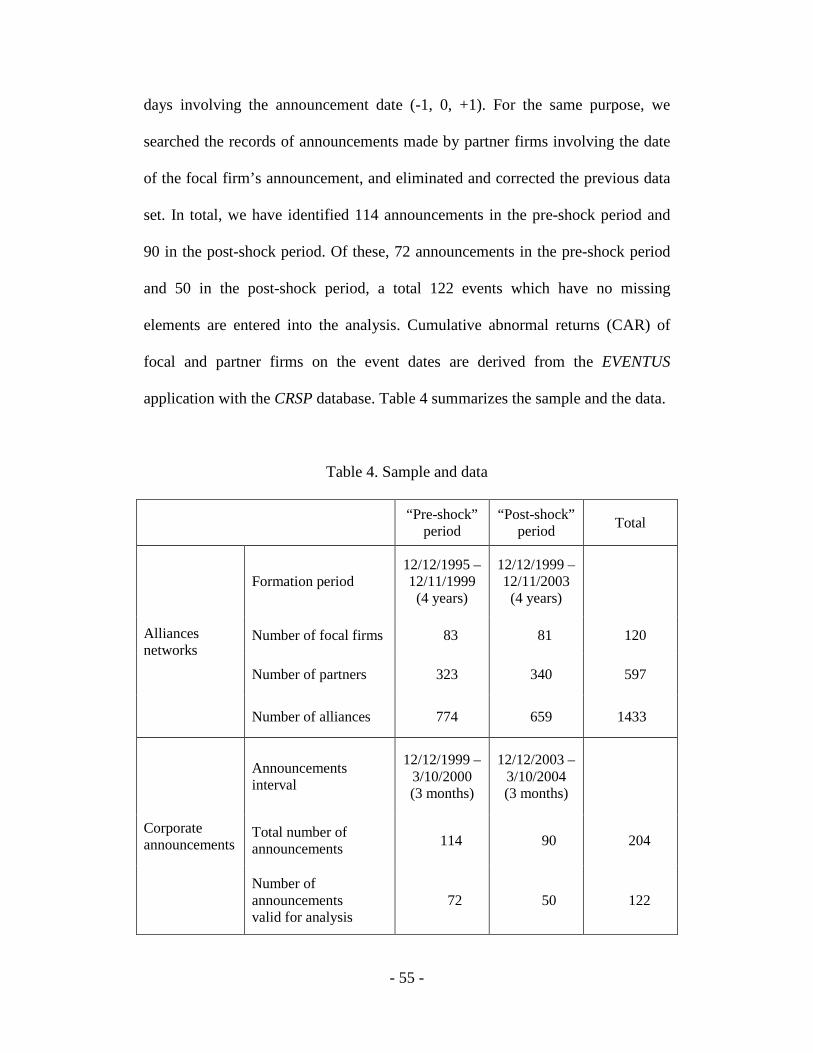
- 55 -
days involving the announcement date (-1, 0, +1). For the same purpose, we
searched the records of announcements made by partner firms involving the date
of the focal firm’s announcement, and eliminated and corrected the previous data
set. In total, we have identified 114 announcements in the pre-shock period and
90 in the post-shock period. Of these, 72 announcements in the pre-shock period
and 50 in the post-shock period, a total 122 events which have no missing
elements are entered into the analysis. Cumulative abnormal returns (CAR) of
focal and partner firms on the event dates are derived from the EVENTUS
application with the CRSP database. Table 4 summarizes the sample and the data.
Table 4. Sample and data
“Pre-shock” period
“Post-shock” period Total
Alliances networks
Formation period 12/12/1995 – 12/11/1999
(4 years)
12/12/1999 – 12/11/2003
(4 years)
Number of focal firms 83 81 120
Number of partners 323 340 597
Number of alliances 774 659 1433
Corporate announcements
Announcements interval
12/12/1999 – 3/10/2000 (3 months)
12/12/2003 – 3/10/2004 (3 months)
Total number of announcements 114 90 204
Number of announcements valid for analysis
72 50 122

- 56 -
Additionally, we extracted firm-specific data, such as age, sales volume
and total assets of focal firms from Mergent Online and Compustat for the fiscal
years of 1999 (the pre-shock period) and 2003 (the post-shock period).
4.3. Methods
We employ an event study method, which originates in finance research
and is commonly used to examine the valuation implications of firm-specific
announcements. The standard approach is based on estimating a market model for
each firm and then calculating abnormal returns, which are assumed to reflect the
stock market’s reaction to the arrival of new information (McWilliams & Siegel,
1997). In strategic management, abnormal returns have been used to study
changes in firms’ valuations during the event windows surrounding
announcements of mergers, joint ventures, alliances, research and development
plans, and new product introductions (Chaney, Devinney, & Winer, 1991; Das,
Sen, & Sengupta, 1998; Oler, Harrison, & Allen, 2008; Ozcan & Overby, 2008;
Park & Mezias, 2005; Zantout & Tsetsekos, 1994).
To assess stock market reactions to firms, we use market-adjusted CAR
during an event window of 3 days (-1, 0, +1) surrounding announcements made
by the focal firms. The short window of day -1 to +1 has been frequently used in
economic and management research (e.g., Das, Sen, & Sengupta, 1998; Koh &
Venkatraman, 1991; Park & Mezias, 2005). Because it is relatively easy to
identify confounding effects with a short event window (McWilliams & Siegel,

- 57 -
1997) thus providing accurate estimation of stock market reaction even during
anomalies like stock market crashes (Fama, 1998), use of a short window is
advocated in research in dynamic industry such as e-commerce sector (Ljungqvist
& Wilhelm, 2003; Park & Mezias, 2005).
We employ multiple regression analyses to test the models using the
PASW 17.0 statistics software package. We first enter control variables; then the
three explanatory variables; and finally the three interaction terms (Aiken, West,
& Reno, 1991).
4.4. Variable description
4.4.1. Dependent variable: partners’ abnormal returns
It is reported that the market impact of corporate announcements varies
with the size of the firm. For example, market valuation change is larger for
smaller participating firms following alliance announcements (Burton, 2007), and
a negative relationship exists between firm size and abnormal returns for the firms
announced initiating joint ventures (Jones & Danbolt, 2004). To control size of
partner firms, we took value-weighted portfolio approach. Revising the equation
Burton suggested (2007: 69), we calculated CAR of partners on the event date as
follows:
∑∑=
=
=n
in
ii
iitpt
S
SCARCAR1
1

- 58 -
where, ptCAR = CAR of the partners in the ego-network in announcement time t;
itCAR = CAR of the partner firm i in time t;
n = the number of partners in the ego-network; and
Si = sales volume of the partner firm i at the prior fiscal year of time t.
4.4.2. Independent variables
Size of the alliance portfolio
In prior research, contingent on the research purposes, either the number
of alliances of a focal firm (Ahuja, 2000; Baum, Calabrese, & Silverman, 2000;
Stuart, 2000) or the number of alliance partners of a focal firm (Bae & Gargiulo,
2004; Soh & Roberts, 2005), or both (Koka & Prescott, 2002; 2008) have been
used to measure the portfolio size as a count variable. Firms can ally with same
partners multiple times during a certain time period for different, similar, or even
the same purposes. Therefore, when a focal firm has multiple or repetitive
alliances with a same partner, the number of ties can be large while the number of
partners is small. Since we are interested in the firms who connected directly each
other within an alliance portfolio, we take the number of unique (i.e., not repeated)
partners instead of the number of ties.
It is reported that an inherent association exists between portfolio size and
firm size (Hagedoorn, Sadowski, & Schakenraad, 1997). Also, the preliminary
analysis results show the correlation between these two variables is moderately

- 59 -
high (r = 0.508, p < 0.001). Thus, following Lavie (2007), we calculate the
portfolio size variable by taking natural logarithm of the number of partners
divided by the total assets of the focal firm.
Diversity of the alliance portfolio
The diversity of an alliance portfolio can be measured by gauging
heterogeneity of industry (Ozcan & Overby, 2008), technology (McGill &
Santoro, 2009), industry and nationality (Goerzen & Beamish, 2005), or
technology and nationality (Koka & Prescott, 2008) of the member firms in the
alliance portfolio. Or, it can also be measured by gauging heterogeneity of
alliance types such as R&D, marketing, distribution, and investment alliances
(Gulati, 1999; Powell, Koput, & Smith-Doerr, 1996). In this study we employ
industry diversity of the firms in an alliance portfolio for two reasons (Ozcan &
Overby, 2008). First, it is the most commonly used measure in studies of inter-
firm networks and research on alliances (Anand & Khanna, 2000; Beckman,
Haunschild, & Phillips, 2004). Second, this construct is the most convenient for
analyses of financial market behavior as the social structure of the stock market
hinges on an industry based classificatory system (Zuckerman, 1999).
Following Cummings (2004) and Kuk (2006), we operationalized
portfolio diversity by calculating structural diversity of each alliance portfolio
using an entropy-based index (Shannon & Weaver, 1949; Teachman, 1980). We
measured it as follows:

- 60 -
∑−= iik logppD
where, Dk = portfolio diversity index of the portfolio k; and
pi = the probability of a specific SIC i being found in the portfolio.
For each ego-network, we identified SICs of all unique partner firms on a four-
digit basis, and then computed pi for each SIC by dividing the number of unique
firms belonging to that code by the total number of unique firms in the ego-
network. The greater the heterogeneity of the alliance portfolio, the higher the
score on the index.
Density of the alliance portfolio
To operationalize portfolio density, we use an ego-density measure. An
ego refers to an individual focal node in social network studies. The boundary of
an ego-network is defined in terms of neighborhood, which is the collection of the
ego and all nodes to whom ego has a connection and thus includes all of the ties
among all of the actors to whom ego has a direct connection (Hanneman & Riddle,
2005). An ego-density is the ratio of the number of actual ties to the potential
number of ties (Borgatti, Everett, & Freeman, 2002; Wasserman & Faust, 1994).
We calculated the portfolio density by taking natural logarithm of the ego-density.
Portfolio density = NL (Ego-density)
We measure the ego-density using UCINET 6 (Borgatti, Everett, & Freeman,
2002). Higher values on this measure reflect firms whose ego-networks are
densely connected to each other.
- 61 -
4.4.3. Moderator: environmental munificence
Several studies have demonstrated a clear contrast between high and low
munificent periods before and after the bubble crash in 2001 in the Internet
business sector (Doms, 2004; Park & Mezias, 2005). 4
Following Park and Mezias (2005), we operationalize environmental
munificence (EM) using a dummy variable. We coded 1 for the high munificence
time period prior to March 11, 2000 (the pre-shock period), and 0 for the low
munificence time period after March 11, 2000 (the post-shock period).
Table 5 shows the dramatic
changes of economic indicators including bankruptcy filings, IPO performance
and sector-specific stock indices, which clearly depict the drastic shift of the level
of environmental munificent in the Internet business sector.
4.4.4. Interaction variables
To examine joint effects of three elements of alliance portfolio
configuration (i.e., the size, diversity, and density of alliance portfolio) and
environmental munificence, we have constructed interaction terms. We calculate
each interaction term as a product of each portfolio configuration variable and the
Environmental Munificence variable. To minimize correlation among interaction
terms without affecting coefficient estimates, we employ the mean centering
4 Environmental jolts create rare chances to perform “natural experiments” in social science (Meyer, 1982). Examples of environmental jolts that produce a quantum (dichotomous) shift in environmental munificence include the Internet bubble crash in 2000 (Park & Mezias, 2005) and the Asian Economic Crisis in 1997 (Chakrabarti, Singh, & Mahmood, 2007; Wan & Yiu, 2009).
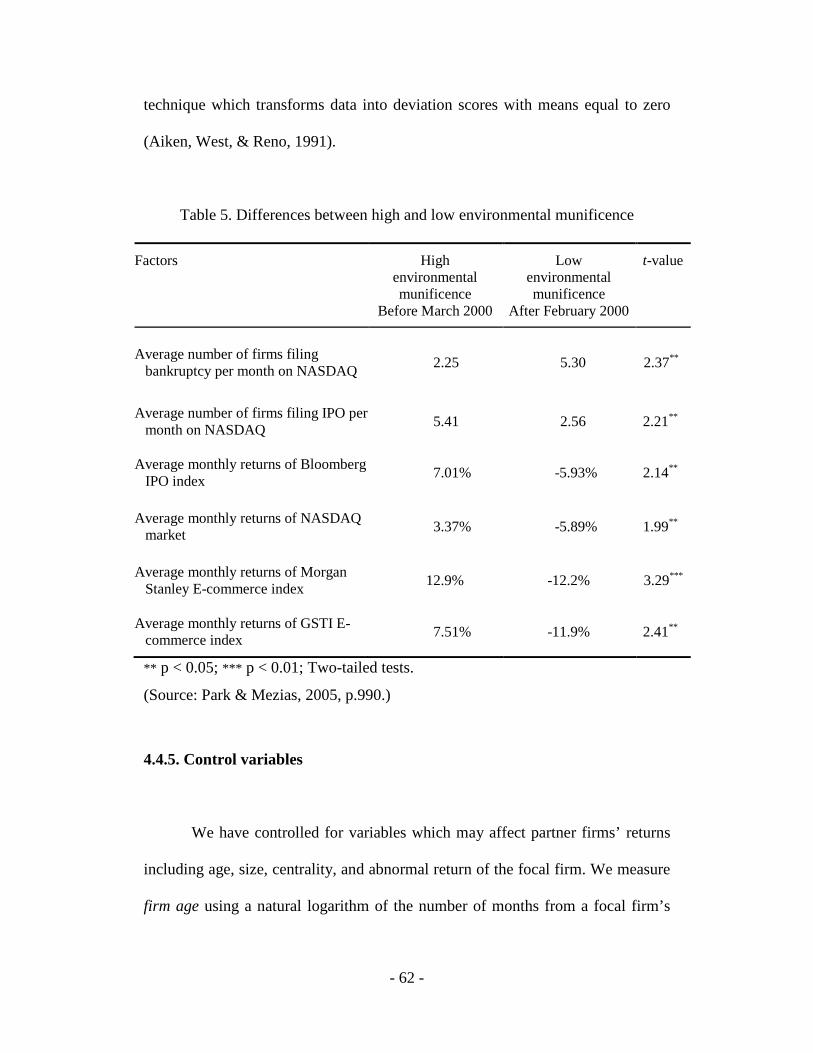
- 62 -
technique which transforms data into deviation scores with means equal to zero
(Aiken, West, & Reno, 1991).
Table 5. Differences between high and low environmental munificence
Factors High environmental munificence
Before March 2000
Low environmental munificence
After February 2000
t-value
Average number of firms filing bankruptcy per month on NASDAQ 2.25 5.30 2.37**
Average number of firms filing IPO per month on NASDAQ 5.41 2.56 2.21**
Average monthly returns of Bloomberg IPO index 7.01% -5.93% 2.14**
Average monthly returns of NASDAQ market 3.37% -5.89% 1.99**
Average monthly returns of Morgan Stanley E-commerce index 12.9% -12.2% 3.29***
Average monthly returns of GSTI E-commerce index 7.51% -11.9% 2.41**
** p < 0.05; *** p < 0.01; Two-tailed tests.
(Source: Park & Mezias, 2005, p.990.)
4.4.5. Control variables
We have controlled for variables which may affect partner firms’ returns
including age, size, centrality, and abnormal return of the focal firm. We measure
firm age using a natural logarithm of the number of months from a focal firm’s

- 63 -
founding to the announcements. We also measure firm size using a natural
logarithm of the sales volume in fiscal years of 1999 and 2003 respectively.
Social network research suggests that being central in a network provides
an ego with power and prestige and thus information advantage, control benefit
and learning (Degenne & Forse, 1999; Gulati, 1999). Consequently, firms with
central network positions may perform well (Gnyawali & Madhavan, 2001;
Powell, Koput, & Smith-Doerr, 1996). Among the most widely used centrality
indicators such as betweenness centrality, degree centrality and closeness
centrality, we lay our focus on betweenness centrality which captures direct and
indirect pathways for information and resource flows (Ahuja, 2000; Owen-Smith
& Powell, 2004). Betweenness centrality refers to the extent to which an actor lies
between other actors in the network (Freeman, 1978).
We control for focal firms’ centrality by using a natural logarithm of
normalized betweenness centrality, calculating it as follows (Degenne & Forse,
1999; Wasserman & Faust, 1994):
∑<
=kj
jkijkiB gngnC )()(
where, CB(ni) = betweenness centrality for firm i;
gjk = the number of geodesics between firms j and k; and
gjk(ni) = the number of geodesics between firms j and k that contains firm i.
[ ]2)2)(1()()(' −−= ggnn iBiB CC
where, C’B(ni) = normalized betweenness centrality for firm i; and
[(g-1)(g-2)/2] = the maximum betweenness centrality.
- 64 -
The network property of normalized betweenness centrality comes from UCINET
6 (Borgatti, Everett, & Freeman, 2002).
Finally, we control for the focal firm’s abnormal return since we expect
wealth spillover from a focal firm to its partners. We measure the variable using
the focal firm’s CAR on the event date, which is accessed in the CRSP database.
Table 6 provides a summary description of the variables used in our research
model.

- 65 -
Table 6. Descriptions of variables
Variable name Variable description
Dependent variable Partners’ abnormal returns
The average of cumulative abnormal returns (CAR) of the partners on the event date, weighted by the size (sales volume) of the partner firms
Independent variables Portfolio size (PSz)
Natural logarithm of the number of partners, weighted by the size (total assets) of the focal firm
Portfolio diversity (PDv) Index of diversity of the industries of the partners, identified by four-digit SICs Portfolio density (PDn) Natural logarithm of the ego-density of the alliance portfolio
Moderator Environmental munificence (EM)
Dummy variable set to 1 if environmental munificence is high and 0 if low
Interaction variable EM × PSz
Interaction variable of environmental munificence and the size of the alliance portfolio
EM × PDv Interaction variable of environmental munificence and the diversity of the alliance portfolio EM × PDn Interaction variable of environmental munificence and density of the alliance portfolio
Control variables Age
Natural logarithm of the number of months from a focal firm’s founding to the announcements
Size Natural logarithm of the sales volume of a focal firm Centrality Natural logarithm of normalized betweenness centrality of a focal firm Focal firm’s abnormal return Focal firm’s CAR on the event date

- 66 -
This page left intentionally blank.
- 67 -
Chapter 5. Results
5.1. Descriptive statistics
Table 7 reports the means, standard deviations, and correlations among the
variables. To check for the possibility of multicollinearity, we examined the
variance inflation factors (VIFs). Maximum VIF score is 6.53 and the mean VIF
score is 3.79. Since 10 or less score is taken as the cut-off for the VIF (Cohen,
2003), our data are not likely to contain serious multicollinearity among the
variables.5
5.2. Hypothesis tests
Table 8 presents findings from the multiple regression analysis. Following
previous studies (e.g., Dehning, Richardson, & Zmud, 2007), we have winsorized
the regression result at ± 2 standard deviations to avoid the biasing effects of
outliers. Model 1 displays a base set of control variables. This model is not
significant, explaining 2.7 percent of the variance in partner firms’ abnormal
returns. Model 2 includes three variables for main effects. It is significant,
explaining 31.6 percent of the variance in partner firms’ abnormal returns. Finally,
Model 3 is the full model including interaction effects. The full model is also 5 We checked for the basic regression diagnostics including linearity, normality, independence and
homoscedasticity by examining partial regression plot, residual plot, normal probability plot and Durbin-Watson statistic (d=2.001). According to the results, we transformed some variables (i.e., portfolio size, portfolio density, age, size, and centrality) by taking the natural log to mitigate violations of assumptions.

68
Table 7. Means, standard deviation, and correlations Variable M SD 1 2 3 4 5 6 7 8
1 Partners’ Abnormal Returns -1.289 2.297
2 Focal firm’s Age 4.458 .558 .169**
3 Focal firm’s Size 5.734 1.821 .125* .644***
4 Focal firm’s Betweenness Centrality 1.287 1.015 .122* .295*** .546***
5 Focal firm’s Abnormal Returns .343 11.078 .125* -.099 -.085 -.173**
6 Portfolio Size (PSz) 2.074 1.407 -.122* -.395*** -.365*** .078 -.014
7 Portfolio Diversity (PDv) 1.287 .616 .160** .259*** .575*** .629*** -.201** .048
8 Portfolio Density (PDn) -3.469 1.214 -.116 -.134* -.354*** -.729*** .030 -.092 -.343***
9 Environmental Munificence (EM) .590 .494 .462*** -.459*** -.203** -.179** -.012 -.293*** .140* .367*** n = 122; * p < 0.1; ** p < 0.05; *** p < 0.01

69
significant explaining 32.9 percent of the variance in partner firms’ abnormal
returns. We detail our hypothesis tests below.
Table 8. Results of regression analysis
Variable Model 1 Model 2 Model 3
Controls only Adding Main Effects
Adding Interactions
Focal firm’s Age .176 -.193 -.242* Focal firm’s Size -.040 -.073 -.124 Focal firm’s Betweenness Centrality .119 .023 .048 Focal firm’s Abnormal Return .160* .180** .175** Environmental Munificence (EM) -.719*** -.655*** Portfolio Size (PSz) -.012 -.087 Portfolio Diversity (PDv) .467*** .496*** Portfolio Density (PDn) .267** .478*** EM × PSz .110 EM × PDv -.097 EM × PDn -.277** Adjusted R2 .027 .316 .329 n = 122; * p < 0.10; ** p < 0.05; *** p < 0.01
5.2.1. Main effects
In Hypothesis 1a, we have suggested a negative effect of the Portfolio Size
on partner firms’ abnormal returns. This hypothesis is not supported in either
model. The standardized coefficient for the Portfolio Size is negative but not
significant both in the main effects model and in the overall model (Model 2, β =
-0.012; n.s., Model 3, β = -0.087; n.s.). In Hypothesis 2a, we have predicted a
70
positive relationship between Portfolio Diversity and partner firms’ abnormal
returns. This hypothesis is supported in both models (Model 2, β = 0.467; p <
0.01, Model 3, β = 0.496; p < 0.01). Finally, Hypothesis 3a, which hypothesized a
positive effect of Portfolio Density on partner firms’ abnormal returns, is
supported in both models (Model 2, β = 0.267; p < 0.05, Model 3, β = 0.478; p <
0.05).
5.2.2. Interaction effects
In Hypothesis 1b, we have examined the interaction of Portfolio Size with
Environmental Munificence on partner firms’ abnormal returns. The results do
not support this hypothesis (β = 0.110; n.s.). In Hypothesis 2b, we have argued
that Portfolio Diversity and Environmental Munificence have an interaction effect
on partner firms’ abnormal returns. We do not find support for this hypothesis
either (β = -0.097; n.s.). Conversely, Hypothesis 3b, which argued for the
interaction of Portfolio Density with Environmental Munificence on partner firms’
abnormal returns, is supported (β = -0.277; p < 0.05). While Portfolio Density
generally has a positive effect on abnormal returns of partners, its impact is
stronger during the period of low munificence.
5.2.3. Control variables

71
Our data do not find any significant relationships between partner firms’
abnormal returns and the focal firm’s age, size, and structural position. As
expected, however, we find positive and significant relationships between the
focal firm’s return and its partners’ returns in all of our models (Model 1, β =
0.160; p < 0.10, Model 2, β = 0.180; p < 0.05, Model 3, β = 0.175; p < 0.05).
Figure 4 summarizes the overall results of our hypothesis tests.
Figure 4. Results of hypothesis tests
H1a: β = -0. 087; n.s., H1b: β = 0.110; n.s., H2a: β = 0.496; p < 0.01, H2b: β = -0. 097; n.s., H3a: β = 0.478; p < 0.05, H3b: β = -0. 277; p < 0.05

72
This page left intentionally blank.

73
Chapter 6. Discussion and Conclusions
6.1. Findings and discussion
In this thesis, we have examined the effects of the alliance portfolio
configuration on the stock market valuation of the partners, incorporating the
moderating effect of environmental munificence into the research model. The
findings indicate that the diversity and density of the alliance portfolio positively
affect the valuation of the partners following announcements of major events
involving the focal firm. More specifically, these findings suggest that chances to
access diverse resources and to create synergies through cooperation are higher
when the alliance portfolio is composed of widely diverse firms (Koka & Prescott,
2002; Parise & Casher, 2003; Stuart, 2000). Similarly, stronger social norms are
facilitated in densely connected alliance portfolios, thus the potential risks
associated with opportunistic behaviors are lower and sharing of valuable
resources is encouraged in those alliance portfolios (Coleman, 1990; Gulati, 1999;
Rowley, Behrens, & Krackhardt, 2000). Therefore, firms allied to a focal firm that
maintains higher portfolio diversity and/or higher portfolio density are likely to
enjoy greater abnormal returns when the focal firm announces corporate events.
Interestingly, however, portfolio size does not appear to be related to the
stock market valuation of the partners when the focal firm announces corporate
events. We have hypothesized an inverse relationship between portfolio size and
partner returns, because as the portfolio size increases, so does the difficulty to
74
interact and collaborate frequently. Our data do not support this hypothesis. The
result suggests that portfolio size may generate two opposing effects which can
nullify each other. On one hand, as we have hypothesized, increased size may
reduce the interaction frequency among the members of an alliance portfolio,
which may result in decreased synergetic benefits, and subsequently lower market
valuation. On the other hand, a “size advantage” may exist which helps the
members of an alliance portfolio to create additional benefits. For example, firms
can accelerate their growth and develop innovation capabilities with ease when
many firms establish coalitions and share resources (Stuart, 2000). Consequently,
portfolio size may serve both positive and negative roles in value creation for
partner firms.
We have found that environmental munificence has a negative moderating
effect on the relationship between portfolio density and the partners’ market
valuation. We have posited that when resources are scarce firms may risk
opportunism within their alliance portfolios but strong social norms in densely
connected alliance portfolios may lower the possibility of opportunistic behaviors.
The result supports the hypothesis. This finding implies that, although higher
portfolio density seems to be generally associated with greater abnormal returns
of partners, the positive impact of density on such returns appears to be greater in
low munificence environments than in high munificence environments.
By contrast, the moderating effect of environmental munificence does not
appear to influence the relationships between the other two configuration
parameters, size and diversity, and the stock market valuation of the partners. This
75
suggests that perhaps the impacts of both portfolio size and portfolio diversity on
the partners’ market valuation occur regardless of the level of environmental
munificence that is present. With regard to the portfolio size, this could result
from the fact that investor perceptions of the partner firms are driven by different
processes than those related to perceptions of the focal firm. It may be the case
that the signals of firm strength or weakness that were theorized to underlie
investor perceptions of the portfolio size relate primarily to the perceptions of the
focal firm, rather than the partner firms. With regard to the portfolio diversity, we
might posit that the beneficial effects of such diversity for partners’ market
valuation accrue regardless of the level of external resources available in the
environment. In this sense, the advantages of diversity may be more a
characteristic of the alliance-based interactions of dissimilar firms than of the
external context within which these entities operate.
6.2. Contributions to research
This study makes the following research contributions. First, using event
study methods, we have identified the extent to which value-creation takes place
between a focal firm and its partner firms, upon the announcement of a major
event involving the focal firm. Most of the event studies in the strategic alliances
literature have thus far focused primarily on the valuation impact on a focal firm
following a new event or announcement (Das, Sen, & Sengupta, 1998; Kale, Dyer,
& Singh, 2002; Park & Mezias, 2005). Only recently has research examined how

76
the alliance formation between a focal firm and its partner firms impacts the
valuation of rival firms (Oxley, Sampson, & Silverman, 2009; Zantout &
Tsetsekos, 1994). However, no stylized facts have been presented in the event
study research regarding a value-creation between a focal firm and its partner
firms who are in the same alliance portfolio (Anand & Khanna, 2000; Das, Sen, &
Sengupta, 1998).
Furthermore, our research contributes to the growing body of literature on
alliance portfolios by monitoring the partners’ valuation in conjunction with a
focal firm’s alliance portfolio. Most previous alliance portfolio research has
examined the impact of the alliance portfolio characteristics on the focal firm only
(Hoffmann, 2007; Koka & Prescott, 2008; Lavie, 2007; McGill & Santoro, 2009).
Although valid and useful, this approach offers limited insights into the value-
creation in the inter-organizational networks. By conceptualizing the alliance
portfolio as an ego-network, our study seeks to explore the recursive and
cooperative dynamics embedded in alliance portfolios with particular reference to
the partners’ valuation.
Finally, we have examined how environmental munificence moderates the
impact of the properties of alliance portfolios on the stock market’s valuation of
the partner firms when the focal firm announces a corporate event. In extant
literature, one stream of research has investigated the effect of the alliance
portfolio configuration on firm performance (e.g., Hoffmann, 2007; Lavie, 2007;
Wassmer, 2010), and another stream has looked into the impact of environmental
munificence on firm performance (e.g., Baum & Wally, 2003; Goll & Rasheed,
77
1997, 2004; McArthur & Nystrom, 1991). To help integrate these two streams of
research, our study have assessed how environmental munificence regulates the
impact of the alliance portfolio configuration on the partners’ valuation.
6.3. Managerial implications
Many firms today are engaged in a wide range of strategic alliances.
Consequently, the management of strategic alliances has become an important
strategic issue for the firms. However, even the firms that pursue alliance-related
strategies tend to formulate and implement their strategies at the business level,
not at the corporate level (Hoffmann, 2005). This implies that firms still manage
strategic alliances primarily at the dyadic level, not at the alliance portfolio level,
though what really matters is not the success or failure of a single alliance but the
bundle of alliances (Hoffmann, 2007; Parise & Casher, 2003). The findings of this
study suggest the need for managers to focus on the management of the alliance
portfolio as a whole rather than on individual dyads.
The current study provides also practitioners with prescriptive guidance
and assistance with respect to alliance-related decision-makings. The results of
our study provide managers with a deeper understanding of the potential value of
the proposed alliances, contingent on the configuration of alliance portfolios of
the potential partner firms. The results therefore help managers identify the
alliance partners who can maximize their firm’s value. For example, when
evaluating several alternative alliance proposals, a firm can assess the current and

78
potential value inherent in the alliance portfolios of the potential partner firms
based on the size, diversity, and density of their alliance portfolios, and then
choose the one that maximizes its own value. Moreover, our study provides
suggestions to managers regarding when, in terms of the level of environmental
munificence, they may establish a strategic alliance with a particular partner for
their value maximization.
The results provide the management of the firms with practical guidelines
as to how to construct and configure an alliance portfolio in such a way that
creates as much value as possible. Indeed, the alliance portfolio configuration is
not the outcome of a random process but is driven by business strategy
(Hoffmann, 2007). Furthermore, the findings provide the focal firm with a
specific course of action that is germane to its multi-alliance management.
6.4. Limitations and directions for future research
This study has limitations which may provide directions for future
research. First, due to the size and complexity of the data, we have been forced to
restrict our attention to a somewhat narrow set of the industrial sector. However,
the industry-specific context may influence the direction and magnitude of the
relationships we have examined (Rowley, Behrens, & Krackhardt, 2000).
Therefore, it would be helpful to replicate this study in distinct multiple industries
(e.g., Rowley, Behrens, & Krackhardt, 2000), or using industry-level data (e.g.,
Powell, Koput, & Smith-Doerr, 1996).

79
Second, we have focused on three key parameters of the alliance portfolio
configuration, and tested with them the effect of each parameter on partners’
abnormal returns. However, we do not argue that these three parameters wholly
represent the configuration of alliance portfolios. Alliance portfolio configuration
is about the content of alliance portfolios; it is a complex concept comprising
multiple dimensions (e.g., redundancy, the strength of ties, and certain partner-
related characteristics) (Wassmer, 2010). For example, although we have
examined the effect of diversity of the partners who comprise an alliance portfolio,
other characteristics of partners may have equal or even greater importance.
Indeed, for Canadian biotechnology firms to grow rapidly, links with government
organizations are more important than links with venture capital firms, large firms,
or research laboratories (both public and private) (Niosi, 2003). Hence, we may
infer that kind or quality of partners can also have an important influence on the
market valuation of the partners. Therefore, research may extend this study by
utilizing additional parameters of the alliance portfolio configuration.
Third, organizational environments are multidimensional, and can be
classified into various dimensions such as munificence, dynamism, complexity,
and uncertainty (Dess & Beard, 1984; Rajagopalan, Rasheed, & Datta, 1993).
Each dimension may affect or moderate market valuation. Although our research
focuses primarily on environmental munificence, future research incorporating
other environmental dimensions could be appropriate.
Fourth, we have assessed stock market reactions to corporate
announcements using CAR as a proxy for firm performance in a broad sense.
80
However, future studies may investigate other aspects of performance such as
profitability, growth, firm survival, and innovation output. By employing such
diverse measures, we may come to a deeper understanding of the value-creation
dynamics among the members of alliance portfolios.
Fifth, we have operationalized the degree of environmental munificence
using a dummy variable, due to the Internet sector’s distinct pattern of
environmental munificence which is demarcated by an environmental shock or
jolt in 2000 (i.e., the Internet bubble crash). Although this dichotomous variable
was used in previous studies due to its terseness and effectiveness (Park & Mezias,
2005), continuous scale measures, such as the growth rate and sales volume, have
also been utilized when applicable (Baum & Wally, 2003; Dess & Beard, 1984;
Goll & Rasheed, 1997; Rasheed & Prescot, 1992). We might speculate that a
more fine-grained measurement of this construct may have revealed a relationship
between size and diversity and the partners’ market valuation. Therefore, by
utilizing continuous scale measures instead of dummy variables, future studies
may more precisely identify circumstances where a moderating role of
environmental munificence is operative in the relationship between the alliance
portfolio configuration and partners’ market valuations.
Sixth, we have put corporate events into the analysis without
distinguishing their types or magnitude. Some types of events may have greater
importance than others. For example, the announcement of mergers and
acquisitions may have a stronger impact on abnormal returns than the
announcement of strategic alliances. There may also be varying impacts within
81
the same broad type of events such as strategic alliances. For instance, Das and
his coauthors (1998) reported that, across industries, technology alliance
announcements generate greater abnormal returns than marketing alliance
announcements. Conversely, Park and his coauthors (2004) found that, within the
e-commerce sector, marketing announcements generate greater abnormal returns
than technology alliance announcements. By taking into the differences of nature
or type of announcements, future studies may more precisely assess the impact of
corporate announcements.
Finally, the results are drawn only from the quantitative study. By carrying
out qualitative methods such as survey or interviews with managers, the result of
the study and its managerial implications would be more meaningful and richer.
For instance, though we assumed 4-year duration for all alliances due to the data
deficit, by surveying managers in the sample firms a more accurate measure
would be available (e.g., Jiang, Aulakh, & Pan, 2008; Kale, Dyer, & Singh, 2002).
It would be also meaningful to investigate the impact of managerial aspects such
as the presence of the dedicated alliance management function (Dyer, Kale, &
Singh, 2001; Hoffmann, 2005), strategic orientations for alliance portfolio
management (Hoffmann, 2007; Sarkar, Aulakh, & Madhok, 2009) and alliance
management capability (Heimeriks, Klijn, & Reuer, 2009; Schreiner, Kale, &
Corsten, 2009), which could be assessed by survey and interviews.

82
6.5. Summary and conclusions
In summary, we have found that both diversity and density of alliance
portfolios are positively correlated with partners’ market value. In addition, we
have found that environmental munificence moderates the relationship between
portfolio density and partners’ market valuation. We believe that, despite its
limitations, this study provides meaningful contributions to research and practice
by taking the partners’ standpoint and examining value-creation dynamics in
alliance portfolios. We hope that our study establishes a useful foundation for
future research in the management of alliance portfolios.
83
References
Ahuja, G. 2000. Collaboration networks, structural holes, and innovation: A longitudinal study. Administrative Science Quarterly, 45(3): 425-455.
Aiken, L. S., West, S. G., & Reno, R. R. 1991. Multiple regression: Testing and interpreting interactions. Newbury Park, CA: Sage Publications.
Aldrich, H. 1979. Organizations and environments. Englewood Cliffs, NJ: Prentice-Hall.
Anand, B. N., & Khanna, T. 2000. Do firms learn to create value?: The case of alliances. Strategic Management Journal, 21(3): 295-315.
Asquith, P., & Mullins, D. W. 1986. Signaling with dividends, stock repurchases, and equity issues. Financial Management, 15(3): 27-44.
Auster, E. R. 1994. Macro and strategic perspectives on interorganizational linkages: A comparative analysis and review with suggestions for reorientation. In P. Shrivastava, A. S. Huff, & J. E. Dutton (Eds.), Advances in strategic management, Volume 10B: 3-40. Greewich, Connecticut: JAI Press Inc.
Bae, J. H., & Gargiulo, M. 2004. Partner substitutability, alliance network structure, and firm profitability in the telecommunications industry. Academy of Management Journal, 47(6): 843-859.
Bandura, A. 1977. Social learning theory. Englewood Cliffs, NJ: Prentice Hall.
Barney, J. 1991. Firm resources and sustained competitive advantage. Journal of Management, 17(1): 99-120.
Barringer, B. R., & Harrison, J. S. 2000. Walking a tightrope: Creating value through interorganizational relationships. Journal of Management, 26(3): 367-403.
Baum, J. A. C., Calabrese, T., & Silverman, B. S. 2000. Don't go it alone: Alliance network composition and startups' performance in Canadian biotechnology. Strategic Management Journal, 21(3): 267-294.
Baum, J. A. C., & Oliver, C. 1991. Institutional linkages and organizational mortality. Administrative Science Quarterly, 36(2): 187-218.
Baum, J. R., & Wally, S. 2003. Strategic decision speed and firm performance. Strategic Management Journal, 24(11): 1107-1129.
Beard, D. W., & Dess, G. G. 1988. Modeling organizational species interdependence in an ecological community: An Input-Output approach. Academy of Management Review, 13(3): 362-373.
Beckman, C. M., Haunschild, P. R., & Phillips, D. J. 2004. Friends or strangers? Firm-specific uncertainty, market uncertainty, and network partner selection. Organization Science, 15(3): 259-275.
84
Bhagat, S., Brickley, J. A., & Coles, J. L. 1994. The costs of inefficient bargaining and financial distress: Evidence from corporate lawsuits. Journal of Financial Economics, 35(2): 221-247.
Borgatti, S. P., Everett, M. G., & Freeman, L. C. 2002. UCINET for Windows: Software for social network analysis. Harvard, MA: Analytic Technologies.
Boulding, K. E. 1978. Ecodynamics: A new theory of societal evolution. Beverly Hills, CA: Sage Publications.
Burt, R. S. 1992. Structural holes: The social structure of competition. Cambridge, MA: Harvard University Press.
Burt, R. S. 2001. Structural holes versus network closure as social capital. In N. Lin, K. Cook, & R. S. Burt (Eds.), Social capital: Theory and research: 31-56. New York, NY: Aldine de Gruyter.
Burt, R. S. 2005. Brokerage and closure: An introduction to social capital. New York, NY: Oxford University Press.
Burton, B. 2007. The market impact of corporate alliance announcements: Value-weighted versus equally weighted portfolio returns. Applied Financial Economics Letters, 3(1): 67-70.
Castrogiovanni, G. J. 1991. Environmental munificence: A theoretical assessment. Academy of Management Review, 16(3): 542-565.
Chakrabarti, A., Singh, K., & Mahmood, I. 2007. Diversification and performance: Evidence from east Asian firms. Strategic Management Journal, 28(2): 101-120.
Chaney, P. K., Devinney, T. M., & Winer, R. S. 1991. The impact of new product introductions on the market value of firms. Journal of Business, 64(4): 573-610.
Chattopadhyay, P., Glick, W. H., & Huber, G. P. 2001. Organizational actions in response to threats and opportunities. Academy of Management Journal, 44(5): 937-955.
Child, J. 1972. Organizational structure, environment and performance: The role of strategic choice. Sociology, 6(1): 1-22.
Cohen, J. 2003. Applied multiple regression/correlation analysis for the behavioral sciences (3rd ed.). Mahwah, NJ: L. Erlbaum Associates.
Coleman, J. S. 1988. Social capital in the creation of human capital. The American Journal of Sociology, 94: S95-S120.
Coleman, J. S. 1990. Foundations of social theory. Cambridge, MA: Harvard University Press.
Contractor, F. J., & Lorange, P. 1988. Cooperative strategies in international business. Cambridge, MA: Lexington Books.
Covin, J. G., & Slevin, D. P. 1989. Strategic management of small firms in hostile and benign environments. Strategic Management Journal, 10(1): 75-87.

85
Cummings, J. N. 2004. Work groups, structural diversity, and knowledge sharing in a global organization. Management Science, 50(3): 352-364.
Cyert, R. M., & March, J. G. 1963. A behavioral theory of the firm. Englewood Cliffs, NJ: Prentice-Hall.
Darr, E. D., & Kurtzberg, T. R. 2000. An investigation of partner similarity dimensions on knowledge transfer. Organizational Behavior and Human Decision Processes, 82(1): 28-44.
Das, S., Sen, P. K., & Sengupta, S. 1998. Impact of strategic alliances on firm valuation. Academy of Management Journal, 41(1): 27-41.
Das, T. K., & Teng, B.-S. 1999. Managing risks in strategic alliances. The Academy of Management Executive, 13(4): 50-62.
Das, T. K., & Teng, B.-S. 2002. Alliance constellations: A social exchange perspective. The Academy of Management Review, 27(3): 445-456.
Das, T. K., & Teng, B. S. 2000. A resource-based theory of strategic alliances. Journal of Management, 26(1): 31-61.
Datta, D. K., Pinches, G. E., & Narayanan, V. K. 1992. Factors influencing wealth creation from mergers and acquisitions: A meta-analysis. Strategic Management Journal, 13(1): 67-84.
Deeds, D. L., & Hill, C. W. L. 1996. Strategic alliances and the rate of new product development: An empirical study of entrepreneurial biotechnology firms. Journal of Business Venturing, 11(1): 41-55.
Degenne, A., & Forse, M. 1999. Introducing social networks. London: SAGE.
Dehning, B., Richardson, V. J., & Zmud, R. W. 2007. The financial performance effects of IT-based supply chain management systems in manufacturing firms. Journal of Operations Management, 25(4): 806-824.
Dess, G. G., & Beard, D. W. 1984. Dimensions of organizational task environments. Administrative Science Quarterly, 29(1): 52-73.
Dill, W. R. 1958. Environment as an influence on managerial autonomy. Administrative Science Quarterly, 2(4): 409-443.
Dimaggio, P. J., & Powell, W. W. 1983. The iron cage revisited: Institutional isomorphism and collective rationality in organizational fields. American Sociological Review, 48(2): 147-160.
Doms, M. E. 2004. The boom and bust in information technology investment. Economic Review Federal Reserve Bank of San Francisco: 19-34.
Doz, Y. L. 1996. The evolution of cooperation in strategic alliances: Initial conditions or learning processes? Strategic Management Journal, 17: 55-83.
Doz, Y. L., & Hamel, G. 1998. Alliance advantage: The art of creating value through partnering. Boston, MA: Harvard Business School Press.

86
Dyer, J. H., Kale, P., & Singh, H. 2001. How to make strategic alliances work. MIT Sloan Management Review, 42(4): 37-43.
Dyer, J. H., & Nobeoka, K. 2000. Creating and managing a high-performance knowledge-sharing network: The Toyota case. Strategic Management Journal, 21(3): 345-367.
Dyer, J. H., & Singh, H. 1998. The relational view: Cooperative strategy and sources of interorganizational competitive advantage. Academy of Management Review, 23(4): 660-679.
Eddy, A., & Seifert, B. 1992. Stock price reactions to dividend and earnings announcements: Contemporaneous versus noncontemporaneous announcements. Journal of Financial Research, 15(3): 207-217.
Eisenhardt, K. M., & Schoonhoven, C. B. 1996. Resource-based view of strategic alliance formation: Strategic and social effects in entrepreneurial firms. Organization Science, 7(2): 136-150.
Fama, E. F. 1998. Market efficiency, long-term returns, and behavioral finance. Journal of Financial Economics, 49(3): 283-306.
Fleming, L., & Sorenson, O. 2001. Technology as a complex adaptive system: Evidence from patent data. Research Policy, 30(7): 1019-1039.
Freeman, L. C. 1978. Centrality in social networks conceptual clarification. Social Networks, 1(3): 215-239.
Gemser, G., Leenders, M., & Wijnberg, N. M. 1996. The dynamics of inter-firm networks in the course of the industry life cycle: The role of appropriability. Technology Analysis & Strategic Management, 8(4): 439-453.
Geringer, J. M., & Hebert, L. 1991. Measuring performance of international joint ventures. Journal of International Business Studies, 22(2): 249-263.
Glaister, K. W., & Buckley, P. J. 1996. Strategic Motives For International Alliance Formation. Journal of Management Studies, 33(3): 301-332.
Gnyawali, D. R., & Madhavan, R. 2001. Cooperative networks and competitive dynamics: A structural embeddedness perspective. Academy of Management Review, 26(3): 431-445.
Goerzen, A., & Beamish, P. W. 2005. The effect of alliance network diversity on multinational enterprise performance. Strategic Management Journal, 26(4): 333-354.
Goll, I., & Rasheed, A. A. 1997. Rational decision-making and firm performance: The moderating role of environment. Strategic Management Journal, 18(7): 583-591.
Goll, I., & Rasheed, A. A. 2004. The moderating effect of environmental munificence and dynamism on the relationship between discretionary social responsibility and firm performance. Journal of Business Ethics, 49(1): 41-54.
Gomes-Casseres, B. 1996. The alliance revolution: The new shape of business rivalry. Cambridge, MA: Harvard University Press.

87
Granovetter, M. S. 1973. The strength of weak ties. American Journal of Sociology, 78(6): 1360-1380.
Granovetter, M. S. 1982. The strength of weak ties: A network theory revisited. In P. V. Marseden, & N. Lin (Eds.), Social structure and network analysis. Beverly Hills, CA: Sage.
Granovetter, M. S. 1985. Economic action and social structure: The problem of embeddedness. American Journal of Sociology, 91(3): 481-510.
Gulati, R. 1995. Social structure and alliance formation patterns: A longitudinal analysis. Administrative Science Quarterly, 40(4): 619-652.
Gulati, R. 1998. Alliances and networks. Strategic Management Journal, 19: 293-317.
Gulati, R. 1999. Network location and learning: The influence of network resources and firm capabilities on alliance formation, Strategic Management Journal, Vol. 20: 397-420.
Gulati, R. 2007. Managing network resources: Alliances, affiliations and other relational assets. New York, NY: Oxford University Press.
Gulati, R., & Gargiulo, M. 1999. Where do interorganizational networks come from? American Journal of Sociology, 104(5): 1439-1493.
Gulati, R., Nohria, N., & Zaheer, A. 2000. Strategic networks. Strategic Management Journal, 21(3): 203-215.
Gulati, R., & Singh, H. 1998. The architecture of cooperation: Managing coordination costs and appropriation concerns in strategic alliances. Administrative Science Quarterly, 43(4): 781-814.
Hagedoorn, J., Sadowski, B., & Schakenraad, J. 1997. The effect of strategic technology alliances on company performance: A LISREL approach. In M. Ghertman, J. Obadia, & J. L. Arregle (Eds.), Statistical models for strategic management: 309-329. Boston, MA: Kluwer Academic.
Hannan, M. T., & Carroll, G. 1992. Dynamics of organizational populations: density, legitimation, and competition. New York, NY: Oxford University Press.
Hannan, M. T., & Freeman, J. 1989. Organizational ecology. Cambridge, Mass.: Harvard University Press.
Hanneman, R., & Riddle, M. 2005. Introduction to social network methods. Riverside, CA: University of California, Riverside.
Hansen, G. S., & Wernerfelt, B. 1989. Determinants of firm performance: The relative importance of economic and organizational factors. Strategic Management Journal, 10(5): 399-411.
Hansen, M. T. 1999. The search-transfer problem: The role of weak ties in sharing knowledge across organization subunits. Administrative Science Quarterly, 44(1): 82-111.
Hargedoorn, J., & Schakenraad, J. 1992. Leading companies and networks of strategic alliances in information technologies. Research policy, 21(2): 163-190.

88
Harrigan, K. R. 1987. Strategic alliances: Their new role in global competition. Columbia Journal of World Business, 22(2): 67-69.
Harrigan, K. R. 1988. Joint ventures and competitive strategy. Strategic Management Journal, 9(2): 141-158.
Harrison, J. S., Hitt, M. A., Hoskisson, R. E., & Ireland, R. D. 2001. Resource complementarity in business combinations: Extending the logic to organizational alliances. Journal of Management, 27(6): 679-690.
Heimeriks, K. H., Klijn, E., & Reuer, J. J. 2009. Building Capabilities for Alliance Portfolios. Long Range Planning, 42(1): 96-114.
Hennart, J. F. 1988. A transaction costs theory of equity joint ventures. Strategic Management Journal, 9(4): 361-374.
Hennart, J. F. 1991. The transaction costs theory of joint ventures: An empirical study of Japanese subsidiaries in the United States. Management Science, 37(4): 483-497.
Hoffmann, W. H. 2005. How to manage a portfolio of alliances. Long Range Planning, 38(2): 121-143.
Hoffmann, W. H. 2007. Strategies for managing a portfolio of alliances. Strategic Management Journal, 28(8): 827-856.
Ibarra, H. 1993. Network centrality, power, and innovation involvement: Determinants of technical and administrative roles. Academy of Management Journal, 36(3): 471-501.
Inkpen, A. C., & Crossan, M. M. 1995. Believing is seeing: Joint ventures and organizational learning. Journal of Management Studies, 32(5): 595-618.
Inkpen, A. C., & Tsang, E. W. K. 2005. Social capital, networks, and knowledge transfer. Academy of Management Review, 30(1): 146-165.
Ireland, R. D., Hitt, M. A., & Vaidyanath, D. 2002. Alliance management as a source of competitive advantage. Journal of Management, 28(3): 413-446.
Jarillo, J. C. 1988. On Strategic Networks. Strategic Management Journal, 9(1): 31-41.
Jiang, M. S., Aulakh, P. S., & Pan, Y. 2008. Licensing duration in foreign markets: A real options perspective. Journal of International Business Studies, 40(4): 559-577.
Jones, E., & Danbolt, J. 2004. Joint venture investments and the market value of the firm. Applied Financial Economics, 14(18): 1325 - 1331.
Kale, P., Dyer, J. H., & Singh, H. 2002. Alliance capability, stock market response, and long-term alliance success: The role of the alliance function. Strategic Management Journal, 23: 747-767.
Kale, P., & Singh, H. 2009. Managing strategic alliances: What do we know now, and where do we ho from here? Academy of Management Perspectives, 23(3): 45-62.
Katz, D., & Kahn, R. L. 1966. The social psychology of organizations. New York, NY: Wiley.
89
Khandwalla, P. N. 1973. Effect of competition on structure of top management control. Academy of Management Journal, 16(2): 285-295.
Khanna, T. 1998. The scope of alliances. Organization Science, 9(3): 340-355.
Khanna, T., Gulati, R., & Nohria, N. 1998. The dynamics of learning alliances: Competition, cooperation, and relative scope. Strategic Management Journal, 19(3): 193-210.
Kilduff, M., & Tsai, W. 2003. Social networks and organizations. London: SAGE Publications Ltd.
Knoke, D. 2001. Changing organizations: Business networks in the new political economy. Boulder, CO: Westview Press.
Knoke, D. 2009. Playing well together: Creating corporate social capital in strategic alliance networks. American Behavioral Scientist, 52(12): 1690-1708.
Knoke, D., Yang, S., & Granados, F. J. 2002. Dynamics of strategic alliance networks in the global information sector, 1989-2000. Paper presented at the 18th EGOS Colloquium, Barcelona.
Koberg, C. S. 1987. Resource scarcity, environmental uncertainty, and adaptive organizational behavior. Academy of Management Journal, 30(4): 798-807.
Kogut, B. 1988. Joint ventures: Theoretical and empirical perspectives. Strategic Management Journal, 9(4): 319-332.
Kogut, B. 2000. The network as knowledge: Generative rules and the emergence of structure. Strategic Management Journal, 21(3): 405-425.
Koh, J., & Venkatraman, N. 1991. Joint venture formations and stock market reactions: An assessment in the information technology sector. Academy of Management Journal, 34(4): 869-892.
Koka, B. R., & Prescott, J. E. 2002. Strategic alliances as social capital: A multidimensional view. Strategic management journal, 23(9): 795-816.
Koka, B. R., & Prescott, J. E. 2008. Designing alliance networks: The influence of network position, environmental change, and strategy on firm performance. Strategic Management Journal, 29(6): 639-661.
Kraatz, M. S. 1998. Learning by association?: Interorganizational networks and adaptation to environmental change. Academy of Management Journal, 41(6): 621.
Krackhardt, D. 1992. The strength of strong ties: The importance of Philos in organizations. In N. Nohria, & R. G. Eccles (Eds.), Networks and organizations: Structure, form, and action. Boston, MA: Harvard Business School Press.
Kuk, G. 2006. Strategic interaction and knowledge sharing in the KDE developer mailing list. Management Science, 52(7): 1031-1042.
Latham, S. 2009. Contrasting strategic response to economic recession in start-up versus established software firms. Journal of Small Business Management, 47(2): 180-201.

90
Lavie, D. 2006. The competitive advantage of interconnected firms: An extension of the resource-based view. Academy of Management Review, 31(3): 638-658.
Lavie, D. 2007. Alliance portfolios and firm performance: A study of value creation and appropriation in the US software industry. Strategic Management Journal, 28(12): 1187-1212.
Lee, P. M. 1997. A comparative analysis of layoff announcements and stock price reactions in the United States and Japan. Strategic Management Journal, 18(11): 879-894.
Lee, P. M. 2001. What's in a name.com?: The effects of '.com' name changes on stock prices and trading activity. Strategic Management Journal, 22(8): 793-804.
Leenders, R. R. A. J., & Gabbay, S. M. (Eds.). 1999. Corporate social capital and liability. Boston: Kluwer Academic Publishers.
Lin, N. 2001. Social capital: A theory of social structure and action. Cambridge, U.K.; New York, NY: Cambridge University Press.
Lin, N., Cook, K., & Burt, R. S. (Eds.). 2001. Social capital: Theory and research. New york: Walter de Gruyter.
Ljungqvist, A., & Wilhelm, W. J. 2003. IPO pricing in the dot-com bubble. Journal of Finance, 58(2): 723-752.
Lubatkin, M., & Chatterjee, S. 1991. The strategy shareholder value relationship: Testing temporal stability across market cycles. Strategic Management Journal, 12(4): 251-270.
Luo, X. W., & Deng, L. 2009. Do birds of a feather flock higher?: The effects of partner similarity on innovation in strategic alliances in knowledge-intensive industries. Journal of Management Studies, 46(6): 1005-1030.
Madhavan, R., Koka, B. R., & Prescott, J. E. 1998. Networks in transition: How industry events (re)shape interfirm relationships, Strategic Management Journal, Vol. 19: 439-459.
Madhok, A., & Tallman, S. B. 1998. Resources, transactions and rents: Managing value through interfirm collaborative relationships. Organization Science, 9(3): 326-339.
March, J. G. 1991. Exploration and exploitation in organizational learning. Organization Science, 2(1): 71-87.
McArthur, A. W., & Nystrom, P. C. 1991. Environmental dynamism, complexity, and munificence as moderators of strategy-performance relationships. Journal of Business Research, 23(4): 349-361.
McEvily, B., & Zaheer, A. 1999. Bridging ties: A source of firm heterogeneity in competitive capabilities. Strategic Management Journal, 20(12): 1133.
McGill, J. P., & Santoro, M. D. 2009. Alliance Portfolios and Patent Output: The Case of Biotechnology Alliances. IEEE Transactions on Engineering Management, 56(3): 388-401.
91
McKelvey, B. 1982. Organizational systemetics. Berkeley, CA: University of California Press.
McPherson, M., Smith-Lovin, L., & Cook, J. M. 2001. Birds of a feather: Homophily in social networks. Annual Review of Sociology, 27: 415-444.
McWilliams, A., & Siegel, D. 1997. Event studies in management research: Theoretical and empirical issues. Academy of Management Journal, 40(3): 626-657.
Meyer, A. D. 1982. Adapting to environmental jolts. Administrative Science Quarterly, 27(4): 515-537.
Miner, A. S., Amburgey, T. L., & Stearns, T. M. 1990. Interorganizational linkages and population dynamics: Buffering and transformational shields. Administrative Science Quarterly, 35(4): 689-713.
Mitchell, W., & Singh, K. 1996. Survival of businesses using collaborative relationships to commercialize complex goods. Strategic Management Journal, 17(3): 169-195.
Muris, T. J., Scheffman, D. T., & Spiller, P. T. 1992. Strategy and transaction costs: The organization of distribution in the carbonated soft drink industry. Journal of Economics & Management Strategy, 1(1): 83-128.
Nelson, R. E. 1989. The strength of strong ties: Social networks and intergroup. Academy of Management Journal, 32(2): 377.
Niosi, J. 2003. Alliances are not enough explaining rapid growth in biotechnology firms. Research Policy, 32(5): 737-750.
Nohria, N. 1992. Is a network perspective a useful way of studying organizations? In N. Nohria, & R. G. Eccles (Eds.), Networks and organizations: Structure, form, and action. Boston, MA: Harvard Business School Press.
Oh, W., Choi, J. N., & Kim, K. 2005. Coauthorship dynamics and knowledge capital: The patterns of cross-disciplinary collaboration in information systems research. Journal of Management Information Systems, 22(3): 265-292.
Oler, D. K., Harrison, J. S., & Allen, M. R. 2008. The danger of misinterpreting short-window event study findings in strategic management research: An empirical illustration using horizontal acquisitions. Strategic Organization, 6(2): 151-184.
Osborn, R. N., & Hunt, J. G. 1974. Environment and organizational effectiveness. Administrative Science Quarterly, 19(2): 231-246.
Owen-Smith, J., & Powell, W. W. 2004. Knowledge networks as channels and conduits: The effects of spillovers in the Boston biotechnology community. Organization Science, 15(1): 5-21.
Oxley, J. E., Sampson, R. C., & Silverman, B. S. 2009. Arms race or detente? How interfirm alliance announcements change the stock market valuation of rivals. Management Science, 55(8): 1321-1337.

92
Ozcan, P., & Eisenhardt, K. M. 2009. Origin of alliance portfolios: Entrepreneurs, network strategiesm and firm performance. Academy of Management Journal, 52(2): 246-279.
Ozcan, S., & Overby, M. L. 2008. A cognitive model of stock market reactions to multi-firm alliance announcements. Strategic Organization, 6(4): 435-469.
Parise, S., & Casher, A. 2003. Alliance portfolios: Designing and managing your network of business-partner relationships. Academy of Management Executive, 17(4): 25-39.
Park, N. K., & Mezias, J. M. 2005. Before and after the technology sector crash: The effect of environmental munificence on stock market response to alliances of e-commerce firms. Strategic Management Journal, 26(11): 987-1007.
Park, N. K., Mezias, J. M., & Song, J. Y. 2004. A resource-based view of strategic alliances and firm value in the electronic marketplace. Journal of Management, 30(1): 7-27.
Park, S. H., & Russo, M. V. 1996. When competition eclipses cooperation: An event history analysis of joint venture failure. Management Science, 42(6): 875-890.
Payne, G. T., Kennedy, K. H., & Davis, J. L. 2009. Competitive dynamics among service SMEs. Journal of Small Business Management, 47(4): 421-442.
Penrose, E. T. 1959. The theory of the growth of the firm. New York, NY: Wiley.
Pfeffer, J. 1981. Power in organizations. Marshfield, MA: Pitman Pub.
Pfeffer, J. 1987. A resource dependence perspective on intercorporate relations. In M. S. Mizruchi, & M. Schwartz (Eds.), Intercorporate relations: The structural analysis of business. Cambridgeshire; New York: Cambridge University Press.
Pfeffer, J., & Salancik, G. R. 1978. The external control of organizations: A resource dependence perspective. New York, NY: Harper & Row.
Porter, M. E. 1980. Competitive strategy: Techniques for analyzing industries and competitors. New York, NY: Free Press.
Porter, M. E. 1985. Competitive advantage: Creating and sustaining superior performance. New York, NY: Free Press.
Powell, W. W. 1990. Neither market nor hierarchy: Network forms of organization. Research in Organizational Behavior, 12: 295-336.
Powell, W. W., Koput, K. W., & Smith-Doerr, L. 1996. Interorganizational collaboration and the locus of innovation: Networks of learning in biotechnology. Administrative Science Quarterly, 41(1): 116-145.
Prahalad, C. K., & Hamel, G. 1990. The core competence of the corporation. Harvard Business Review, 68(3): 79-91.
Prescott, J. E. 1986. Environments as moderators of the relationship between strategy and performance. Academy of Management Journal, 29(2): 329-346.
93
Rajagopalan, N., Rasheed, A. M. A., & Datta, D. K. 1993. Strategic decision processes: Critical review and future directions. Journal of Management, 19(2): 349-384.
Randolph, W. A., & Dess, G. G. 1984. The congruence perspective of organization design: A conceptual model and multivariate research approach. Academy of Management Review, 9(1): 114-127.
Rasheed, A. M. A., & Prescot, J. E. 1992. Towards an objective classification scheme for organizational task environments. British Journal of Management, 3(4): 197-206.
Raz, O., & Gloor, P. A. 2007. Size really matters: New insights for start-ups' survival. Management Science, 53(2): 169-177.
Rogers, E. M. 1995. Diffusion of innovations (4th ed.). New York, NY: Free Press.
Rosenzweig, E. D. 2009. A contingent view of e-collaboration and performance in manufacturing. Journal of Operations Management, 27(6): 462-478.
Rowley, T., Behrens, D., & Krackhardt, D. 2000. Redundant governance structures: An analysis of structural and relational embeddedness in the steel and semiconductor industries. Strategic Management Journal, 21(3): 369-386.
Rysman, M., & Simcoe, T. 2008. Patents and the performance of voluntary standard-setting organizations. Management Science, 54(11): 1920-1934.
Sarkar, M. B., Aulakh, P. S., & Madhok, A. 2009. Process Capabilities and Value Generation in Alliance Portfolios. Organization Science, 20(3): 583-600.
Scherer, F. M., & Ross, D. 1990. Industrial market structure and economic performance (3rd ed.). Boston, MA: Houghton Mifflin.
Schreiner, M., Kale, P., & Corsten, D. 2009. What really is alliance managment capability and how does it impact alliance outcomes and success? Strategic Management Journal, 30(13): 1395-1419.
Shan, W., Walker, G., & Kogut, B. 1994. Interfirm cooperation and startup innovation in the biotechnology industry. Strategic Management Journal, 15(5): 387-394.
Shannon, C. E., & Weaver, W. 1949. The mathematical theory of communication. Urbana, Il: University of Illinois Press.
Simmel, G. (1922) 1955. Conflict and the web of group affiliations (K. H. Wolff, & R. Bendix, Trans.). New York, NY: Free Press.
Soh, P. H., & Roberts, E. B. 2005. Technology alliances and networks: An external link to research capability. IEEE Transactions on Engineering Management, 52(4): 419-428.
Starbuck, W. H. 1976. Organizations and their environments. In M. D. Dunnette (Ed.), Handbook of industrial and organizational psychology: 1069-1123. Chicago, Il: Rand McNally.
Staw, B. M., & Szwajkowski, E. 1975. Scarcity-munificence component of organizational environments and commission of illegal acts. Administrative Science Quarterly, 20(3): 345-354.
94
Stuart, T. 2000. Interorganizational alliances and the performance of firms: A study of growth and innovation rates in a high-technology industry, Strategic management journal, Vol. 21: 791-811.
Stuart, T. E., Hoang, H., & Hybels, R. C. 1999. Interorganizational endorsements and the performance of entrepreneurial ventures. Administrative Science Quarterly, 44(2): 315-349.
Swedberg, R. 2003. Principles of economic sociology. Princeton, N.J.: Princeton University Press.
Teachman, J. D. 1980. Analysis of population diversity: Measures of qualitative variation. Sociological Methods & Research, 8(3): 341-362.
Thompson, J. D. 1967. Organizations in action: Social science bases of administrative theory. New York, NY: McGraw-Hill.
Ulrich, D. 1987. The population perspective: Review, critique, and relevance. Human Relations, 40(3): 137-152.
Ulrich, D., & Barney, J. B. 1984. Perspectives in organizations - Resource dependnece, efficiency, and population. Academy of Management Review, 9(3): 471-481.
Uzzi, B. 1996. The sources and consequences of embeddedness for the economic performance of organizations: The network effect. American Sociological Review, 61(4): 674-698.
Uzzi, B. 1997. Social structure and competition in interfirm networks: The paradox of embeddedness. Administrative Science Quarterly, 42(1): 35-67.
Vassolo, R. S., Anand, J., & Folta, T. B. 2004. Non-additivity in portfolios of exploration activities: A real options-based analysis of equity alliances in biotechnology. Strategic Management Journal, 25(11): 1045-1061.
Walker, G., Kogut, B., & Shan, W. J. 1997. Social capital, structural holes and the formation of an industry network. Organization Science, 8(2): 109-125.
Wan, W. P., & Hoskisson, R. E. 2003. Home country environments, corporate diversification strategies, and firm performance. Academy of Management Journal, 46(1): 27-45.
Wan, W. P., & Yiu, D. W. 2009. From crisis to opportunity: Environmental jolt, corporate acquisitions, and firm performance. Strategic Management Journal, 30(7): 791-801.
Wasserman, S., & Faust, K. 1994. Social network analysis: Methods and applications. New York, NY: Cambridge University Press.
Wassmer, U. 2010. Alliance portfolios: A review and research agenda. Journal of Management, 36(1): 141-171.
Wathne, K. H., & Heide, J. B. 2000. Opportunism in interfirm relationships: Forms, outcomes, and solutions. Journal of Marketing, 64(4): 36-51.
Wernerfelt, B. 1984. A resource-based view of the firm. Strategic Management Journal, 5(2): 171-180.

95
White, S., & Lui, S. S. Y. 2005. Distinguishing costs of cooperation and control in alliances. Strategic Management Journal, 26(10): 913-932.
Williamson, O. E. 1975. Markets and hierarchies, analysis and antitrust implications: A study in the economics of internal organization. New York, NY: Free Press.
Williamson, O. E. 1985. The economic institutions of capitalism: Firms, markets, relational contracting. New York, NY: Free Press.
Williamson, O. E. 1993. Calculativeness, trust, and economic organization. Journal of Law & Economics, 36(1): 453-486.
Yasai-Ardekani, M. 1989. Effects of environmental scarcity and munificence on relationship of context to organizational structure. Academy of Management Journal, 32(1): 131-156.
Yoshino, M. Y., & Rangan, U. S. 1995. Strategic alliances: An entrepreneurial approach to globalization. Boston, MA: Harvard Business School Press.
Zaheer, A., & Bell, G. G. 2005. Benefiting from network position: Firm capabilities, structural holes, and performance. Strategic Management Journal, 26(9): 809-825.
Zantout, Z. Z., & Tsetsekos, G. P. 1994. The wealth effects of announcements of R&D expenditure increases. Journal of Financial Research, 17(2): 205.
Zuckerman, E. W. 1999. The categorical imperative: Securities analysts and the illegitimacy discount. American Journal of Sociology, 104(5): 1398-1438.

![Pas de décision collective sans appropriation individuelle MN/5.6.8/1 M. Noucher [ OPDE 2008 ] Pas de décision collective sans appropriation individuelle](https://img.pdfslide.us/doc/110x75/551d9da2497959293b8d23f9/pas-de-decision-collective-sans-appropriation-individuelle-mn5681-m-noucher-opde-2008-pas-de-decision-collective-sans-appropriation-individuelle.jpg)