Embed Size (px)
Citation preview

Value Chain: Concept, history and approaches for socio-economic and policy analysis
International agricultural seminar: The value chain approach. Collectif Stratégies Alimentaires (CSA), 27 November 2013, Brussels
Jean Balié, FAO
1. What is a value chain?
2. What is the history / background of this concept?
3. What is the relationship between producers and other agents in the value chain really about?
4. Value chain analysis for what? Why such interest for value chain-based policies and investment programmes?
5. So what ? Is value chain analysis the solution for better policy making?
Outline
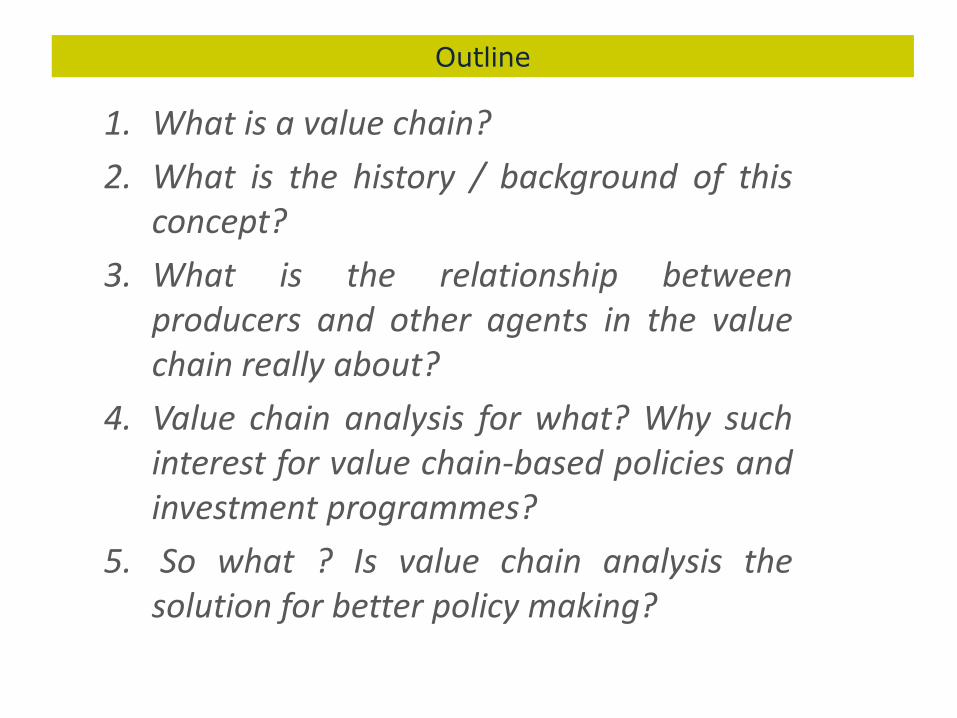
What is a value chain ?
A value chain is a portion of an economic system where upstream agents (producers) are linked to downstream partners by technical, economic, territorial, institutional and social relationships.
International Market
Producers
Consumers
Exporters/Importers
Processors
Collectors
Retailers
Wholesalers
Country
Border
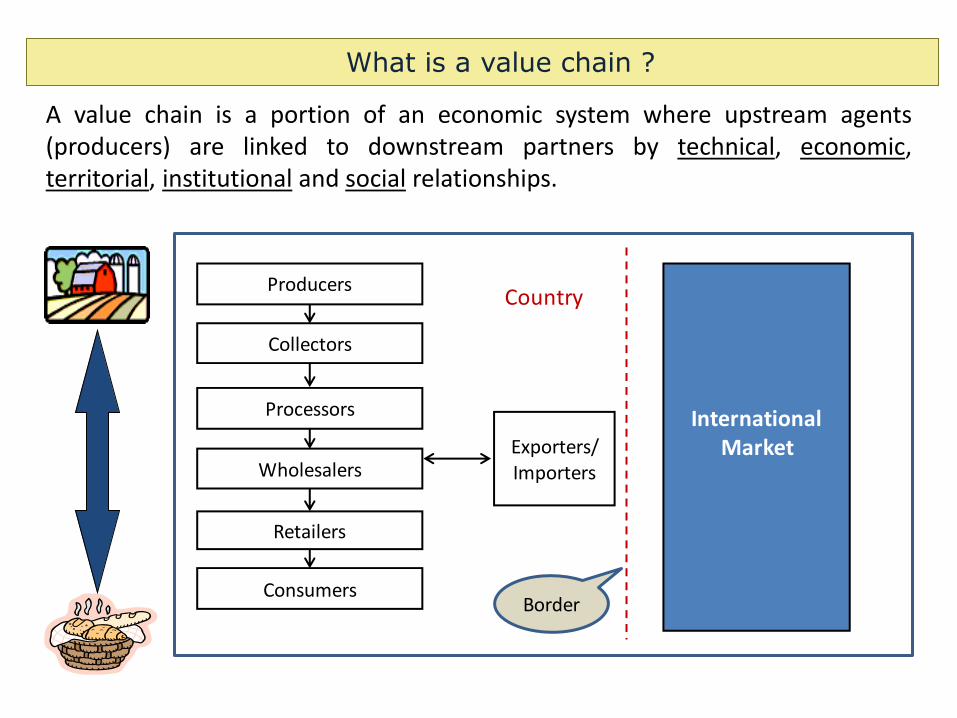
History of value chain
• Value chain concept: Michael Porter, 1980s • Anglophone: concept of Global Commodity
Chains (Gereffi, 1990 s) linking households, enterprises and states to one another within the world economy
• Francophone: concept of “Filière”‖(INRA/CIRAD, 1960s)‖ meso-economy; interdependence; technical and technological changes along the chain (Morvan, 1985)
• 3 main types of analysis : – Technical / physical and/or – Economic / financial and/or – Organizational / institutional
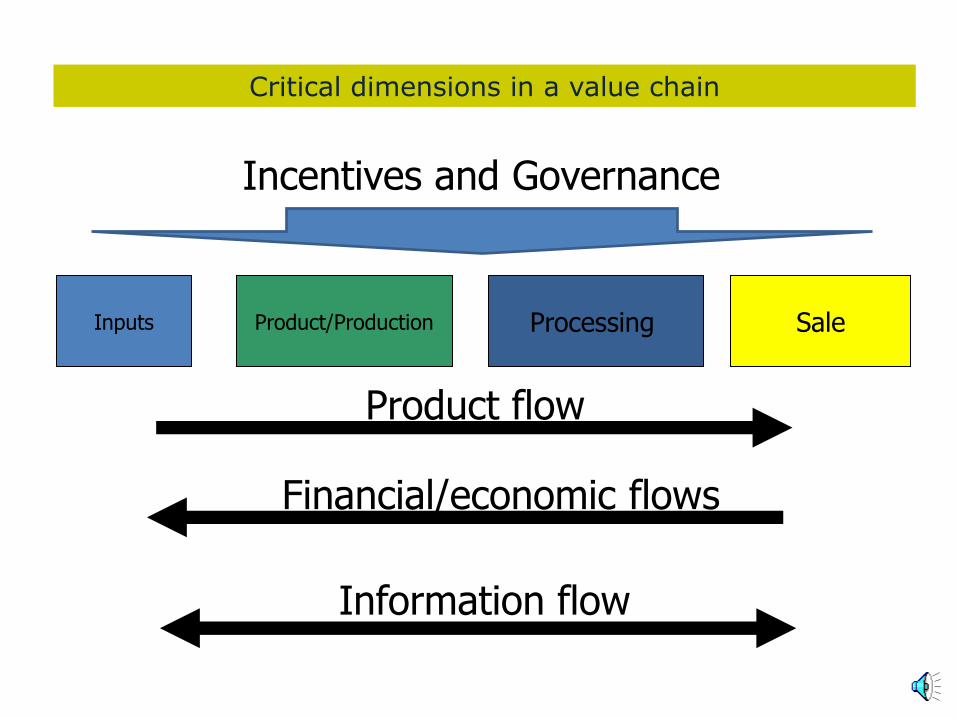
Inputs Product/Production Processing Sale
Product flow
Financial/economic flows
Information flow
Incentives and Governance
Critical dimensions in a value chain

Why Value Chain Analysis (VCA) is important for policy-making?
Understand how a portion of the economic system works and could better work.
Identify the role of the government and related policy options.
Quantify in physical/monetary terms the likely impacts of policy options.
Monitor/assess value chain performances
VCA dimensions:
Qualitative – quantitative
Physical - monetary
Private - Public
Economic – social
Economic-environmental
Short - long term
Ex-ante – monitoring
Exhaustive -complementary
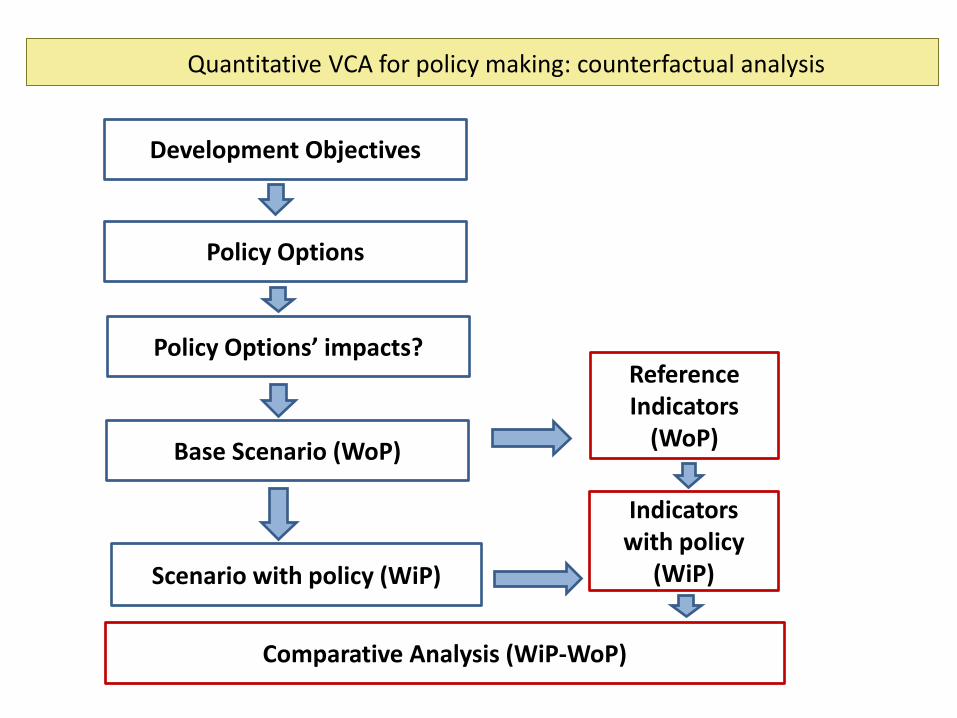
Development Objectives
Policy Options
Policy Options’ impacts?
Base Scenario (WoP)
Scenario with policy (WiP)
Comparative Analysis (WiP-WoP)
Reference Indicators
(WoP)
Indicators with policy
(WiP)
Quantitative VCA for policy making: counterfactual analysis

Qualitative versus quantitative VCA
Qualitative: assessing in qualitative terms selected VC features, e.g. “five forces” (bargaining power of suppliers and customers .....) or the “diamond” elements (production factors’ conditions, rivalry stimulating innovation......) (Porter 1985,1990)
Quantitative: assessing in quantitative terms selected dimension above, possibly building multi-criteria indicators,
Building consistent accounting frameworks in both physical quantities and monetary terms, encompassing all the value chain’s layers and providing consolidated accounts of the whole value chain under different policy-relevant scenarios for counterfactual analysis

Physical: measuring input-output relationships for each upstream-downstream pair of layers in physical terms to ensure consistency of physical flows along the chain (“calibrated” value chains)
Monetary: appraise revenues, costs and margins (value added net benefits) of each activity, each agent, segments of the value chain and the whole value chain, using specific sets of prices for inputs, production factors and outputs.
Physical versus monetary VCA

Private versus public perspective in VCA
Private perspective. Agents engage in VC activities only if they see an interest (monetary or non monetary). In VCA, values, as perceived by private agents are expressed in terms of “market prices”.
Public perspective. The government (the society) promotes VCs through public policies only if they increase social welfare. In VCA, social values are expressed in terms of “reference prices”.
VCA is carried out both at “market” and “reference” prices, to provide decision makers and other stakeholders with anticipated evidence on both social and private net benefits brought by a specific policy measure.

Economic versus social perspective in VCA
Economic perspective. How much value is generated by a given VC? To what extent a specific policy measure aimed at favouring that VC is likely to increase the GDP? Which policy measures favour a more efficient use of (scarce) domestic resources?
Social perspective. Which layers of the society benefit from a specific policy measure? Is that policy measure likely to improve food security and/or reduce poverty? To what extent women (smallholders, children etc) benefit from that policy?
Through disaggregate accounts for specific social categories, VCA helps investigating policy-induced changes in goods/income available to them. Through account aggregation and consolidation instead, VCA provides anticipated evidence on overall value added changes.
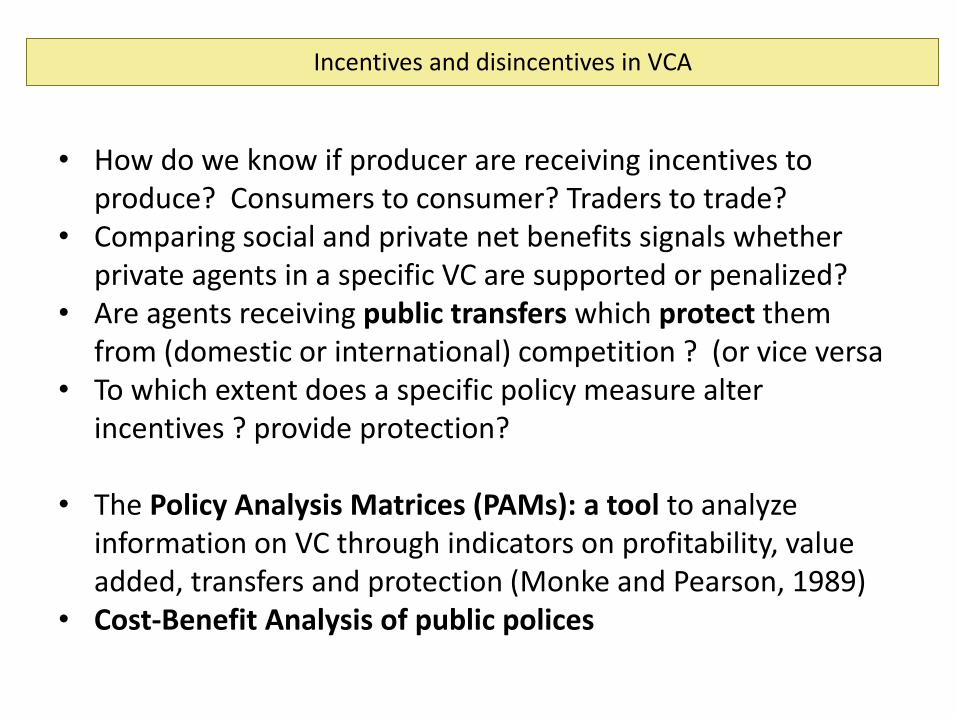
• How do we know if producer are receiving incentives to produce? Consumers to consumer? Traders to trade?
• Comparing social and private net benefits signals whether private agents in a specific VC are supported or penalized?
• Are agents receiving public transfers which protect them from (domestic or international) competition ? (or vice versa
• To which extent does a specific policy measure alter incentives ? provide protection?
• The Policy Analysis Matrices (PAMs): a tool to analyze
information on VC through indicators on profitability, value added, transfers and protection (Monke and Pearson, 1989)
• Cost-Benefit Analysis of public polices
Incentives and disincentives in VCA
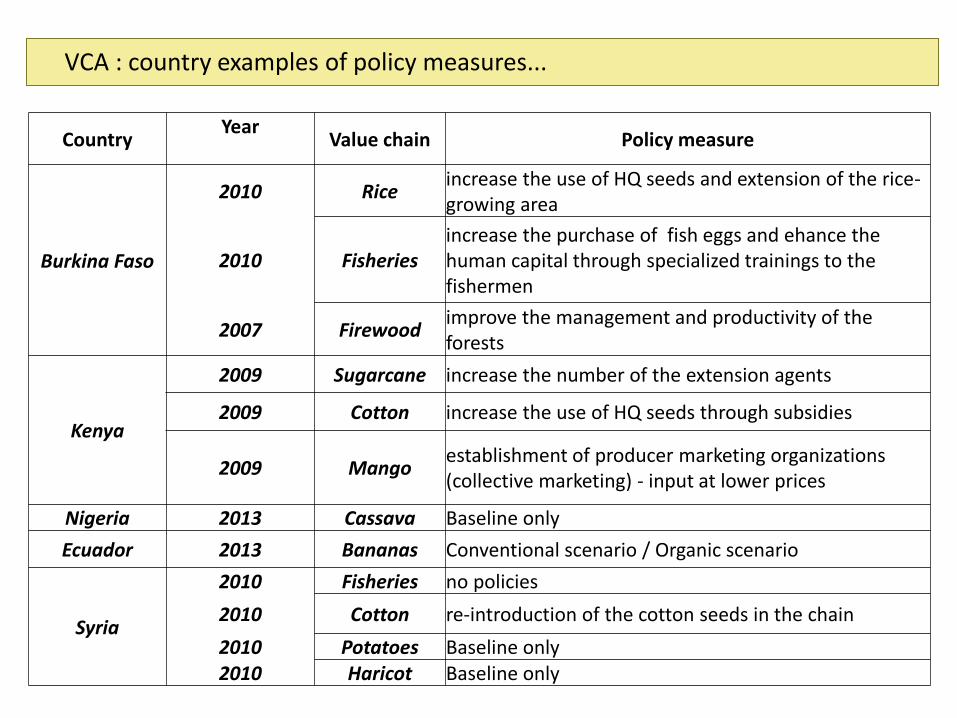
VCA : country examples of policy measures...
Country Year
Value chain Policy measure
Burkina Faso
2010 Rice increase the use of HQ seeds and extension of the rice-growing area
2010 Fisheries increase the purchase of fish eggs and ehance the human capital through specialized trainings to the fishermen
2007 Firewood improve the management and productivity of the forests
Kenya
2009 Sugarcane increase the number of the extension agents
2009 Cotton increase the use of HQ seeds through subsidies
2009 Mango establishment of producer marketing organizations (collective marketing) - input at lower prices
Nigeria 2013 Cassava Baseline only
Ecuador 2013 Bananas Conventional scenario / Organic scenario
Syria
2010 Fisheries no policies
2010 Cotton re-introduction of the cotton seeds in the chain
2010 Potatoes Baseline only 2010 Haricot Baseline only
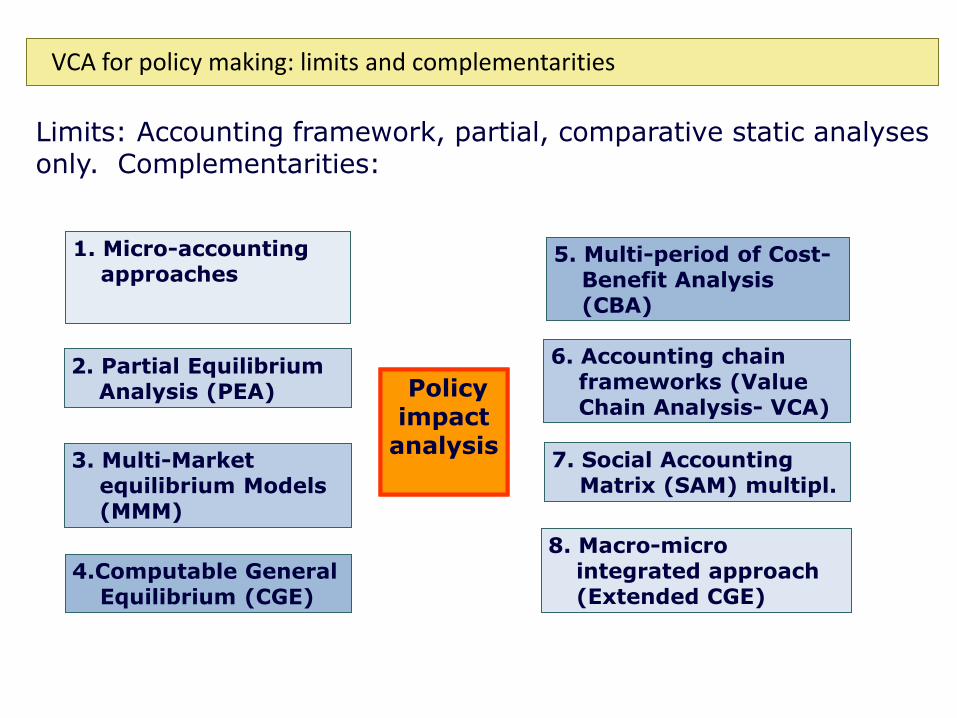
VCA for policy making: limits and complementarities
1. Micro-accounting approaches
1. Micro-accounting approaches
Policy impact
analysis
Policy impact
analysis
8. Macro-micro integrated approach (Extended CGE)
8. Macro-micro integrated approach (Extended CGE)
4.Computable General Equilibrium (CGE)
4.Computable General Equilibrium (CGE)
3. Multi-Market equilibrium Models (MMM)
3. Multi-Market equilibrium Models (MMM)
7. Social Accounting Matrix (SAM) multipl.
7. Social Accounting Matrix (SAM) multipl.
2. Partial Equilibrium Analysis (PEA)
2. Partial Equilibrium Analysis (PEA)
6. Accounting chain frameworks (Value Chain Analysis- VCA)
6. Accounting chain frameworks (Value Chain Analysis- VCA)
5. Multi-period of Cost-Benefit Analysis (CBA)
5. Multi-period of Cost-Benefit Analysis (CBA)
Limits: Accounting framework, partial, comparative static analyses only. Complementarities:

THANK YOU!
The End
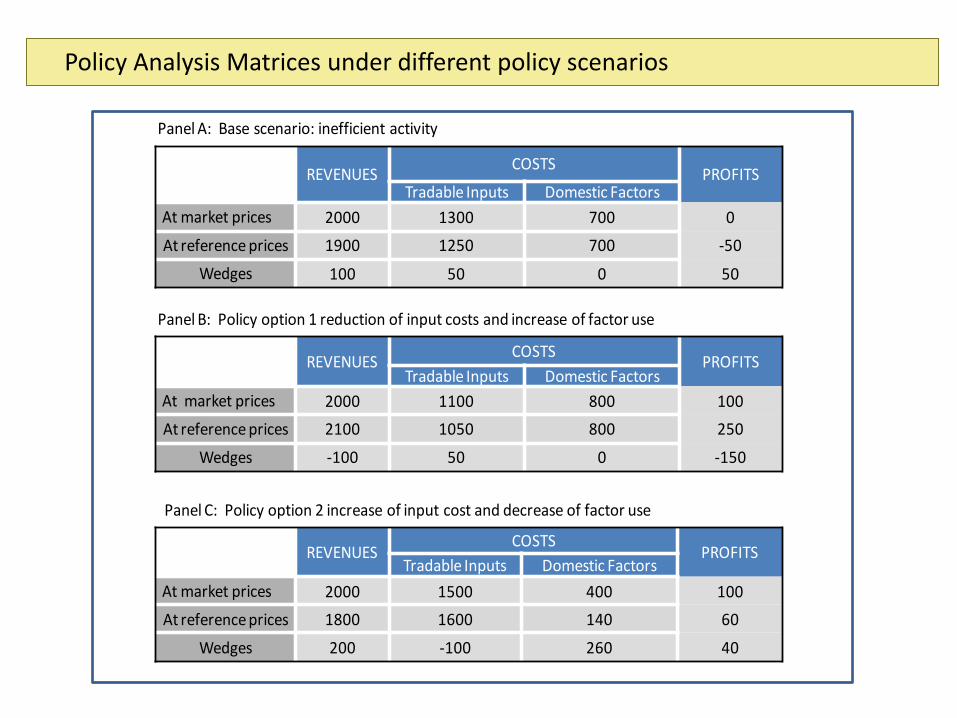
Policy Analysis Matrices under different policy scenarios
REVENUESCOSTS
PROFITSTradable Inputs Domestic Factors
At market prices 2000 1300 700 0
At reference prices 1900 1250 700 -50
Wedges 100 50 0 50
REVENUESCOSTS
PROFITSTradable Inputs Domestic Factors
At market prices 2000 1100 800 100
At reference prices 2100 1050 800 250
Wedges -100 50 0 -150
Panel A: Base scenario: inefficient activity
Panel B: Policy option 1 reduction of input costs and increase of factor use
REVENUESCOSTS
PROFITSTradable Inputs Domestic Factors
At market prices 2000 1500 400 100
At reference prices 1800 1600 140 60
Wedges 200 -100 260 40
Panel C: Policy option 2 increase of input cost and decrease of factor use

Indicator Acronym Base scenarioPolicy option 1
Factor intensive technology
Policy option 2 Input intensive
technology
Private Cost Ratio PCR 1.00 0.89 0.80
Private Value Added Ratio PVAR 0.35 0.45 0.25
Domestic Resource Cost Ratio DRC 1.08 0.76 0.70
Social Value Added Ratio SVAR 0.34 0.50 0.11
Nominal Protection Coefficient on Outputs NPCO 1.05 0.95 1.11
Nominal Protection Coefficient on Inputs NPCI 1.04 1.05 0.94
Effective Protection Coefficient EPC 1.08 0.86 2.50
Domestic Factors Ratio DOFAR 1.00 1.00 0.86
Subsidy Ratio to Private Agents SURPA 0.026 -0.071 0.022
PAM-based indicators
Expanded Policy Analysis Matrices (PAMs) (Monke and Pearson, 1989): Total Wedges = effects of policy and market failures + effects of policies for efficiency