Embed Size (px)
Citation preview

Valuebasedequipmentselection
Synopsis Traditionally, equipment selection is weighted toward fulfilling the contractual requirements agreed to
in the shipbuilding specification. Bollard pull and sea trial speed are examples of this. For today’s
common vessel types, we find that this design criterion often defines the entire equipment selection
and at the same time only represents a fraction of the operational time for the vessel. A harbor tug is a
good example - it will spend, typically, only a small percentage of its operating time in bollard pull
conditions. Similarly, a cargo vessel is not likely to be crossing the Atlantic at sea trial speed. Ultimately,
what this does is base equipment selection on a condition where the vessel spends only a fraction of its
operational time.
Is this condition-based equipment selection the best choice or are there other conditions of
considerable importance to look at for alternative equipment set ups?
Selecting the optimal design criteria The below example is for 150T offshore tug, (AHTS). The bollard pull condition is often considered the
most important design condition, as this plays a major role in vessel contract qualification. Looking at
the orange line, representing the time spent in each mode, we see that the expected time the vessel will
spend in this operational condition is very low compared to other modes.
Figure 1: Typical operations profile for offshore tug
0
200
400
600
800
1000
1200
1400
1600
1800
0
1000
2000
3000
4000
5000
6000
7000
8000
9000
10000
Economy 9kts Cruizing 12kts Standby DP medium Towing 65Tons Anchor handling
80Tons
Bollard pull
150Tons
Anchored
Tim
e [
h]
Po
we
r o
utp
ut
OPERATIONAL PROFILETotal (ekW+kW)
Time
Most time
Design
condition

For these vessels, the equipment selection will often start with selecting either the main engine or the
propeller diameter. With one of these defined, the other one can be selected so that the required
bollard pull can be reached.
This design philosophy makes the engineering and risk manageable as the main design goal is to fulfill
the one full-power condition using well established engineering rules and practices.
If we look further into the above example and how it performs over the entire operational profile, we
see that this vessel would spend less than 4% of the time and 10% of the annual fuel consumption in the
full power bollard pull condition. This means 96% of the operational time and 90% of the annual fuel
consumption is spent outside of the primary equipment selection mode of operation. This doesn’t
necessarily mean that the vessel is inefficient in any of these off design conditions, or that they’re not
considered during the design process. It just means that they are often secondary to fulfilling the main
contractual requirement within budget.
With this in mind, it might make more sense to shift the main propulsion design criteria to include the
modes where the vessel spends most of its time and where the vessel aggregates most of the operating
cost. The task of looking into and benchmarking different solutions against each other over an
operational profile can be very tedious and time consuming, and a more experience-based approach is
often adapted.
Defining the operational profile In order to do any kind of benchmark over the entire vessel operation, it requires an operational profile
to be defined as a benchmark basis. This will allow concepts, designs and propulsion equipment to be
evaluated against each other.
When building a new vessel for an already existing fleet, the task of defining the operational profile is
manageable and can be referenced to the vessels already in operation. If, on the other hand, you’re
building a vessel with a certain capacity for a spot market or on speculation, this task might be more
challenging.
One common way to define an operational profile is to define the power consumption over a number of
modes. This is an effective way if you’ve already defined your propulsion system and how it will operate.
A good example would be optimizing a diesel-electric engine plant to a predefined propulsion system or
reading data from an already existing vessel.
Example of power based operational profile:
Operational mode Power consumption [kW]
Transit 9kts 1000
Transit 12kts 3000
Standby 800
Dynamic position 1200
Anchor handling 4000
Bollard Pull 9000
The problem with this kind of operational profile is that it really only works when benchmarking engines
of approximately the same size and power against each other, or different diesel electric configurations.
For cases where you want to benchmark complete vessel performance such as different propulsion
systems, propeller diameters, engine solutions or running modes, it’s better to take a more operational
driven approach. The idea with this is to base the operational profile on the thing that matters - the
operational requirement - and relate this to a hull design.
Operational mode Requirement
Transit 9kts 9kts
Transit 12kts 12kts
Standby 2kts current, 5kts wind speed
Dynamic position 2kts current, 10kts wind speed, DP2
Anchor handling 2kts, 85T pull, 10T tunnel thrusters
Bollard Pull 150T
This, together with a hull resistance profile/data and the proposed propeller concepts, will give the
power consumption per mode for the propulsion candidates. Using this approach makes it possible to
benchmark total vessel performance while varying propulsion concept, engine configuration and
running modes while still making sure that the propulsion system is able to fulfill all operating modes.
Modern tools
New technology combined with advances in marine engineering science have made it easier to
streamline the engineering process and allow more extensive studies before the equipment selection
and vessel construction starts.
These tools can take many shapes ranging from Excel sheets to very sophisticated automated
engineering software solutions. In this paper, the Caterpillar tool known as the Efficiency Workshop has
been utilized. This tool allows you to input the hull characteristics such as resistance and hydrodynamic
data and then apply an operational profile. With this you can then apply various propulsion and engine
solutions to benchmark them against each other, comparing fuel consumption, maintenance
consumption, load response as well as equipment cost.
This approach allows owners to quickly form an opinion about the general direction to go when
evaluating propulsion concepts and make educated decisions.
Design evolution In the below example we will go through the design evolution for a 150T AHTS using the operational
profile from the top. The study starts with a very basic design, moving forward by trying to eliminate the
inefficiencies one by one. This approach has successfully been applied to many different vessels types
and projects, and the 150T AHTS is merely an example.
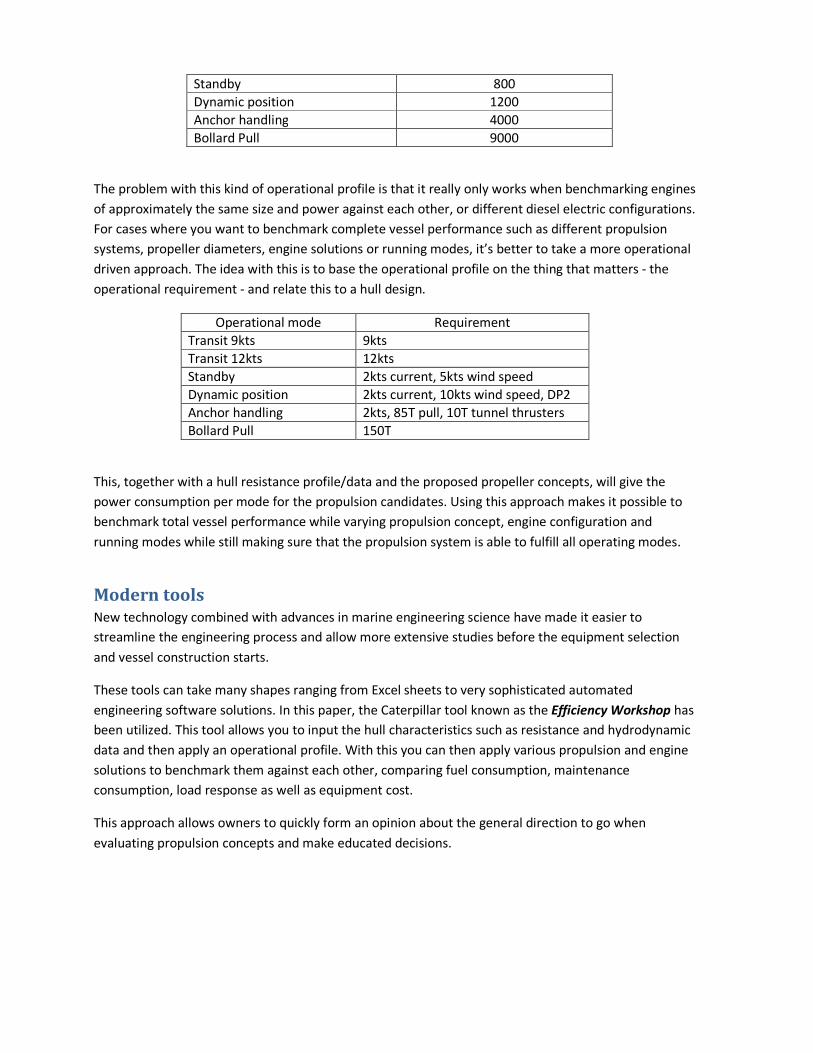
Varying engine rating and propeller diameter
Looking closer into the initial example of the 150T AHTS and how it could be improved, we start by
varying the concept within the borders of a 2 engine installation. The base numbers are as follows: 2x
MaKTM 9M32C engines each delivering 4500kW coupled to two 3.95m main CP propellers. Bow thrusters
have been kept the same throughout the entire study, but could just as easily been varied as well.
Figure 2: Reference configuration 1
An easy way to start studying how to improve the concept would simply be to try the next higher and
lower ratings of the same base engines and consequently adapt the propeller diameter to achieve the
same bollard pull. This would mean that the two alternative configurations would be:
Reference 2xMaK 9M32C – 4500kW 3.95m @ 150rpm
Higher rating 2xMaK 9M32E – 4950kW 3.6m @ 170rpm
Lower rating 2xMaK 9M32C – 4320kW 4.15m @ 135rpm
By applying these three alternatives to the operational profile for the vessel, we see that they behave
differently.

Figure 3: Comparison varying engine rating/propeller diameter
From this simple run we see that varying the engine and propeller diameter together can have a big
impact. There is a positive effect when increasing the propeller diameter and decreasing the engine
rating. The equipment price for this alternative would of course increase, as the gear and propulsion
becomes more costly depending on where you end up with your propeller and gear selection due to the
higher torque in the slower turning propeller shaft. Going in the other direction - increasing the rating
while reducing the propeller diameter - has a negative effect on the fuel cost as the propeller efficiency
drops with the smaller, faster turning propeller. The below graph highlights the differences in more
detail.
Optimizing transit operation
In this example, 32% of the vessel operation time is spent in transit, amounting to ~30% of the annual
fuel consumption. The below chart is known as a power chart and shows how the installed engines work
together to deliver the requested power. The chart also allows you to see the running reserve, which is
the power online but not utilized, and the load response.
0%
-3%
10%0%
-1%
3%0% 1% 3%0%
-3%
9%0% 1% 3%
-0.1
-0.05
0
0.05
0.1
Diesel Mechanic: 2x9M32C, 3.95m Diesel Mechanic: 2x9M32C, 4.15m Diesel Mechanic: 2x9M32E, 3.6m
COMPARISON
Fuel Consumption Maintenance Price Total Total exc fuel
0100200300400500600700800900
1000
Economy
9kts
Cruizing
12kts
Standby DP medium Towing
65Tons
Anchor
handling
80Tons
Bollard pull
150Tons
Anchored
Co
nsu
mp
tio
n [
Ton
s] FUEL CONSUMPTION
Diesel Mechanic: 2x9M32C, 3.95m Diesel Mechanic: 2x9M32C, 4.15m Diesel Mechanic: 2x9M32E, 3.6m
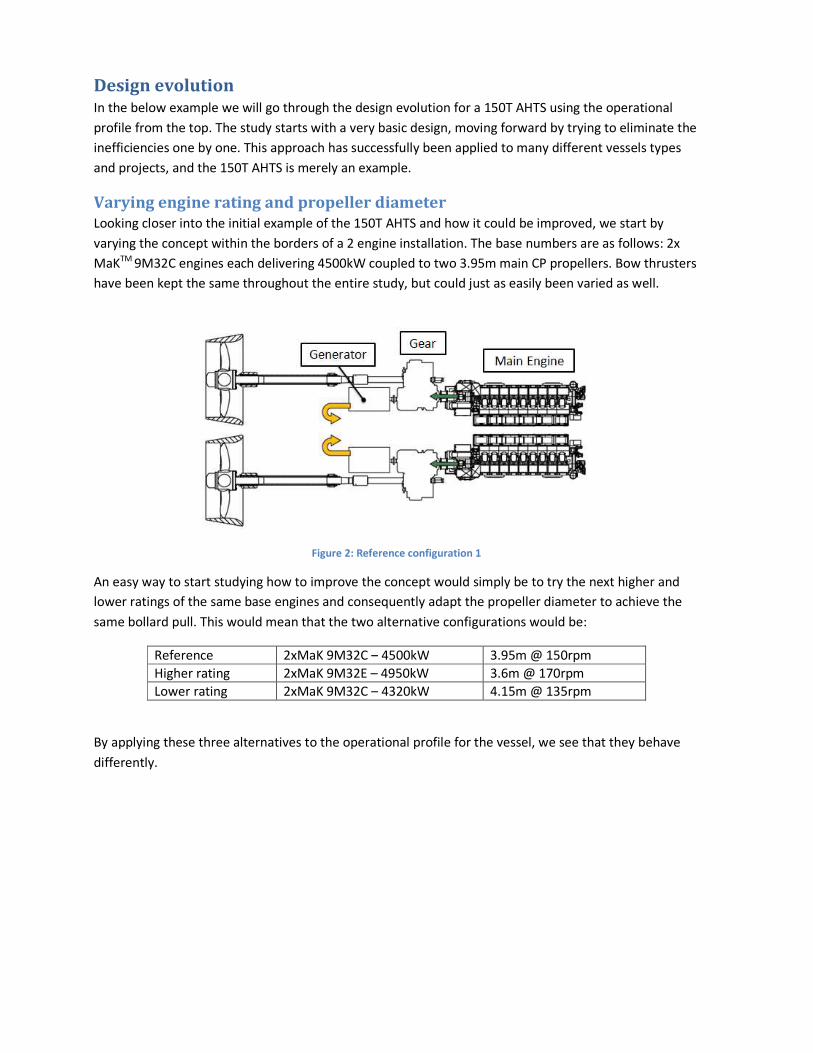
Looking at how the engines operate, we realize that both main engines are needed for every operational
mode except anchored, and that the main engines are running at very low load utilization. Average load
is only 30%, which is far away from the numbers where most engines are optimized to run. This will in
turn drive up fuel and maintenance costs, as normally happens when having too much unused power
capacity online.
What, then, can be done to increase average load on main engines? In transit, it seems like running one
engine only and shutting the other down would be enough to propel the vessel. Doing so is nothing new
and there’s more than one way to do this: simply freewheeling one propeller, driving two propellers
with one engine, driving one mechanically and the other one electrically via the shaft alternator/motor.
In this example, we will attempt to increase engine load by installing feathering propellers.
This technology allows you to run the vessel with only one propeller active while the other propeller is
feathered and locked, creating a minimal amount of drag. The advantage with this solution over the
other alternatives is the simplicity, very low drag, and that the active propeller will be running at a much
higher load/pitch, meaning significantly increasing the propeller efficiency.
0
100
200
300
400
500
600
700
800
900
0
2000
4000
6000
8000
10000
12000
Economy
9kts
Cruizing
12kts
Standby DP
medium
Towing
65Tons
Anchor
handling
80Tons
Bollard
pull
150Tons
Anchored
Re
spo
nse
[k
W/s
]
Po
we
r [k
W]
POWER CHART
Running Reserve [kW] C18 C18 9M32C 9M32C Response [kW/s]
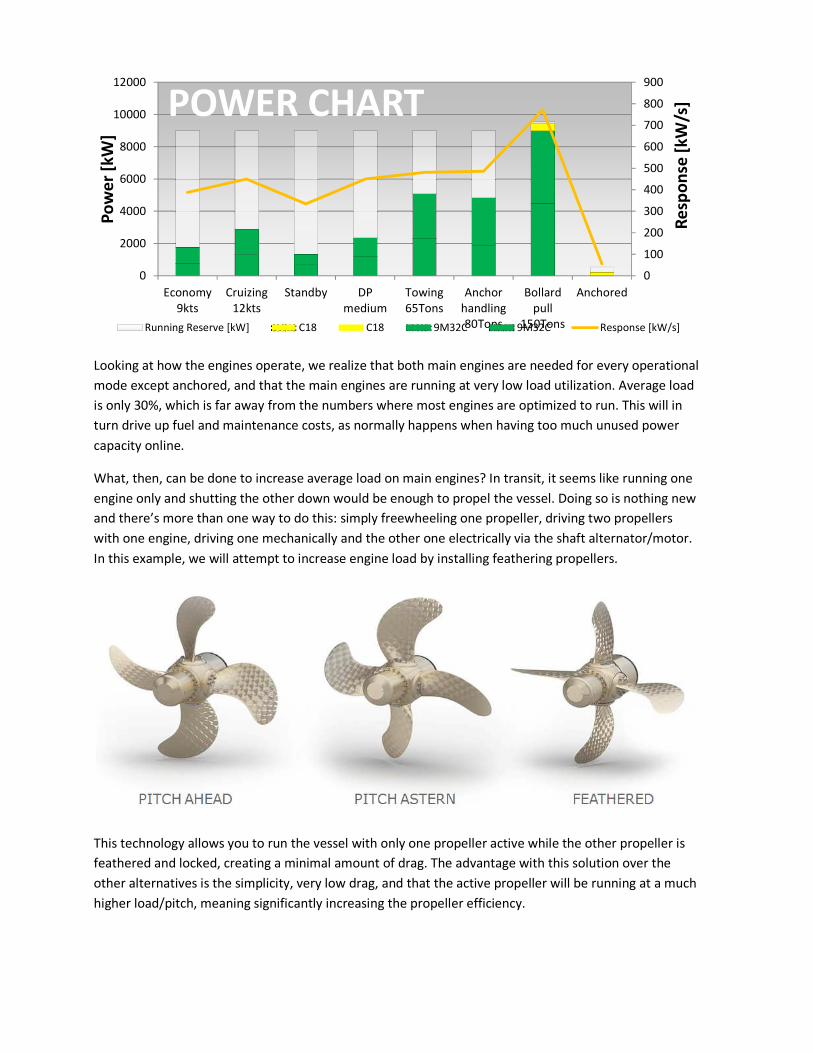
Applying the feathering feature to the propellers for this vessel results in a 9% fuel consumption
reduction as well as a 17% reduction in scheduled maintenance, as the number of hours per year on the
main engines is halved for the transit operation.
If we take another look at the power chart, the average engine load is now slightly higher at 35%, but
still very low. Is it possible to have a different way to highlight the average load in the power chart?
What can we do to further increase the engine load and thus reduce fuel and maintenance
consumption? Looking at the chart above, the engine utilization still seems to be very low at many of the
modes, especially during transit and standby/DP.
Father & son arrangement One limitation with the base configuration is that there are only two main engines, meaning that the
ability to vary the number of engines running is limited. A popular way to build this kind of vessel is to
utilize 4 main engines. A twist of this is the father and son arrangement which takes the concept a step
0
100
200
300
400
500
600
700
800
900
Economy 9kts Cruizing 12kts Standby DP medium Towing
65Tons
Anchor
handling
80Tons
Bollard pull
150Tons
Anchored
Co
nsu
mp
tio
n [
Ton
s] FUEL CONSUMPTION
Diesel Mechanic: 2x9M32C Diesel Mechanic: 2x9M32C Feathering
0
100
200
300
400
500
600
700
800
900
0
2000
4000
6000
8000
10000
12000
Economy
9kts
Cruizing
12kts
Standby DP
medium
Towing
65Tons
Anchor
handling
80Tons
Bollard
pull
150Tons
Anchored
Re
spo
nse
[k
W/s
]
Po
we
r [k
W]
POWER CHART
Running Reserve [kW] C18 C18 9M32C 9M32C Response [kW/s]
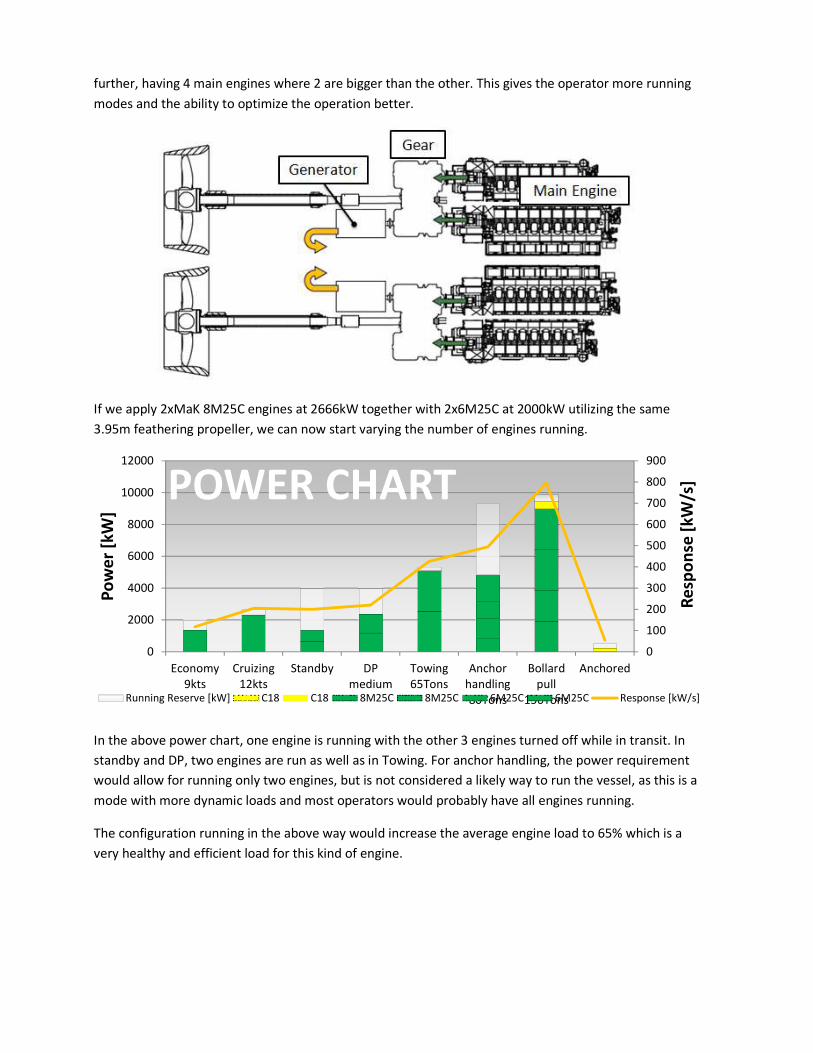
further, having 4 main engines where 2 are bigger than the other. This gives the operator more running
modes and the ability to optimize the operation better.
If we apply 2xMaK 8M25C engines at 2666kW together with 2x6M25C at 2000kW utilizing the same
3.95m feathering propeller, we can now start varying the number of engines running.
In the above power chart, one engine is running with the other 3 engines turned off while in transit. In
standby and DP, two engines are run as well as in Towing. For anchor handling, the power requirement
would allow for running only two engines, but is not considered a likely way to run the vessel, as this is a
mode with more dynamic loads and most operators would probably have all engines running.
The configuration running in the above way would increase the average engine load to 65% which is a
very healthy and efficient load for this kind of engine.
0
100
200
300
400
500
600
700
800
900
0
2000
4000
6000
8000
10000
12000
Economy
9kts
Cruizing
12kts
Standby DP
medium
Towing
65Tons
Anchor
handling
80Tons
Bollard
pull
150Tons
Anchored
Re
spo
nse
[k
W/s
]
Po
we
r [k
W]
POWER CHART
Running Reserve [kW] C18 C18 8M25C 8M25C 6M25C 6M25C Response [kW/s]

Taking the concept further If we look at how the engines are running in the father/son arrangement, we’ve already achieved a very
good running condition and the return from the engines on fuel and maintenance is much improved.
What can be done to further increase the propulsive efficiency and ultimately the power consumption
from the main propellers over the operational profile?
In all modes except anchored, the shaft alternators require running at a constant speed. If we keep the
constant speed operation in mind and look at the load on the main propulsion, we see that in many
modes this is very low. For the transit modes, we have already significantly increased this by running
only one propeller at a higher load while feathering the other. For the standby and DP mode, we’re still
turning two very big propellers designed to deliver 150T bollard pull in constant speed which, in zero
pitch condition, will consume 15-20% of the design power.
A better way to run the propulsion in those modes would be in combinatory or variable speed mode.
This would require either to run the main engines in combinatory mode or driving the main propellers in
variable speed electrically via the shaft alternator/motor. While both of them would require some
additional electrical equipment, this has already been done on many vessels worldwide.
If we also look at the utilization time of the father/son arrangement, we see that 2 of the 4 main engines
are not significantly utilized. What would happen if we replaced 2 of the main engines with generator
sets and make the vessel a diesel mechanic/electric hybrid?
This would mean that the total mechanic power would be selected so that it’s enough to efficiently
propel the vessel during transit and modest towing operations. When in standby/DP, the vessel would
switch over to diesel electric mode, running as a pure diesel electric off of the high speed generator sets.
When full power is needed the main engines and generators would all work together in a mixed speed
hybrid mode.

This solution would maintain the efficiency gains worked up in the previous steps and reduce the power
consumption in standby/DP. This would increase the propulsive efficiency and reduce the fuel
consumption.
Looking at the power chart, we see that transit and towing modes are unaffected. Standby and DP are
now diesel electric modes with the main propeller in a more efficient variable speed mode. Anchor
handling and bollard pull now require main engines and high speed generator sets to work together.
Looking toward the engine loads, the average load for the main engines has now increased to 75% and
the generator set average load is at 45%.
Result
The above steps have taken the vessel in focus from a very conventional two engine design, added
feathering propellers, added the father/son concept, and ultimately made the vessel a hybrid. All of
these steps have eliminated the inefficiencies over the operational modes, using solutions that account
for various factors such as simplicity, efficiency and cost.
0
100
200
300
400
500
600
700
800
900
0
2000
4000
6000
8000
10000
12000
Economy
9kts
Cruizing
12kts
Standby DP
medium
Towing
65Tons
Anchor
handling
80Tons
Bollard
pull
150Tons
Anchored
Re
spo
nse
[k
W/s
]
Po
we
r [k
W] POWER CHART
Running Reserve [kW] 3516C 3516C C18 8M25C 8M25C Response [kW/s]

The above chart uses the result from the enclosed study and allows us to follow the design evolution
and how the financial factors come into effect. As we can see, each step improves the fuel and
maintenance consumption. This is of course only valid under the benchmark condition chosen, meaning
that if you change to a different hull or different operational parameters, this could all look different.
The below chart is a good source for doing further evaluation of the concepts. What we see here is the
fuel consumption per mode for the concepts. One striking thing is that all solutions have at least one
mode where they are the most efficient. A good example is the hybrid which is very efficient in most
modes, but had the highest consumption during bollard pull. One could argue that this design would
never be considered if no off-design condition study like this one was done, as the benefits lie outside
the bollard pull condition.
Summary / conclusion
Technology is moving on and the industry is getting better at performing these kinds of studies in a time
efficient manner. In this paper, all info and data comes out of the Caterpillar tool known as the
Efficiency Workshop, and is the result of a substantial development project on both the propulsion and
engine sides.
0%
-9% -12% -15%
0%
-17% -47% -36%
0% 1% 9% 12%0%
-8% -11% -13%
0%
-5% -10% -4%
-0.15
-0.1
-0.05
0
0.05
0.1
0.15
Diesel Mechanic: 2x9M32C Diesel Mechanic: 2x9M32C,
Feathering
Diesel Mechanic: 2x8M25C
2x6M25C
Hybrid: 2x8M25C, 3516C
COMPARISON
Fuel Consumption Maintenance Price Total Total exc fuel
0
100
200
300
400
500
600
700
800
900
Economy 9kts Cruizing 12kts Standby DP medium Towing 65Tons Anchor handling
80Tons
Bollard pull
150Tons
Anchored
Co
nsu
mp
tio
n [
Ton
s] FUEL CONSUMPTION
Diesel Mechanic: 2x9M32C Diesel Mechanic: 2x9M32C, Feathering Diesel Mechanic: 2x8M25C 2x6M25C Hybrid: 2x8M25C, 3516C

The enclosed paper discusses equipment selection based on a benchmark methodology where different
concepts, delivering the same basic vessel performance, are evaluated against each other to discover
optimal solutions. While the viewpoint here is focused on fuel and maintenance consumption, in an
actual project, aspects such as load response, electrical complexity, and crew requirements might weigh
very high among the selection criteria.
The study also illustrates that doing additional homework before equipment selection begins, opens up
the door for significant improvements in fuel and maintenance performance, which could bring
significant reductions in total cost of ownership. Even a small study on how to match main engines to
propeller diameter might reveal as much as a 10% difference between a good and a poor choice.