Embed Size (px)
Citation preview
1
Value-at- risk and Basel capital charges: evidence from MENA equity markets
Chaker Aloui Professor of Finance
Department of finance, College of Business Administration,
King Saud University, Riyadh, Saudi Arabia, e-mail: [email protected]
( Received 26 / 1 / 1434 H, Accepted for Publication 14 / 8/ 1436 H )
Keywords: leverage, asymmetry, APARCH model, value at risk, expected Shortfall, daily capital charges, MENA equity markets. Abstract. in this paperwe check the relevance of some main stylized facts in equity markets’ volatility; namely asymmetry, leverage and fat-tailed returns in the risk assessment and management in terms of Basel II capital charges. To do so, an APARCH model under three density’ distributions: normal, Student and skewed Student are used to forecast volatility and to estimate the value at risk and Expected Shortfall. Our approach is implemented for daily stock market indexes of four MENA countries: Egypt, Morocco, Saudi Arabia and Turkey. Our results indicate that the APARCH model under skewed Student distribution performs well for both short and long trading positions. We show that the model is well appropriate to accommodate for asymmetry, leverage effect and fat-tailed returns. In terms of Basel II capital requirements, the APARCH model provides the lowest number of violations for a given a risk exposure level. Our results are useful for investors, bankers, and fund managers, whose success depends on the ability to forecast and assess portfolios’ systematic risk.
1- Introduction
The recent global financial crisis (hereafter, GFC), energy price volatility shocks, political unrest in some North African and Middle East countries (hereafter, MENA), currency crisis, sovereign defaults, military conflicts and other geopolitical factors have emphasized the insistence for governments, banks hedge funds and other financial institutions of producing consistent tools for risk of financial risk management. In recent years, value at risk (hereafter, VaR) has been the most well-known risk measure owing to its conceptual simplicity, ready implementation and simplicity of estimation resulting in it becoming is the most common reported measure of risk. It has been the industry-standard risk measure since the early-1990s and regulators accepted it as the basis for capital modeling in 1996. VaR quantifies the maximum amount of loss for a portfolio of given assets, under normal market conditions, over a given time period and a certain confidence level (Jorion, 2002). However, VaR is not a coherent measure of risk since it seems unable to consider for fat tailed returns (i.e. extreme returns) and does not satisfy one of the axioms of coherence and the axiom of
sub-additivity (Su, 2014). In this esprit, Degiannakis et al. (2013) uncover that the VaR can cause serious problems in certain cases, cases in which Expected Shortfall (hereafter, ES) can serve more aptly in its place. Furthermore, according to the recent recommendations of the Basel Committee on Banking Supervision (hereafter, BCBS), the VaR reputation was desperately damaged during the recent GFC, which reminded financial institutions and regulators alike that stressed markets can produce losses far in excess of the maximum amounts forecast by the VaR. The BCBS therefore deems it is necessary to research for alternative risk measures or computations methodologies to overwhelm these weaknesses. Alternatively, some scholars such as Yamai and Yoshiba, (2005), Su (2015), Rossignolo et al. (2012), and Degiannakis et al., (2013), consider ES to be a better risk measure, as it satisfies mathematical axioms of as coherence and sub-additivity, which in particular means it always generates a diversification benefit, unlike VAR. Furthermore, in order to predict financial risk precisely, it is important to select the suitable model to fit the real financial time series well. In this vein, it is well documented in the literature (see, among
* Acknowledgement: The author would like to thank the Deanship of Scientific Research at King Saud University represented by the research center at CBA for supporting this research financially.

J. King Saud Univ., Vol. 27, Admin. Sci. (1), Riyadh (2017/1438H.)
2
others, Poon and Granger, 1983, Choudhry, 1997; Su and Huang, 2011) that for most financial time series returns exhibit some stylized facts such as volatility clustering, fat-tailed returns, excess kurtosis, asymmetry, leverage effect, leptokurtosis. In the present paper, the attention is focused on three main stylized facts: asymmetry, leverage effect and fat-tailed returns in the Middle East and North African (hereafter, MENA) equity markets.
McAleer (2009) claim that it is vital to distinguish judiciously between asymmetry and leverage, and models that accommodate for asymmetry and leverage, either by construction or through the use of parametric restrictions. Asymmetry is a straightforward concept, but leverage seems to be the subject of much misunderstanding in practice. Asymmetry captures the different impacts of positive and negativeshocks of equal magnitude on volatility (see, McAleer, 2009 and and McAleer et al., 2009). However, leverage captures the effects of negative (positive) shocks of equalmagnitude on increasing (decreasing) the debt-equity ratio, thereby increasing(decreasing) subsequent volatility and risk (see, among others, Black, 1976). For McAleer (2009), leverage effect is a special case of asymmetry, with volatility decreasing progressivelyas returns shocks change progressively from negative to positive. In this vein, numerous popular models of volatility accommodate either for asymmetry or/and leverage effect. For instance,the GJR model of Glosten, Jagannathan and Runkle (1992) isasymmetric but does not display leverage, while the exponential GARCH (hereafter, EGARCH) model of Nelson (1991) is asymmetric and can display leverage, dependingon the signs of the coefficients relating to the size and sign effects.
Leverage effect and asymmetry on stock market volatility has been largely evidenced in the literature. However, major of previous works are focused on world major equity markets and no specific thoughtfulness was paid to the MENA equity markets. In the last two decades, emerging and frontier markets have attracted the attention of international investors as means of higher returns such as with diversification of international portfolio risk and there has been a shift in attention to emerging markets of developing countries. Nowadays, it is well recognized that emerging and frontier markets differ from developed markets. The former are, in most cases, characterized by the lack of institutional development and corporate governance and the presence of market microstructure distortions. These factors may hind the flow of information to market participants.
Furthermore, in most of these markets, traders slowly react to the arrival of new information due to the lack of equity culture.Furthermore, emerging equity markets exhibit high levels of risk and return and are lacked strong correlation with world major markets.
In the present paper,we are concerned with risk assessment and its implication in terms of Basel II capital requirements for some MENA equity markets, using non-linear ARCH-type models. Explicitly, the primary devotions of this paper is to assess how best to forecast VaR when considering for asymmetry, leverage and fat-tailed returns and to optimize daily capital charges in an attempt to manage excessive risk taking as efficiently as possible and to deliver some concrete endorsements concerning operational strategies for risk monitoring and management.
We summarize our main findings as follows. Firstly, MENA equity exhibit asymmetric behavior and heavy tailed return innovations. Secondly, over the in-sample period, the APARCH model under skewed Student-t distribution is the best-suited model to capture asymmetry and fat tails for all the selected indexes. Using a battery of forecasting ability tests, we conclude that fat-tail and asymmetry features are of great consequence when forecasting MENA stocks’ volatility. Thirdly, the APARCH specification under skewed Student-t density provides the best VaR and ES estimates and forecasts for all the MENA equity indexes at almost all confidence levels. Finally, following the Basel II Accord capital charge requirements, this model also leads to the lowest number of violations. The leading implications of our results have strong bearing to volatility model selection for MENA equity markets. From a risk management perspective, large violations under the Basel II rules may generates failures of hedge funds operating in MENA stock markets, as the capital charges derived from the VaR threshold forecasts may be insufficient to cover realized losses especially during turbulent periods. Commendably, lower than ten violations imply that these models do lot lead to entry in the red zone, which is important for hedge funds’ reputation and risk management.
The plan of the reminder of the paper is as follows. Section 2 reviews the previous studies. Section 3exposed the various APARCH models and the VaR concept. Section 4 describes the used data and the VaR results. Section 5 provides some risk monitoring implications under Basel II capital requirements. The main conclusions are displayed in section 6.

Chaker Aloui: Value-at- risk and Basel capital charges…
3
2- Literature review
Assaf (2006) provide evidence on the long memory for some MENA equity markets and unveil thatARFIMA model performs better than ARMA model in both in and out-of-sample periods.Quite similar results were obtained by DiSario et al.’s (2008).Kasman and Torun (2007) found strong evidence of long dependence in the conditional mean and the variance dynamics thatare well described by an ARFIMA-FIGARCH model. Their results corroborate Kilic’s (2004) conclusions.The author used parametric and nonparametric approaches to investigate the existence of long memory in the volatility in Turkish stock market volatility. Degiannakis (2004) analysed forecasting ability of various risk models in order to estimate the one-day-ahead realized volatility and the daily VaR. The authors suggested that the FIAPARCH specification with skewed Student conditionally distributed innovations is capable to account for the major stylized facts of stock market volatility. Maghyereh and Al. Zoubi (2006) estimated the VaR using tails distributions of return series by extreme value theory (hereafter, EVT) which allows the comparison with variance-covariance method, ARCH-class models under various innovations distribution and historical simulation. The author show that MENA stock markets’ returns exhibit fat-tails and demonstrate that the ETVapproach is more suitable to account for fat-tailed returns in the MENA stock markets.
In another comparable paper, Marzo and Zagalia (2007) compare some nonparametric GARCH-type models with normal, Student distribution and GED and pointed out that EGARCH model conveys the best performance followed by the GARCH-GED model. Tang and Shieh (2006) investigate the long memory features of three stock index futures markets. They estimate the fractionally integrated GARCH (hereafter, FIGARCH) and the hyperbolic GARCH (hereafter, HYGARCH) models under normal, Student and skewed Student distributions.Usingthe Kupiec's LR tests, they uncover that the HYGARCH model with skewed Student-t distribution performs better. Härdle and Mungo (2008) estimate the VaR and the ES for two long memory models, the FIAPARCH and HYGARCH with different error’s distributions. They show that models accommodating for asymmetries and long memory in volatility process perform better in forecasting the 1- and 5days-ahead horizons. Dimitrakopoulos et al. (2010) compare the accuracy of the VaR and the ETV for a large sample of emerging stock markets. The authors point out
that the VaR models turn out to be conservative risk forecasts.
Diamandis et al. (2011) reconsider the use of VaR as a measure for potential risk of economic losses in financial markets by estimating VaR for daily stock returns with the use of various ARCH-class models under skewed Student distribution. The author estimate an APARCH model and show that the skewed Student APARCH improves substantially the forecasts of one-day-ahead VaR for long and short trading positions. Mabrouk and Saadi (2012) show the superior performance of the VaR models based on the skewed Student distribution for equity markets. They show that such distribution can jointly accounts for fat tails, asymmetry, volatility clustering and claim for the use of more realistic assumption in financial modelling.Rossignolo et al. (2012) assess the performance of several models to compute minimum capital requirements in the context of emerging and frontier equity markets. The authors show that heavy-tailed distributions are the most accurate technique to model market risks, hence preventing huge capital deficits under current measures. Degiannakis et al. (2013) compare the performance of the long memory FIGARCH model, with that of the short memory GARCH specification, in the forecasting of multi-period VaR and ES for twenty stock indices. The results indicate that underestimation of the true VaR estimate becomes less prevalent as the forecasting horizon increases. Furthermore, the GARCH model has a lower quadratic loss between actual returns and ES forecasts, for the majority of the indices considered for the 10-day and 20-day forecasting horizons.Chkili et al. (2014) explore the relevance of asymmetry and long memory in modeling and forecasting the conditional volatility and market risk of four widely traded commodities using linear and nonlinear GARCH-type models. The out-of-sample estimations indicate that nonlinear volatility models accommodating the long memory and asymmetry features can better describe volatility of commodity returns. Su (2014) use eight GARCH-class models and two return distribution settings, the normal and skewed generalized Student to estimate the VaR and ES within a rolling window approach to explore the asymmetry and leverage and distribution effects on the VaR accuracy. The author uncover that long memory, leverage, and distribution effects subsist in the stock markets.Assaf (2015) investigate the forecasting performance of the VaR for four MENA equity markets using the asymmetric power ARCH (hereafter, APARCH) model for short trading position. Assaf (2015) unveil that the returns have

J. King Saud Univ., Vol. 27, Admin. Sci. (1), Riyadh (2017/1438H.)
4
significantly fatter tails than the normal distribution and therefore introduce the APARCH to estimate the VaR for each market. Furthermore, the author uncover that the VaR estimates based on the Student APARCH model are more accurate than those generated using normal-APARCH models.
In spite of the large body of empirical studies focused on the VaR computations in the MENA equity markets, no empirical research has joined the VaR and ES estimations to the daily capital charges (DCCs) under the Basel II Capital Accord. To the best of our knowledge, the only published study is by Assaf (2015). However, our study is distinguishable from Assaf’ (2015) paper for at least two main aspects. Firstly, we estimate the APARCH model under three return innovations’ distributions for both short and long trading positions. Secondly, we provide some potential implications in terms of DCCs. In practice, the VaR’ forecasts are employed to estimate the amount of capital requirements (i.e. DCCs) to provide a cushion against adverse market situations.Finally, we implement the VaR and ES for daily stock indexes for a sample period covering some recent extreme events including the GFC, the energy markets shocks, the sovereign default crisis, the uncertainty regarding the euro-currency.
3- Methodology
In this study, APARCH and RiskMetrics (i.e. Integrated GARCH) models are considered for the variance specification and three return distribution settings are used to forecast volatility in order to accommodate for leverage effect, asymmetry and to seize the features of real return’s distribution like the fat tails. In addition, we consider three return distributions: normal skewed Student and skewed Student. The Student and the skewed Student distributions provides a flexible distribution to fit the empirical distribution of financial data exhibiting skewness, leptokurtosis and fat tails, and can be used to evaluate the distribution effect as compared with normal distribution. After selecting the best fitting model, we estimate the VaR and ES for both the short and long trading positions for the four MENA equity markets.
3.1. APARCH model with Normal distribution
Ding et al. (1993) extended the GARCH model suggested by Bollerslev (1986) to develop the normal APARCH model. The main feature of this type of models is its flexibility since it includes various alternative GARCH models. Formally, the APARCH model is written as follows:
d� = f + ���|&�*�| − �g&�*��e + h�d�*�e (1)
Where f, ��, �gh�and � are the estimated parameters. �g�−1 < �g < 1� measures the leverage effect, with while � �� > 0� is a Box-Cox transformation of d�. In the present study, the one-day-ahead VaR estimations for the N-APARCH model are computed in an analogous way to the Risk- Metrics using the conditional variance as given by Eq. (1)
3.2. APARCH model under Student-t distribution
Currently, it is well documented in the VaR literature that models relying on the assumption of the normal distribution are unable to produce accurate VaR and ES estimations1. On another side, asymmetry and heavy tails in financial time series are identified as stylized facts and therefore alternative distribution such as Student distribution or Generalized Error (GED) distributions seem to be appropriate candidates to provide more accurate VaRs and ESs than the Gaussian one. The error specification is given by:
&� = d�S� (2)
where S� is i.i.d. #�0,1, D) and d� is given by Eq. (1). We should note that the one-step-ahead VaR for short and long trading positions is given by q� +G#7,Xd� and q� + G#�*7,Xd�, with �is a given standard level of significance.
3.3. APARCH with skewed student distribution
To account for excess kurtosis and asymmetry as stylized facts in the financial time-series, Giot and Laurent (2003a,b) extended the Student-t distribution to the skewed Student-t APARCH model based on the approach suggested by Lambert and Laurent (2001). Formally, the innovation process S� is governed by a standardized skewed Student-t distribution:
R�S|E, D� =
Y�Z�[
2E + 1E GBGS + F|D� "RS < −F/G
2E + 1E GB�GS + F�/E|D� "RS ≥ −F/G
(3)
1 See, among others, Giot and Laurent, 2003; Al Zoubi and
Maghyereh 2007; Aloui and Mabrouk, 2010; Diamandis et al., 2011; Mabrouk and Saadi, 2012, Degiannakis et al. 2013 and Assaf, 2015.
Chaker Aloui: Value-at- risk and Basel capital charges…
5
B�. |D� is the symmetric Student density and E is the asymmetric coefficient. Fand G� are respectively the mean and the variance of the non-standardized skewed student- t
F = HIJ0KL M√O*�
√PHIJLM IE − �QM
and G� = IE� + �QL − 1M − F�
(4)
where the density function R IS� T�Q , DM is the
opposite of R�S�|E, D� with respect to the zero mean. We should mention that the sign of log �E� indicates the direction of the skewness. Following Lambert and Laurent (2000), the quantile function of G�G#7,X,Q of a non-standardized skewed Student density is written as follows:
G�G#7,X,Q =
YZ[ 1E G#7,X \�2 �1 + E��] "R� < 11 + E�
−EG#7,_ `1 − �2 �1 + E*�a "R� ≥ 11 + E�
(5)
where G#7,X is the quantile function of the (unit variance) Student-t density. Thus, the quantile function of the standardized skewed Student distribution is given by:
G�G#7,X,Q = G�G#7,X,Q − FG (6)
With reference to Ding et al. (1993), if it exists, a stationary of Eq. (4) is written as follows:
c>d�e@ = f1 − ��c�|S| − �gS�e − h� (7)
For the standardized skewed Student distribution, it is given by: c�|S| − �S�e = iE*���e��1 + ��e + E��e�1 − ��ej
Γ Iδ + 12 M Γ Iv − δ2 M �v − 2���n�IE + 1EM o�D − 2�pΓ�D2�
(8)
For the skewed Student APARCH model, the VaR for long and short trading positions is given by: q� + G�G#7,X,Qd� and q� + G�G#�*7,X,Qd�. G�G#7,X,Q>G�G#�*7,X,Q@ is the left (right) quantile of the skewed Student distribution at the �% �1 − �%� level of significance with D the degree of freedom. E is the coefficient of asymmetry.
3.4. Statistical correctness of the VaR
We use two tests, namely the Kupiec’s (1995) test and Dynamic Quantile test (DQT) suggested by Engle and Manganelli (2002) to assess the VaR accuracy. The underlying idea of the Kupiec’s (1995) is to estimate of the probability of observing a loss greater than the VaR amount. To gauge the accuracy and to evaluate the performance of the model-based VaR estimates, Kupiec’s (1995) provide a likelihood ratio test �<�st� for testing whether the failure rate of the model is statistically equal to the expected one (i.e. unconditional coverage). Consider that u = ∑ w�x�y� is the number of exceptions in the sample size T. Then
w��� = ⟨1, "R:��� < ������|��7�0, "R:��� ≥ ������|��7� (9)
follows a binomial distribution,u~|�', ��. If } = c�~x� is the expected exception frequency (i.e.
the expected ratio of violations), then the hypothesis for testing whether the failure rate of the model is equal to the expected one is expressed as follows: !�: � = ��. ��is the prescribed VaR’s level. Thus, the appropriate likelihood ratio statistic in the presence of the null hypothesis is given by:
<�st = −2��B���~�1 − ���x*~�
+2��B ��u'�~ �1 − �u'�x*~�� (10)
Under the null hypothesis, LR�� has a ��1� as an asymptotical distribution. Consequently, a preferred model for VaR prediction should display the property that the unconditional coverage
measured by } = c�~x� equals the desired coverage
level p�. In addition to the Kupiec’s LR test, we use the
DQT of Engle and Manganelli (2002). The DQT is founded on a sequence of VaR violations that is not serially correlated. Formally, considering two new variables !"#���� = w>�� < �����7�@ − � and !"#��1 − �� = w>�� > ������*7�@ − �, Engle and Manganelli (1999)2 suggest to jointly test that:
• A1:c�!"#����� = 0 (respectively, c�!"#��1 −��� =) for long trading positions (short trading position)
• A2: !"#���� (or, !"#��1 − ��) is uncorrelated with the variables included in the information set (see, Giot and Laurent, 2004).
2 For further details about the DQT of Engle and Manganelli
(1999) cited within the references.
J. King Saud Univ., Vol. 27, Admin. Sci. (1), Riyadh (2017/1438H.)
6
Engle and Manganelli (1999), suggest the following artificial regression in order to test A1-A2,!"#� = $% + &� ; Where, $ is a ' × � matrix whose first column of ones, the next ) columns are !"#�*�,…-.�/01. � − ) − 1 are the remaining columns are additional independent variables including the VaR. With reference to Engle and Manganelli (1999),
the DQT is given by: 34356
7��*7� where %8 is the OLS
estimates of %. According to Engle and Manganelli (1999), the DQT statistic follows a ����.
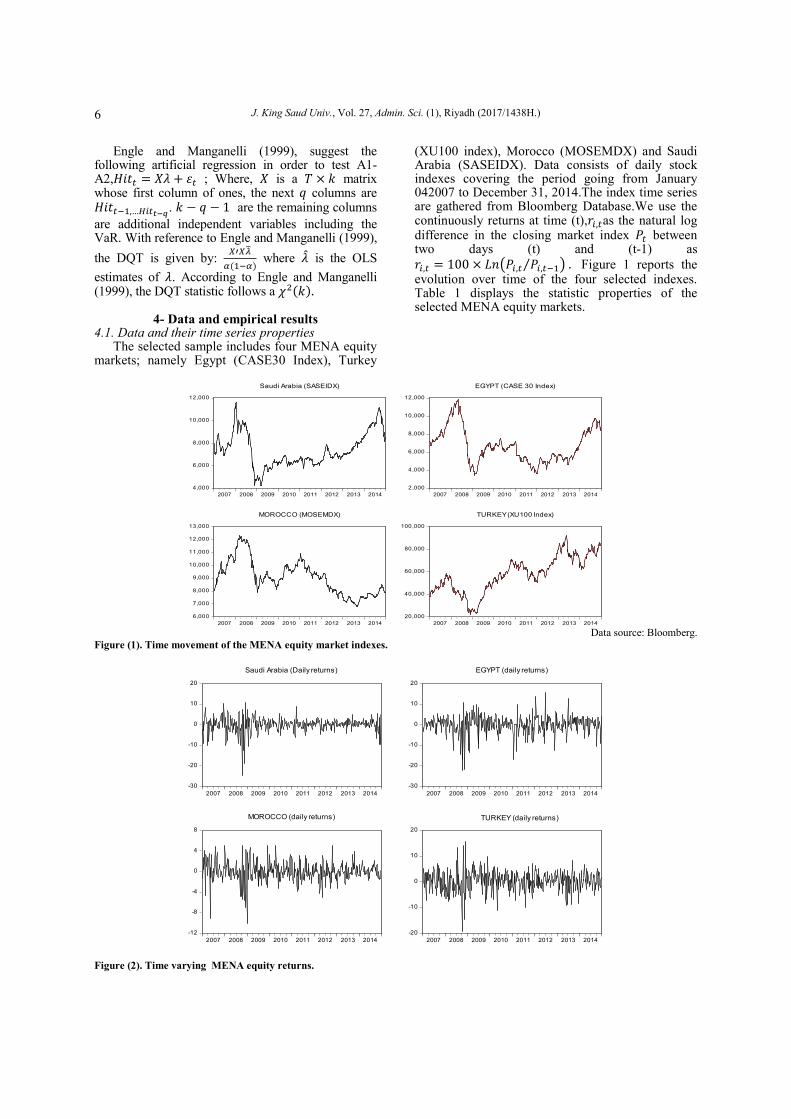
4- Data and empirical results 4.1. Data and their time series properties
The selected sample includes four MENA equity markets; namely Egypt (CASE30 Index), Turkey
(XU100 index), Morocco (MOSEMDX) and Saudi Arabia (SASEIDX). Data consists of daily stock indexes covering the period going from January 042007 to December 31, 2014.The index time series are gathered from Bloomberg Database.We use the continuously returns at time (t),:.,�as the natural log difference in the closing market index ;� between two days (t) and (t-1) as :.,� = 100 × <=>;.,� ;.,�*�⁄ @ . Figure 1 reports the evolution over time of the four selected indexes. Table 1 displays the statistic properties of the selected MENA equity markets.
4,000
6,000
8,000
10,000
12,000
2007 2008 2009 2010 2011 2012 2013 2014
Saudi Arabia (SASEIDX)
2,000
4,000
6,000
8,000
10,000
12,000
2007 2008 2009 2010 2011 2012 2013 2014
EGYPT (CASE 30 Index)
6,000
7,000
8,000
9,000
10,000
11,000
12,000
13,000
2007 2008 2009 2010 2011 2012 2013 2014
MOROCCO (MOSEMDX)
20,000
40,000
60,000
80,000
100,000
2007 2008 2009 2010 2011 2012 2013 2014
TURKEY (XU100 Index)
Data source: Bloomberg.
Figure (1). Time movement of the MENA equity market indexes.
-30
-20
-10
0
10
20
2007 2008 2009 2010 2011 2012 2013 2014
Saudi Arabia (Daily returns)
-30
-20
-10
0
10
20
2007 2008 2009 2010 2011 2012 2013 2014
EGYPT (daily returns)
-12
-8
-4
0
4
8
2007 2008 2009 2010 2011 2012 2013 2014
MOROCCO (daily returns)
-20
-10
0
10
20
2007 2008 2009 2010 2011 2012 2013 2014
TURKEY (daily returns)
Figure (2). Time varying MENA equity returns.
Chaker Aloui: Value-at- risk and Basel capital charges…
7
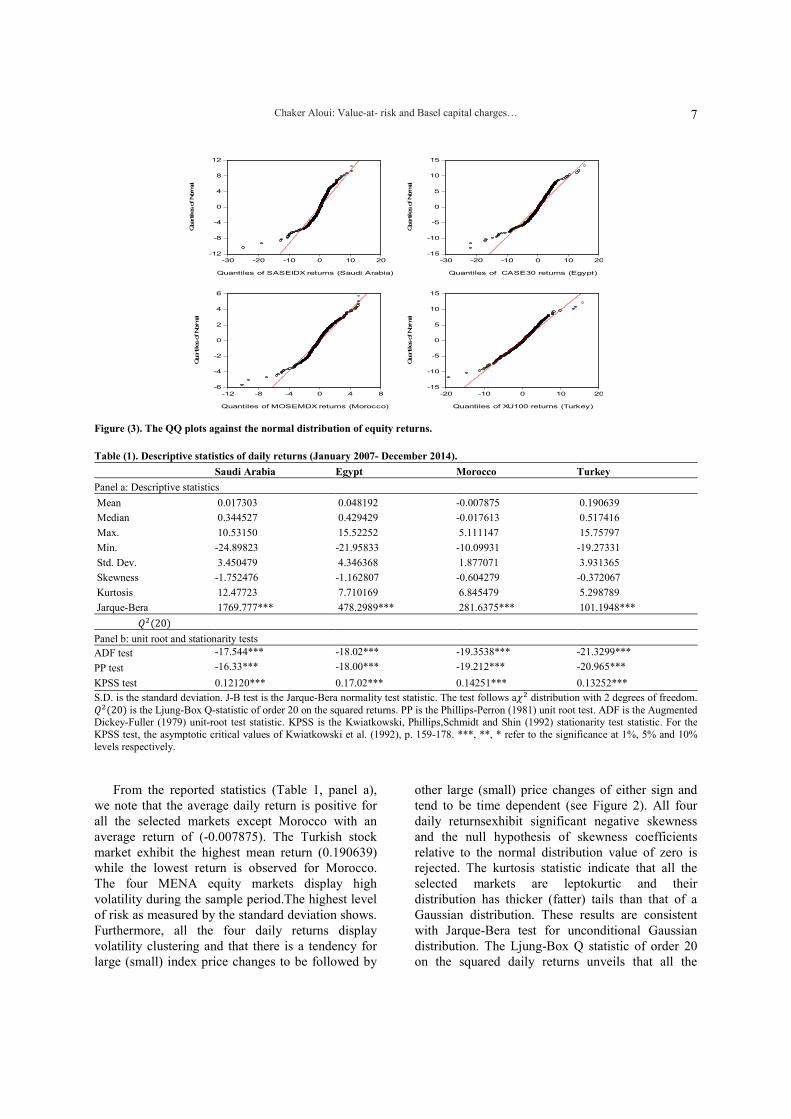
Figure (3). The QQ plots against the normal distribution of equity returns.
Table (1). Descriptive statistics of daily returns (January 2007- December 2014).
Saudi Arabia Egypt Morocco Turkey
Panel a: Descriptive statistics
Mean 0.017303 0.048192 -0.007875 0.190639
Median 0.344527 0.429429 -0.017613 0.517416
Max. 10.53150 15.52252 5.111147 15.75797
Min. -24.89823 -21.95833 -10.09931 -19.27331
Std. Dev. 3.450479 4.346368 1.877071 3.931365
Skewness -1.752476 -1.162807 -0.604279 -0.372067
Kurtosis 12.47723 7.710169 6.845479 5.298789
Jarque-Bera 1769.777*** 478.2989*** 281.6375*** 101.1948*** ���20�
Panel b: unit root and stationarity tests ADF test -17.544*** -18.02*** -19.3538*** -21.3299***
PP test -16.33*** -18.00*** -19.212*** -20.965***
KPSS test 0.12120*** 0.17.02*** 0.14251*** 0.13252*** S.D. is the standard deviation. J-B test is the Jarque-Bera normality test statistic. The test follows a � distribution with 2 degrees of freedom. ���20� is the Ljung-Box Q-statistic of order 20 on the squared returns. PP is the Phillips-Perron (1981) unit root test. ADF is the Augmented Dickey-Fuller (1979) unit-root test statistic. KPSS is the Kwiatkowski, Phillips,Schmidt and Shin (1992) stationarity test statistic. For the KPSS test, the asymptotic critical values of Kwiatkowski et al. (1992), p. 159-178. ***, **, * refer to the significance at 1%, 5% and 10%levels respectively.
From the reported statistics (Table 1, panel a),
we note that the average daily return is positive for all the selected markets except Morocco with an average return of (-0.007875). The Turkish stock market exhibit the highest mean return (0.190639) while the lowest return is observed for Morocco. The four MENA equity markets display high volatility during the sample period.The highest level of risk as measured by the standard deviation shows. Furthermore, all the four daily returns display volatility clustering and that there is a tendency for large (small) index price changes to be followed by
other large (small) price changes of either sign and tend to be time dependent (see Figure 2). All four daily returnsexhibit significant negative skewness and the null hypothesis of skewness coefficients relative to the normal distribution value of zero is rejected. The kurtosis statistic indicate that all the selected markets are leptokurtic and their distribution has thicker (fatter) tails than that of a Gaussian distribution. These results are consistent with Jarque-Bera test for unconditional Gaussian distribution. The Ljung-Box Q statistic of order 20 on the squared daily returns unveils that all the
-12
-8
-4
0
4
8
12
-30 -20 -10 0 10 20
Quantiles of SASEIDX returns (Saudi Arabia)
Quantiles of Norm
al
-15
-10
-5
0
5
10
15
-30 -20 -10 0 10 20
Quantiles of CASE30 returns (Egypt)
Quantiles of Norm
al
-6
-4
-2
0
2
4
6
-12 -8 -4 0 4 8
Quantiles of MOSEMDX returns (Morocco)
Quantiles of Norm
al
-15
-10
-5
0
5
10
15
-20 -10 0 10 20
Quantiles of XU100 returns (Turkey)Quantiles of Norm
al

J. King Saud Univ., Vol. 27, Admin. Sci. (1), Riyadh (2017/1438H.)
8
MENA stock returns are highly correlated up to 20th lag indicating that we can reject the null hypothesis of i.i.d. process. In Table 1, (panel b), we relate the results of the augmented Dickey-Fuller (1979) (ADF), the Phillips-Perron (1988) (PP)3 unit root tests and the Kwiatkowski, Phillips,Schmidt and Shin (1992) (KPSS) stationarity test4. From these tests, we can reject the hypothesis of unit root for all the return’ time series indicating that they are governed by an I(0) process. For the KPSS test, the results indicatethat we cannot reject the null hypothesis of stationarity at a 1% significant level for all the energy returns time series.
4.2. Estimation results of the APARCH model
Tables 2a and 2b, display the APARCH model estimation results under the three return distributions as well as the RiskMetrics (hereafter, RM)5. It is important to note that in the rest of our study, we refer to the RM as a benchmark model to conduct comparative forecasting ability of the three APARCH models.
From the reported results, we perceive that the Ljung-Box statistic is insignificant for all the selected equity markets showing that the APARCH specification is able to capture the conditional heteroscedasticity as a main stylized fact of financial time series. Likewise, we see that the autoregressive coefficient is negative and statistically insignificant for Morocco and Turkey. However, the autoregressive parameter is positive and significant for Saudi Arabia and Egypt. The APARCH parameters �and � are strongly significant confirming the appropriate choice of the APARCH specification. For all the APARCH models with skewed Student densities, the asymmetry parameter is positive and statistically significant indicating the existence of leverage effect for negative returns in the conditional variance of all the MENA equity markets. Another main finding is that all the diagnostic tests including the log-likelihood, Shibata and Hannan-Quinn tests show that the APARCH
3The lag length or the ADF test regressions is set using the
Schwarz information criteria (SIC) and the bandwidth for the PP test regressions is set using a Bartlett Kernel.
4These unit root and stationary test results could be considered with caution because these tests have been later refined by several authors including Elliot et al. (1996), Ng and Perron (2001). Moreover, some authors (Diebold and Rudebusch, 1991; Hassler and Wolters, 1994 and Tanaka, 1999) have shown that most of these procedures have very low power if the alternatives are fractional form.
5 For space scarcity, the RM model estimations are not reported here but are available upon request.
specification model under skewed Student density is outperforming those under normal and Student distributions. This finding indicates that the APARCH specification with skewed Student is able to take into account the heteroscedasticity, asymmetry and heavy tailed returns. This finding is consistent with Dimandis et al.’s (2013) results for emerging stock markets, Al Zoubi and Maghyereh (2007) for DowJones Islamic index for MENA equity markets. For instance, Diamandis et al. (2013) reveal that the APARCH model with skewed Student distribution sufficiently accounts for asymmetry and heavy tails for a large sample of emerging and developed stock markets and provides accurate VaR and ES estimations for both short and long trading positions. However, our results are somewhat consistent with Assaf’ (2015) findings. For Assaf (2015), the APARCH model with Student distribution is the best model accommodating for long memory, asymmetry and leverage effect in the MENA equity markets’ volatilities. Overall, our estimation results show that the APARCH specification under skewed Student distribution outperforms the competing models with Gaussian and Student densities. Furthermore, under the skewed distribution, the APARCH model accounts for the feature of a negative leverage effect (conditional asymmetry) in the conditional variance and it is also consistent with the fact that an asymmetric distribution for the error term (unconditional asymmetry) exists.
4.3. The in-sample VaR and ES analysis
The in–sample VaR and ES estimations for short and long trading positions are reported in Tables 3a and 3b. These estimations are given for the four competing models (APARCH model with three distributions and RM). We use the Kupiec’s (1995) LR tests and the DQT of Engle and Manganelli (2002) for VaR’s and ES levels ranging from 5% to 0.25%. All the computations were performed using [email protected] procedure on OxMetrics package. We implement the method of maximum likelihood with three different densities and the BFGS algorithm to estimate the parameters of the various VaR and ES. As noted earlier, we refer to the RM as a benchmark model to conduct comparative forecasting analysis.

Chaker Aloui: Value-at- risk and Basel capital charges…
9
Table (2a).TheAPARCH estimation results.
Egypt Saudi Arabia
Normal Student Skewed
Student Normal Student
Skewed
Student
Panel a. Parameter estimations Cst(M) 0.01211
(0.32) 0.00251 (1.03)
0.00442 (1.41)
0.000152 (0.55)
0.004511*** (3.33)
0.006652** (4.321) ���1� 0.03521***
(5.21) 0.03251*** (3.089)
0.036621*** (2.09)
0.15621*** (2.45)
0.112659** (3.02)
0.125668*** (3.099)
Cst(V) 0.052114** (3.52)
0.0511** (3.93)
0.050342** (2.09)
0.000354** (2.06)
0.000323** (2.65)
0.000433** (2.564)
ARCH��� 0.02541*** (2.06)
0.025365*** (2.33)
0.25655*** (2.88)
0.12544*** (2.67)
0.11265*** (2.03)
0.10524*** (2.071)
APARCH��� 0.077521*** (3.98)
0.06251*** (2.52)
0.073981 (2.98)
0.077421*** (2.32)
0.065116 (1.11)
0.058991** (2.766)
APARCH��� 5.30521*** (6.34)
3.01544*** (3.00)
3.0655*** (5.06)
1.124415*** (2.54)
2.139329** (2.09)
2.1179** (2.097)
Student (df) - 2.00124*** (2.08)
2.09625*** (2.96)
- 2.00042*** (3.11)
2.00012*** (3.987)
Asymmetry - -
0.034451*** (4.009)
- - 0.05676*** (3.987)
Panel b. Diagnostic tests Log Likelihood 3978.30 3977.63 3975.21 4 461.682 4 461.054 4 461.98 Shibata -7.66251 -7.660568 -7.654678 -8.151795 -8.150765 -8.149877 Hannan-Quinn -7.66297 -7.680487 -7.643223 -8.141339 -8.140329 -8.1409766 Q2(20)
11.74506 [0.94]
10.01484 [0.98]
11.8802 [0.89] 12.544 [0.86]
11.443 [0.87]
11.091 [0.88]
Notes: Q2(20) is the Ljung- Box Q-statistic of order 20 on the squared series. (*), (**) and (***) refer to the significance at 10%, 5% and 1% levels respectively.
Table (2.b). The APARCH estimation results.
Morocco Turkey
Normal Student Skewed
Student Normal Student
Skewed
Student
Panel a. Estimations
Cst(M) -0.00293 (-1.31)
-0.00276 (-1.33)
-0.0031** (2.00)
0.0126*** (2.98)
0.0132*** (3.09)
0.01277*** (3.098)
���1� -0.0146 (-1.24)
-0.0139 (-1.23)
-0.0458 (-1.76)
-0.0945 (-1.43)
-0.0966 (-1.27)
-0.0071 (-0.31)
Cst(V) 8.7769** (2.03)
8.746** (2.59)
1.8736** (2.11)
1.5013*** (3.09)
2.8959*** (2.98)
1.4866*** (2.07)
ARCH ��� 0.0471* (1.99)
0.089*** (3.02)
0.899*** (3.32)
0.1049** (2.01)
0.0900*** (3.01)
0.4293 (0.68)
APARCH ��� 0.943*** (11.24)
0.9244*** (7.98)
0.982*** (10.98)
0.92097*** (12.8)
0.9341*** (12.09)
0.9332*** (15.24)
APARCH��� 0.195*** (2.87)
0.636*** (2.77)
0.658** (2.68)
0.6149*** (2.87)
0.3109** (2.43)
0.1939*** (3.19)
Student(df) - 0.6657*** (3.02)
0.0294*** (3.43)
- 0.5702*** (3.44)
2.0573*** (4.57)
Asymmetry - 2.008*** (4.98)
- - 2.014*** (3.72)
Panel b. Diagnostics Log Likelihood
3777.044 3778.09 36579.376 3978.803 3909.803 3909.086
Shibata -6.920419 -6.9843 -7.236388 -7.152792 -7.152792 -7.687616 Hannan-Quinn -6.908209 -6.9455 -7.226541 -7.140581 -7.140581 -7.675406
���20� 13.101 [0.83] 13.115
[0.82] 13.052 [0.83] 16.098 [0.93] 16.231
[0.73] 16.09 [0.93]
Notes: Q2(20) is the Ljung- Box Q-statistic of order 20 on the squared series. (*), (**) and (***) refer to the significance levels at 10%, 5% and 1%.
J. King Saud Univ., Vol. 27, Admin. Sci. (1), Riyadh (2017/1438H.)
10
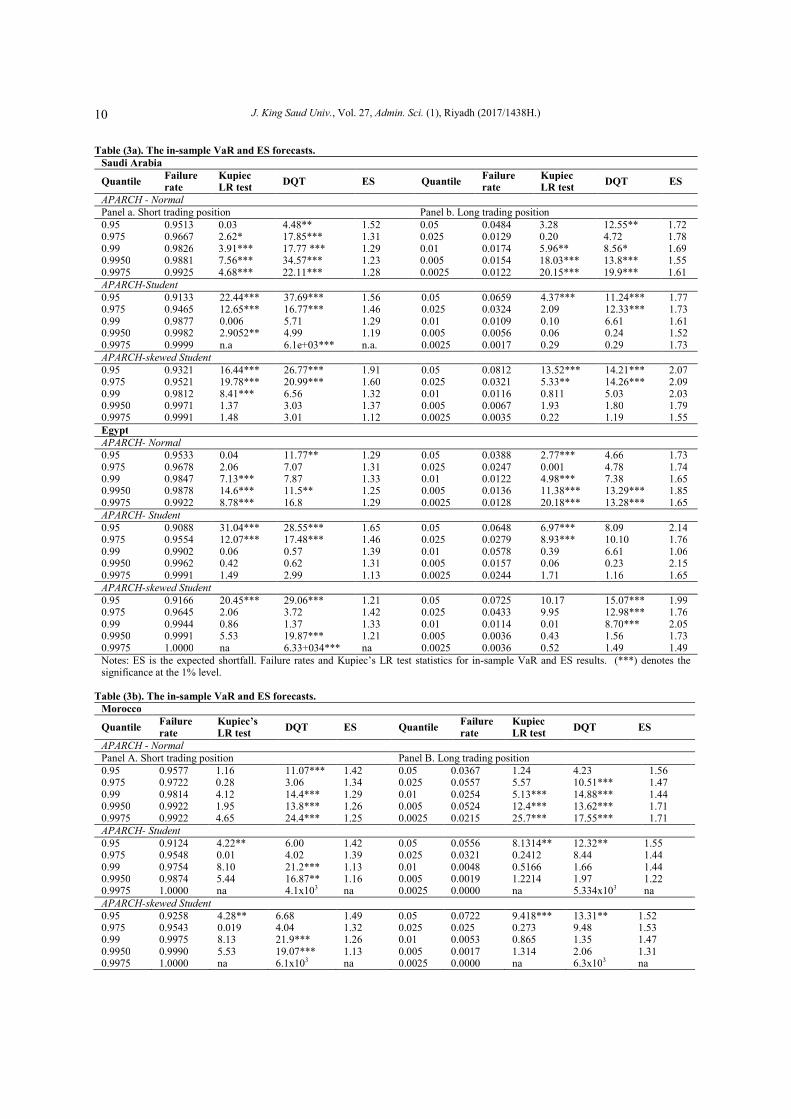
Table (3a). The in-sample VaR and ES forecasts.
Saudi Arabia
Quantile Failure rate
Kupiec LR test
DQT ES Quantile Failure rate
Kupiec LR test
DQT ES
APARCH - Normal
Panel a. Short trading position Panel b. Long trading position 0.95 0.9513 0.03 4.48** 1.52 0.05 0.0484 3.28 12.55** 1.72 0.975 0.9667 2.62* 17.85*** 1.31 0.025 0.0129 0.20 4.72 1.78 0.99 0.9826 3.91*** 17.77 *** 1.29 0.01 0.0174 5.96** 8.56* 1.69 0.9950 0.9881 7.56*** 34.57*** 1.23 0.005 0.0154 18.03*** 13.8*** 1.55 0.9975 0.9925 4.68*** 22.11*** 1.28 0.0025 0.0122 20.15*** 19.9*** 1.61 APARCH-Student
0.95 0.9133 22.44*** 37.69*** 1.56 0.05 0.0659 4.37*** 11.24*** 1.77 0.975 0.9465 12.65*** 16.77*** 1.46 0.025 0.0324 2.09 12.33*** 1.73 0.99 0.9877 0.006 5.71 1.29 0.01 0.0109 0.10 6.61 1.61 0.9950 0.9982 2.9052** 4.99 1.19 0.005 0.0056 0.06 0.24 1.52 0.9975 0.9999 n.a 6.1e+03*** n.a. 0.0025 0.0017 0.29 0.29 1.73 APARCH-skewed Student
0.95 0.9321 16.44*** 26.77*** 1.91 0.05 0.0812 13.52*** 14.21*** 2.07 0.975 0.9521 19.78*** 20.99*** 1.60 0.025 0.0321 5.33** 14.26*** 2.09 0.99 0.9812 8.41*** 6.56 1.32 0.01 0.0116 0.811 5.03 2.03 0.9950 0.9971 1.37 3.03 1.37 0.005 0.0067 1.93 1.80 1.79 0.9975 0.9991 1.48 3.01 1.12 0.0025 0.0035 0.22 1.19 1.55 Egypt
APARCH- Normal
0.95 0.9533 0.04 11.77** 1.29 0.05 0.0388 2.77*** 4.66 1.73 0.975 0.9678 2.06 7.07 1.31 0.025 0.0247 0.001 4.78 1.74 0.99 0.9847 7.13*** 7.87 1.33 0.01 0.0122 4.98*** 7.38 1.65 0.9950 0.9878 14.6*** 11.5** 1.25 0.005 0.0136 11.38*** 13.29*** 1.85 0.9975 0.9922 8.78*** 16.8 1.29 0.0025 0.0128 20.18*** 13.28*** 1.65 APARCH- Student
0.95 0.9088 31.04*** 28.55*** 1.65 0.05 0.0648 6.97*** 8.09 2.14 0.975 0.9554 12.07*** 17.48*** 1.46 0.025 0.0279 8.93*** 10.10 1.76 0.99 0.9902 0.06 0.57 1.39 0.01 0.0578 0.39 6.61 1.06 0.9950 0.9962 0.42 0.62 1.31 0.005 0.0157 0.06 0.23 2.15 0.9975 0.9991 1.49 2.99 1.13 0.0025 0.0244 1.71 1.16 1.65 APARCH-skewed Student
0.95 0.9166 20.45*** 29.06*** 1.21 0.05 0.0725 10.17 15.07*** 1.99 0.975 0.9645 2.06 3.72 1.42 0.025 0.0433 9.95 12.98*** 1.76 0.99 0.9944 0.86 1.37 1.33 0.01 0.0114 0.01 8.70*** 2.05 0.9950 0.9991 5.53 19.87*** 1.21 0.005 0.0036 0.43 1.56 1.73 0.9975 1.0000 na 6.33+034*** na 0.0025 0.0036 0.52 1.49 1.49 Notes: ES is the expected shortfall. Failure rates and Kupiec’s LR test statistics for in-sample VaR and ES results. (***) denotes the significance at the 1% level.
Table (3b). The in-sample VaR and ES forecasts.
Morocco
Quantile Failure rate
Kupiec’s LR test
DQT ES Quantile Failure rate
Kupiec LR test
DQT ES
APARCH - Normal Panel A. Short trading position Panel B. Long trading position 0.95 0.9577 1.16 11.07*** 1.42 0.05 0.0367 1.24 4.23 1.56 0.975 0.9722 0.28 3.06 1.34 0.025 0.0557 5.57 10.51*** 1.47 0.99 0.9814 4.12 14.4*** 1.29 0.01 0.0254 5.13*** 14.88*** 1.44 0.9950 0.9922 1.95 13.8*** 1.26 0.005 0.0524 12.4*** 13.62*** 1.71 0.9975 0.9922 4.65 24.4*** 1.25 0.0025 0.0215 25.7*** 17.55*** 1.71 APARCH- Student
0.95 0.9124 4.22** 6.00 1.42 0.05 0.0556 8.1314** 12.32** 1.55 0.975 0.9548 0.01 4.02 1.39 0.025 0.0321 0.2412 8.44 1.44 0.99 0.9754 8.10 21.2*** 1.13 0.01 0.0048 0.5166 1.66 1.44 0.9950 0.9874 5.44 16.87** 1.16 0.005 0.0019 1.2214 1.97 1.22 0.9975 1.0000 na 4.1x10³ na 0.0025 0.0000 na 5.334x10³ na APARCH-skewed Student
0.95 0.9258 4.28** 6.68 1.49 0.05 0.0722 9.418*** 13.31** 1.52 0.975 0.9543 0.019 4.04 1.32 0.025 0.025 0.273 9.48 1.53 0.99 0.9975 8.13 21.9*** 1.26 0.01 0.0053 0.865 1.35 1.47 0.9950 0.9990 5.53 19.07*** 1.13 0.005 0.0017 1.314 2.06 1.31 0.9975 1.0000 na 6.1x10³ na 0.0025 0.0000 na 6.3x10³ na
Chaker Aloui: Value-at- risk and Basel capital charges…
11
Morocco
Quantile Failure
rate
Kupiec’s
LR test DQT ES Quantile
Failure
rate
Kupiec
LR test DQT ES
Turkey APARCH-Normal
0.95 0.9433 4.48** 1.92*** 1.32 0.05 0.0329 0.054 0.21 1.75 0.975 0.9580 0.38 1.50 1.14 0.025 0.0284 0.796 4.30 1.76 0.99 0.9680 0.36 1.13 1.17 0.01 0.0251 0.26*** 4.25 1.66 0.9950 0.9906 1.05 1.22 1.15 0.005 0.0135 8.368*** 30.13*** 1.89 0.9975 0.9905 4.60 2.81 1.07 0.0025 0.0100 15.19*** 16.64*** 1.88 APARCH- Student
0.95 0.9506 2.39 4.91 1.35 0.05 0.0494 0.0058 3.38 1.70 0.975 0.9702 0.002 7.53 1.35 0.025 0.0322 1.579 3.12 1.71 0.99 0.9801 0.38 1.17 1.66 0.01 0.0278 1.794 14.43 1.68 0.9950 0.907 1.93 1.80 1.18 0.005 0.0246 13.46*** 8.20*** 1.76 0.9975 0.9925 1.25*** 3.80 1.09 0.0025 0.0229 22.05*** 38.3*** 1.73 APARCH-skewed Student
0.95 0.9111 6.1*** 20.3*** 1.66 0.05 0.0624 10.17*** 8.65 1.95 0.975 0.9548 4.6 12.3** 1.58 0.025 0.0524 0.142 9.13 1.72 0.99 0.9905 2.421 4.01 1.84 0.01 0.0214 0.106 6.63 1.95 0.9950 0.9901 2.874* 5.99 1.07 0.005 0.04215 0.052 0.221 1.89 0.9975 1.0000 n.a. 6e+03*** n.a. 0.0025 0.0209 0.026 0.055 1.87 Notes: ES is the expected shortfall. Failure rates and Kupiec’s LR test statistics for in-sample VaR and ES results. (***) denotes the significance at the 1% level.
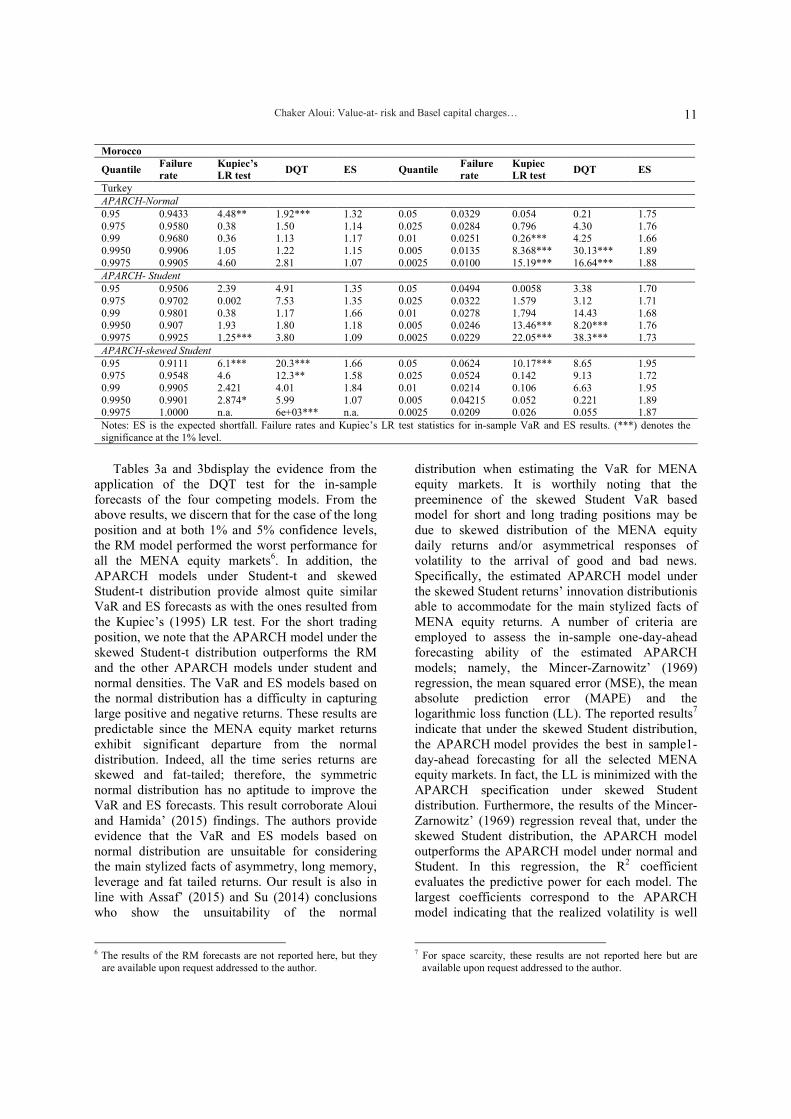
Tables 3a and 3bdisplay the evidence from the
application of the DQT test for the in-sample forecasts of the four competing models. From the above results, we discern that for the case of the long position and at both 1% and 5% confidence levels, the RM model performed the worst performance for all the MENA equity markets6. In addition, the APARCH models under Student-t and skewed Student-t distribution provide almost quite similar VaR and ES forecasts as with the ones resulted from the Kupiec’s (1995) LR test. For the short trading position, we note that the APARCH model under the skewed Student-t distribution outperforms the RM and the other APARCH models under student and normal densities. The VaR and ES models based on the normal distribution has a difficulty in capturing large positive and negative returns. These results are predictable since the MENA equity market returns exhibit significant departure from the normal distribution. Indeed, all the time series returns are skewed and fat-tailed; therefore, the symmetric normal distribution has no aptitude to improve the VaR and ES forecasts. This result corroborate Aloui and Hamida’ (2015) findings. The authors provide evidence that the VaR and ES models based on normal distribution are unsuitable for considering the main stylized facts of asymmetry, long memory, leverage and fat tailed returns. Our result is also in line with Assaf’ (2015) and Su (2014) conclusions who show the unsuitability of the normal
6 The results of the RM forecasts are not reported here, but they
are available upon request addressed to the author.
distribution when estimating the VaR for MENA equity markets. It is worthily noting that the preeminence of the skewed Student VaR based model for short and long trading positions may be due to skewed distribution of the MENA equity daily returns and/or asymmetrical responses of volatility to the arrival of good and bad news. Specifically, the estimated APARCH model under the skewed Student returns’ innovation distributionis able to accommodate for the main stylized facts of MENA equity returns. A number of criteria are employed to assess the in-sample one-day-ahead forecasting ability of the estimated APARCH models; namely, the Mincer-Zarnowitz’ (1969) regression, the mean squared error (MSE), the mean absolute prediction error (MAPE) and the logarithmic loss function (LL). The reported results7 indicate that under the skewed Student distribution, the APARCH model provides the best in sample1-day-ahead forecasting for all the selected MENA equity markets. In fact, the LL is minimized with the APARCH specification under skewed Student distribution. Furthermore, the results of the Mincer-Zarnowitz’ (1969) regression reveal that, under the skewed Student distribution, the APARCH model outperforms the APARCH model under normal and Student. In this regression, the R2 coefficient evaluates the predictive power for each model. The largest coefficients correspond to the APARCH model indicating that the realized volatility is well
7 For space scarcity, these results are not reported here but are
available upon request addressed to the author.
J. King Saud Univ., Vol. 27, Admin. Sci. (1), Riyadh (2017/1438H.)
12
captured by the APARCH predicted volatility. This result is reinforced by the MSE and the MAPE prediction error criteria. Overall, from these results, we can attest that the APARCH model with skewed Student density is the best approach for modeling the selected MENA returns volatilities. This model is suitable to accommodate the major volatility stylized facts such as fat-tails and asymmetry exhibited in the time series returns.
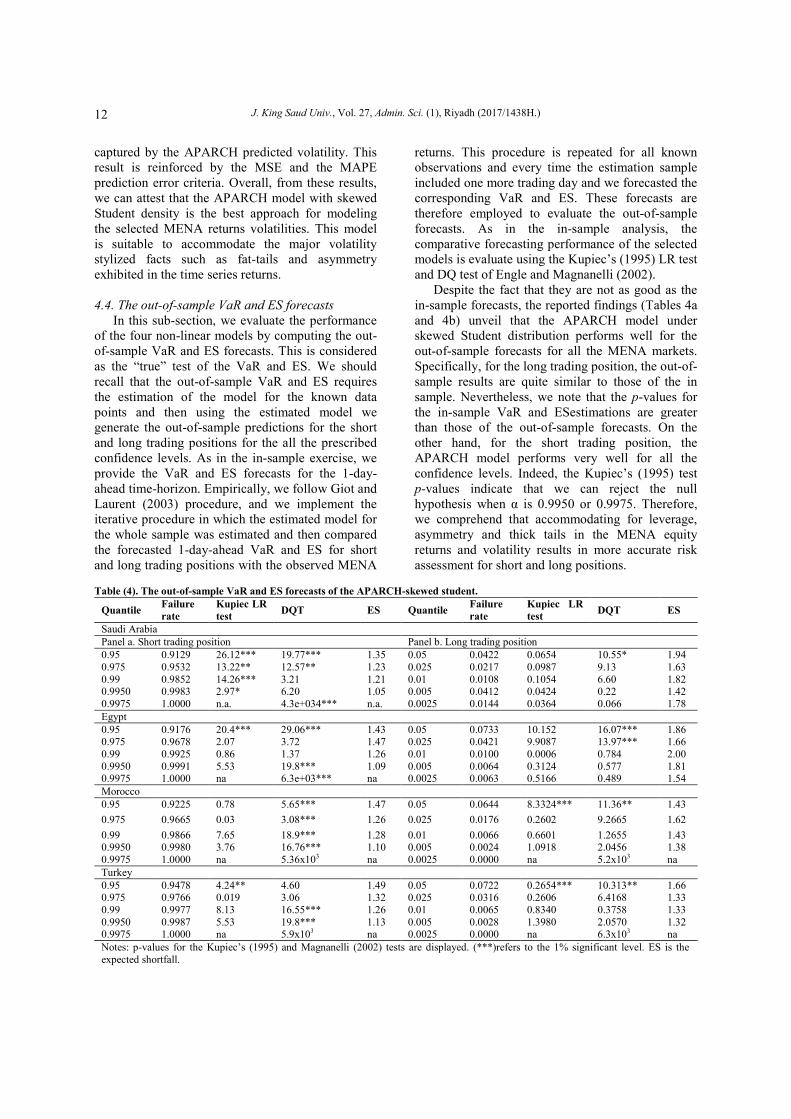
4.4. The out-of-sample VaR and ES forecasts
In this sub-section, we evaluate the performance of the four non-linear models by computing the out-of-sample VaR and ES forecasts. This is considered as the “true” test of the VaR and ES. We should recall that the out-of-sample VaR and ES requires the estimation of the model for the known data points and then using the estimated model we generate the out-of-sample predictions for the short and long trading positions for the all the prescribed confidence levels. As in the in-sample exercise, we provide the VaR and ES forecasts for the 1-day-ahead time-horizon. Empirically, we follow Giot and Laurent (2003) procedure, and we implement the iterative procedure in which the estimated model for the whole sample was estimated and then compared the forecasted 1-day-ahead VaR and ES for short and long trading positions with the observed MENA
returns. This procedure is repeated for all known observations and every time the estimation sample included one more trading day and we forecasted the corresponding VaR and ES. These forecasts are therefore employed to evaluate the out-of-sample forecasts. As in the in-sample analysis, the comparative forecasting performance of the selected models is evaluate using the Kupiec’s (1995) LR test and DQ test of Engle and Magnanelli (2002).
Despite the fact that they are not as good as the in-sample forecasts, the reported findings (Tables 4a and 4b) unveil that the APARCH model under skewed Student distribution performs well for the out-of-sample forecasts for all the MENA markets. Specifically, for the long trading position, the out-of-sample results are quite similar to those of the in sample. Nevertheless, we note that the p-values for the in-sample VaR and ESestimations are greater than those of the out-of-sample forecasts. On the other hand, for the short trading position, the APARCH model performs very well for all the confidence levels. Indeed, the Kupiec’s (1995) test p-values indicate that we can reject the null hypothesis when α is 0.9950 or 0.9975. Therefore, we comprehend that accommodating for leverage, asymmetry and thick tails in the MENA equity returns and volatility results in more accurate risk assessment for short and long positions.
Table (4). The out-of-sample VaR and ES forecasts of the APARCH-skewed student.
Quantile Failure
rate
Kupiec LR
test DQT ES Quantile
Failure
rate
Kupiec LR
test DQT ES
Saudi Arabia Panel a. Short trading position Panel b. Long trading position 0.95 0.9129 26.12*** 19.77*** 1.35 0.05 0.0422 0.0654 10.55* 1.94 0.975 0.9532 13.22** 12.57** 1.23 0.025 0.0217 0.0987 9.13 1.63 0.99 0.9852 14.26*** 3.21 1.21 0.01 0.0108 0.1054 6.60 1.82 0.9950 0.9983 2.97* 6.20 1.05 0.005 0.0412 0.0424 0.22 1.42 0.9975 1.0000 n.a. 4.3e+034*** n.a. 0.0025 0.0144 0.0364 0.066 1.78 Egypt 0.95 0.9176 20.4*** 29.06*** 1.43 0.05 0.0733 10.152 16.07*** 1.86 0.975 0.9678 2.07 3.72 1.47 0.025 0.0421 9.9087 13.97*** 1.66 0.99 0.9925 0.86 1.37 1.26 0.01 0.0100 0.0006 0.784 2.00 0.9950 0.9991 5.53 19.8*** 1.09 0.005 0.0064 0.3124 0.577 1.81 0.9975 1.0000 na 6.3e+03*** na 0.0025 0.0063 0.5166 0.489 1.54 Morocco 0.95 0.9225 0.78 5.65*** 1.47 0.05 0.0644 8.3324*** 11.36** 1.43
0.975 0.9665 0.03 3.08*** 1.26 0.025 0.0176 0.2602 9.2665 1.62
0.99 0.9866 7.65 18.9*** 1.28 0.01 0.0066 0.6601 1.2655 1.43 0.9950 0.9980 3.76 16.76*** 1.10 0.005 0.0024 1.0918 2.0456 1.38 0.9975 1.0000 na 5.36x10³ na 0.0025 0.0000 na 5.2x10³ na Turkey 0.95 0.9478 4.24** 4.60 1.49 0.05 0.0722 0.2654*** 10.313** 1.66 0.975 0.9766 0.019 3.06 1.32 0.025 0.0316 0.2606 6.4168 1.33 0.99 0.9977 8.13 16.55*** 1.26 0.01 0.0065 0.8340 0.3758 1.33 0.9950 0.9987 5.53 19.8*** 1.13 0.005 0.0028 1.3980 2.0570 1.32 0.9975 1.0000 na 5.9x10³ na 0.0025 0.0000 na 6.3x10³ na Notes: p-values for the Kupiec’s (1995) and Magnanelli (2002) tests are displayed. (***)refers to the 1% significant level. ES is the expected shortfall.

Chaker Aloui: Value-at- risk and Basel capital charges…
13
5- VaR and Basel II accord
capital requirements
In this section, we extent our previous analysis of VaR forecasting to provide more practical implications in terms of DCCs. To do so, we follow the commandments for optimizing VaR and DCCs suggested by McAleer (2009). Accordingly, banks and other financial institutions are allowed to estimate their systematic risk and their minimum capital requirement using their own VaR estimations. As noted earlier connecting the VaR based model forecasts to DCCs is one of the main contribution of the present study.
5.1. VaR forecasts and DCCs under Basel II
regulation
Following the 1995 Basel amendment related to risk quantification and management, Basel II Capital Accord, does not establish the VaR as the official measure of market risk but enforced it to constitute a pivotal point to the determination of capital charges. Under Basel II Capital Accord, banks are permitted to use the Internal Model Approach (hereafter, IMA) to estimate their systematic risk minimum capital requirements from their own VaR computations. It is well recognized that financial institutions including banks and hedge funds are concerned with the VaR related to their downside risk especially during financial crisis and other turbulent periods. Actually, one of the relevant consequences of the recent GFC has been the powerlessness of some banks to meet market losses since that capital was insufficiently constituted to offer coverage for unpredicted adverse events.
With reference to Basel II Capital Accord, the VaR’s forecasts of the banks must be reported to the appropriate authority at the beginning of the day, and are then compared to actual returns at the end of the day. In practice, these forecasts are employed to estimate the amount of capital requirements (i.e. DCCs) in order to provide a cushion against adverse market situations. For Basel II Capital Accord, the DCCs must be set at the higher of the previous day’s VaR or the average over the business day adjusted by a scaling factor with reference to three-zone approach (see Table 5). The scaling factor corresponds to the sum of 3 and a given multiplicative factor (k) as given in Table 5 (see. McAleer, 2009, p.7). Formally, the DCC is defined as the penalty that the Basel II Capital Accord imposes on financial institutions employing models that lead to a greater number of violations than would be expected, given a specific confidence level
of 99%. For a daily data, the DCC is given by:
������ = ���3 + �������������������� (11)
Where ������ refers to the DCCs at day (t+1). ���� is the VaR at day (t) computed for a long trading position using the different versions of the APARCH model, while ������������� is the average VaR for the previous 60 trading days. 0 ≤ � ≤ 1 is the violation penalty as given in Table 5. The higher the number of violations when the actual loss exceeds the VaR’s forecasts over the last 250 trading days, the higher the multiplicative factor. Table (5). Basel II Accord penalty zones.
Zone Number of violations k
Green 0 to 4 0.00
Yellow
5 0.40
6 0.50
7 0.65
8 0.75
9 0.85
Red +10 1.00 Notes: the penalty structure suggested by Basel II Capital Accord specified for the number of penalties and not the magnitude, either individually or cumulatively. The number of violations is given for a 250 trading days (McAleer, 2009, p.7).
5.2.Results of the average DCCs
In Table 6 we report the percentage of empirical number of violations and the average daily requirements over the forecasting period going from January 1, 2012 to December, 31 2014. We employ the VaR forecasts derived from the various APARCH specifications and all the four MENA equity markets. The forecasting period totalizes 628 observations while the DCC are estimated for only 60 rolling-windows, as they require the estimation of the number of violations over the previous 250 trading days.
As displayed in Table 6, the number of violations for all the APARCH models for the MENA equity markets is at all times less than ten suggesting that these models do not lead to entry in the Basel II Accord critical zone (i.e. red zone). The mean value of the DCCs ranges from 0.18422 (for APARCH model with skewed Student density for Saudi Arabia) to 0.33325 (APARCH model with normal density for UAE). Furthermore, in terms of DCCs, the APARCH model with skewed Student density that accounts for asymmetry and heavy tails is the best model followed by the APARCH model under Student density as it yields in three cases out of four. More precisely, the APARCH model under normal

J. King Saud Univ., Vol. 27, Admin. Sci. (1), Riyadh (2017/1438H.)
14
distribution provides the lowest DCC for Egypt equity market (0.16447). In spite of this, the percentage of violations given by the APARCH-N for three out of four MENA indexes is higher than that of the APARCH model under skewed Student and Student densities indicating that the risk of going into the red zone defined by the Basel II rules is higher with the APARCH-N.
Overall, the results of the various APARCH models are comparable in terms of DCC, but the APARCH model with skewed Student distribution generates less violations. Since that going into the red zone is an adverse event to financial institutions in terms of reputation or the need to use standard models that may result in higher DCCs in the future, the use of the APARCH is highly recommended for volatility forecasting and systematic risk monitoring for investors operating in the MENA equity markets.
6- Conclusion
The aim of this paper is twofold. First, we check the relevance of asymmetry, leverage and fat-tailed returns in estimating the VaR and ES for some MENA stock markets. Secondly, we optimize daily capital charges in an attempt to manage excessive risk taking as efficiently as possible and to deliver some concrete recommendations regarding operational strategies for risk monitoring and management. To do so, we first use an APARCH specification under three return innovations’ distributions: normal, Student and skewed Student to predict volatility and to estimate the VaR and ES for both short and long trading positions.
We use daily data for four MENA equity markets during the period 2007-2015 which covers some recent extreme events including, oil price volatility shocks, the sovereign defaults, the uncertainty regarding the euro-currency, the Arab spring and other geopolitical events. Our overall results lead to the overwhelming conclusion that the APARCH model under skewed Student outperforms all the other specifications and provides the more accurate VaR and ES forecasts for the out-of-sample. Specifically, we uncover that models accommodating for asymmetry, leverage effect and heavy tails in the equity returns innovation’s distributions offer more accurate VaR and ES forecasts than those with normal errors. We conjecture that asymmetry, leverage effects and fait-tails, as main stylized facts are vital when forecasting accuracy of the VaR models for securities.
Even if the VaR and ES will remain useful tools of risk quantification in equity markets but their use may be more cautious in the future. Specifically, our results offer several practical commendations for banks, hedge funds and other financial institutions operating in the MENA region. Indeed, our results corroborate Basel II recommendations that allows financial institutions to design their own models to forecast the VaR. We recommend the use of the APARCH model under skewed Student density is that accounts for asymmetry and fat tails is preferred to other competing models since it delivers the lowest number of violations for all the selected equity markets.
Table (6). Percentage of violations and DCCs under Basel II requirements.
Model Percentage of
violations
DCCs
mean minimum maximum
Saudi Arabia APARCH-N 0.8762 0.33325 0.16866 0.66411 APARCH- St 0.3344 0.19487 0.13541 0.37216 APARCH-sk.St. 0.2152 0.18422 0.12876 0.39412 Egypt APARCH-N 0.9241 0.16447 0.27614 0.29443 APARCH- St. 0.9241 0.17417 0.16441 0.19655 APARCH-sk.St. 0.9241 0.24215 0.22149 0.29886 Morocco APARCH-N 0.2644 0.11241 0.08766 0.12300 APARCH- St. 0.2644 0.18045 0.07541 0.14547 APARCH-sk.St. 0.2644 0.10004 0.08021 0.13422 Turkey APARCH-N 0 0.12221 0.08542 0.16556 APARCH- St. 0 0.11251 0.07665 0.18653 APARCH-sk.St. 0 0.09466 0.05761 0.12890 Notes: The bold face numbers indicate the most appropriate models in terms of minimum daily capital charges, and the italic numbers the most appropriate models with respect to the criterion of lowest number of violations. St refers to Student density. Sk. St. refers to skewed Student density.

Chaker Aloui: Value-at- risk and Basel capital charges…
15
References Aloui, C. and Mabrouk, S., 2010. One-day-ahead
value-at-risk estimations with dual long-memory models: evidence from the Tunisian stock market. International Journal of Financial Management Services 2, 77-94.
Aloui, C., and B.H Hamida, 2014. Modelling and forecasting value at risk and expected shortfall for GCC stock markets: Do long memory, structural breaks, asymmetry, and fat-tails matter? North American journal of Economics and Finance, 29, 349-380.
Assaf, A., 2006. Fractional integration in the equity markets of MENA region. Applied Financial Economics, 17, 709-723.
Assaf, A., 2015. Value at risk analysis in the MENA equity markets: fat tails and conditional asymmetries in return distributions. Journal of Multinational Financial Management 29, 30-45.
Assaf, A., and Cavalcante, J., 2005. Long-range dependence in the returns and volatility of the Brazilian stock market. European Review of Economics and Finance 4, 5–20.
Basel Committee on Banking Supervision (2006). International convergence of capital measurement and capital standards - A revised framework. Basel. Available on the link: www.bis.org/publ/bcbs118.htm.
Bollerslev, T., 1986 Generalized autoregressive conditional heteroscedasticity, Journal of Econometrics, 31, 307-327.
Chkili, W. S. Hammoudeh and D. K. Nguyen, 2014. Volatility forecasting and risk management for commodity markets in the presence of asymmetry and long memory. Energy Economics 41, 1-18.
Choudhry, T. 1997. Stochastic trends in stock prices: Evidence from Latin American markets. Journal of Macroeconomics 19, 285-304.
Degiannakis, S, C. Floros and P. Dent 2013. Forecasting value-at-risk and expected shortfall using fractionally integrated models of conditional volatility: international evidence. International Review of Financial Analysis 27, 21-33.
Degiannakis, S. 2004. Volatility forecasting: Evidence from a fractional integrated asymmetric power ARCH skewed-t model. Applied Financial Economics 14, 1333–1342.
Diamandis, F. A. A. Drakos, G. Kouretas and L. Zarangas, 2011. Value at risk for long and short trading positions: evidence from developed and emerging equity markets. International Review of Financial Analysis 20, 165-176.
DiSario, R, H. Saraoglu, J. McCarthy, y U.H. Li, 2008. Long memory in the volatility of an emerging equity market; the case of Turkey. International Financial Markets, Institutions & Money 18, 305.312.
Dickey, D.A., W. A. Fuller, 1979, Distribution of the estimates for autoregressive time series with a unit root, Journal of American Statistical Association, 74, 427-482.
Dimitrakopoulos, D. N., Kavussanos, M. G., and Spyrou, S. I., 2010. Value at risk models for volatile emerging markets equity portfolios, Quarterly Review of Economics and Finance 50, 515-526.
Ding, Z., C. W. J. Granger, and R.F. Engle, 1993. A long memory property of stock markets returns and a new model. Journal of Empirical Finance1, 83-106.
Engle, R., and Manganelli, S., 2004. CAViaR: conditional autoregressive value at risk by regression quantiles. Journal of Business Economics and Statistics, 22, 367-381.
Engle, R., Manganelli, S., 1999. CAViaR: conditional autoregressive value at risk by regression quantiles. Mimeo, San Diego, Department of Economics.
Giot, P., 2002a. Market risk models for intraday data. University of Namur Discussion Paper 230.
Giot, P., 2003b. The information content of implied volatility in agricultural commodity markets. Journal of Futures Markets 23, 441–454.
Giot, P., Laurent, S., 2001. Modelling daily value-at-Risk using realized volatility and ARCH type models. Maastricht University METEOR RM/01/026.
Giot, P., Laurent, S., 2003. Value-at-risk for long and short positions. Journal of Applied Econometrics 18, 641–664.
Glosten, L.R.R. D.E. Jagannathan y D.E. Runkle 1993. On the relation between the expected value and the volatility of the nominal excess return on stocks. The Journal of finance 48, 1779-1801.
Hardle, W., and Mungo, J. 2008. Value at risk and expected shortfall when there is long-range dependence. Discussion Paper 2008-006. Germany: Humboldt-universität zuBerlin.
Jarque, C.M., A. K. Béra, 1980. Efficient tests for normality, homoscedasticity and serial independence of regression residuals. Economics Letters 6, 255-259.
Jorion, P 2002, How Informative arevalue at risk disclosures. The Accounting Review 74, 911-931, April 2008 <http://www.jstor.org>.

J. King Saud Univ., Vol. 27, Admin. Sci. (1), Riyadh (2017/1438H.)
16
Kasman, A. y D. Torun 2007. Long memory in the Turkish stock market return and volatility. Central Bank Review. Central Bank of the Republic of Turkey, 14.27.
Kamakar, M and G. Shukla, 2015. Managing extreme risk in some stock markets: an extreme value approach. International Review of Economics and Finance 35, 1-25.
Kilic, R. 2004. On the long memory properties of emerging capital markets: evidence from Istanbul stock exchange. Applied Financial Economics, 14, 915-922.
Kupiec, P., 1995. Technique for verifying the accuracy of risk measurement models. Journal of Derivatives 2, 173-184.
Kwiatkowski, D., Phillips P.C.W, Schmidt P., Shin Y., 1992. Testing the null hypothesis of stationarity against the alternative of unit root. Journal of Econometrics 54, 159-178.
Lagoarde-Segot, T., and B.M. Lucey, 2008. The capital markets of the Middle East and North African region: situation and characteristics. Emerging Markets Finance and Trade 44, 68–81.
Lambert, P., Laurent, S., 2001. Modelling financial time series using GARCH-type models and a skewed Student density, Mimeo, Université de Liège.
Mabrouk, S., and Saadi, S. 2012. Parametric value-at-risk analysis: Evidence from stock indexes. Quarterly Review of Economics and Finance, 52, 305–321.
Maghyereh, H.A. Al-Zoubi, 2006. Value-at-risk under extreme values: the relative performance in MENA emerging stock markets. International Journal of Managerial Finance 2, 154 – 172
Marzo, M. and Zagalia, P. 2007.Volatility forecasting for crude oil Futures. Working Paper 599, Department of Economics, Stockholm University.
McAleer, 2009a. The Ten Commandments for Optimizing Value-at-Risk and Daily Capital Charges. Paper available on the link: https://ideas.repec.org/p/cfi/fseres/cf164.html
McAleer. M., T. Peréz-Amaral and J.-Á. Jiménez-Martin 2009, A Decision rule to minimize daily capital charges in forecasting value-at-risk, Available at SSRN: http://ssrn.com/abstract=1349844.
Perron, P., 1988, Trends and Random Walks in Macroeconomic Time Series: Further Evidence from a New Approach. Journal of Economic Dynamics and Control, 12, 297-332.
Poon, Ser-Huang, and Clive W.J. Granger. 2003. Forecasting Volatility in Financial Markets: A Review. Journal of Economic Literature, 41, 478-539.
Rossignolo, A. F., M.D. Fethi and M. Shahban, 2012. Value at risk and Basel capital charges: evidence for emerging and frontier stock markets. Journal of Financial Stability 8, 303-319.
Su, J-Bin, 2014. Empirical analysis of long memory, leverage and distribution effects for stock market risk estimates. North American Journal of Economics and Finance 30, 1-39.
Su, J-Bin, 2015. Value at risk estimates of the stock indexes in developed and emerging markets including the spillover effects of currency market. Economic Modelling 46, 204-224.
Su, Y.C., H.C. Huang and Y.J. Lin. 2011. GJR GARCH model in value at risk of financial holdings.Applied Financial Economics 21, 1819-1829.
Tang, T.L and Shieh, S.J. 2006 LM in stock index futures markets: A value-at-risk approach, Physica A, 366, 437-448.
Yamai, Y., and Yoshiba, T., 2005. Value-at-risk versus expected shortfall: A practical perspective. Journal of Banking and Finance 29, 997–1015.

Chaker Aloui: Value-at- risk and Basel capital charges…
17
����� ���� :�� � ����� ��� � �� ��� � ������ �� �� !""#$
%���� �&'�� "#(�)� �*+' !,���
-��. �/ 0
������ �� �� ��− ����� ����� ����
���� ���� �����− ������� ��� ��� �!�"��
# $%�� &'()*+,-,-./. # $%�� 01(2 ,45-.,6,-./+745
:�"1 �2�� �*�3'� �8��� 9���� ,:�2�� 9$��2 ��� ;� ��< �=%� , >�?�� ���@ , AB���APARCH C(� �� ,
0D� �� − E��"F�G 4 �� 567�'� �8��� 9���� H��I�I � ��� �� ������� H��J�K� L�1� ��" M�� H�NDO �� ���� �I5 �2�% �
P1> ���2 C(� �� AB���2 >�?�� ���@ # Q��R�� �� ST� H�� U�'S�� U2'S2 0�I�� 'V�����2 0D� �� W52 �X�� E��"F� C(� �� AB��� H��J�@*"F� ����'�� YI5 # 0"� F GE�� ���2 Z���� [\ �;�]� ^� _��F� U`D
GH���X� �� 9$��2 ��� ;� ��< �=%� a�'�1� ����� 9���� C��� ����� H�bc� d�1 F eI�� f8%�� P�1=@ � � �5 E��"F� �I5 a� �8��� 0gM �� fV� %�� h1@ G��� @2 i j��2 ������� ��� ��� �!�"�� 2k� W52 :�2��
�l m��%�� 'V�����2 0D� �� &'� i�� � T �� �X�1� ���� n�� H�1�= � mS C(� �� AB��� ���@2 0�I��*G �%BV� F2 c1% �� o� ��'�� o� '" �� eI�� ,P���%g�� e �'�2 h�;k��2 ^� "] "�� �'�p� W5����� >�?� '�q�
G9���