Embed Size (px)
Citation preview

Value and Growth Investing: Review and Update
Louis K.C. Chan and Josef Lakonishok
A great deal of academic empirical research has been published on valuearid growth investing. We review and update this literature, discuss thevarious explanations for the performance of value versus growth stocks,review the empirical research on the alternative explanations, and providesome new results based on an updated and expanded sample. The evidencesuggests that, even after taking into account the experience of the late1990s, value investing generates superior returns. Common measures ofrisk do not support the argument that the return differential is a result ofthe higher riskiness of value stocks. Instead, behavioral considerations andthe agency costs of delegated investment management lie at the root of thevalue-growth spread.
^ u tJ he topic of value and growth investing isI / a prime example of the fruitful exchange
J of ideas between academic research andinvestment practice. The results from aca-
demic studies have formed the basis for investmentstrategies that are widely applied in equity mar-kets. Going the other way, issues encountered byportfolio managers and consultants, such as proce-dures for identifying value or growth styles and thedesign of style-specific benchmark indexes for per-formance evaluation, have spurred ongoing analy-sis and extensions in the research literature.
The explosion of academic interest in valueand growth investment strategies can be tracedback to Fama and French (1992) and Lakonishok,Shieifer, and Vishny (1994), The Fama and Frenchresults delivered a stunning blow to the explana-tory power of the capital asset pricing model andsparked debates about the "death of beta." In thewake of this study, academics shifted their atten-tion to the ratio of book value to market value ofequity and company size as the leading explana-tory variables for the cross-section of average stockreturns. This work built on earlier studies of stockmarket "anomalies." Basu (1977), for example,showed that stocks with low P/Es subsequentlytend to have higher average returns than stockswith high P/Es. Chan, Hamao, and Lakonishok(1991) studied Japanese data and found strong sup-port for the superior performance of value invest-ment strategies.
Louis K.C. Chan is professor of finance at the Universityof Illinois at Urbana-Champaign. ]osef Lakonishok isKarnes Professor ofFinanee at the University of Illinoisat Urbana-Champaign.
Based on the accumulated weight of the evi-dence from studies on the book-to-market effectand related anomalies, the academic communityhas generally come to agree that value investmentstrategies, on average, outperform growth invest-ment strategies. Much less consensus exists, how-ever, about the underlying reasons for the superiorreturns. Fama and French (1992) took the positionof the efficient market hypothesis and attributedthe higher returns of value strategies to theirincreased risk. Lakonishok, Shieifer, and Vishny(1994) suggested that cognitive biases underlyinginvestor behavior and the agency costs of profes-sional investment management were at the root ofthe rewards to value investing. Yet another expla-nation for the returns to value investing rested onmethodological issues of data-selection bias (seeKothari, Shanken, and Sloan 1995). A careful studyby Chan, Jegadeesh, and Lakonishok (1995), how-ever, suggested that no such bias can explain thedifferential performance of value and growthinvesting.^
The academic work on value investing has hada strong impact on professional investment man-agement. Value and growth are now widely recog-nized distinctive specializations adopted by moneymanagers. Additionally, the research studies havebeen instrumental in the development of style-specific benchmarks that have proliferated in per-formance evaluation and attribution analysis. Manysuch benchmarks are based on a variable that hasbeen extensively used in academic studies—^bookvalue to market value of equity (BV/MV)—and thisratio has become an important indicator of a port-folio's orientation toward either growth or value.
January/February 2004 71

Financial Analysts Journal
In this article, we review and update the empir-ical academic research on value and growth invest-ing. Several other articles have provided extensivesurveys of the theoretical issues involved in thedebate over value-growth investing (see, for exam-ple, Fama 1998 and Campbell 2000). And numerousarticles have covered explanations put forth in theburgeoning field of behavioral finance or reviewedalternative explanations for the value premium ina formal manner (Scott, Stumpp, and Xu 1999;Shleifer 2000; Hirshleifer 2001; Barberis and Thaler2002). To avoid a duplication of these efforts, wefocus on the empirical aspects of the debate.
We begin by surveying the evidence on theperformance of value investment strategies.Because the underlying reasons for the perfor-mance are more controversial than the perfor-mance findings themselves, we also give anoverview of the evidence for and against variousexplanations for the returns on value strategies.Finally, we provide some fresh evidence for theU.S. and non-U.S. markets.
Returns on Value InvestingThe results from three key early studies of thereturns from value-growth investment strategiesare summarized in Table 1. Panel A of the tabledraws from Fama and French (1992), who sortedstocks on the NYSE, Amex, and Nasdaq marketsinto 10 portfolios based on the stocks' BV/MV(Panel Al) or ratio of earnings to price (Panel A2).As the portfolio numbers across the top indicate,the top and bottom decile portfolios were eachfurther divided into equal halves.
In the sort by BV/MV, the highest ranked port-folio was dubbed the "value" portfolio and the low-est ranked was dubbed the "glamour" portfolio.Panel Al of Table 1 shows that the value portfolio.Portfolio lOB, as defined by BV/MV, generated anaverage monthly return of 1.83 percent. Comparedwith the average monthly return on the companionglamour portfolio (Portfolio 1 A) of 0.30 percent, thevalue stocks come out ahead by 1.53 percentagepoints (pps) a month. At the same time, the marketbetas of the portfolios are very close to each other,so systematic risk is not an obvious suspect forexplaining the differences in retums. In this study,value stocks with high BV/MVs, on average, tendedto be smaller than growth stocks: The logarithm ofsize for the top (bottom) portfolio is 2.65 (4.53). Thus,the possibility exists that part of the BV/MV effectreflects the historical premium of small companiesover large companies (see Banz 1981).
As Panel B of Table 1 shows, Lakonishok,Shleifer, and Vishny (1994) provided similar find-ings based on NYSE and Amex stocks. Becausethey reported buy-and-hold returns over severalyears following portfolio formation, their resultsare particularly relevant from the perspective of along-term investor. When sorted by BV/MV (PanelBl), the value stocks of Portfolio 10 (identified asthose with the highest BV/MVs) outperformed the"growth" stocks of Portfolio 1 (defined as the oppo-site of value stocks, lowest BV/MVs) by 10.5 pps ayear, on average, over the five years followingportfolio formation. The superior returns persistedeven after the authors controlled for differences insize. The average size-adjusted return over the fivepostformation years for the value portfolio was 3.5percent, which is a spread of 7.8 pps over the returnfor the growth portfolio. The BV/MV effect, inother words, was not subsumed by the size effect.
Although BV/MV has garnered the lion'sshare of attention as an indicator of value-growthorientation, it is by no means an ideal measure. Totake an example from market conditions as of mid-2002, a stock such as AOL-Time Warner wouldgenerally be classified as a "cheap" stock in termsof the book-to-market ratio. By many other yard-sticks, such as earnings or dividends relative toprice, however, the stock would look less attractivefrom the value standpoint. This disparity suggeststhat other measures might also serve as the basesfor investment strategies. For example, as PanelsA2 and B2 show, return spreads based on earningsto price were generally lower than the spreadsbased on BV/MV. For instance, the sort by E/P inPanel A2 of Table 1 yielded a return spread of 0.68pps a month between the extreme portfolios. Thespread shown in Panel B2 for size-adjusted aver-age returns was 5.4 pps a year. Note that in bothcases, the sorts used only those stocks that hadpositive earnings at the portfolio formation date.The narrower spreads associated with the earningsyield, E/P, may be a result of the noisy nature ofearnings. For instance, the category of stocks withlow E/Ps includes not only stocks that are conven-tionally deemed to be growth stocks (those whosecurrent earnings are low but whose future growthprospects are perceived to be high) but also stocksthat have stumbled and have temporarilydepressed earnings.
Another valuation indicator that has generallyreceived less attention in academic research is theratio of cash flow to price (CF/P). In its simplestform, cash flow is measured as earnings plusdepreciation. Portfolios formed on the basis of thisinvestment strategy generate relatively largerreturn spreads than portfolios based on BV/MV.
72 ©2004, AIMR®

Value and Growth Investing
Table 1. Returns andStudy/Measure
A. Fama and French (1992)
1 Characteristics forlA
1. Sorted by book-to-market ratio
Monthly return (%)
Beta
Log size
0,30
1,36
4,53
2, Sorted by earnings-to-price ratio
Monthly return (%)
Beta
Log size
1,04
1,40
3,64
IB
0,67
1,34
4,67
0,93
1,35
4,33
B. Lakonishok, Shieifer, and Vishny (1994)
1 2
2
0,87
1,32
4,69
0,94
1,31
4,61
3
Value-Growth3
0,97
1,30
4,56
1,03
1,28
4,64
4
4
1,04
1,28
4,47
1,18
1,26
4,63
5
Investment5
1,17
1,27
4,38
1,22
1,25
4,58
6
6
1,30
1,27
4,23
1,33
1,26
4,49
7
Strategies7
1,44
1,27
4,06
1,42
1,24
4,37
8
8
1,50
1,27
3,85
1,46
1,23
4,28
9
9
1,59
1,29
3,51
1,57
1,24
4,07
10
lOA
1,92
1,33
3,06
1,74
1,28
3,82
lOB
1,83
1,35
2,65
1,72
1,31
3,52
1, Sorted by book-to-market ratio
Annual return (%) 11,0 11,7 13,5 12,3 13,1 15,4 15,4 17,0 18,3 17,3
Average annual returnover 5 years (%) 9,3 12,5 14,6 15,4 15,8 16,6 18,4 18,9 19,6 19,8
Size-adjusted averageannual return (%) -4,3 -2,0 -0,30 0,4 0,6 1,2 2,4 2,8 3,3 3,5
2, Sorted by earnings-to-price ratio
Annual return (%) 12,3 12,5 14,0 13,0 13,5 15,6 17,0 18,0 19,3 16,2
Average armual returnover 5 years (%) 11,4 12,6 14,3 15,2 16,0 16,7 18,8 19,1 19,6 19,0
Size-adjusted averageannual return (%) -3,5 -2,4 -0,9 -0,1 0,5 1,3 2,6 2,6 2,9 1,9
3, Sorted by cash-flow-to-price ratio
Annual return (%) 8,4 12,4 14,0 14,0 15,3 14,8 15,7 17,8 18,3 18,3
Average annual returnover 5 years (%) 9,1 12,2 14,5 15,7 16,6 17,1 18,0 19,2 19,9 20,1
Size-adjusted averageannual return (%) -4,9 -2,5 -0,6 0,5 1,3 1,9 2,5 3,4 3,7 3,9
C. Chan, Hamao, and Lakonishok (1991)
1 2 3 4
1, Sorted by book-to-market ratio
Monthly return (%) 1,3 1,7 1,9 2,4
Monthly standarddeviation 4,3 4,3 4,3 4,6
2, Sorted by earnings-to-price ratio
Monthly return (%) 1,5 1,7 1,8 1,9
Monthly standarddeviation 4,3 4,1 4,1 4,3
3, Sorted by cash-flow-to-price ratio
Monthly return (%) 1,4 1,7 1,9 2,2
Monthly standarddeviation 4,1 4,1 4,3 4,6
Notes: The sample for Panel A was all NYSE, Amex, and Nasdaq stocks with data on returns and accounting information. Monthlyreturns were measured for equally weighted portfolios. Results in Panel B came from all NYSE and Amex stocks with data on returnsand accounting information, Buy-and-hold returns on equally weighted portfolios were measured annually from April each year for1968-1989, Panel C results were based on all stocks in the first and second sections of the Tokyo Stock Exchange, Monthly equallyweighted portfolio returns were measured from June 1971 to December 1988, In the sorts by earnings to price and cash flow to price,results were provided only for stocks with positive earnings or positive cash flow at the portfolio formation date.
January/February 2004 73

Financial Analysts Journal
For example, in Panel B3, the portfolio ranked high-est by CF/P (Portfolio 10) earned, on average, 3.9percent a year over five years after adjusting forsize, which is 8.8 pps higher than Portfolio 1. WhenBV/MV was used, the difference between theextreme portfolios with respect to average size-adjusted returns over five years was 7.8 pps. To theextent that the different indicators are not highlycorrelated, these results suggest that a strategybased on several signals may enhance portfolioperformance. We follow up on this suggestion laterin this article.
One might argue that these findings are theresult of a collective data-snooping exercise bymany researchers sifting through the same data. Ifso, the success of value strategies may not hold upin other periods or other markets. Some comfortthat this supposition is not the case is afforded byanother early study—one by Chan, Hamao, andLakonishok. Their contribution was to study theJapanese stock market, which had not previouslybeen examined in depth, even though at that timeit was almost as large as the U.S. market in terms ofcapitalization. Panel C of Table 1 provides some oftheir key findings. The return differential betweenthe highest and lowest quartile of stocks ranked byBV/MV was 1.1 pps a month. Their results for E/Pand CF/P were similar to the U.S. evidence. Finally,the Japanese evidence did not indicate that valuestocks have higher total risk, as measured by stan-dard deviation of monthly retums, than growthstocks.
The Chan-Hamao-Lakonishok findings takeon added force in light of condifions in the Japanesemarket at the time they conducted their study. Inparticular, the popular sentiment was that, giventhe spectacular run-up in Japanese stock prices inthe 1980s, equity values in Japan could not be ana-lyzed by using conventional approaches devel-oped with U.S. data. The fact that the same overallfindings emerged in two markets with very differ-ent conditions bolsters confidence that data miningis not driving the findings.
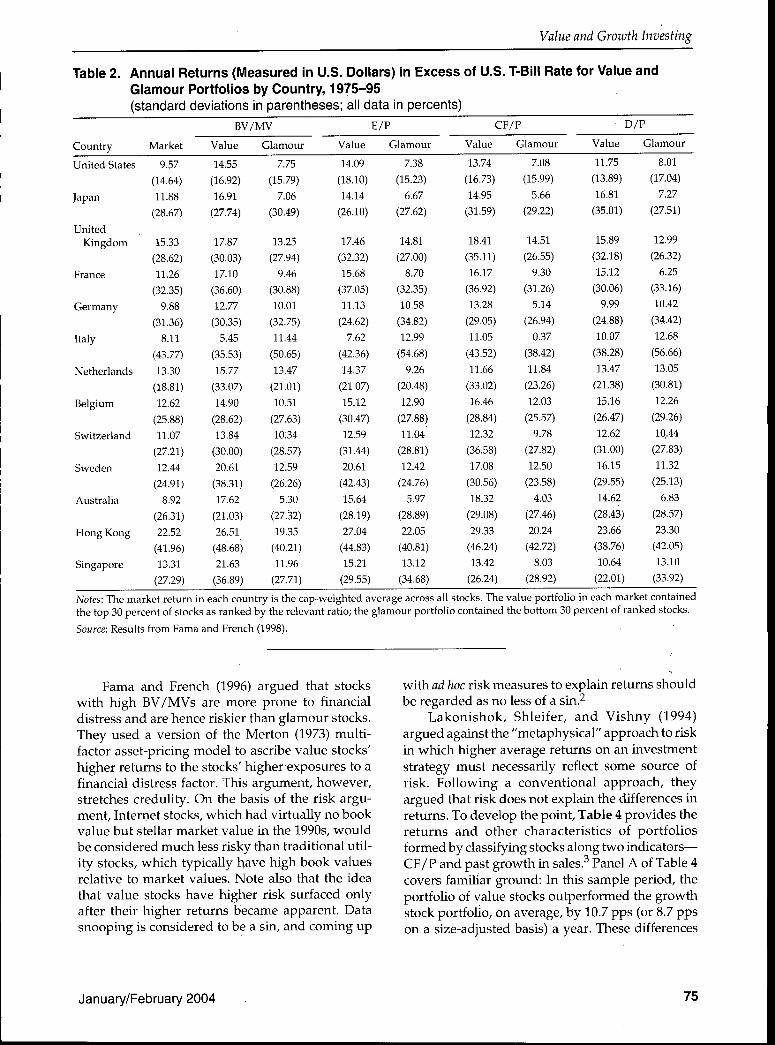
Table 2 provides the Fama and French (1998)results for a broad sample of countries. Value andglamour were defined by a variety of indicators—BV/MV, E/P, CF/P, and dividends to price (D/P).The consistency of the evidence is impressive. Inalmost every country, the value portfolio generateda higher average return than the glamour portfolio.Moreover, the results hold up across the variety ofvalue-growth indicators. Table 2 also reports thestandard deviations of the returns on each portfo-lio, and in general, the return volatilities of thevalue portfolios are not notably different from thevolatilities of the glamour portfolios. Fama and
French also reported results similar to those shownin Table 2 for emerging stock markets.
These results indicate that value stocks, in gen-eral, outperform glamour stocks across all eligiblestocks. In practice, however, the investable equityuniverse for many portfolio managers is limited tolarge-cap stocks, which tend to be the more liquidclass. Table 3 shows the Fama-French (1992) find-ings on whether the performance of value strate-gies holds up for large-cap stocks. In the categoryof the smallest companies (Size Decile 1), the port-folio of value stocks (Portfolio 10) had an averagereturn (1.92 percent) that was 1.22 pps higher thanthe average return of the glamour stock portfolio(Portfolio 1). Value stocks still earned higherreturns in the category of the largest stocks, but themargin was less substantial (0.25 pps a month).Putting aside risk-based explanations, one couldconjecture that small companies are less widelyfollowed and the costs of arbitrage may be higherfor these stocks. As a result, mispricing patternsmay be more pronounced in the small-cap segmentof the market, yielding richer opportunities for avalue strategy than in the large-cap segment.
Beyond the interaction between BV/MV andcompany size, some studies have explored the linksbetween BV/MV and other return regularities. Forexample, Asness (1997) and Daniel and Titman(1999) studied the interaction between the valueeffect and past return (price momentum). Chan,Lakonishok, and Sougiannis (2001) incorporatedintangible assets in the book value of equity andfound that doing so improved the performance ofthe value approach. Piotroski (2000) used variousfinancial statement data to identify more sharplysuccessful value stocks. Ferson and Harvey (1999)used conditioning information to help predict thevalue premium. The results of these studies suggestthat blending various investment approaches, suchas value and momentum, may allow an investor toreap larger returns than can be obtained by usingonly indicators related to value versus growth. Ourobjective in this article, however, is not to select themost profitable investment strategy, so we do notpursue these refinements of the basic valueapproach.
Explaining the Performance ofVaiue StrategiesAlthough the evidence on returns is relativelyuncontroversial, the situation is far less settledwhen it comes to providing an explanation for thedifferences between the performance of value andgrowth portfolios.
74 ©2004, AIMR®
Value and Growth Investing
Table 2. Annual Returns (Measured in U.S. Dollars) in Excess of U.S. T-Bill Rate for Value andGlamour Portfolios by Country, 1975-95(standard deviations in parentheses; all data in percents)
Country
United States
Japan
UnitedKingdom
France
Germany
Italy
Netherlands
Belgium
Switzerland
Sweden
Australia
Hong Kong
Singapore
Market
9.57
(14.64)
11.88
(28.67)
15.33
(28.62)
11.26
(32.35)
9.88
(31.36)
8.11
(43.77)
13.30
(18.81)
12.62
(25.88)
11.07
(27.21)
12.44
(24.91)
8.92
(26.31)
22.52
(41.96)
13.31
(27.29)
BV/MV
Value
14.55
(16.92)
16.91
(27.74)
17.87
(30.03)
17.10
(36.60)
12.77
(30.35)
5.45
(35.53)
15.77
(33.07)
14.90
(28.62)
13.84
(30.00)
20.61
(38.31)
17.62
(21.03)
26.51
(48.68)
21.63
(36.89)
Glamour
7.75
(15.79)
7.06
(30.49)
13.25
(27.94)
9.46
(30.88)
10.01
(32.75)
11.44
(50.65)
13.47
(21.01)
10.51
(27.63)
1034
(28.57)
12.59
(26.26)
5.30
(27.32)
19.35
(40.21)
11.96
(27.71)
Value
14.09
(18.10)
14.14
(26.10)
17.46
(32.32)
15.68
(37.05)
11.13
(24.62)
7.62
(42.36)
14.37
(21.07)
15.12
(30.47)
12.59
(31.44)
20.61
(42.43)
15.64
(28.19)
27.04
(44.83)
15.21
(29.55)
E/P
Glamour
7.38
(15.23)
6.67
(27.62)
14.81
(27.00)
8.70
(32.35)
10.58
(34.82)
12.99
(54.68)
9.26
(20.48)
12.90
(27.88)
11.04
(28.81)
12.42
(24.76)
5.97
(28.89)
22.05
(40.81)
13.12
(34.68)
CF/P
Value
13.74
(16.73)
14.95
(31.59)
18.41
(35.11)
16.17
(36.92)
13.28
(29.05)
11.05
(43.52)
11.66
(33.02)
16.46
(28.84)
12.32
(36.58)
17.08
(30.56)
18.32
(29.08)
29.33
(46.24)
13.42
(26.24)
Glamour
7.08
(15.99)
5.66
(29.22)
14.51
(26.55)
9.30
(31.26)
5.14
(26.94)
0.37
(38.42)
11.84
(23.26)
12.03
(25.57)
9.78
(27.82)
12.50
(23.58)
4.03
(27.46)
20.24
(42.72)
8.03
(28.92)
Value
11.75
(13.89)
16.81
(35.01)
15.89
(32.18)
15.12
(30.06)
9.99
(24.88)
10.07
(38.28)
13.47
(21.38)
15.16
(26.47)
12.62
(31.00)
16.15
(29.55)
14.62
(28.43)
23.66
(38.76)
10.64
(22.01)
D/P
Glamour
8.01
(17.04)
7.27
(27.51)
12.99
(26.32)
6.25
(33.16)
10.42
(34.42)
12.68
(56.66)
13.05
(30.81)
12.26
(29.26)
10,44
(27.83)
11.32
(25.13)
6.83
(28.57)
23.30
(42.05)
13.10
(33.92)
Notes: The market return in each country is the cap-weighted average across all stocks. The value portfolio in each market containedthe top 30 percent of stocks as ranked by the relevant ratio; the glamour portfolio contained the bottom 30 percent of ranked stocks.
Source: Results from Fama and French (1998).
Fama and French (1996) argued that stockswith high BV/MVs are more prone to financialdistress and are hence riskier than glamour stocks.They used a version of the Merton (1973) multi-factor asset-pricing model to ascribe value stocks'higher returns to the stocks' higher exposures to afinancial distress factor. This argument, however,stretches credulity. On the hasis of the risk argu-ment, Internet stocks, which had virtually no bookvalue but stellar market value in the 1990s, wouldbe considered much less risky than traditional util-ity stocks, which typically have high book valuesrelative to market values. Note also that the ideathat value stocks have higher risk surfaced onlyafter their higher returns became apparent. Datasnooping is considered to be a sin, and coming up
with ad hoc risk measures to explain returns shouldbe regarded as no less of a sin.^
Lakonishok, Shleifer, and Vishny (1994)argued against the "metaphysical" approach to riskin which higher average returns on an investmentstrategy must necessarily reflect some source ofrisk. Following a conventional approach, theyargued that risk does not explain the differences inreturns. To develop the point. Table 4 provides thereturns and other characteristics of portfoliosformed by classifying stocks along two indicators—CF/P and past growth in sales.'' Panel A of Table 4covers familiar ground: In this sample period, theportfolio of value stocks outperformed the growthstock portfolio, on average, by 10.7 pps (or 8.7 ppson a size-adjusted basis) a year. These differences
January/February 2004 75

Financial Analysts Journal
Table 3.
Size
All
1 (Small)
2
3
4
5
6
7
8
9
10 (Large)
Monthly Returns for Value and Glamour Portfolios (Sorted by BV/MV) byCategories, July
All
1.23%
1.47
1.22
1.22
1.19
1.24
1.15
1.07
1.08
0.95
0.89
1(glamour)
0.64%
0.70
0.43
0.56
0.39
0.88
0.70
0.95
0.66
0.44
0.93
1963-December
2
0.98%
1.14
1.05
0.88
0.72
0.65
0.98
1.00
1.13
0.89
0.88
3 •
1.06%
1.20
0.96
1.23
1.06
1.08
1.14
0.99
0.91
0.92
0.84
1990Book/Market Category
4
1.17%
1.43
1.19
0.95
1.36
1.47
1.23
0.83
0.95
1.00
0.71
5
1.24%
1.56
1.33
1.36
1.13
1.13
0.94
0.99
0.99
1.05
0.79
6
1.26%
1.51
1.19
1.30
1.2i1.43
1.27
1.13
1.01
0.93
0.83
7
1.39%
1.70
1.58
1.30
1.34
1.44
1.19
0.99
1.15
0.82
0.81
8
1.40%
1.71
1.28
1.40
1.59
1.26
1.19
1.16
1.05
1.11
0.96
Market-Cap (Size)
9
1.50%
1.82
1.43
1.54
1.51
1.52
1.24
1.10
1.29
1.04
0.97
10(value)
1.63%
1.92
1.79
1.60
1.47
1.49
1.50
1.47
1.55
1.22
1.18
Notes: The sample was all NYSE, Amex, and Nasdaq stocks with data on returns and accounting information. Monthly returns onequally weighted portfolios were measured. Portfolios were formed in June each year by ranking stocks on size into 10 groups basedon breakpoints from NYSE stocks. Within each size category, stocks were further classified into one of 10 portfolios based on BV/MV.The column labeled "All" reports equally weighted portfolio average returns for each size category; the row labeled "All" reportsequally weighted average returns for all stocks classified in the specified BV/MV category.Source: From Fama and French (1992).
in retums were not accompanied by notable differ-ences in traditional measures of risk, including betaand volatility.
The possibility exists, however, that beta andvolatility are crude proxies that do not capture allthe relevant risks of the two portfolios. Thus, PanelB of Table 4 provides a more direct evaluation ofthe risk-based explanation. If the value strategy isfundamentally riskier, then it should under-perform relative to the growth strategy duringundesirable states of the world when the marginalutility of wealth is high. The key to the risk argu-ment, then, is to identify such undesirable states. Anatural choice is months when the overall stockmarket did poorly. Down-market months gener-ally correspond to periods when aggregate wealthis low and thus the utility of an extra dollar is high.The approach of examining portfolio performanceduring down markets also corresponds to thenotion of downside risk that has gained popularityrecently in the investment community. Along thesame lines, periods when the economy suffersdownturns and growth shrinks could also be sin-gled out as low-wealth states.
Panel B of Table 4 shows results for value ver-sus growth with undesirable states defined by themarket or defined by the U.S. economy. For the datashown in Part 1 of Panel B, Lakonishok, Shleifer,and Vishny (1994) isolated the 25 months with theworst stock market performance (the lowest returnon the equally weighted market index), the remain-
ing 88 months with negative market returns, the 122months with positive market returns excluding thebest 25, and the 25 months with the best marketperformance. When the market return was nega-tive, value stocks outperformed glamour stocks,and the outperformance was somewhat more pro-nounced in the worst 25 months. When the marketearned a positive return, the value portfolio at leastmatched the performance of the glamour portfolio.Panel B2 shows that the results were similar whengood and bad times were defined by quarterlygrowth in real GNP; notably, rather than sufferingmore during periods of poor GNP growth, thevalue portfolio outperformed the glamour portfolioby 5 pps a quarter.^ All in all, this evidence does notsupport the View that the superior returns on valuestocks reflect their higher fundamental risk. None-theless, there are many possible proxies for risk, sothe risk-based explanation cannot, be definitivelylaid to rest.
A competing explanation for.the returns onvalue stocks draws on behavioral considerationsand agency costs. Studies in psychology have sug-gested that individuals tend to use simple heuris-tics for decision making, which opens up thepossibility of judgmental biases in investmentbehavior.5 In particular, investors may extrapolatepast performance too far into the future. Theanalysis reported in Panel C of Table 4 explored thisidea for value and growth stocks. As shown, valuestocks tend to. have a past history of poor
76 ©2004, AIMR®

Value and Growth Investing
Table 4. Returns, Risk ,and Past Performance for Value and Glamour Portfolios, May 1968-April 1990
Measure Growth Value
Difference(value - growth,
in pps)
A. Postformalion returns and risk measures
Average annual return over 5 postformation years (%)
Size-adjusted average armual return (%)
Beta
Standard deviation of return (%)
Standard deviation of size-adjusted return (%)
B. Postformation returns in good and bad states
1, By market
Return during worst 25 stock market months (%)
Return during months with negative market return excluding 25 worst (%)
Return during months with positive market return excluding 25 best (%)
Return during best 25 stock market months (%)
2, By economy
Return during worst 10 quarters of GNP growth (%)
Return during next worst 34 quarters of GNP growth (%)
Return during next best 34 quarters of GNP growth (%)
Return during best 10 quarters of GNP growth (%)
C. Preformation performance and returns
Average prior growth rate of earnings (%)
Average prior growth rate of cash flow (%)
Average prior growth rate of sales (%)
Cumulative stock return from three years before to portfolio formation (%)
11,4
-3,3
1,25
21,6
6,1
-10,3
-2,9
3,8
11,0
-0,9
1,1
2,6
10,3
14,2
21,0
11,2
139,0
22,1
5,4
1,32
24,1
6,5
-8,6
-1,5
4,0
12,4
4,1
2,7
4,6
13,9
8,2
7,8
1,3
22,5
10,7
8,7
1,8
1,4
0,2
1,4
5,0
1,6
2,0
3,6
-6,0
-13,2
-9,9
-116,5
Notes: The sample was all NYSE and Amex stocks with data on returns and accounting information. Monthly returns were measuredon equally weighted portfolios. Portfolios were formed in April each year from the largest 50 percent of eligible stocks. Stocks weresorted into three groups by CF/P and sorted independently by average growth rate of sales over five preformation years. The glamourportfolio contained the intersection of the lowest ranked category by CF/P and the highest ranked by past sales growth. The valueportfolio was the intersection of the highest ranked category by CF/P and the lowest ranked by past sales growth. Betas in Panel Aare reported with respect to the value-weighted CRSP index. Mean growth rates in Panel C are geometric.Source: Results are from Lakonishok, Shieifer, and Vishny (1994),
performance (relative to growth stocks) withrespect to growth in earnings, cash flow, and sales.Therefore, insofar as investors and brokerage ana-lysts overlook the lack of persistence in growthrates (see Chan, Karceski, and Lakonishok 2003)and project past growth into the future, favorablesentiment is created for glamour stocks.
Furthermore, agency factors may play a role inthe higher prices of glamour stocks. Analysts havea self-interest in recommending successful stocksto generate trading commissions, as well as invest-ment banking business. Moreover, growth stocksare typically in exciting industries and are thuseasier to tout in terms of analyst reports and mediacoverage (see Bhushan 1989; Jegadeesh, Kim,Krische, and Lee 2002), All these considerationsplay into the career concerns of professional moneymanagers and pension plan executives (see Lakon-
ishok, Shieifer, and Vishny 1992). Such individualsmay feel vulnerable holding a portfolio of compa-nies that are tainted by lackluster past performance,so they gravitate toward successful growth-oriented stocks. The upshot of all these consider-ations is that value stocks become underpriced andglamour stocks overpriced relative to their funda-mentals. Because of the limits of arbitrage (seeShieifer and Vishny 1997), the mispricing patternscan persist over long periods of time,
Chan, Karceski, and Lakonishok (2003) pro-vided some evidence of the existence of extrapola-tive biases in the pricing of value and glamourstocks. The common presumption is that BV/MVis a measure of a company's future growth oppor-tunities relative to its accounting value. Accord-ingly, low BV/MV suggests that investors expecthigh future growth prospects compared with the
January/February 2004 77

Financial Analysts Journal
value of assets in place. If these expectations arecorrect, a negative association should exist betweenBV/MV and future realized growth. To checkwhether BV/MV predicts future growth, theauthors ranked stocks by growth in income beforeextraordinary items over a five-year horizon (onlystocks with positive income in the base year enteredthe sample). Based on the ranking, stocks wereplaced in 1 of 10 deciles. Within each decile, theauthors foimd the median BV/MV at the beginningof the five-year horizon and also at the end. Theprocedure was repeated at the beginning of eachyear from 1951 to 1998.
The association between BV/MVs and futuregrowth was weak. The stocks ranked in the topdecile by growth in net income typically had aBV/MV of 0.88 at the beginning, which was higherthan the average BV/MV for all stocks (0.69). So,investors are not anticipating these companies'future success. Typically, then, stocks fetching highprices relative to book value or earnings wind upfalling short of investors' hopes. Nevertheless,Chan, Karceski, and Lakonishok found that ex postBV/MV tracked growth closely, showing thatinvestors are quick to jump on the bandwagon andchase stocks with high past growth. After theperiod of high growth, the top decile of companiestraded at a BV/MV of 0.56 (the lowest across thedeciles). Conversely, investors punished the com-panies with the lowest realized growth. In DecilePortfolio 1, the median ex posf BV/MV was 1.12 (thehighest of the deciles).
If investors incorrectly focus on past growth asa basis for growth forecasts and for valuation,prices should subsequently adjust as actual growthmaterializes. Evidence on whether such correctionstake place was provided by, among others. La
Porta, Lakonishok, Shleifer, and Vishny (1997).They looked at returns around earnings announce-ments for value and glamour portfolios based onsorts by BV/MV. Table 5 reports some of theirfindings. A benefit of working with announcementreturns is that over short intervals, differences inrisk are less likely to be an issue than they are overlong intervals. Table 5 indicates that in the first yearafter portfolio formation, investors tended to bedisappointed as news emerged about the earningsof glamour stocks. The cumulative event returnwas -0.5 percent for the glamour portfolio. Inves-tors were pleasantly surprised around announce-ments of value stocks' earnings; the cumulativeevent return for these stocks was 3.5 percent in thefirst year. In the second and third years, the contrastbetween the market's response to the subsequentearnings performance of the two portfolios contin-ued to be large and statistically significant.
This evidence supports the argument thatexpectational errors are at least part of the reasonfor the superior returns on value stocks. Specifi-cally, investors have exaggerated hopes aboutgrowth stocks and end up being disappointedwhen future performance falls short of their expec-tations. By the same token, they are unduly pessi-mistic about value stocks and wind up beingpleasantly surprised.
Tiie Evidence UpdatedOur updates to the evidence on growth versus valueinvesting took the form of incorporating datathrough 2001 (with a refined definition of value) andexpanding the application of this value approach todeveloped markets outside the United States.
Table 5. Returns around Earnings Announcement Dates in Postformation Years for Vaiue andGlamour Portfolios Sorted by BV/MV, 1971-92
Portfolio Return
Postformation Year
First
Second
Third
Fourth
Fifth
1 (glamour)
-0.472%
-0.428
0.312
0.804
0.424
2
0.772%
0.688
0.796
0.812
1.024
9
3.200%
2.828
2.492
2.176
1.368
10 (value)
3.532"/,
3.012
3.136
2.644
2.432
(value - glamour)
4.004 pps
3.440
2.824
1.840
2.008
Difference
5.65
7.14
5.12
3.67
4.49
Notes: The sample was all NYSE, Amex, and Nasdaq stocks with data on returns and accounting information for the sample period.Portfolios were formed in June each year by ranking stocks on BV/MV into 10 portfolios based on breakpoints from NYSE stocks. Forevery stock, buy-and-hold returns were measured over a window beginning one day before and ending one day after each earningsannouncement for the 20 quarters following portfolio formation. Stock returns were summed over the four quarters in eachpostformation year; the equally weighted portfolio return is reported. The t-statistic for the mean difference between the returns onthe value and glamour portfolios was based on the time series of postformation returns.Source: Results are from La Porta et al.
78 ©2004, AIMR®
Value and Growth Investing
Evidence through 2001 on Refined ValueStrategy. The bulk of the academic evidence on thereturns to value and glamour strategies has comefrom data ending in the mid-1990s. In this section,we update the evidence to 2001. In addition, weimplement a strategy based on the findings thatusing more than BV/MV to define value andgrowth may improve results. This exercise is inter-esting for several reasons. First, it provides an out-of-sample check on the profitability of value strat-egies. If investors became aware of the benefits ofvalue strategies from the published research andadjusted their portfolios, the rewards to valueinvesting may have been arbitraged away since theresearch became widely known. (A similarresponse may have been responsible for the demiseof the "small-firm effect" after the 1980s.) More-over, the late 1990s witnessed a stunning boom ingrowth stocks and the "dot-com" mania. Investors'ardor for technology, media, and telecommunica-tions issues reached feverish heights and propelledprices of such stocks to stellar levels. Indeed,growth stocks in general earned returns in thisperiod that far outstripped those on value stocks.We address the importance of the post-1995 rela-tive performance on the long-term performance ofvalue and growth strategies.
Table 6 presents returns on benchmarkindexes from Frank Russell Company that capturethe performance of various equity asset classes—large-, medium-, and small-cap stocks subdividedinto growth and value categories. The later part ofthe 1990s was harsh on value stocks. From 1996through 1999, the geometric mean annual return onthe Russell 1000 Growth Index of large-cap growthstocks was 31.3 percent, compared with 19.5 per-cent for the Russell 1000 Value Index of large-capvalue stocks. The performance was particularlystriking for the largest stocks; the Top 200 GrowthIndex posted an average return of 33.3 percent forthis period. At the opposite extreme, the Russell2000 Value Index of small-cap value stocks earnedonly 10.2 percent. These trends prompted analystsand journalists to speculate on the emergence of a"new paradigm" in equity investing that wouldmake the value-oriented investor an endangeredspecies.
Chan, Karceski, and Lakonishok (2000) sortedout the competing explanations for the relativestock price performance of the various equity assetclasses over the late 1990s. They did so by examin-ing whether changes in the relative valuations ofthe equity classes and their returns were accompa-nied by changes in operating profitability. Under arational pricing model, if one assumes no shift inrelative risks (so discount rates are unaltered), the
sizzling performance of growth stocks in the late1990s can be explained by a sequence of unantici-pated positive shocks to cash flows. Under the newparadigm perspective, these shocks have yet to befully absorbed in equity values, so the returns togrowth investing will persist for some time in thefuture.
Table 7 excerpts some of the findings of Chan,Karceski, and Lakonishok (2000). Because the maincontrast concerns the performance of the largest-cap stocks, we provide the results each year for onlythe largest 200 stocks classified as either growth orvalue on the basis of BV/MV. In this study, at theend of June each year, the largest 200 companies (byequity market value) were selected and ranked byBV/MV. Moving from the lowest ranked to thehighest ranked, stocks were classified as large-capgrowth until 50 percent of the ranked stocks' mar-ket capitalization was reached; the remainder wereclassified as large-cap value. After leaving a win-dow of 18 months, the authors formed value-weighted portfolios from the stocks in each cate-gory. At the beginning of a calendar year, eachportfolio's ratio of price to operating income beforedepreciation (F/I) was measured.^ Growth in oper-ating income before depreciation was also mea-sured for the stocks in a portfolio relative to thesame companies' operating income before depreci-ation from the prior year.^
Panel A of Table 7 highlights the rapid ascentin P/I for large-cap growth stocks. At the begin-ning of 1999, the P/I multiple for this style classstood at 17.60, an unprecedented level relative toits 1970-98 average value of 7.42. Large-cap valuestocks were also fetching a relatively high multiplein 1999, but the break from the multiple's historicalaverage was much less eye-catching. The overallwidening of the P/I multiple for growth stocksrelative to the P/I multiple for value stocks wasexacerbated in the remainder of 1999 and the firstquarter of 2000.
To justify the record-shattering level of themultiple for large-cap growth stocks within a ratio-nal pricing framework, a dramatic rise had to haveoccurred in these companies' operating perfor-mance. But Panel B of Table 7 shows that growth inoperating income before depreciation reflected nodramatic differences between large-cap growth andvalue stocks for 1996-1998. (Conversely, small- andmid-cap value stocks fell out of favor with inves-tors, even though their recent operating perfor-mance had not been poor.) Hence, Chan, Karceski,and Lakonishok (2000) argued that the rich pricingof these stocks did not reflect their fundamentalsbut, rather, reflected investors' rosy expectations offuture growth and of the companies' ability to
January/February 2004 79

Financial Analysts Journal
Table 6. Annual Returns for
Year
1979
1980
1981
1982
1983
1984
1985
1986
1987
1988
1989
1990
1991
1992
1993
1994
1995
1996
1997
1998
1999
2000
2001
2002
Geometric mean1996-99
Geometric mean1979-02
Standard deviation1979-02
Geometric mean1986-02
Standard deviation1986-02
Percentage of yearsvalue exceededglamour
NA = not available.
Russell 3000
Growth
26,20%
40,74
-11,09
20,51
16,29
-2,75
32,69
14,25
3,92
12,00
34,68
-1,31
41,66
5,22
3,69
2,20
36,57
21,88
28,74
35,02
33,82
-22,42
-19,63
-28,04
29,76
11,57
20,71
9,73
21,83
Value
21,85%
24,52
2,49
20,83
29,24
9,28
31,48
18,78
-0,13
23,63
24,22
-8,85
25,41
14,90
18,65
-1,95
37,03
21,60
34,83
13,50
6,64
8,02
-4,33
-15,18
18,69
13,99
14,05
11,78
15,04
54
Value and Growth Indexes, 1979-2002Russell Top 200
Growth
NA
NA
NA
NA
NA
NA
NA
13,99%
6,45
10,88
37,68
1,37
39,41
3,89
-0,07
4,85
38,65
25,57
33,73
45,09
29,68
-24,51
-20,50
-27,98
33,32
10,42
23,15
Value
NA
NA
NA
NA
NA
NA
NA
21,44%
2,20
22,02
26,66
-3,67
18,16
9,07
19,76
-1,90
40,03
22,31
35,47
21,24
10,94
2,31
-8,80
-18,02
22,18
11,82
15,79
53
Russell Mid-Cap
Growth
NA
NA
NA
NA
NA
NA
NA
17,55%
2,76
12,92
31,48
-5,13
47,03
8,71
11,19
-2,17
33,98
17,48
22,54
17,86
51,29
-11,75
-20,16
-27,41
26,58
10,19
21,77
Value
NA
NA
NA
NA
NA
NA
NA
17,87%
-2,19
24,61
22,70
-16,09
37,92
21,68
15,62
-2,13
34,93
20,26
34,37
5,08
-0,11
19,19
2,33
-9,65
14,12
12,21
16,10
65
Russell 1000
Growth
23,91%
39,57
-11,31
20,46
15,98
-0,95
32,85
15,36
5,31
11,27
35,92
-0,26
41,16
5,00
2,90
2,66
37,19
23,12
30,49
38,71
33,16
-22,43
-20,42
-27,89
31,25
11,84
20,84
10,18
22,27
Value
20,55%
24,41
1,26
20,04
28,29
10,10
31,51
19,98
0,50
23,16
25,19
-8,08
24,61
13,81
18,12
-1,99
38,35
21,63
35,18
15,62
7,35
7,02
-5,59
-15,52
19,52
13,93
14,16
11,90
15,27
50
Note: Returns for the Russell Top 200 and Russell Mid-Cap Growth and Value Indexes begin in 1986,
Russell 2000
Growth
50,83%
52,26
-9,24
20,98
20,13
-15,83
30,97
3,58
-10,48
20,37
20,17
-17,41
51,19
7.77
13,36
-2,43
31,04
11,26
12,95
1,23
43,10
-22,44
-9,24
-30,26
16,16
8,94
23,83
5,12
22,13
Value
35,38%
25,39
14,85
28,52
38,64
2,27
31,01
7,41
-7,11
29,47
12,43
-21,77
41,70
29,14
23,84
-1,55
25,75
21,37
31,78
-6,45
-1,49
22,82
14,02
-11,43
10,18
14,74
17,40
10,92
18,01
67
S&P 50(1Index
18,44%
32,42
^,91
21,41
22,51
6,27
32,16
18,47
5,23
16,81
31,49
-3,17
30,55
7,67
9,99
1,31
37,43
23,07
33,36
28,58
21,04
-9,11
-11,88
-22,10
26,42
13,25
16,42
11,50
17,59
sustain growth,^ These expectations are at oddswith the increasing competitiveness of world mar-kets and the extreme difficulty of maintaining mar-ket position in the rapidly changing modernenvironment.
Returns in the years subsequent to the periodanalyzed by Chan, Karceski, and Lakonishok(2000) have tended to bear out their argument.Table 6 indicates that the Russell Top 200 growthindex, for example, fell by 24.51 percent in 2000 andby 20.50 percent in 2001. The Russell 2000 ValueIndex, in contrast, rose by 22.82 percent and 14.02percent in those years. As also shown in Table 6,
when the record is updated, the historical resultsare still favorable for value investing. From theinception of the broad Russell indexes in 1979 to theend of 2002, value outperformed growth. The mar-gin of performance was wider for the small compa-nies: Returns for the Russell 2000 Value andGrowth Indexes were 14.74 percent and 8.94 per-cent, respectively. In the case of the larger compa-nies in the Russell 1000, however, the advantage tovalue stocks was not especially striking. The geo-metric mean return for 1979 to 2002 was 13.93 per-cent for the value stocks in the Russell 1000,compared with 11,84 percent for the Russell 1000
80 ©2004, AIMR®

Value and Growth Investing
Table 7. Price-to-income Multiples (atBeginning of Year) and ProfitabilityGrowth (during Year) for Large-CapGrowth and Value Portfolios
Year Large-Cap Growth
A. Price-to-income ratio
1996
1997
1998
1999
1970-98
1970-79
1980-89
1990-98
1994-98
1996-98
B. Portfolio
1996
1997
1998
1970-98
1970-79
1980-89
1990-98
1994-98
1996-98
8.42
10.60
12.67
17.60
7.42
8.82
5.26
8.27
9.01
10.56
income growth rate
5.5%
13.9
9.710.6
14.0
8.49.3
11.6
9.6
Large-Cap Value
4.57
4.89
6.06
7.27
3.51
3.31
2.83
4.47
4.88
5.17
11.1%
14.2
3.97.1
10.5
5.15.5
10.9
9.6
Note: The sample included all NYSE, Amex, and Nasdaq domes-tic companies.
Source: Results are from Chan, Karceski, and Lakonishok (2000).
growth stocks. Nonetheless, the value indexes havelower standard deviations than the growth bench-marks, so they should be appealing on this accountas well as because of returns.
One caveat about the Russell benchmarks usedin Table 6 bears mention. The indexes do not rep-resent extreme bets on growth or value comparedwith, say, the extreme decile portfolios in sorts byBV/MV. Moreover, the underlying stocks arevalue weighted in the index and rely on just twoindicators of value-growth orientation, namely,BV/MV and analysts' long-term growth forecasts.No reason exists, however, not to use more com-prehensive measures of value orientation to diver-sify across signals of expected return. The resultsfrom such an exercise are reported in Table 8.
In the study reported in Table 8, portfolioswere formed every calendar year-end by sortingstocks on a composite indicator and placing themin 1 of 10 deciles. The composite indicator pooledinformation from several valuation measures in aneffort to improve identification of stocks that wereundervalued relative to their fundamentals. In par-
ticular, using robust regression methods, we esti-mated cross-sectional models that predicted futureyearly retums from beginning-year values of theBV/MV, CF/P, E/P, and the sales-to-price ratio(S/P). In these predictive models, we assum^ed adelay of four months from a company's fiscal year-end to the date when its financial informationbecame publicly known. The estimated slope co-efficients determined the weights to be applied toeach fundamental variable to arrive at the overallindicator.
In Panel A of Table 8, the investable universeis large-cap stocks, namely, stocks ranked in the topsix deciles of market cap based on NYSE break-points. In Panel B, small-cap stocks (in the sixththrough ninth deciles of market cap based on NYSEbreakpoints) make up the universe. Buy-and-holdretums over the first year following portfolio for-mation are reported for the bottom two deciles (theglamour portfolios) and for the top two deciles (thevalue portfolios).
From 1979 (when returns on the Russell 1000Value Index become available) through 2001, thegeometric mean return on the "deep value" portfo-lio (Decile 10) for large-cap stocks exceeded thereturn on the Russell 1000 Value Index over thesame period by 5 pps (see Panel A2). So, the use ofmultiple measures in the composite indicatorboosted the performance of the value strategy. Sim-ilarly, when applied to the small-cap universe forthe same period (Panel B2), the strategy yielded abetter return, on average, for the deep value port-folio (22.8 percent) than for the Russell 2000 Valuebenchmark (16.0 percent).
The last column of each panel in Table 8 showsthe spreads between returns averaged for the toptwo deciles and returns averaged for the bottomtwo deciles for the year or group of years. Notefrom Part 2 of Panel A that for the full 1969-2001period, the return differential averaged 10.4 ppsin favor of value investing for the large-cap uni-verse. The Part 1 data show that the value-growthspread was positive in 23 of 33 years, or 70 percentof the time.
Echoing the results in Table 3, Panel B2 of Table8 indicates that the gap between value and growth(last column), with a return spread of 18.8 pps forthe 1979-2001 period, was even more pronouncedfor small-cap stocks. And according to the last col-umn of Panel Al, value investing earned a positivereturn spread over growth 76 percent of the time(in 25 out of 33 years).
For the most recent years, we found that thelarge-cap value portfolio fell behind the growthportfolio in 1998 and 1999 but that the averagespread in favor of value for the entire decade of the
January/February 2004 81

Financial Analysts Journal
Table 8. Yearly and Geometric Mean Returns to Value and Growth Strategies with RefinedDefinitions, 1969-2001
A. Large-cap stocks
Year
1. By year
1969
1970
1971
1972
1973
1974
1975
1976
1977
1978
1979
1980
1981
1982
1983
1984
1985
1986
1987
1988
1989
1990
1991
1992
1993
1994
1995
1996
1997
1998
1999
2000
2001
1 (glamour)
-1.5%
-16.6
37.2
23.8
-32.2
-42.1
19.3
6.9
-2.4
11.6
41.7
68.3
-16.3
9.2
16.3
-22.5
22.8
12.6
-5.4
6.9
32.6
-5.7
62.0
-8.0
16.6
-13.6
29.8
12.0
0.3
19.7
62.3
-34.9
-40.0
2. By group of years
1969-2001
1979-2001
1990-2001
4.5%
7.9
3.8
Portfolio
2
-8.3%
-15.7
28.4
11.6
-26.2
-38.6
38.5
21.0
-4.7
7.9
28.9
48.3
-8.0
14.7
16.7
-5.1
35.9
8.6
5.4
9.4
27.3
-8.7
34.4
3.2
12.9
-0.1
21.7
14.5
19.8
12.8
24.7
-18.6
-26.1
6.7%
10.4
6.0
9
-21.0%
9.5
14.8
11.3
-10.2
-18.6
62.9
50.1
6.2
12.7
34.2
16.8
10.0
24.8
31.5
11.9
35.5
21.9
1.2
33.2
19.1
-15.6
47.5
24.0
12.6
-0.7
40.5
22.4
33.1
6.2
7.5
14.4
16.8
15.6%
18.6
16.1
10 (value)
-21.6%
2.2
12.0
10.8
-21.2
-14.3
61.2
54.7
7.2
16.8
30.7
22.9
14.1
29.8
39.0
15.5
38.3
21.6
-3.1
32.7
19.5
-21.8
55.9
26.1
20.3
3.1
39.0
21.5
34.4
-2.0
12.3
21.6
26.2
16.4%
20.4
18.0
Russell 1000Value Retum
NA
NA
NA
NA
NA
NA
NA
NA
NA
NA
20.6%
24.4
1.3
20.0
28.3
10.1
31.5
20.0
0.5
23.2
25.2
-8.1
24.6
13.8
18.1
-2.0
38.4
21.6
35.2
15.6
7.4
7.0
-5.6
NA
15.4%
12.9
S&P 500Return
-8.5%
4.0
14.3
19.0
-14.7
-26.5
37.2
23.8
-7.2
6.6
18.4
32.4
^ . 9
21.4
22.5
6.3
32.2
18.5
5.2
16.8
31.5
-3.2
30.6
7.7
10.0
1.3
37.4
23.1
33.4
28.6
21.0
-9.1
-11.9
11.4%
15.1
12.9
(Deciles 9,10)- (Deciles 1,2)
-16.4pps
22.0
-19.4
-6.7
13.5
23.9
33.1
38.5
10.2
5.0
-2.8
-38.5
24.2
21.7
18.7
27.4
7.6
11.2
-1.0
24.8
-10.7
-11.5
3.5
27.5
1.7
8.0
14.0
8.7
23.7
-14.1
-33.6
44.7
54.5
10.4 pps
10.4
12.2
82 ©2004, AIMR®

Value and Growth Investing
Table 8. Yearly andDefinitions
B. Small-cap stocks
1. By year
1969
1970
1971
1972
1973
1974
1975
1976
1977
1978
1979
1980
1981
1982
1983
1984
1985
1986
1987
1988
1989
1990
1991
1992
1993
1994
1995
1996
1997
1998
1999
2000
2001
1 (glamour)
-30,2%
-35,9
29,0
13,5
-35,1
^ 2 , 5
46,4
28,0
9,0
18,3
56,1
65,3
-38,5
5,3
3,4
-30,0
23,2
-0,9
-18,7
-5,2
26,3
-24,0
51,0
-21,3
-5,9
-35,2
27,8
-7,5
-11,7
-6,5
52,8
-38,9
-7,8
2, By group of years
1969-2001
1979-2001
1990-2001
-2,8%
-1,8
-6,2
Geometric 1,1969-2001
Mean Returns(continued)
Portfolio
2
-13,8%
-24,3
18,9
-0,4
^ 0 , 1
-39,1
50,6
41,8
13,6
21,7
59,8
57,6
-16,8
13,2
16,2
-19,7
29,6
7,0
-10,3
13,3
19,3
-14,6
38,8
-2,2
10,0
-11,3
35,4
13,9
3,6
1,2
26,2
-23,8
-13,5
4,8%
7,8
3,6
9
-20,5%
-2,4
14,1
12,7
-30,0
-19,3
69,8
54,9
17,0
19,2
28,0
23,2
20,0
33,5
41,3
15,0
41,0
13,7
-6,1
39,2
17,5
-19,3
48,4
28,0
18,5
2,8
32,9
29,3
40,1
-0,7
14,3
5,7
40,9
16,6%
20,8
18,4
to Value and
10 (value)
-25,0%
10,1
15,9
6,5
-25,8
-11,6
62,1
49,9
18,4
19,8
32,6
28,6
25,7
44,7
52,3
19,3
41,0
24,7
4,0
37,2
12,8
-22,0
46,0
29,4
18,3
4,0
32,0
28,6
39,3
-2,4
6,4
12,5
41,3
18,3%
22,8
17,7
Growth Strategies with Refined
Russell 2000 Russell 2000 (Deciles 9,10)Value Return
NA
NA
NA
NA
NA
NA
NA
NA
NA
NA
35,4%
25,4
14,9
28,5
38,6
2,3
31,0
7,4
-7,1
29,5
12,4
-21,8
41,7
29,1
23,8
-1,6
25,8
21,4
31,8
-6,5
-1,5
22,8
14,0
NA
16,0%
13,4
Return
NA
NA
NA
NA
NA
NA
NA
NA
NA
NA
43,1%
38,6
2,0
24,9
29,1
-7,3
31,1
5,7
-8,8
24,9
16,2
-19,5
46,1
18,4
18,9
-1,8
28,4
16,5
22,4
-2,5
21,3
-3,0
2,5
NA
13,8°/<
11,0
- (Deciles 1,2)
-0,7 pps
33,9
-8,9
3,1
9.7
25,3
17,4
17,5
6,4
-0,5
-27,7
-35,5
50,5
29,9
37,0
42,0
14,6
16,1
13,5
34,1
-7.7
-1,4
2,3
40,4
16,3
26,7
0,9
25,7
43,7
1,1
-29,1
40,5
51,7
16,5 pps
18,8
19,4
NA = not available.
January/February 2004 83

Financial Analysts ]ournal
1990s was still substantial. As the last cells in PanelsA2 and B2 in Table 8 show, from 1990 through 2001,the difference amounted to 12.2 pps for large-capstocks and 19,4 pps for small-cap stocks.
Composite Strategy in International Arena.The strong and growing interest in internationalinvesting prompts the question whether a compos-ite value strategy like that described in the preced-ing section (in which value and growth weredefined by BV/MV, CF/P, E/P, and S/P) can alsobe successfully applied to non-U.S. markets. To usean investable universe that corresponds to oneavailable to most U,S, institutional investors, weconsidered the largest-cap stocks in the MSCIEAFE (Europe/Australasia/Far East) Index ofdeveloped non-U,S, countries,^ The strategy wasbased on the same composite fundamental indica-tor that we used for the U.S. market. To ensure thatthe results were not clouded by differences amongcountries' accounting conventions, we assignedeach stock a rank by comparing it with other stocksfrom the same country. At the begirming of eachcalendar year, we sorted stocks in a country by theirranks and placed each in 1 of 10 equally weighteddecile portfolios.̂ *^ We calculated buy-and-holdreturns in local currency terms for the portfolios forthe year following portfolio formation. We thenaggregated returns across countries based on theEAFE country weights. Our procedure conforms tothe methodology used for the widely followedMSCI index returns.
The results for our strategy are reported inTable 9, together with returns for the MSCI EAFEFree Index. Over the 1989-2001 period, the portfo-lio ranked highest by the composite value indicator
earned a geometric mean return of 12.3 percent,compared with a return of 4.5 percent for the EAFEFree Index. In parallel with the U.S, experience,value stocks were far outstripped by growth stocksin 1998 and 1999, but with the exception of thosetwo years, the spread in average returns betweenthe two highest-ranked value portfolios and thetwo lowest-ranked growth portfolios was positive.The spread between value and growth averaged13,5 pps a year for the overall period. In short, valueinvesting appears to be alive and well in U.S, andnon-U.S. markets.
ConclusionA large body of empirical research indicates thatvalue stocks, on average, earn higher returns thangrowth stocks. The reward to value investing ismore pronounced for small-cap stocks, but it isalso present in large-cap stocks. The value pre-mium exists also in equity markets outside theUnited States.
The bulk of the empirical research document-ing the superiority of value investing stops short ofthe late 1990s, which were not kind to value stocks.Growth stocks rocketed in value in those years, butcareful examination suggests that the differences inperformance between value and growth in the late1990s were not grounded in fundamental patternsof profitability growth. The most plausible interpre-tation of the events of the late 1990s is that investorsentiment reached exaggerated levels of optimismabout the prospects for technology, media, and tele-communications stocks. The resulting valuationsare hard to reconcile with economic logic.
Table!
Year
1989
1990
1991
1992
1993
1994
1995
1996
1997
1998
1999
2000
2001
Period
84
3. Yearly and Geometric Mean Returns to Value and Growth Strategies with Refined Definitionsin EAFE Markets, 1989-2001
1 (glamour)
35,6%
-35,4
-5,5
-18,4
13,7
-4,8
1,5
0,9
-3,3
12,9
84,7
-27,8
^ 9 , 5
mean -4,5
Portfolio
2
33,5%
-33,6
0,6
-15,5
17,5
-1,7
1,1
10,2
-4,5
8,9
46,7
-21,3
-34,2
-2,0
9
48,9%
-24,8
8,2
-A.6
41,5
0,3
1,4
10,3
3,5
6,3
26,9
8,1
0,7
8,2
10 (value)
53,2%
-23,6
15,8
2,0
49,3
3,2
5,8
12,4
3,2
-5,9
26,5
15,8
11,5
12,3
EAFE FreeReturn
21,5%
-29,9
8,6
-6,3
29,3
-2,1
9,6
11,4
13,2
12,4
33,2
-7,3
-16,3
4,5
(Deciles 9,10)- (Deciles 1,2)
16,5 pps
10,3
14,5
15,7
29,8
5,0
2,3
5,87,3
^ , 8
-39,0
36,5
47,9
13,5
©2004, AIMR®

Value and Growth Investing
Th.e sharp rise and decline in recent years oftechnology and other growth-oriented stocks alsocall into question the argument that growth stocksare less risky investments than value stocks. Theevidence from a variety of indicators, includingbeta and return volatility, suggests that value stocksare not riskier than growth stocks. Indeed, using thepopular risk indicator that focuses on performancein down markets, we found that value stocks suf-fered less severely than growth stocks when thestock market or the overall economy did poorly.Under any but a metaphysical definition of risk,therefore, the superior performance of value stockscannot be attributed to their risk exposure. A moreconvincing explanation for the value premium restson characteristics of investor behavior and on theagency costs of delegated investment management.Several studies have provided evidence in supportof extrapolative biases in investor behavior.
The argument that the value premium is anartifact of data snooping poses a tougher challenge.In this respect, however, two features of valueinvesting distinguish it from other possible anoma-lies. Many apparent violations of the efficient mar-
ket hypothesis, such as day-of-the-week patterns instock retums, lack a convincing logical basis. In theabsence of a plausible rationale, a legitimate concernexists that the anomalous pattern is merely a statis-tical fluke that has been uncovered through datamining. The value premium, however, can be tiedto ingrained patterns of investor behavior or theincentives of professional investment managers. Inparticular, in the recent market (as in numerous pastepisodes in financial history), investors extrapo-lated from the past and became excessively excitedabout promising new technologies. They overbidthe prices of apparent "growth" stocks while theprices of value stocks dropped far below their valuebased on fundamentals. Because these behavioraltraits will probably continue to exist in the future,patient investing in value stocks is likely to remaina rewarding long-term investment strategy.
Han Qu and Simon Zhang provided research assistance.We thank Clifford Asness and Jason Karceski for theircomments. Given the unavoidable limits on time andspace, this article is not meant to be an exhaustive reviewof existing research; we apologize in advance to authors ofrelated works who have been overlooked in this discussion.
Notes1. See also Davis (1994), who confirmed the book-to-market
effect in a sample that was less susceptible to biases affect-ing early observations in the Compustat files, which wereused in many studies.
2. Daniel and Titman (1997) investigated the argument thatdifferences in co-movement patterns of value and glamourstocks accounted for their returns. They found that differ-ences in factor loadings did not explain the return premi-ums on value stocks.
3. Two signals were used because, as noted previously, twosignals lower the chance of misclassifying stocks into valueand growth categories: A stock with high cash flow perdollar of share price plus low past growth in sales is likelyto be a value stock with low expected future growth. Incontrast, investors are prone to regard a stock with low cashflow relative to price and high past sales growth as havingrnore favorable future growth prospects.
4. Because stock returns tend to lead the real economy, theperformance of the value and glamour portfolios was rnea-sured in the quarter preceding growth in GNP.
5. See Kahneman and Riepe (1998) and Shleifer for examplesand further elaboration of concepts in behavioral finance.
6. Because operating income before depreciation is less noisythan net income, it provides a robust picture of operatingperforrriance.
10.
Chan, Karceski, and Lakonishok (2000) also providedresults on several performance indicators and used differ-ent methodologies for calculating profitability growth.The possibility exists that future growth in profitability willdiffer radically from past patterns and that its effects havenot shown up yet in the historical record. This argumentrequires very bold assumptions, however, to rationalize thestellar valuations witnessed in 1999 and early 2000. SeeAsness (2000) and Chan, Karceski, and Lakonishok (2000,2003) for further discussion.The breakpoints for the size cutoff varied among countries,but in general, they were calibrated to correspond to ourdefinition from Table 8 of large-cap stocks in the UnitedStates.In the computation of the fundamental indicators, ourassumptions as to the delay between a company's fiscalyear-end and the public release of financial statement infor-mation varied among countries. For the United Kingdom,New Zealand, Canada, and Australia, we assumed a delayof four months; for Holland, the delay was six months, andfor the other countries, the assumed delay was eightmonths. These assumptions were based on extensive datachecks and discussions with money managers in non-U.S.markets.
January/February 2004 85

Financial Analysts Journal
ReferencesAsness, Clifford, 1997, "The Interaction of Value andMomentum Strategies," Financial Analysts Journal, vol, 53, no, 2(March/April):29-36,
, 2000, "Bubble Logic," Working paper, AQR CapitalManagement,
Banz, Rolf W, 1981, "The Relationship between Return andMarket Value of Common Stock," Journal of Financial Economics,vol, 9, no, 1 (March):3-18,
Barberis, Nicholas, and Richard Thaler, 2002, "A Survey ofBehavioral Finance," NBER Working Paper 9222,
Basu, Sanjoy, 1977, "Investment Performance of CommonStocks in Relation to Their Price-Earnings Ratios: A Test of theEfficient Market Hypothesis," Journal of Finance, vol, 32, no, 3gune):663-682, ,
Bhushan, Ravi, 1989, "Firm Characteristics and AnalystFollowing," Journal of Accounting and Economics, vol, 11, nos, 2-3auly):255-274, ,
Campbell, John Y, 2000, "Asset Pricing at the Millennium,"Jourrial of Finance, vol, 55, no, 4 (August):1515-67,
Chan, Louis K,C,, Yasushi Hamao, and Josef Lakonishok, 1991,"Fundamentals and Stock Returns in Japan," Journal of Finance,vol, 46, no, 5 (December): 1739-64,
Chan, Louis K,C,, Narasimhan Jegadeesh, and JosefLakonishok, 1995, "Evaluating the Performance of Value versusGlamour Stocks: The Impact of Selection Bias," Journal ofFinancial Economics, vol, 38, no, 3 (July):269-296,
Chan, Louis K,C,, Jason Karceski, and Josef Lakonishok, 2000,"New Paradigm or Same Old Hype in Equity Investing?"Financial Analysts Journal, vol, 56, no, 4 {July/August):23-36,
, 2003, "The Level and Persistence of Growth Rates,"Journal of Finance, vol, 58, no, 2 {April):643-684,
Chan, Louis K,C,, Josef Lakonishok, and Theodore Sougiannis,2001, "The Stock Market Valuation of Research andDevelopment Expenditures," Journal of Finance, vol, 56, no, 6(December):2431-56,
Daniel, Kent, and Sheridan Titman, 1997, "Evidence on theCharacteristics of Cross Sectional Variation in Stock Returns,"Journal of Finance, vol, 52, no, 1 {March):l-33,
;•, 1999, "Market Efficiency in an Irrational World,"Financial Analysts Journal, vol, 55, no, 6 (November/December):28-40,
Davis,. James L, 1994, "The Cross-Section of Realized StockReturns: The Pre-Compustat Evidence," Journal of Finance, vol, 49,no, 5 (December):1579-93,
Fama, Eugene F, 1998, "Market Efficiency, Long-Term Returns,and Behavioral Finance," Journal of Financial Economics, vol, 49,no, 3 (September):283-306,
Fama, Eugene F,, and Kenneth R, French, 1992, "The Cross-Section of Expected Stock Returns," Journal of Finance, vol, 47,no, 2 Gune):427-465,
, 1996, "Multifactor Explanations of Asset PricingAnomalies," Journal of Finance, vol, 51, no, 1 (March):55-84,
, 1998, "Value versus Growth: The InternationalEvidence," Journal of Finance, vol, 53, no, 6 (December):1975-99,
Ferson, Wayne E,, and Campbell R, Harvey, 1999, "ConditioningVariables and the Cross Section of Stock Returns," Journal ofFinance, vol, 54, no, 4 (August):1325-60,
Hirshleifer, David, 2001, "Investor Psychology and AssetPricing," Journal of Finance, vol, 56, no, 4 (August):1533-97,Jegadeesh, Narasimhan, Joonghyuk Kim, Susan Krische, andCharles M,C, Lee, 2002, "Analyzing the Analysts: When DoRecommendations Add Value?" Working paper. University ofIllinois at Urbana-Champaign,
Kahneman, Daniel, and Mark W, Riepe, 1998, "Aspects ofInvestor Psychology," Journal of Portfolio Management, vol, 24,no, 4 (Summer):52-65,
Kothari, S,P, Jay Shanken, and Richard G, Sloan, 1995, "AnotherLook at the Gross-Section of Expected Stock Returns," Journal ofFinance, vol, 50, no, 1 (March):185-224,
Lakonishok, Josef, Andrei Shleifer, and Robert W, Vishny, 1992,"The Structure and Performance of the Money ManagementIndustry," In Brookings Papers on Economic Activity:Microeconomics. Edited by Martin Neil Baily and GliffordWinston, Washington, DG: Brookings Institution,
, 1994, "Gontrarian Investment, Extrapolation, and Risk,"Journal of Finance, vol, 49, no, 5 (December):1541-78,
La Porta, Rafael, 1996, "Expectations and the Gross-Section ofStock Returns," Journal of Finance, vol, 51, no, 5(December):1715-42,
La Porta, Rafael, Josef Lakonishok, Andrei Shleifer, and RobertVishny, 1997, "Good News for Value Stocks: Further Evidence onMarket Efficiency," Journal of Finance, vol, 52, no, 2 (June):859-874,
Merton, Robert, 1973, "An Intertemporal Gapital Asset PricingModel," Econometrica, vol, 41, no, 5 (September):867-888,
Piotroski, Joseph, 2000, "Value Investing: The Use of HistoricalFinancial Statement Information to Separate Winners fromLosers," Journal of Accounting Research, vol, 38 (Supplement):l^l,
Scott, James, Mark Stumpp, and Peter Xu, 1999, "BehavioralBias, Valuation, and Active Management," Financial AnalystsJournal, vol, 55, no, 4 (July/August):49-57,
Shleifer, Andrei, 2000, Inefficient Markets: An Introduction toBehavioral Finance. New York: Oxford University Press,
Shleifer, Andrei, and Robert W, Vishny, 1997, "The Limits ofArbitrage," Journal of Finance, vol, 52, no, 1 (March):35-55,
86 ©2004, AIMR®