Embed Size (px)
Citation preview

Management Theory and Studies for Rural Business and Infrastructure Development eISSN 2345-0355. 2020. Vol. 42. No. 3: 235-247 Article DOI: https://doi.org/10.15544/mts.2020.23
235
VALUE-ADDED AGRICULTURAL BIO-BUSINESS DEVELOPMENT IN 1 EUROPEAN COUNTRIES 2
3 1Jolita Greblikaitė, 2Judita Astrovienė, 3Deimena Montvydaitė 4
5 1Assoc. prof. Vytautas Magnus University, K. Donelaičio 58, Kaunas, Lithuania, 6
Email address [email protected] 7 2Vytautas Magnus University, K. Donelaičio 58, Kaunas, Lithuania, Email address [email protected] 8
3PhD candidate Vytautas Magnus University, K. Donelaičio 58, Kaunas, Lithuania, 9 Email address [email protected] 10
11 The aim of the paper is to analyse value added agricultural bio-business trends and its development perspectives 12
in Europe. The research includes theoretical insights of value-added bio-business, value-added agriculture bio-business 13 trends and development opportunities, comparing value added statistical tendencies in European countries, exploring the 14 perspectives of agricultural bio-business development. Two billion tons of biomass are made in Europe yearly. In total 15 biomass intake 44% is used for feed, 21% for food, 19% for processing and 12% for energy production (Lovric et. all., 16 2020). The research reveals that gross value added at current prices in European Union has an increasing tendency, ac-17 cording to 2010-2018 data as well as gross value added of the agricultural production at basic prices at the period 2008-18 2019. Most European countries have a potential for value added agricultural bio-business development. Lithuania, Poland, 19 and Netherlands have different political, economic, socio-cultural, and technological environment and its conditions for 20 bio-business development, but they are tending to be positive in terms of value-added agricultural bio-business. 21
Keywords: agriculture, bio-business, gross value added, value added bio-business. 22 JEL codes: Q16, M10. 23
24 Received 28 06 2020; Accepted 01 09 2020 25
26 1. Introduction 27 28 The bioeconomy provides a wide range of public goods, in particular rural and coastal jobs, 29
sustainable future food and energy supplies and conservation of natural environments and biodiver-30 sity, as well as contributing to economic growth while providing investors with a financial return 31 (European Technology Platforms, 2017). Bioeconomy refers to the sustainable production and con-32 version of biomass into a range of food, health, fibre and industrial products and energy. Renewable 33 biomass encompasses any biological material (agriculture, forestry and animal-based including fish) 34 as a product or to be used as raw material. As the world is currently facing abrupt climate changes, 35 land and ecosystem degradation and the scarcity of resources coupled with a growing population 36 (Bikse et al., 2019), Europe must try to ensure a safe, healthy, and prosperous environment for current 37 and future generations. Successfully addressing major environmental, social, and economic chal-38 lenges will change the way we live and work. The bioeconomy will make this a change for the better 39 if its potential for sustainable production and conversion of biological material is fully exploited. 40
The mature, sustainable bioeconomy will help deliver global food security, improve nutrition 41 and health, create smart bio-based products and biofuels, and help agriculture, forestry, aquaculture, 42 and other ecosystems to adapt to climate change. The integrated bioeconomy is not simply about 43 science but is rather an integration of science with business and society (European Technology Plat-44 forms, 2017). The decline in natural resources, population growth, climate change and other global 45 and economical challenges in recent years have encouraged the traditional economy transfer into a 46 bioeconomy. Bioeconomy refers to the sustainable production and conversion of biomass into a range 47 of food, health, fibre and industrial products and energy. 48
49 Copyright © 2020. Published by Vytautas Magnus University. This is an open access article distributed under the terms 50 of the Creative Commons Attribution Non-Commercial 4.0 (CC BY-NC 4.0) license, which permits unrestricted use, 51 distribution, and reproduction in any medium provided the original author and source are credited. The material cannot 52 be used for commercial purposes. 53

Jolita Greblikaitė, Judita Astrovienė, Deimena Montvydaitė Value-Added Agricultural Bio-Business Development in European Countries
236
The integrated bioeconomy is not simply about science but is rather an integration of science 1 with business and society (European Technology Platforms, 2017). According to the OECD, bio-2 based economy by 2055 will be the main driving force of the European economy, with a special focus 3 on agriculture (Lietuvos …santrauka, 2017). Multifunctional, value-added, and biotech-based busi-4 nesses have become increasingly viable, as it can help key sectors of the economy (agriculture, health, 5 etc.) solve the problems of limited resources, environmental concerns and more (Vilmantas, Melni-6 kas, 2014). It is evident that in the international market (USA, EU) further economy growth plans 7 will focus on bio-business (Hassan et al., 2015). 8
Future science and policy programs expect companies to adopt business models, based on the 9 circular economy and providing added-value (Leipold and Petit - Boix, 2018). Industries and business 10 organizations are expected to be pivotal to the development of both the circular economy and the 11 bioeconomy, and to contribute to the Sustainable Development Goals of the UN 2030 Agenda 12 (D’Amato et al., 2020). There was created almost 190 000 million euro of gross value added of the 13 agricultural production in European Union. The biggest amount of gross value added of the agricul-14 tural production in 2019 was created in Italy (31 867 million euro), France (31 027 million euro), 15 Spain (26 465 million euro), Germany (21 060 million euro). Therefore, it is appropriate to further 16 analyse the development of high value-added agricultural bio-business. 17
Purpose: the aim of the paper is to analyse value added agricultural bio-business trends and 18 its development perspectives in European countries. 19
Object: value-added agricultural bio-business. 20 Research methodology. Research is based on scientific works analysis in the value-added ag-21
ricultural bio-business, which provides the importance of macro environment analysis for the condi-22 tions of such kind business development in European countries. The analysis of the strategical trends 23 and tendencies for agricultural bio-business will provide political and legal initiatives in EU countries. 24 Economic data analysis will provide numbers of existing and supportive business for agricultural bio-25 business development. Technological environment analysis provides the technology and scientific 26 potential, technical based conditions for bio-business in the countries. Sociocultural environment of 27 the countries provides important insights about society and its social climate for bio-business creation 28 and bio-products consumption. 29
The PEST analysis is made for such countries as Lithuania, Poland, and Netherlands. These 30 countries for analysis are selected because is presumed that those countries are different in develop-31 ment level in bio-business, especially agricultural bio-business. The comparative analysis does not 32 seek necessary to rank countries due to all criteria. The aim is to provide the status quo and the exist-33 ing conditions for value-added agricultural bio-business development and present potential trends for 34 improvement. Methods of research are scientific literature analysis in-depth, macro environment anal-35 ysis (PEST), document analysis, statistical data analysis, comparative analysis. 36
37 2. Theoretical background and insights 38
39 Bio-business and its problems are widely discussed in scientific literature. However, there is 40
no well-established definition of bio-business phenomenon. It is treated differently by different au-41 thors. Theoretical works, research and even legislation in different countries name the bio-business 42 differently and analyse it from the different angles: research of the bioeconomy (Arujanan and 43 Singaram, 2018; Bikse at al., 2019; D’Amato et al., 2020), biotechnology (Gunn, 2016; Timmis et 44 al., 2017; Hayward et al., 2017; Arujanan and Singaram, 2018; Sabrewal, 2018 et al.), biotechnology 45 business models (Niosi and McKelvey, 2018; Tyagi et al., 2018; Horvath, 2019 et al.) and other in-46 sights. 47
According to Gunn (2016), bio-entrepreneurship is entrepreneurship principles applied to the 48 business value propositions of the biotechnology industry. Bio-business is inseparable from the tech-49 nology and processes underlying it. In this work, bio-business is understood as a business involving 50
Jolita Greblikaitė, Judita Astrovienė, Deimena Montvydaitė Value-Added Agricultural Bio-Business Development in European Countries
237
the use of biological processes in the energy, forest, agricultural or chemical industries and trans-1 forming natural resources into goods or services. It is important to mention that to maximize added 2 value, bio business’s material for semi-finished products or final products needs to be treat as much 3 as possible. 4
All bio-businesses can be perceived as certain processes consisting of five main stages that 5 are research, development, testing/registration, production, and marketing (Kiskis and Limba, 2016). 6 Biotechnology-based business is often divided into the following branches due to its interdiscipli-7 narity (Kafarski, 2012): 8
9 - Green (agriculture): GMO development and others. 10 - Blue (marine organisms): application of molecular and biological processes in underwater 11
technology. 12 - Red (health care): use of proteins, enzymes, living organisms and other substances to treat 13
diseases, gene testing, etc. 14 - White (industrial and environmental): use of enzymes and micro-organisms in chemicals, tex-15
tiles, etc. 16 - Purple (intellectual property): patents, scientific publications, inventions. 17 - Yellow (food and supplements). 18 - Gold (nanotechnology, bioinformatics, genetic engineering). 19 - Brown (arid and desert organisms). 20 - Gray (classical fermentation). 21 - Black (bioterrorism and biological weapons). 22
23 It can be concluded that bio-business is differently treated phenomenon in scientific literature. 24 It depends on the research area. Despite the complexity of definition, it can be summed up 25
that bio-business relates to natural resources and can be perceived as certain processes consisting of 26 main stages: research, development, testing/registration, production, and marketing. This article fo-27 cuses on green or agricultural bio-business and its development in European countries. 28
The notion that perpetual economic growth of traditional business sectors is possible and sus-29 tainable is unrealistic. The central task is thus to focus strategic economic development investment in 30 new business growth sectors that most effectively and sustainably inter alia increase productivity, 31 streamline consumption and scale down waste, in order to create a healthy economic growth trajectory 32 within the global context (Timmis et al., 2017). The development of bio-businesses makes a signifi-33 cant contribution to the international economy and creates added value. The global biotech market 34 has been growing in recent years, reaching around $ 250 billion USD in 2019, it can be assumed that 35 growth will continue (Bumelis, 2018). 36
Analysing bio-business trends internationally, it could be seen that there are three largest bi-37 otech markets in the world: the US (45.5%), Europe (28.8%) and Asia (24%). But not only markets, 38 also individual countries are seen in the international context. The strongest countries dedicate at least 39 2% of GDP to R&D, provide business support and develop innovation-friendly policies (Biotechnol-40 ogy ... country, 2019). The red and green branches are the most promising for development in the 41 international market. The leading fields of the development of biotechnology is agricultural (plant 42 research, food, and feed) and medical bio-businesses. 43
EU bioeconomy is expected to develop rural and regional bio-businesses. Although rich in 44 biomass, rural areas are characterized by lower levels of entrepreneurship. It is feared that urban areas 45 with higher potential for innovation will produce higher value-added products, while rural and re-46 gional areas will only supply biomass (Tetslaff and Clifford, 2019). Companies of all sizes participate 47 in the bioeconomy, and entrepreneurship structures are different at the various scales. 48
Although continuous knowledge development is still crucial to successful innovation for all 49 companies, novel cooperation models are needed to allow different business models to be used col-50 laboratively to boost the development of the bioeconomy (European Technology Platforms, 2017). 51 Focusing on agriculture bio-business, the experience of other countries shows that it is useful to 52

Jolita Greblikaitė, Judita Astrovienė, Deimena Montvydaitė Value-Added Agricultural Bio-Business Development in European Countries
238
switch from traditional agriculture to multifunctional and high value added (e.g. cultivating, several 1 times processing and selling online) (Negoro, 2018). Businesses will have to undergo significant 2 change if they are to compete successfully in the future bioeconomy against new companies being 3 formed in the sector today. Such transformations can be uncomfortable and carry a higher risk in the 4 short term. However, unless they move from their comfort zone, they risk becoming uncompetitive 5 as the bioeconomy develops around them (European Technology Platforms, 2017). High added agri-6 cultural bio-businesses could target biodiversity, pollution control, nature and landscape conserva-7 tion, and development of bio-business in less-favoured areas. 8
9 3. Research results 10 11 Analysing value-added agriculture bio-business development, it is important to look over farm 12
structure trends, to estimate whether European countries including agriculture sector into bioeconomy 13 strategies, to evaluate total gross value-added trends in Europe and gross value added of the agricul-14 tural production and to foresee the perspectives of its further development. 15
There is a change in the consumption of farm products in the international context – growing 16 need for multifunctional, sustainability and high added value. The European Union, Japan, Korea, 17 Norway, Portugal and Switzerland declare that agriculture not only has to produce agricultural com-18 modities, foodstuffs, but also to develop new innovative technologies, as well as to create higher 19 added value, simultaneously produce multifunctional raw materials and products (Lainez at al., 2018). 20 The following changes in the structure of the farm are forecasted in Table 1. 21
22 Table 1. Structure of the farm (adapted according Lainez at al., 2018) 23
24 Specification 2020, thousand 2030, thousand
<1 ha 1468,5 1258, 5 1-5 ha 787 591,5 5-20 ha 523 447,5 20-50ha 120 146,2
50-100 ha 29 56 100-300 ha 8,8 16,2 300-500 ha 0,4 0,6
500 – 1000ha 0,2 0,3 >1000 ha 0,1 0,2
Average farm area 9,2 ha 10,7 ha 25 As can be seen in Table 1, there is a tendency that the number of very small farms (up to 1 ha) 26
will decrease significantly. The average area of the farm is growing. This means that larger areas are 27 open to more activities. Although the total number of farms will decrease, the area occupied by farms 28 will increase. It can be assumed that there is a possibility for farms to connect and transform into 29 multifunctional farms. Whereas the value added is analysed in the context of bioeconomy, it is 30 important to estimate what sectors includes into bioeconomy strategy in European Union, ephasizing 31 agriculture sector (Table 2). 32
33 34 35 36 37
Jolita Greblikaitė, Judita Astrovienė, Deimena Montvydaitė Value-Added Agricultural Bio-Business Development in European Countries
239
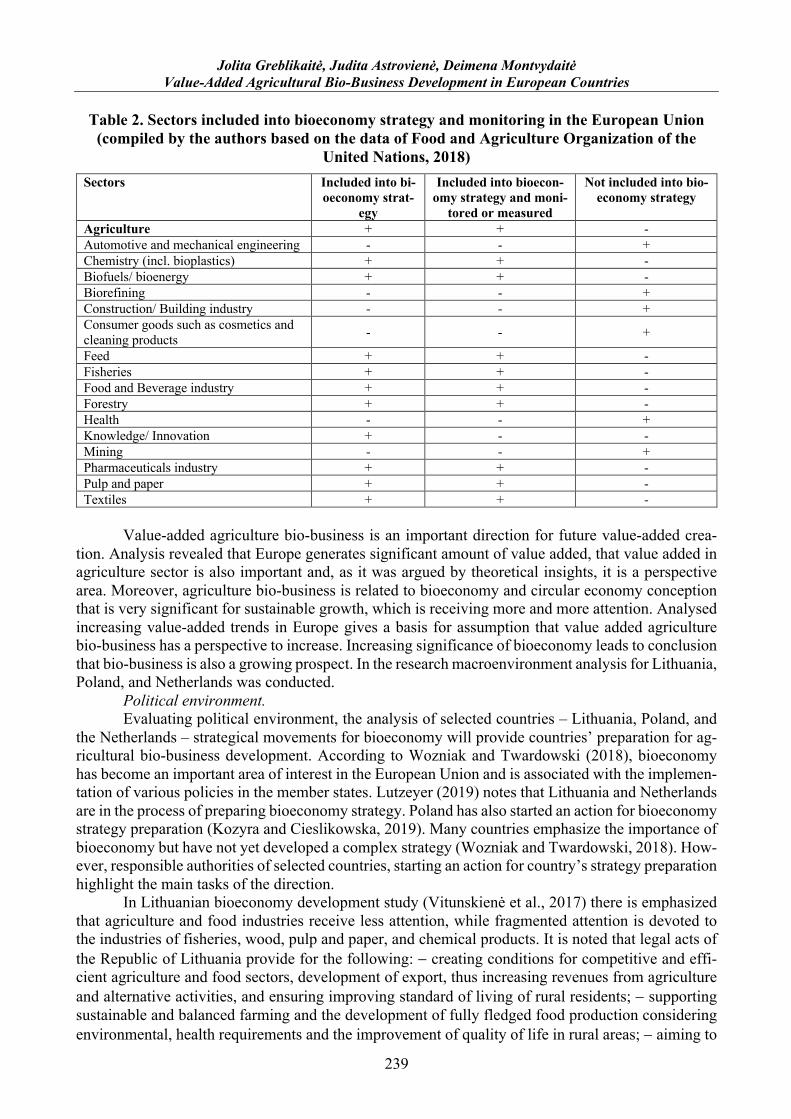
Table 2. Sectors included into bioeconomy strategy and monitoring in the European Union 1 (compiled by the authors based on the data of Food and Agriculture Organization of the 2
United Nations, 2018) 3 Sectors Included into bi-
oeconomy strat-egy
Included into bioecon-omy strategy and moni-
tored or measured
Not included into bio-economy strategy
Agriculture + + - Automotive and mechanical engineering - - + Chemistry (incl. bioplastics) + + - Biofuels/ bioenergy + + - Biorefining - - + Construction/ Building industry - - + Consumer goods such as cosmetics and cleaning products - - +
Feed + + - Fisheries + + - Food and Beverage industry + + - Forestry + + - Health - - + Knowledge/ Innovation + - - Mining - - + Pharmaceuticals industry + + - Pulp and paper + + - Textiles + + -
4 Value-added agriculture bio-business is an important direction for future value-added crea-5
tion. Analysis revealed that Europe generates significant amount of value added, that value added in 6 agriculture sector is also important and, as it was argued by theoretical insights, it is a perspective 7 area. Moreover, agriculture bio-business is related to bioeconomy and circular economy conception 8 that is very significant for sustainable growth, which is receiving more and more attention. Analysed 9 increasing value-added trends in Europe gives a basis for assumption that value added agriculture 10 bio-business has a perspective to increase. Increasing significance of bioeconomy leads to conclusion 11 that bio-business is also a growing prospect. In the research macroenvironment analysis for Lithuania, 12 Poland, and Netherlands was conducted. 13
Political environment. 14 Evaluating political environment, the analysis of selected countries – Lithuania, Poland, and 15
the Netherlands – strategical movements for bioeconomy will provide countries’ preparation for ag-16 ricultural bio-business development. According to Wozniak and Twardowski (2018), bioeconomy 17 has become an important area of interest in the European Union and is associated with the implemen-18 tation of various policies in the member states. Lutzeyer (2019) notes that Lithuania and Netherlands 19 are in the process of preparing bioeconomy strategy. Poland has also started an action for bioeconomy 20 strategy preparation (Kozyra and Cieslikowska, 2019). Many countries emphasize the importance of 21 bioeconomy but have not yet developed a complex strategy (Wozniak and Twardowski, 2018). How-22 ever, responsible authorities of selected countries, starting an action for country’s strategy preparation 23 highlight the main tasks of the direction. 24
In Lithuanian bioeconomy development study (Vitunskienė et al., 2017) there is emphasized 25 that agriculture and food industries receive less attention, while fragmented attention is devoted to 26 the industries of fisheries, wood, pulp and paper, and chemical products. It is noted that legal acts of 27 the Republic of Lithuania provide for the following: - creating conditions for competitive and effi-28 cient agriculture and food sectors, development of export, thus increasing revenues from agriculture 29 and alternative activities, and ensuring improving standard of living of rural residents; - supporting 30 sustainable and balanced farming and the development of fully fledged food production considering 31 environmental, health requirements and the improvement of quality of life in rural areas; - aiming to 32
Jolita Greblikaitė, Judita Astrovienė, Deimena Montvydaitė Value-Added Agricultural Bio-Business Development in European Countries
240
preserve soil fertility, promoting the implementation of sustainable agricultural practice by imple-1 menting advanced agricultural systems; - complying with strict policy of giving up (prohibiting) the 2 use of genetically modified organisms in Lithuania; - taking active and ambitious measures to reduce 3 food waste, help municipalities arrange food waste collection system and install measures allowing 4 reducing the generation of food waste. The authors of Lithuanian bioeconomy development study 5 (Vitunskienė et al., 2017) summarize that the development of bioeconomy in Lithuania can be stated 6 to be mainly regulated and promoted via certain sectoral policies to this day, including policies of 7 agriculture, forestry, fisheries, energy, environment (including waste management), development of 8 research, innovation and biotechnology, etc. 9
In Poland, according to Wozniak and Twardowski (2018), there is no single, complex, and 10 strategic document dedicated to bioeconomy. Country has strategic plans for separate areas like cli-11 mate change, biotechnology, bioenergy et al. However, there are three sectors of the economy which 12 play an important role and are incorporated to the national bioeconomy strategy, namely agriculture, 13 agro-food processing industry and forestry. Wozniak and Twardowski (2018) note that issues related 14 to the development of bioeconomy are incorporated in three integrated strategies, which are included 15 in the implementation of the Strategy for the Development of the Country, which defines develop-16 mental goals for Poland up to 2020 and focuses on the increase in three areas: competitive and inno-17 vative economy, effective and robust state, and demonstration of the differences in development of 18 the provinces. However, Poland has strategy for sustainable development of rural areas, agriculture 19 and fisheries 2030, adopted by the Council of Ministers on October 15th, 2019, which sets these 20 goals: 21
I. Increasing the cost-effectiveness of agricultural production: – creating new alternative 22 value chains in bio-products production; – increase using renewable biological resources for new 23 products production; – modernization of agriculture by adopting the latest technologies; – promotion 24 of technologies aimed at minimizing consumption of natural resources; – dissemination of circular 25 economy with special concern for using residuals of agriculture and agri-food processing. 26
II. Improving the quality of life, infrastructure, and the environment: – implementing pro-27 environmental methods of agricultural production and the use and management of agricultural by-28 products; – investments for using energy resources available locally; III. Developing entrepreneurship 29 and non-agricultural workplaces: – promotion of the use of local potentials and advantages e.g. re-30 garding bioeconomy. 31
Analyzing policy actions in the Netherlands, Ministry of Economic Affairs and Climate Policy 32 (2018) highlight some main tasks developing the bioeconomy: – circular economy. Embracing the 33 circular economy and working on the ‘biomass and food’ action points in the transition agenda for 34 the circular economy. – biomass. Mobilizing sustainable biomass and ensuring that sustainable bio-35 mass is made more easily available. – innovation. Bridging gaps in innovation, encouraging frontrun-36 ners and types of collaboration that involve both the government and the business sector (public-37 private partnerships). – support. Ensuring greater support for the bioeconomy via effective commu-38 nication and by listening more closely to the wishes of society. – market demand. Developing market 39 demand by encouraging sustainable purchasing and developing business cases. 40
Summarizing the analysis of political direction in selected countries, although none of ana-41 lyzed countries have bioeconomy strategy, it can be assumed that Lithuania has the most favorable 42 political environment for agriculture bio-business development as there in the strategic goals for bi-43 oeconomy development relatively much attention is paid for agricultural activities. 44
The authorities of Poland pay attention to different bioeconomy sectors and problems, e.g. 45 biotechnology, bioenergy, climate change, but there is no focus on agriculture or agricultural bio-46 business development. The Netherlands are more concentrated on business in the context of bioecon-47 omy development. It also highlights the importance of innovation. Concluding, it could be assumed 48 that Lithuania takes the first rank with the most favorable political environment for agricultural bio-49 business development, the Netherlands, that are also focusing on business in the context of 50

Jolita Greblikaitė, Judita Astrovienė, Deimena Montvydaitė Value-Added Agricultural Bio-Business Development in European Countries
241
bioeconomy, are in the second position and Poland takes the third place with non-specific goals for 1 agriculture bio-business. 2
Economic environment. 3 Analysing economic environment of selected countries, economic data analysis will provide 4
countries’ potential for agriculture bio-business development. According to the data by Lithuanian 5 Institute of Agrarian Economics (2019), there were 968 agricultural companies and enterprises. Com-6 pared to 2014, the number increased by 3.2 %. The average size of a farm by the UAA (utilized 7 agricultural area) declared by all agricultural entities in 2018 in Lithuania was 22.7 ha. Table 3 shows 8 detail structure of agricultural holdings by economic size in Lithuania, Poland, and Netherlands in 9 2016. 10 11
Table 3. Structure of agricultural holdings by economic size in Lithuania, Poland, and 12 Netherlands (compiled by the authors based on the European Commission, 2019) 13
Lithuania Poland Netherlands Total Percent Total Percent Total Percent
<4000 EUR 87830 58.4 % 661120 46.9 % 540 1.0 % <8000 EUR 26330 17.5 % 252790 17.9 % 1780 3.2 % Lithuania Poland Netherlands <15000 EUR 16390 10.9 % 184700 13.1 % 3150 5.7 % <25000 EUR 6250 4.2 % 110260 7.8 % 3420 6.1 % <50000 EUR 6130 4.1 % 109160 7.7 % 5060 9.1 % <100000 EUR 3940 2.6 % 58940 4.2 % 5390 9.7 % <250000 EUR 2490 1.7 % 24480 1.7 % 9840 17.7 % <500000 EUR 590 0.4 % 5800 0.4 % 13580 24.4 % =>500000 EUR 390 0.3 % 3450 0.5 % 12920 23.2 % Total 150320 100 % 1410720 100 % 55680 100 % UAA (ha) per holding 19.5 10.2 32.3
14 Table 3 shows the structure of agricultural holdings by economic size in Lithuania, Poland, 15
and Netherlands in 2016. Economic size is considered as the standard output of an agricultural prod-16 uct (crop or livestock), abbreviated as SO, is the average monetary value of the agricultural output at 17 farm-gate price, in euro per hectare or per head of livestock. The sum of all the SO per hectare of 18 crop and per head of livestock in a farm is a measure of its overall economic size, expressed in euro 19 (European Commission, 2019). The data in table reveals different features of agriculture holdings by 20 analyzed countries. Comparing economic size, different trend between Netherlands and two other 21 countries are evident. Lithuania and Poland have the biggest share of small agriculture holdings (less 22 than 4000 euro) with a decreasing percent of higher economic size holdings. While Netherlands has 23 the opposite trend where the best part is taken by the biggest holdings (from around 100000 to more 24 than 500000 euro). In general, Poland has the biggest number of agriculture holdings – almost 1.5 25 million units. Lithuania has around 150 thousand holdings and Netherlands around 56 thousand ag-26 riculture holdings. The table also shows average size of agriculture holdings in analyzed countries. It 27 reveals that Netherlands are likely to develop large holdings, what is 32.3 UAA ha per holding, Lith-28 uania in this case takes the average position with 19.5 UAA per holding and Poland has the smallest 29 holdings with an average of 10.2 UAA per holding. Summing up, evaluating economic environment 30 for agricultural bio-business development in these three countries, according to economic aspects of 31 agriculture holdings, it can be assumed that Netherlands has a favorable economic environment and 32 a potential for developing large holdings and businesses, that can create the biggest amount of output. 33 On the contrary, Poland has good conditions for small holdings and businesses development. Lithu-34 ania takes the average position in this context. However, analysis reveals that it has more favorable 35 environment for small agriculture holdings and businesses development. Accordingly, it could be a 36 direction for all these countries for potential agriculture bio-business development. 37

Jolita Greblikaitė, Judita Astrovienė, Deimena Montvydaitė Value-Added Agricultural Bio-Business Development in European Countries
242
Analysing value-added agriculture bio-business, it is important to evaluate the value added of 1 the agricultural industry. Figure 1 shows the trend of gross value added of the agricultural industry at 2 basic prices in Lithuania, Netherlands and Poland in the period 2008-2019, est. million euro. 3 4
5 6
Figure 1. Gross value added of the agricultural industry at current prices in Lithuania, Neth-7 erlands, and Poland in 2008-2019, million euro (compiled by the authors based on the data of 8
Eurostat, 2020) 9 10
Figure 1, illustrating the gross value added of the agricultural industry at basic prices in Lith-11 uania, Netherlands and Poland reveals that in the period 2008-2019 the Netherlands had the higher 12 gross value added, Poland took the second position, despite the period 2011-2012, when it exceeded 13 the Netherlands, and Lithuania had the lowest gross value added in all analysed period. In general, 14 gross value added of the agricultural industry has a trend of increase in all countries. That lead to 15 assumption that Lithuania must give more attention on developing agricultural sector, while the Neth-16 erlands and Poland take high positions creating value added from agricultural sector. However, a 17 trend of increase leads to conclusion that agricultural bio-business development has a potential in all 18 analysed countries. 19
To evaluate value added agricultural bio-business trends, the trend of land use in Lithuania, 20 Netherlands and Poland are analyzed (Figure 2). 21
22
23 24
Figure 2. Land use in Lithuania, Netherlands, and Poland in 2017, thousand hectares (com-25 piled by the authors based on the data of Food and Agriculture Organization of the United 26
Nations, 2019) 27 28 29
02 0004 0006 0008 000
10 00012 00014 000
2008 2009 2010 2011 2012 2013 2014 2015 2016 2017 2018 2019
Lithuania Netherlands Poland
2935,3 1790
14462
148,8 1201
6722
0
5000
10000
15000
20000
25000
Lithuania Netherlands Poland
Agriculture land Other land
Jolita Greblikaitė, Judita Astrovienė, Deimena Montvydaitė Value-Added Agricultural Bio-Business Development in European Countries
243
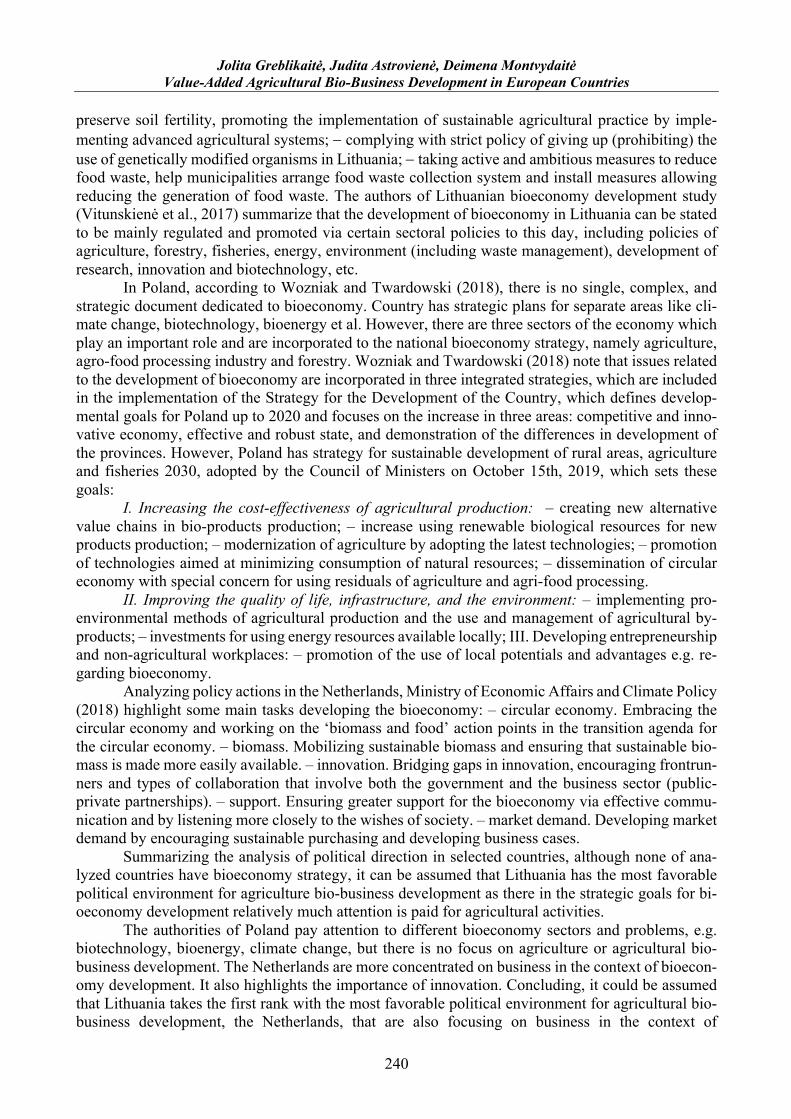
Poland has the most land in general and the most agriculture land, what is logical, based on 1 the biggest area of the country. Lithuania takes the second position, comparing the amount of agri-2 culture land and the Netherlands has the least land in general and the least agriculture land. However, 3 evaluating the share of agriculture land and other land, Lithuania has the biggest part of agriculture 4 land – around 95%, the middle position is taken by Poland – around 68% and the Netherlands are still 5 in the last position with around 60% share of agriculture land. It could be assumed that Lithuania 6 makes the best use of its agricultural development potential. Unfortunately, the value added of the 7 agricultural industry in Lithuania is the lowest. It could be claimed that, according to the analysis of 8 land use, while the Netherlands and Poland still have the potential for agriculture sector development, 9 Lithuania operates at almost full capacity. Maybe in Lithuania there is a need for some strategic de-10 cisions to more boost agriculture and to maximize its created added value (see Table 4). 11 12
Table 4. Political and economic criteria and evaluation 13 Political and economic criteria Lithuania Poland Netherlands
Favorable political environment for bioeconomy (position by rank)
Most positive Least positive Positive
Size per holding 19,5 UAA 10,2 UAA 32,3 UAA Gross value added of agricultural industry (rank position by Euros)
Poor Average Best
Agricultural land 95% 68% 60% 14
Socio-cultural environment 15 Bio-business industry is pushed by consumers - social factors (lifestyle changes and ecological 16
issues) affects business development (Alava et. all., 2018). So, the impact of the social aspect of the 17 agricultural bio-business relays to social changes and social stability (Achinas et. all., 2019). The 18 world's population will grow rapidly and in 2050 will reach 9.7 billion. The increasing demand for 19 food in the world will stimulate the development of the agricultural, aquaculture and processed food 20 production sectors (Ladu et. all., 2020). 21
When assessing the socio-cultural environment, it is necessary to understand such aspects as: 22 different countries' different attitudes towards working overtime, employee temperament, tendency 23 to work finical work, religion, and traditions (Čiužienė et. All., 2016), the ability of farmers to develop 24 their business, media’s opinion about bio-businesses (D’Amato et. all., 2020). Also important is the 25 attitude of both the state and the consumers towards new areas such as genetic modification. Regard-26 ing this question European Union lined directives, in which states that mutagenic crops and genetic 27 modification organisms should be subject to the EU’s regulatory system (Lassoued et. all., 2020). 28 Social situation in the farming sector earn suitable consideration, so assessing specific socio - cultural 29 aspects, it was observed that: 30
- The best GMO control is in Portugal, Spain, Germany, France, The Netherlands, Poland, 31 and Slovakia (Rostoks et. al., 2019); 32
- Bulgaria, Croatia, Czech Republic, Estonia, Hungary, Lithuania, Poland, Netherlands, 33 and United Kingdom are in process by 2030 to grow a bioeconomy strategy involved var-34 ious bioeconomy initiatives (A sustainable … environment, 2018). 35
Bellow provided main socio-cultural criteria and their evaluation for agricultural bio-business 36 development in Lithuania, Poland, and Netherlands. 37
38 39 40 41 42 43 44

Jolita Greblikaitė, Judita Astrovienė, Deimena Montvydaitė Value-Added Agricultural Bio-Business Development in European Countries
244
Table 5. Socio -cultural criteria and their evaluation (some data according Giurca, 2020; A 1 … environment, 2018; Rostoks et. al., 2019) 2
Socio – cultural criteria Lithuania Poland Netherlands Notifications of GMO issues few few few Lifestyle changes aging society, low birth
rate youth reluctance to farm increasing number of
labor immigrants Awareness about ecological issues
interested in ecology interested in ecology interested in ecology
Entrepreneurial spirit farmers are not entrepre-neurial enough
farmers are entrepreneurial farmers are entrepre-neurial
Media view positive positive positive Global Biotechnology Rank-ings
32nd 36th 13th
3 Technological environment 4 The main players in the global biotechnology market are the USA and Europe. In these regions 5
there are more than 700 state-owned enterprises, and more than 200,000 employees earn about 140 6 billion dollars in revenue from biotechnology (Miculic, 2018). The biotechnology market is particu-7 larly receptive to research. Around 20 billion dollars is spent on them worldwide per year. The 8 planet’s biotechnology market is estimated to be worth about 400 billion euros (Garcia – Sancho, et. 9 all., 2019). The European Commission's Lead Market Initiative goals to enable the initial adoption of 10 innovative technologies, e.g. online presence, and technological access. (Alava et. all., 2018). As-11 sessing specific technological aspects, it was observed that: 12
- Biggest thickness of bio-business facilities is in Belgium, Germany, France, and Italy (A 13 … environment, 2018). 14
- In the field of biotechnology, there are certainly excellent conditions for start-ups Rostoks 15 et. al., 2019. 16
Bellow technological criteria and their evaluation for agricultural bio-business development are 17 provided. 18
19 Table 6. Technological criteria and their evaluation (some data according Global Biotechnol-20
ogy Rankings; Vazques et. all., 2018) 21 22
Technological criteria Lithuania Poland Netherlands Technological online presence good good very good Technological access good good good Technological investments policies of government small big very big Support or research and development activities by the govern-ment
small good very good
Global Biotechnology Rankings 32nd 36th 13th 23 4. Discussion 24 25 There are trends of high value-added multifunctional bio-business that are emerging world-26
wide (Vitunskienė, 2017): 27 - Increasing demand for biomass. 28 - Increasing need for reuse of bio-waste. 29 - Increasing use of biomass for high value-added products. 30 - Increasing need for CAP investment. 31 Analysing bio-business trends and perspectives, it is also important to pay attention to the 32
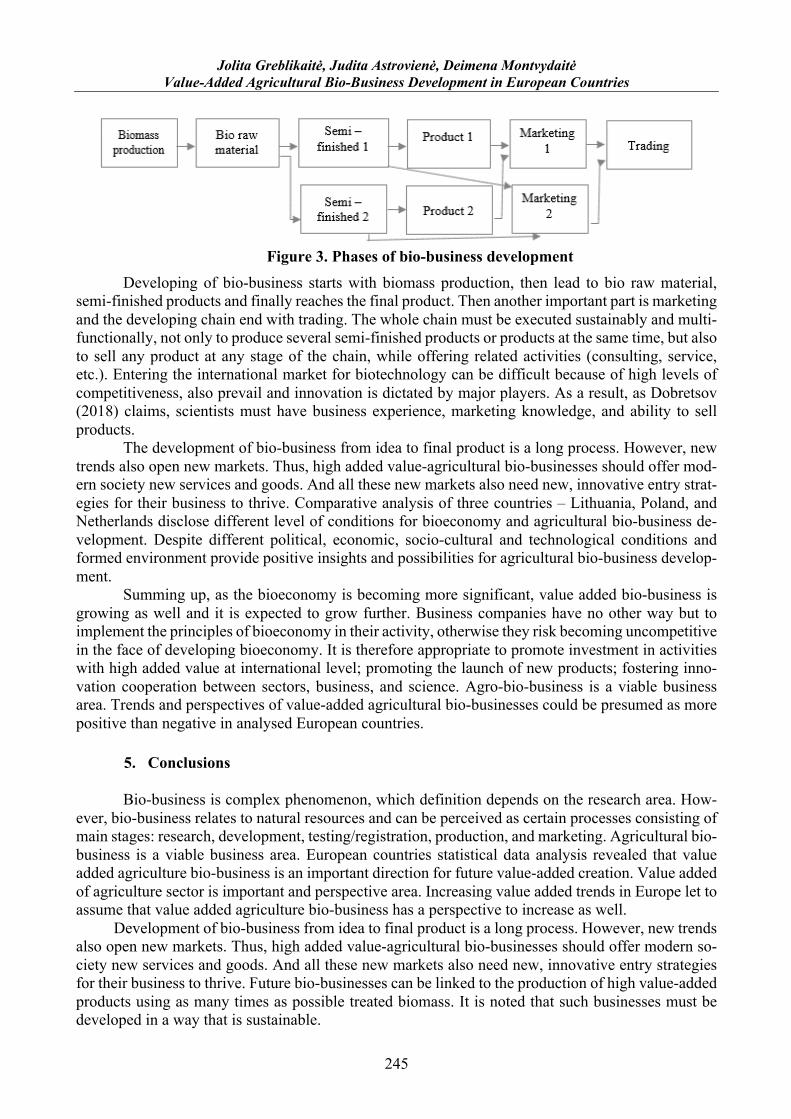
development stages. A multifunctional bio-business must be able to be flexible at any stage. The 33 chain of high value-added phases in agricultural multifunctional bio-business is presented (see Figure 34 3). 35
Jolita Greblikaitė, Judita Astrovienė, Deimena Montvydaitė Value-Added Agricultural Bio-Business Development in European Countries
245
1 Figure 3. Phases of bio-business development 2
Developing of bio-business starts with biomass production, then lead to bio raw material, 3 semi-finished products and finally reaches the final product. Then another important part is marketing 4 and the developing chain end with trading. The whole chain must be executed sustainably and multi-5 functionally, not only to produce several semi-finished products or products at the same time, but also 6 to sell any product at any stage of the chain, while offering related activities (consulting, service, 7 etc.). Entering the international market for biotechnology can be difficult because of high levels of 8 competitiveness, also prevail and innovation is dictated by major players. As a result, as Dobretsov 9 (2018) claims, scientists must have business experience, marketing knowledge, and ability to sell 10 products. 11
The development of bio-business from idea to final product is a long process. However, new 12 trends also open new markets. Thus, high added value-agricultural bio-businesses should offer mod-13 ern society new services and goods. And all these new markets also need new, innovative entry strat-14 egies for their business to thrive. Comparative analysis of three countries – Lithuania, Poland, and 15 Netherlands disclose different level of conditions for bioeconomy and agricultural bio-business de-16 velopment. Despite different political, economic, socio-cultural and technological conditions and 17 formed environment provide positive insights and possibilities for agricultural bio-business develop-18 ment. 19
Summing up, as the bioeconomy is becoming more significant, value added bio-business is 20 growing as well and it is expected to grow further. Business companies have no other way but to 21 implement the principles of bioeconomy in their activity, otherwise they risk becoming uncompetitive 22 in the face of developing bioeconomy. It is therefore appropriate to promote investment in activities 23 with high added value at international level; promoting the launch of new products; fostering inno-24 vation cooperation between sectors, business, and science. Agro-bio-business is a viable business 25 area. Trends and perspectives of value-added agricultural bio-businesses could be presumed as more 26 positive than negative in analysed European countries. 27
28 5. Conclusions 29 30 Bio-business is complex phenomenon, which definition depends on the research area. How-31
ever, bio-business relates to natural resources and can be perceived as certain processes consisting of 32 main stages: research, development, testing/registration, production, and marketing. Agricultural bio-33 business is a viable business area. European countries statistical data analysis revealed that value 34 added agriculture bio-business is an important direction for future value-added creation. Value added 35 of agriculture sector is important and perspective area. Increasing value added trends in Europe let to 36 assume that value added agriculture bio-business has a perspective to increase as well. 37
Development of bio-business from idea to final product is a long process. However, new trends 38 also open new markets. Thus, high added value-agricultural bio-businesses should offer modern so-39 ciety new services and goods. And all these new markets also need new, innovative entry strategies 40 for their business to thrive. Future bio-businesses can be linked to the production of high value-added 41 products using as many times as possible treated biomass. It is noted that such businesses must be 42 developed in a way that is sustainable. 43
Jolita Greblikaitė, Judita Astrovienė, Deimena Montvydaitė Value-Added Agricultural Bio-Business Development in European Countries
246
The main directions of bio-business could be not only the production of high value-added agri-1 cultural products, but also the search for new sources of biomass or production from bio-waste. 2 Tendencies for agricultural bio-business development in European countries remain positive. Com-3 parative analysis of Lithuania, Poland, and Netherlands has different macroenvironment for such 4 business, but strategic goals are oriented to bioeconomy. 5
6 References 7
8 A sustainable Bioeconomy for Europe: strengthening the connection between economy, society and the environ-9
ment. 2018. Updated Bioeconomy Strategy. - https://ec.europa.eu/research/bioeconomy/pdf/ec_bioeconomy_strat-10 egy_2018.pdf 11
Achinas, S., et. all. (2019). A PESTLE Analysis of Biofuels Energy Industry in Europe. // Sustainability 2019, 11, 12 5981 13
Alava, R., P.; Murillo, J., M., Zambrano, R., B. (2018). PEST Analysis Based on Neutrosophic Cognitive Maps: 14 A Case Study for Food Industry. - https://digitalrepository.unm.edu/cgi/viewcontent.cgi?article=1275&con-15 text=nss_journal 16
Arujanan, M., Singaram, M. (2018). The biotechnology and bioeconomy landscape in Malaysia. // New biotech-17 nology, Vol. 40: 52-59. 18
Bikse, V., Lusena-Ezera, I., Volkova, T., Rivza, B. (2019). European Bioeconomy Policy and New Opportunities 19 for Bio-Based Business Development. International Multidisciplinary Scientific GeoConference: SGEM, Vol. 19(5.3): 20 317-325. 21
Biotechnology briefings on each Scorecard country. (2019). World VIEW Guide. - 22 http://www.saworldview.com/scorecard/worldviewguide/. 23
Bumelis, V., A. (2018). Ar jau pasiektas biotechnologijų sektoriaus proveržis Lietuvoje? MITA conference: „Li-24 etuvos inovacijų DNR: kaip auginti naują inovatorių kartą?”. - https://mita.lrv.lt/uploads/mita/docu-25 ments/files/renginiai/pranesimai/2018-03-08/vladas_bumelis_ar_jau_pasiektas_proverzis.pdf. 26
Čiužienė, K., Kaminskas, K., Petraška, A. (2016). Socialinės-kultūrinės aplinkos vaidmuo globalioje logistikoje: 27 ekspertinis vertinimas. - https://alytauskolegija.lt/wp-content/uploads/straipsniai/Ciziuniene1.pdf 28
D’Amato, D., Veijonaho, S., Toppinen, A. (2020). Towards sustainability? Forest-based circular bioeconomy 29 business models in Finnish SMEs // Forest policy and economics, Vol. 110: 101848. 30
- https://www.sciencedirect.com/science/article/pii/S1389934118302600 31 Dobretsov, S. (2018). Second GCC Marine Biotechnology conference: emerging opportunities and future perspec-32
tives // Journal of Agricultural and Marine Sciences, Vol. 23: 48– 51. 33 European Commission. (2019). Statistical factsheets. - https://ec.europa.eu/info/food-farming-fisheries/farm-34
ing/facts-and-figures/markets/production/production-country/statistical-factsheets_en. 35 European Technology Platforms. (2017). The European Bioeconomy in 2030, Delivering Sustainable Growth By 36
Addressing, The Grand Societal Challenges. - https://www.greengrowthknowledge.org/sites/default/files/downloads/re-37 source/BECOTEPS_European%20Bioeconomy%20in%202030.pdf. 38
Eurostat. (2020). Database. - https://ec.europa.eu/eurostat/data/database. 39 Food and Agriculture Organization of the United Nations. (2018). Assessing The Contribution of Bioeconomy to 40
Countries’ Economy, a Brief Review of National Frameworks. - http://www.fao.org/3/I9580EN/i9580en.pdf. 41 Food and Agriculture Organization of the United Nations. (2019). Faostat. - http://www.fao.org/faostat/en/#coun-42
try. 43 Garcia – Sancho, M., Myelnikov, D. (2019). Between mice and sheep: Biotechnology, agricultural science and 44
animal models in late-twentieth century Edinburgh. - https://www.sciencedirect.com/science/arti-45 cle/pii/S1369848617301814 46
Giurca, A. (2020). Unpacking the network discourse: Actors and storylines in Germany's wood-based bioeconomy. 47 - https://www.sciencedirect.com/science/article/pii/S1389934118301047 48
Global Biotechnology Rankings. - https://www.thinkbiotech.com/globalbiotech/ 49 Gunn, M. A. (2016). When science meets entrepreneurship: Ensuring biobusiness graduate students understand 50
the business of biotechnology // Journal of Entrepreneurship Education, Vol. 19(2): 53-77. 51 Hassan, R., Marwan, A., Tawil, N., M. and Ramlee, S. (2015). Cooperative bio business model: a study at univer-52
siti Kebangsaan Malaysia // Journal of Engineering Science and Technology, Vol. 10: 81-88. 53 Hayward, M., Caldwell, A., Steen, J., Gow, D. et al. (2017). Entrepreneurs’ capital budgeting orientations and 54
innovation outputs: evidence from Australian biotechnology firms // Long Range Planning, Vol. 50(2): 121-133. 55 Horvath, B., Khazami, N., Ymeri, P., Fogarassy, C. (2019). Investigating the current business model innovation 56
trends in the biotechnology industry // Journal of Business Economics and Management, Vol. 20(1): 63-85. 57 Kafarski, P. (2012). Rainbow code of biotechnology. Chemik, Vol. 66 (8): 811-816. 58

Jolita Greblikaitė, Judita Astrovienė, Deimena Montvydaitė Value-Added Agricultural Bio-Business Development in European Countries
247
Kozyra J., Cieslikowska, J. (2019). Overview of state of play on bioeconomy in Poland. Workshop “Facilitating 1 development of bioeconomy policy – needs and gaps”. - https://bioeast.eu/wp-content/uploads/2020/01/WS3_Poland.pdf. 2
Ladu, L., Imbert, E., Qiutzow, R. (2020). The role of the policy mix in the transition toward a circular forest 3 bioeconomy. - https://www.sciencedirect.com/science/article/pii/S138993411830368X 4
Lainez, M., Gonzalez, J., M., Aguilarc, A., Velad, C. (2018). Spanish strategy on bioeconomy: Towards a 5 knowledge based sustainable innovation // New Biotechnology, Vol. 40 (2018): 87-95. 6
Lassoued, L., Macall, D., M., Smyth, S., J. (2020). How should we regulate products of new breeding techniques? 7 Opinion of surveyed experts in plant biotechnology. - 8 https://www.sciencedirect.com/science/article/pii/S2215017X19306599 9
Leipold, S., Petit-Boix, A. (2018). The circular economy and the bio-based sector - Perspectives of European and 10 German stakeholders // Journal of Cleaner Production, Vol. 201 (2018): 1125-1137. 11
Lietuvos bioekonomikos plėtros galimybių studijos projekto pristatymo santrauka. 12 (2017). - http://www.lpk.lt/wp-content/uploads/2017/09/Lietuvos-bioekonomikos-pl%C4%97tros-galimybi%C5%B3-13 studijos-pristaytmo-santrauka1.pdf 14
Lithuanian Institute of Agrarian Economics. (2019). Agricultural and Food Sector in Lithuania 2018. Vilnius. - 15 https://www.laei.lt/?mt=leidiniai&straipsnis=1631&metai=2019. 16
Lovric, M., et. all. (2020). Mapping forest-based bioeconomy research in Europe, - https://www.sciencedi-17 rect.com/science/article/pii/S1389934118303964?via%3Dihub 18
Lutzeyer, H. J. (2019). Introduction to the European bioeconomy strategy. European Commission. SCAR-CASA 19 Workshop. - https://scar-europe.org/images/CASA/Events/Portugal_20may2019/presentations/Hans_Joerg.pdf. 20
Miculic, M. (2018). Biotechnology industry - Statistics & Facts, - https://www.statista.com/topics/1634/biotech-21 nology-industry/ 22
Ministry of Economic Affairs and Climate Policy. (2018). The position of the bioeconomy in the Netherlands. - 23 https://gbs2018.com/fileadmin/gbs2020/documents/bioeconomy_Netherlands.pdf. 24
Negoro, A., Kuntariningsih, A., Dewi, H., Daroini, P., et al. (2018). The usage of information and communication 25 technology in improving bio-business performance: a case of vegetable farming in Indonesia, International Conference 26 on Green Agroindustry and Bioeconomy. - https://www.researchgate.net/publication/328353286_The_usage_of_infor-27 mation_and_communication_technology_in_improving_bio-business_performance_a_case_of_vegetable_farm-28 ing_in_Indonesia. 29
Niosi, J., McKelvey, M. (2018). Relating business model innovations and innovation cascades: the case of bio-30 technology // Journal of evolutionary economics, Vol. 28(5): 1081-1109. 31
Rostoks, N., Grantina-Levina, L., Levina, B. (2019). Genetically modified seeds andplant propagating material 32 inEurope: potential routes ofentrance and current status. - https://www.sciencedirect.com/science/arti-33 cle/pii/S2405844018383932 34
Tetslaff, J., E., Clifford, P., S. (2019). Biobusiness consulting to prepare scientists for industry careers // Nature 35 Biotechnology, volume 37, 821–825. - https://www.nature.com/articles/s41587-019-0173-4. 36
The Council of Ministers of Poland. (2019). Strategy for Sustainable Development of Rural Areas, Agriculture 37 and Fisheries 2030. - https://www.upwr.edu.pl/p/konferencje/2020/bio-based_indus-38 tries/05_dr_j_kozyra_wroclaw_bbi_v2.pdf 39
Timmis, K., De Lorenzo, V., Verstraete, W., Ramos, J. L. et al. (2017). The contribution of microbial biotechnol-40 ogy to economic growth and employment creation. Microbial biotechnology, Vol. 10(5): 1137-1144. 41
Tyagi, P., Sengar, R. S., Kumar, A. (2018). The opportunities to develop a successful entrepreneurship and busi-42 ness model in biotechnology: an overview // Journal of Commercial Biotechnology, Vol. 24(3): 63-68. 43
Vazques, M., L., Hernandes, J., H., Hernandes, N., B., et. all. (2018). A framework for PEST analysis based on 44 fuzzy decision maps. - https://www.revistaespacios.com/a18v39n16/a18v39n16p03.pdf 45
Vilmantas, V., Melnikas, B. (2014). Rinkodaros tobulinimas plėtojant biotechnologijomis grindžiamą verslą. // 46 Verslas: Teorija ir praktika Vol. 15(3): 210-219. 47
Vitunskienė, V. (2017). Bioekonomikos plėtra Lietuvoje. - https://zum.lrv.lt/uploads/zum/docu-48 ments/files/LT_versija/Naujiena/Vitunskiene_Bioecon_0301.pdf. 49
Vitunskienė, V., Miceikienė, A., Aleknevičienė, V., Čaplikas, J., Miškinis, V., Pilvere, I., …, Ramanauskė, N. 50 (2017). Lithuanian bioeconomy development feasibility study. - https://eimin.lrv.lt/uploads/eimin/documents/files/Ino-51 vaciijos/bioekonomikos%20studija/Lithuanian%20Bioeconomy%20Study_EN(1).pdf. 52
Woźniak, E., Twardowski, T. (2018). The bioeconomy in Poland within the context of the European Union // New 53 biotechnology, 40, 96-102. - https://www.sciencedirect.com/science/article/pii/S1871678417300389?casa_token=mPdo-54 NYSeW3AAAAAA:GvooF8ZTQqs-uq5kOJixLqJf_WsRpVVgJIY2lEYf-55 u8Thdc_cS3ruCbu9ihwt5TnTgmegXAB1W8Q#bib0075. 56
57 58 59