Embed Size (px)
Citation preview

1® ,/~
Share India You geneaue, we multiply
Share India Capital Services Pvt. Ltd. (Formerly Share India Finvest Private Limited)
(CIN : U65923UP2016PTC075987) SEBI Registered Category I Merchant Banker
Valuation Report
of
Aurum Lifesciences Private Limited
Prepared by
Share India Capital Services Private Limited ("Share India")
Regd. Office: 518, 5th Floor, Ocean Complex Sector-18, Neida Gautam Buddha Nagar UP 201301
Corporate Office: 14, DayanandVihar, Delhi-110092
Email Id: [email protected] Website: www.shareindia.com! Ph. No. 011-4301000
Dated June 20, 2019
SEBI Registered Category I Merchant Banker
SEBI Registration No.: INM000012537
Regd. Office: 518, 5th Floor, Ocean Complex, Sector-18, Noida, Gautam Buddha Nagar, U.P. - 201301 Corporate Office: 14, Dayanand Vihar, Near Karkardooma Metro Station, Delhi-110092, Tel.: 91-11-43011000, Fax: 91-11-43011030
E-mail: [email protected], Website: www.shareindia.com
SHARE INDIA CAPITAL SERVICES PRIVATE LIMITED (Formerly Known as Share India Finvest Private Limited)
SEBI Registered Category I Merchant Banker CIN: U65923 UP20 l 6PTC075987
Share India
ECONOMY OVERVIEW
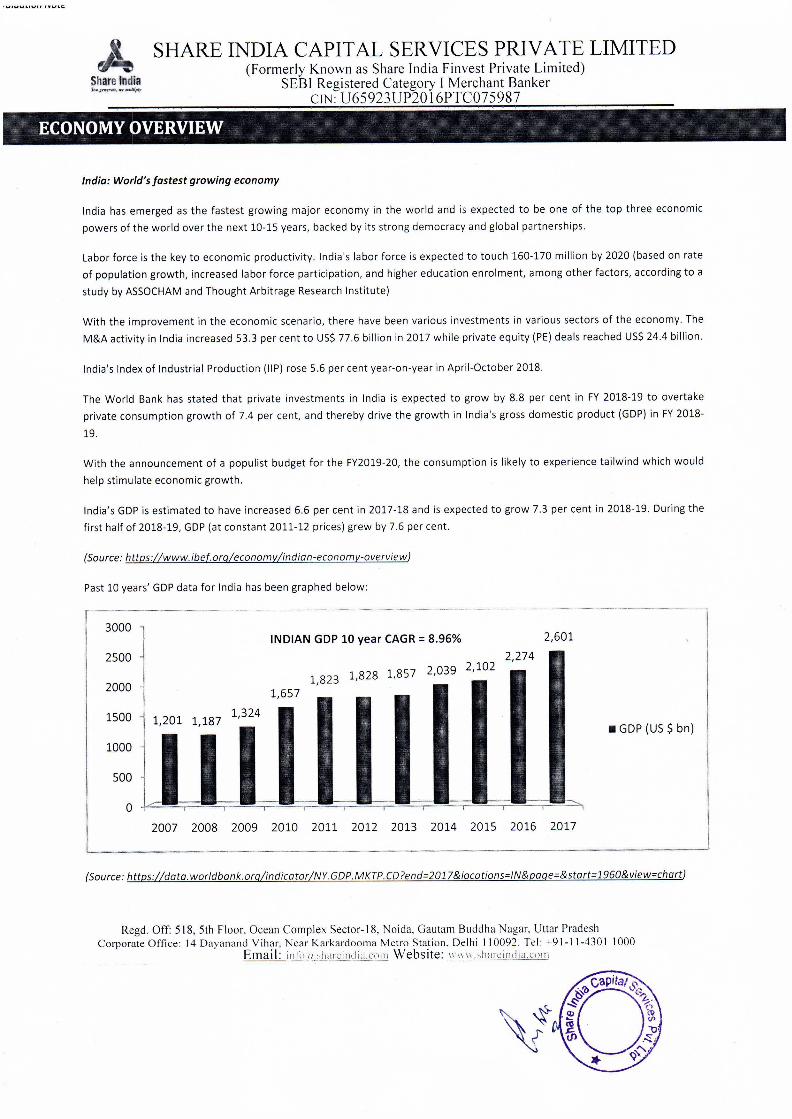
India: World's fastest growing economy
India has emerged as the fastest growing major economy in the world and is expected to be one of the top three economic powers of the world over the next 10-15 years, backed by its strong democracy and global partnerships.
Labor force is the key to economic productivity. India's labor force is expected to touch 160-170 million by 2020 (based on rate of population growth, increased labor force participation, and higher education enrolment, among other factors, according to a study by ASSOCHAM and Thought Arbitrage Research Institute)
With the improvement in the economic scenario, there have been various investments in various sectors of the economy. The M&A activity in India increased 53.3 per cent to US$ 77.6 billion in 2017 while private equity (PE) deals reached US$ 24.4 billion.
India's Index of Industrial Production (IIP) rose 5.6 per cent year-on-year in April-October 2018.
The World Bank has stated that private investments in India is expected to grow by 8.8 per cent in FY 2018-19 to overtake private consumption growth of 7.4 per cent, and thereby drive the growth in India's gross domestic product (GDP) in FY 2018-
19.
With the announcement of a populist budget for the FY2019-20, the consumption is likely to experience tailwind which would help stimulate economic growth.
India's GDP is estimated to have increased 6.6 per cent in 2017-18 and is expected to grow 7.3 per cent in 2018-19. During the first half of 2018-19, GDP (at constant 2011-12 prices) grew by 7.6 per cent.
{Source: https://www.ibe[org/economy/indian-economv-overview)
Past 10 years' GDP data for India has been graphed below:
3000
2500
2000
1500
1000
500
0
INDIAN GDP 10 year CAGR = 8.96% 2,601
I_I_ 1,823
1,657
• GDP (US$ bn)
2007 2008 2009 2010 2011 2012 2013 2014 2015 2016 2017
---------------------------------------------------' {Source: https://data. world bank. org/indicator /NY. GOP. MKTP. CD ?end=2017 &locations=/ N&page=&start=l 960&view=chart)
Regd. Off: 518, 5th Floor, Ocean Complex Sector- I 8, Noida, Gautam Buddha Nagar, Uttar Pradesh Corporate Office: 14 Dayanand Vihar, Near Karkardooma Metro Station. Delhi 110092. Tel: +91-11-4301 1000
Email: in1,,ri,,,h1_1r,:_ir1Ji:1cn11_1 Website: '-'-'0·-'-'-,_;Jrnreind1acom

SHARE INDIA CAPITAL SERVICES PRIVATE LIMITED (Formerly Known as Share India Finvest Private Limited)
SEBI Registered Category I Merchant Banker CIN: U65923UP2016PTC075987
Share India
Well contained general price levels
India's headline inflation rate based on the consumer price index (combined) eased to an 18-month low of 2.19% in December, down from 2.33% in November and 5.21% in December 2017.
Wholesale inflation softened to an eight-month low of 3.8% in December from 4.64% in November Retail inflation has stayed below the RBl's medium-term target of 4% for the fifth straight month. It fell to its lowest level since June 2017 of 1.46%.
Oil prices have been one on the major drivers to inflation (as it is a key element in production processes) and with oil prices cooling off by the end of 2018 and carrying similar trend in 2019, inflation is expected to remain low. Brent crude oil reached at record highs of $86 per barrel during the month of October on account of US sanctions on Iran. However since then the prices have eased and currently the brent crude futures are around US$67 /barrel. As per Goldman Sachs Group lnc.'s forecasts, oil price is likely to average $62.5/barrel throughout the year 2019.
(Source: //economicti mes. i ndiati mes.com/a rticleshow /67527302 .ems ?utm sou rce=contentofinte rest&utm med iu m=text&utm campaign=cppst/
(Source: https://oi/price.com/J
The past 10 year CPI based Inflation in India has been presented below:
CPI Inflation (% p.a)
14.00
12.00
10.00
8.00
6.00
4.00
2.00
0.00
11.99
2007 2008 2009 2010 2011 2012 2013 2014 2015 2016 2017
(Source: https:1/data. worldbank. org/indicator/FP. CPI. TOTL.ZG ?locations-IN& view-map/
Regd. Off: 518, 5th Floor, Ocean Complex Sector- I 8, Noida, Gautam Buddha Nagar, Uttar Pradesh Corporate Office: 14 Dayanand Yihar, Near Karkardooma Metro Station, Delhi 110092. Tel: +91-11-4301 1000
Email: inl,~!L>hareindi;H'(1111 Website: www.shareindia.com

SHARE INDIA CAPITAL SERVICES PRIVATE LIMITED (Formerly Known as Share India Finvest Private Limited)
SEBI Registered Category I Merchant Banker CIN: U65923UP2016PTC075987
Share India
PHARMACEUTICAL INDUSTRY OVERVIEW
Introduction
India is the largest provider of generic drugs globally. Indian pharmaceutical sector industry supplies over 50 per cent of global demand for various vaccines, 40 per cent of generic demand in the US and 25 per cent of all medicine in UK. The pharmaceutical sector was valued at US$ 35 billion in 2017.
India's domestic pharmaceutical market turnover reached Rs 129,015 crore (US$ 18.12 billion) in 2018, growing 9.4 per cent year-on-year (in Rs) from Rs 116,389 crore (US$ 17.87 billion) in 2017.
··------·-------------
Indian Pharmaceutical Sector Revenue (US$ bn)
17.87 18.12
/ij~-1---L ~ ----r-------r--- --<
2015 2016 2017 2018
India's pharmaceutical exports stood at US$ 17.27 billion in FY18 and have reached US$ 15.52 billion in FY19 (up to January 2019). Pharmaceutical exports include bulk drugs, intermediates, drug formulations, biologicals, Ayush & herbal products and surgicals.
Pharmaceutical Exports from India (US$ bn)
12 6 14.5 14.9. ·116.9 116.8 117.3
/L_[_[_ -- ------ .. "'7 ~ I ·- r-·-.,---·-,-T ---··- ,--=-----r
FY13 FY14 FY15 FY16 FY17 FY18
The drugs and pharmaceuticals sector attracted cumulative FOi inflows worth US$ 15.93 billion between April 2000 and December 2018, according to data released by the Department for Promotion of Industry and Internal Trade (DPIIT).
Government Initiatives
Some of the initiatives taken by the government to promote the pharmaceutical sector in India are as follows:
Regd. Off: 518, 5th Floor, Ocean Complex Sector- I 8, Neida, Gautam Buddha Nagar, Uttar Pradesh Corporate Office: 14 Dayanand Vihar, Near Karkardooma Metro Station, Delhi 110092. Tel: +91-11-4301 1000
Emai I: info 11~slwreindiJ.crnn Website: \\ \\ \, .shareindia.com

el~ Share India ~r- ...... ~
SHARE INDIA CAPITAL SERVICES PRIVATE LIMITED (Formerly Known as Share India Finvest Private Limited)
SEBl Registered Category I Merchant Banker CIN: U65923UP2016PTC075987
>' The Government of India unveiled 'Pharma Vision 2020' aimed at making India a global leader in end-to-end drug manufacture. Approval time for new facilities has been reduced to boost investments.
>' The allocation to the Ministry of Health and Family Welfare has increased by 13.1 per cent to Rs 61,398 crore (US$ 8.98 billion) in Union Budget 2019-20.
>' The Government of India is planning to set up an electronic platform to regulate online pharmacies under a new policy, in order to stop any misuse due to easy availability.
>' The Government of India unveiled 'Pharma Vision 2020' aimed at making India a global leader in end-to-end drug manufacture. Approval time for new facilities has been reduced to boost investments.
------------~
Government Expenditure on Health in India (US$ bn)
35.07 34.91
19.55~,~~,~~
2
~
i''' 7 FY13 FY14 FY15 FY16 FY17 FY18
Road Ahead
Medicine spending in India is projected to grow 9-12 per cent over the next five years, leading India to become one of the top 10 countries in terms of medicine spending.
In February 2019, the Indian pharmaceutical market grew by 10 per cent year-on-year. The country's pharmaceutical industry is expected to expand at a CAGR of 22.4 per cent over 2015-20 to reach US$ 55 billion.
Pharmaceutical Sector (US$ bn)
55
FY17 FY20F
towards chronic therapies for diseases such as such as cardiovascular, anti-diabetes, anti-depressants and anti-cancers that are on the rise. (Source: lbef)
Regd. Off: 518, 5th Floor, Ocean Complex Sector- I 8, Nolda, Gautam Buddha Nagar, Uttar Pradesh Corporate Office: 14 Dayanand Vihar, Near Karkardoorna Metro Station, Delhi 110092. Tel: +91-11-4301 1000
Email: inll>(<rsh,1rcindia.cum Website: w11·w.shareindia.rnrn

SHARE INDIA CAPITAL SERVICES PRIVATE LIMITED (Formerly Known as Share India Finvest Private Limited)
SEBI Registered Category I Merchant Banker CIN: U65923UP2016PTC075987
Share India
AURUM LIFESCIENCES PVT. LTD. COMPANY OVERVIEW
> Aurum Lifesciences Private Limited (hereinafter referred as 'Aurum' or 'the company') is into manufacturing and marketing of its own brands for medicines for critical illnesses.
> The company owns number of brands (trade mark registered or in the process of registration); > The company has manufacturing unit at Manjusar, Vadodara and distribution channels in six states of India.
COMPANY SPECIFIC FACTORS' ANALYSIS
SWOT Analysis
Strength:
> Own brands > Solid Promoter Experience > Own manufacturing set up in Gujarat > Effective sales team
Weakness:
> Small size > Pricing and administrative issues of Government > Competition from established and big players of pharma industry
Opportunities:
> Sales network > Experienced marketing and sales team > Networking, structured distribution channels and connect with Doctors and Hospital
Threats:
> Focus of government on generic drugs > Products of MN Cs coming into the market rapidly giving fair competition
VALUATION MODEL
We have used discounted cash flow (DCF) model to value the company. Within DCF model there are three types of cash flows
that can be used:
> Dividend > Free cash flow to firm (FCFF) > Free cash flow to equity (FCFE)
Regd. Off: 518, 5th Floor, Ocean Complex Sector- I 8, Neida, Gautam Buddha Nagar, Uttar Pradesh Corporate Office: 14 Dayanand Vihar, Near Karkardooma Metro Station, Delhi 110092. Tel: +91-11-4301 1000
Email: inlr110hareindia.L·()1n Website: '''"'·sharcindia.rnm
From the above models we have used FCFE model for valuation of the company.

SHARE INDIA CAPITAL SERVICES PRIVATE LIMITED (Formerly Known as Share India Finvest Private Limited)
SEBI Registered Category I Merchant Banker CIN: U65923UP2016PTC075987
Share India
MEANING: FREE CASH FLOW TO EQUITY
Free cash flow to equity (FCFE} refers to the cash flows that are left free for the equity share holders of the company once the company has met all its operating, investing and debt commitments. It is the cash portion that can be distributed amongst the equity share holders in the form of dividend and buyback after the company meets its aforementioned commitments.
Formula
FCFE =PAT+ Non-cash charges*+/- Working capital changes+/- Net capital expenditure+/- Net borrowings
OR
FCFE = Cash flow from operating activities+/- Cash flow from investing activities+/- Net borrowings - interest
*Non-cash charges include depreciation, amortization, deferred expenses written off over the years etc.
RATIONALE: FOR USING FCFE
General:
>" Dividend is a subset of FCFE .Thus cases where divergence between dividend and FCFE is high; it's highly possible that dividend approach would yield unreliable valuations.
>" Where a company follows constant dividend policy, dividends won't reflect the profitability and true state of the company properly.
>" FCFE model directly gives equity value as against FCFF where value of debt has to be adjusted to arrive at the ultimate equity value.
>" It requires detailed analysis of the company's business, its business environment and company's financial statements. Thus ensures insightful analysis in order to arrive at fair value.
>" For preparing financial statements accrual based accounting is followed which is subject to various distortions and cash on other hand is the least manipulative element. Hence one is able to attain unbiased results.
Company specific:
>" Free cash flows of the company are expected to be positive going forward. (based on management's forecasts) >" The company has no dividend history.
Regd. Off: 518, 5th Floor. Ocean Complex Sector- I 8, Noida, Gautam Buddha Nagar, Uttar Pradesh Corporate Office: 14 Dayanand Vihar, Near Karkardooma Metro Station. Delhi 110092. Tel: +91-11-4301 1000
Email: inlt11!,>harcindia.n>rn Website: 111111.sharcinJi:H(>rn

SHARE INDIA CAPITAL SERVICES PRIVATE LIMITED (Formerly Known as Share India Finvest Private Limited)
SEBI Registered Category I Merchant Banker CIN: U65923UP2016PTC075987
Share India
VALUATION
INR
Particulars Year ending Year ending Year ending Year ending Year ending Year ending 31/3/2020E 31/3/2021E 31/3/2022E 31/3/2023E 31/3/2024E 31/3/2025E
PAT 85,26,093 94,75,180 78,70,118 89,88,233 1,01,22,224 1,08,68,330
Add: Non-cash charges 66,33,700 63,02,015 94,53,022 89,80,371 85,31,353 81,04, 785
Add: Capex & W.capital changes ( 1,30,00,000) ( 1,30,00,000) ( 1,30,00,000) ( 1,30,00,000) ( 1,30,00,000) (1,37,00,000)
Free cash flow to equity 21,59,793 27,77,195 43,23,140 49,68,604 56,53,577 52, 73,115
Terminal value @ g = 4.00% - - - - - 3, 77,68,868
Total future cash flows (a) 21,59,793 27,77,195 43,23,140 49,68,604 56,53,577 4,30,41,983
Discount Factor@ 18.52% 0.88 0.74 0.62 0.53 0.44 0.37
Preset value of cash flows (a*b) 18,93,208 20,54,002 26,97, 753 26,16,048 25,11,556 1,61,33,190
Equity value as on 20/06/2019 2,79,05,758
Shares outstanding 74,940
Equity value per share 372
~ Subject to our limited scope, we certify that the equity value of the company as on June 20, 2019 is INR 372/- per equity share. ~ The company's DCF based valuation is lower than its book value and same might be challenged for calculation of tax liability
under section llUA of Income Tax Act, 1961.
Regd. Off: 518, 5th Floor, Ocean Complex Sector- I 8. Neida, Gautam Buddha Nagar, Uttar Pradesh Corporate Office: 14 Dayanand Vihar, Near Karkardoorna Metro Station. Delhi 110092. Tel: +91-1 1-430 I I 000
Email: inlo r, ,harcinJia.c:llrn Website: 111111 .,harcindi:.i.cPin

,I~ Share India I'""' ~f-,, ~ .,><llir',
SHARE INDIA CAPITAL SERVICES PRIVATE LIMITED (Formerly Known as Share India Finvest Private Limited)
SEBI Registered Category I Merchant Banker C!N: U65923UP2016PTC075987 --- ---- ------------------
NOTES: 1) Cost of equity, Ke= 18.52% has been computed using build-up model as follows:
Particulars ' Details
A)Expected risk free rate 7.84%
B)Market risk premium 1.37%
()Industry premium 1.00%
D)Size Premium 4.00%
E)Company specific risk premium 4.30%
Ke [A+B+C+D+E] 18.52%
NiftySO has been used for computing expected market return. Expected market return is based on historic values assuming it to be reliable measure of future market conditions. The calculation is as follows:
Particulars Details
A) No of years 10
B) Index Value on 21/06/2010 5,353
C) Index Value on 20/06/2019 11,832
Expected market return [ (C/B)"(l/(A-1))-1] 9.21%
The yield of India Govt Bond Generic Bid Yield 10 Year (GIND10YR) has been used for computing expected risk free rate. Expected risk free rate is based on historic values assuming it to be reliable measure of future economic conditions. The calculation is as follows:
Particulars Details
Average from 21/06/2010 - 20/06/2019
No. Of years 10
Expected risk free rate (simple average) 7.84%
2) Rationale behind different risk premiums is as follows: Equity market risk premium - Applying the build-up model, basic required return is the risk free rate and since the subject instrument is equity thus a risk premium over the risk free rate is to be applied to account for equity market risk premium as shown in the table below:
' Details Particulars :
A)Expected market return 9.21%
B)Expected risk free rate 7.84%
Market risk premium (A-B) 1.37%
Regd. Off: 518, 5th Floor, Ocean Complex Sector- I 8, Noida, Gautam Buddha Nagar, Uttar Pradesh Corporate Office: 14 Dayanand Vihar, Near Karkardooma Metro Station. Delhi 110092. Tel: +91-11-4301 1000
Ema i I: in[0j1.;~ba1:\:i.D_~j;1.,c_(_,_11J Website: '-'-" 11 .,hare ind ia.com

,J~ Sha.re India """',_,_,...,~
SHARE INDIA CAPITAL SERVICES PRIVATE LIMITED (Formerly Known as Share India Finvest Private Limited)
SEBI Registered Category I Merchant Banker CIN: U65923UP2016PTC075987
Industry risk premium -The Company is operating in pharmaceutical space. Pharmaceutical sector is a one of the constituents of the entire market. The market index can be thought of as a portfolio of well diversified sectors of an economy. Thus industry risk premium of 1.00% for considering sector specific risk seems apt.
Size premium - The Company is a privately held entity which is quiet small in size as compared to its listed peers in the pharmaceutical sector. Larger the size, more are the chances to reap benefits of economies of scale and as the size gets smaller, the operating risk comparative to large sized companies tends to increase. Thus a risk premium of 4.00% to account for small size of the company seems suitable.
Company specific risk premium - Projections have been rendered by the management of the company and it may have an element of projection risk inherent in the numbers provided. Moreover every company operates in an uncertain business environment and is also subject to operational uncertainties which might arise on account of company specific risk. Thus to entail idiosyncratic risk of the company, risk premium of 4.30% seems reasonable.
Nominal growth assumed: g = 4.00% Rationale behind growth is as follows: As noted previously, growth prospects for pharmaceutical sector are robust. Further, India is currently the world's fastest growing economy with its real GDP hovering around 7-7.5%. Moreover Government's initiatives like Ayushman Bharat are likely to boost the sector's growth. Thus given all these facts, conservatively we assume 4.00% nominal growth apt for the company.
Regd. Off: 518, 5th Floor, Ocean Complex Sector- I 8, Naida, Gautam Buddha Nagar, Uttar Pradesh Corporate Office: 14 Dayanand Vihar, Near Karkardooma Metro Station, Delhi 110092. Tel: +91-11-4301 1000
Email: info;i1,han:inuia.co111 Website: 1n11,.,hareinui:urnn
SHARE INDIA CAPITAL SERVICES PRIVATE LIMITED (Formerly Known as Share India Finvest Private Limited)
SEBI Registered Category I Merchant Banker CIN: U65923UP2016PTC075987
Share India
DISCLAIMER:
The scope of our assignment does not involve performing audit tests for the purpose of expressing an opinion on the fairness or accuracy of any financial or analytical information used during the course of our work. As such we have not performed any audit, review or examinations of any of the historical or prospective information used and therefore, do not express any opinion with regard to the same. In addition, we do not take any responsibility for any changes in the information used for any reason, which may occur subsequent to the date of our report.
Our valuation will not be offered to any section of the public to subscribe for or purchase any securities of any Company or
business valued by us.
This report is prepared with a limited purpose/ scope as identified and will be confidential being for use only to which it is issued. It must not be copied, disclosed or circulated in any correspondence or discussions with any person, except to whom it is issued and to those who are involved in this transaction and for various approvals and regulatory filings required for this
transaction.
The company's DCF based fair value as per the projections rendered is lower than its book value. Since our mandate requires
DCF based fair market value the same might lead to tax liability for calculations as per section 11UA of Income Tax Act, 1961. So
the valuation arrived might be subject to scrutiny under section 11UA of the Income Tax Act, 1961. We bear no liability in
whatsoever manner that might arise in this regard.
Signature: By: Abhinav Gupta Designation: President - Capital Markets Date: 201
h June 2019
Regd. Off: 518, 5th Floor, Ocean Complex Sector- I 8, Naida, Gautam Buddha Nagar, Uttar Pradesh Corporate Office: 14 Dayanand Vihar, Near Karkardooma Metro Station, Delhi 110092. Tel: +91-11-4301 1000
Emai I: inlr)'1L,harcindia.cPm Website: ,, ,, 11.,hrn·eindia com