Embed Size (px)
Citation preview
ValuationOfficeAgency
Annual Report and Accounts 2012-13

Valuation Office Agency Annual Report andAccounts 2012-13
Presented to the House of Commons pursuant to Section 7 of the Government Resources and Accounts Act 2000.
Ordered by the House of Commons to be printed 24 June 2013
HC240 London:TheStationeryOffice £21.25

©Crowncopyright2013
You may re-use this information (excluding logos) free of charge in any format or medium, under the terms of the Open Government Licence. To view this licence, visit http://www.nationalarchives.gov.uk/doc/open-government-licence/ or e-mail: [email protected].
Where we have identified any third party copyright information you will need to obtain permission from the copyright holders concerned.
Any enquiries regarding this publication should be sent to us at [email protected].
You can download this publication from www.voa.gov.uk.
ISBN: 9780102982244
Printed in the UK for The Stationery Office Limited
on behalf of the Controller of Her Majesty’s Stationery Office
ID P002544652 06/13
Printed on paper containing 75% recycled fibre content minimum.
3
ContentsAnnual Report
Our Highlights 4
About Us 5
The Chief Executive’s Review 8
How We’ve Performed 10
Improving our Capability 16
Sustainability Report 20
Remuneration Report 26
Financial Commentary 32
Statement of the Accounting Officer’s Responsibilities 34
Governance Statement 35
Annual Accounts
Contents 43
The Certificate and Report of the Comptroller and Auditor General to the House of Commons 44
Statement of Comprehensive Net Expenditure 46
Statement of Financial Position 47
Statement of Cash Flows 48
Statement of Changes in Taxpayers’ Equity 49
Notes to the VOA’s Accounts 50
Payment of Local Authority Rates (POLAR) 88
4 ValuationOfficeAgency Annual Report and Accounts 2012-13
Our Highlights
• We met our operational key performance indicators (KPIs) for the year and are on target to achieve our three year KPI.
• This year we cleared over 24% more rating appeals than in 2011-12.
• We jointly ran 17 Business Rate Retention workshops with Department for Communities and Local Government, attended by over 750 Local Authority representatives.
• The VOA’s data was included in the Consumer Prices Index for the first time, forming around 15% of the new measure, fulfilling a Coalition Agreement commitment.
• To support the debate around the postponement of the Non-Domestic Rating Revaluation 2015 we published high level aggregate estimates of rental and rating assessment movements in England since the last Revaluation.
• Property Services was appointed to the Government Procurement Service Framework for Estates Professional Services.
• We continued to simplify our processes, reducing the number of process maps in Non- Domestic Rating and Council Tax from over 100 to fewer than 40.
• Our people engagement score rose slightly from 44% to 46%, but we are still 12% below the Civil Service average, so we have room for improvement.
• Civil Service Reform – we were an early adopter of the new Civil Service Performance Management System and Competency Frameworks.
• We reduced our estate by 4,800 m2 saving £3.0m.
• Over 100 of our people gained professional qualifications.
5
About Us
“Our core purpose is to provide valuations and property advice to support taxation and benefits.”
We are an executive agency of HM Revenue and Customs (HMRC) with an Investors in People accreditation. Our head office is Wingate House, 93 – 107 Shaftesbury Avenue, London W1D 5BU.
Our vision is that “The VOA’s customers have confidence in its valuations and advice. As a modern professional organisation, with expert and committed people, it acts fairly, consistently and efficiently.”
Our core purpose is to provide valuations and property advice to support taxation and benefits. To help us achieve this, we have four strategic objectives:
- Target and achieve customer trust- Drive quality and consistency through improved processes- Develop and sustain the right capabilities - Sustainably reduce our costs and improve value for money.
These objectives run through all of our work in our day-to-day activities. This includes our change and transformational work, which aims to modernise the services we provide for our stakeholders and clients.
For more information, please refer to:
www.voa.gov.uk www.gov.uk
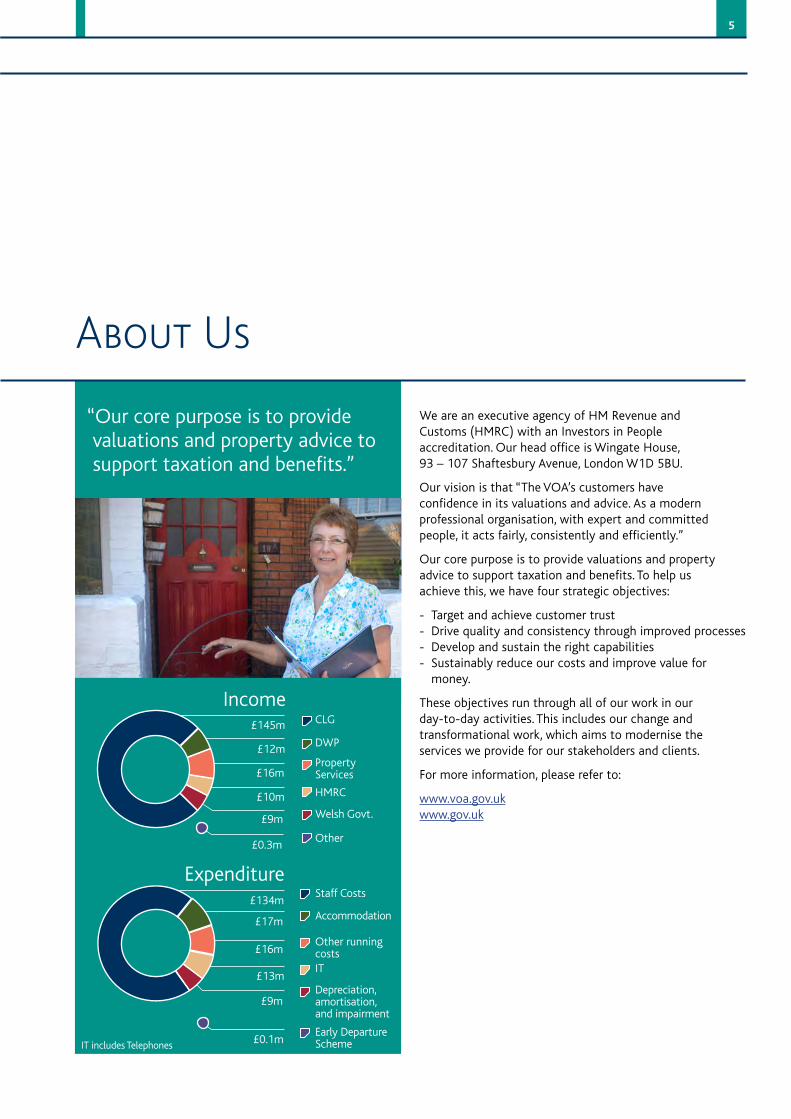
£145m
£12m
£16m
£10m
£9m
£0.3m
IncomeCLG
DWP
Property Services
HMRC
Welsh Govt.
Other
£134m
£17m
£16m
£13m
£9m
£0.1m
Staff Costs
Accommodation
Other running costsIT
Depreciation, amortisation, and impairment
Early Departure SchemeIT includes Telephones
Expenditure
6 ValuationOfficeAgency Annual Report and Accounts 2012-13
CT
NorthWalesWest
EastSouth
NDR
North West North EastWalesCentral
EastSouth WestLondonSouth East
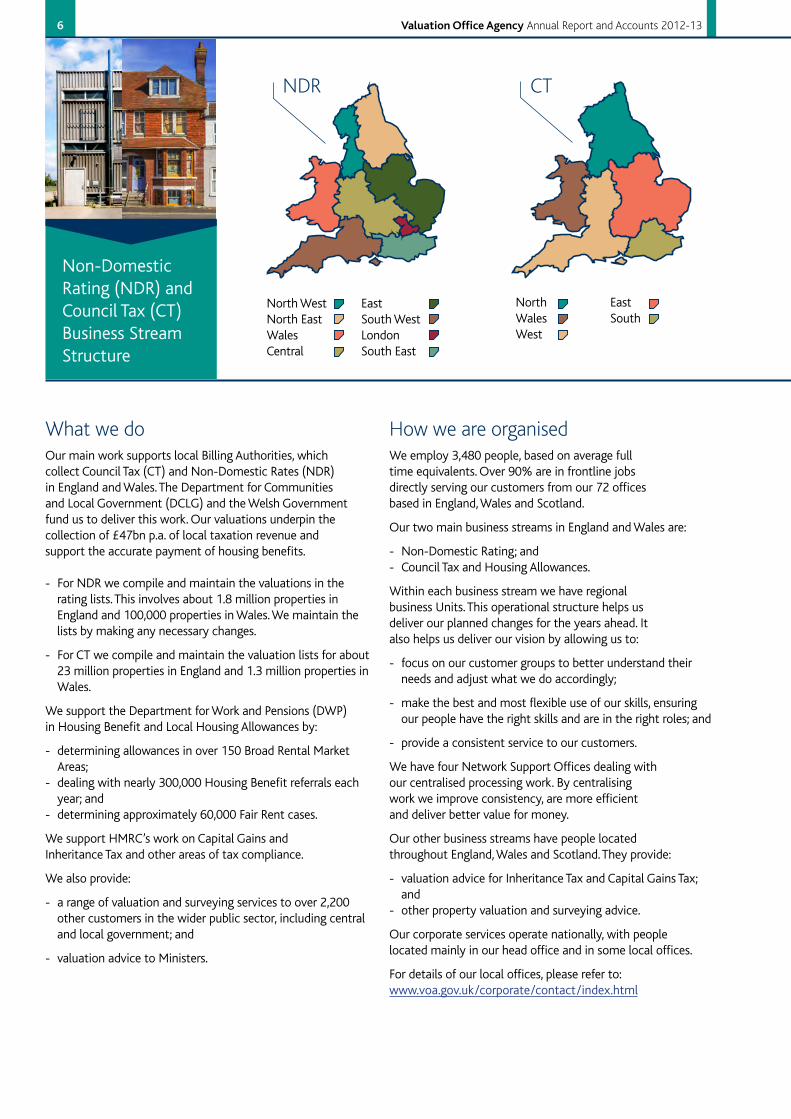
What we doOur main work supports local Billing Authorities, which collect Council Tax (CT) and Non-Domestic Rates (NDR) in England and Wales. The Department for Communities and Local Government (DCLG) and the Welsh Government fund us to deliver this work. Our valuations underpin the collection of £47bn p.a. of local taxation revenue and support the accurate payment of housing benefits.
- For NDR we compile and maintain the valuations in the rating lists. This involves about 1.8 million properties in England and 100,000 properties in Wales. We maintain the lists by making any necessary changes.
- For CT we compile and maintain the valuation lists for about 23 million properties in England and 1.3 million properties in Wales.
We support the Department for Work and Pensions (DWP) in Housing Benefit and Local Housing Allowances by:
- determining allowances in over 150 Broad Rental Market Areas;- dealing with nearly 300,000 Housing Benefit referrals each year; and - determining approximately 60,000 Fair Rent cases.
We support HMRC’s work on Capital Gains and Inheritance Tax and other areas of tax compliance.
We also provide:
- a range of valuation and surveying services to over 2,200 other customers in the wider public sector, including central and local government; and
- valuation advice to Ministers.
Non-Domestic Rating (NDR) and
Council Tax (CT) Business Stream Structure
How we are organisedWe employ 3,480 people, based on average full time equivalents. Over 90% are in frontline jobs directly serving our customers from our 72 offices based in England, Wales and Scotland.
Our two main business streams in England and Wales are:
- Non-Domestic Rating; and - Council Tax and Housing Allowances.
Within each business stream we have regional business Units. This operational structure helps us deliver our planned changes for the years ahead. It also helps us deliver our vision by allowing us to:
- focus on our customer groups to better understand their needs and adjust what we do accordingly;
- make the best and most flexible use of our skills, ensuring our people have the right skills and are in the right roles; and
- provide a consistent service to our customers.
We have four Network Support Offices dealing with our centralised processing work. By centralising work we improve consistency, are more efficient and deliver better value for money.
Our other business streams have people located throughout England, Wales and Scotland. They provide:
- valuation advice for Inheritance Tax and Capital Gains Tax; and - other property valuation and surveying advice.
Our corporate services operate nationally, with people located mainly in our head office and in some local offices.
For details of our local offices, please refer to: www.voa.gov.uk/corporate/contact/index.html

7
Meet Our Directors
Penny Ciniewicz Chief Executive
Dyfed Alsop Director, Strategy, People and Change
Director, People and Engagement
Director, Non-Domestic Rating
Christina Duncan
(left 7 June 2013)
Mary Hardman
Craig Pemberton Chief Finance Officer(appointed 18 March 2013)
Helen Kettlewell Director, Non-Domestic Rating - Operations
Philip Macpherson Chief Information Officer
Guy Richardson Director, Council Tax and Housing Allowances (left 30 April 2013)
Chris Sharp Director, Property Services
David Subacchi Director, National Specialist Unit
Niall Walsh Chief Operating Officer and Chief Valuer
Alex Jablonowski Non-Executive Director
Elizabeth McLoughlin CBE Non-Executive Director
Janet Grossman Non-Executive Director
Directors who left during the year: Colin Bailey, Chief Finance Officer (left 30 January 2013)Directors who started after year end: David Ede, Director, People and Engagement (started 3 June 2013) Adrian Ball, Director, Information and Analysis (started 3 June 2013)
8 ValuationOfficeAgency Annual Report and Accounts 2012-13
The Chief Executive’s Review
Thisyearwecontinuedtobuildonthefoundationsweputinplacein2011-12throughourchangeprogramme.Ourmajororganisationalchange-themovetonationalbusinessstreams-hasbeeninplaceforoverayearnowandcolleaguesacrosstheAgencyhaveconcentratedonembeddingournewstructuresandnewwaysofworking.Thechangeshavecertainlyhelpedusfocusmoreeffectivelyontheneedsofourcustomers,deliverypartnersandclientdepartments.
In particular we set ourselves a very ambitious target for increasing the number of Non-Domestic Rating (NDR) appeals we dealt with. Colleagues across our operations cleared over 236,000 NDR appeals, which is 24% more than we cleared last year. We achieved this by:
- increasing the number of people working on appeals;- significantly increasing productivity; and - working together more effectively in business streams across geographical boundaries.
Very many of the appeals we handle are withdrawn, struck out by the Valuation Tribunal before a hearing, or dismissed or confirmed by the Tribunal. But we recognise the importance of giving certainty to businesses as soon as we can and continue to strive to do so. We aim to resolve as many appeals as possible through discussion, speeding up clearance times and reducing the numbers of appeals with the Valuation Tribunal. And we prioritise hardship cases, seeking a swift resolution or working with the Tribunal to facilitate an early listing.
We also worked closely with our client, the Department for Communities and Local Government (DCLG), and Local Authorities (LAs), to support Business Rates Retention (BRR) in England. We put relationship managers in place to help build strong links with the 328 LAs involved. During the year colleagues from across the Agency worked with DCLG colleagues to deliver workshops to over three quarters of these LAs, exploring how best we can support them.
To support the debate around the postponement of the NDR Revaluation 2015, we published high level aggregate estimates of rental and rating assessment movements in England since the last Revaluation. The Growth and Infrastructure Bill received Royal Assent on 25 April 2013, and we re-directed the people released from Revaluation to support appeals clearance and BRR.
Property Services (PS), a not-for-profit team within the Agency which needs to cover its costs, also had a strong year. As PS’ work comes from the wider public sector, its income had reduced recently. But thanks to great teamwork and focused leadership, PS exceeded its income target, and underlined its importance as a shared service by its appointment as a supplier on the Government Procurement Services framework for Estates Professional Services. That means PS is now a recognised supplier for the whole public sector and our agreement will run for four years to 31 March 2017.
In our Council Tax (CT) operations, colleagues responded to double the usual number of telephone enquiries and near double the number of emails at the end of the financial year. This ensured that customers were able to get the information and advice they needed to help them with changes to CT Benefit and CT Reduction Schemes as well as understand their banding as LAs issued council tax bills.
It’s not just responsiveness like this that makes me confident we have the foundations in place to make further improvements in the service we provide. We also invested in developing our capability throughout the year. We are making plans for our future as we review our long term strategy to ensure we are resilient and able to provide the service our clients and customers need.
As part of our focus on improving our capability we were pleased to be an early adopter of the new Civil Service Performance Management and Competency Frameworks; a key part of Civil Service Reform. We rolled

9
them out to our people in April 2012 and they’re already having a positive effect, helping enable a stronger focus on outcomes and behaviours and helping ensure the development needs of our people are identified and met.
We also devoted considerable effort to ensuring our corporate services had the right skills to support our transformation. We carried out organisational reviews of:
- IT;- HR;- Information and Analysis; - Customer Services; and- local support functions.
These reviews brought efficiencies as we centralised some key activities. They also gave us greater expertise to support our delivery and transformation. We still have some way to go to fill all the gaps we identified but are working hard to do so.
In line with our commitment to learning and development we were very pleased with the success of the Agency’s Information Communications Technology professional apprenticeship scheme, which is groundbreaking across Government. The scheme helped us build IT capability, brought a fresh perspective and 20 young people developed valuable skills.
We continued to take the steps necessary to put in place a modern pay system. Our current system is not aligned with the rest of the Civil Service and we will be changing this over the next few years. This is causing some concern amongst staff but in time we shall have a pay and reward strategy which allows us to recognise the efforts of all our people more appropriately. This is important because, above all, it is the resilience of colleagues across the Agency that enabled us to achieve so much in the last year.
2013-14 and beyond will no doubt present more challenges but we are ready to respond, continually asking ourselves how we can improve and develop to benefit our people and our customers.
Penny Ciniewicz Chief Executive
“This year we continued to build on the foundations we put in place in 2011-12 through our change programme. Our major organisational change - the move to national business streams - has been in place for over a year now and colleagues across the Agency have concentrated on embedding our new structures and new ways of working.”
10 ValuationOfficeAgency Annual Report and Accounts 2012-13
How We’ve Performed
IntroductionOur operational performance has again been very strong this year. The national business streams we introduced in November 2011 for Non-Domestic Rating (NDR) and Council Tax (CT) have continued to evolve, underpinning performance and delivering improvements in the service we provide our customers.
In March 2012, we experienced severe technical issues with our telephony systems and had to quickly develop work around processes. This not only stabilised the service for customers but, importantly, has enabled us to gain much better data on call volumes. This additional information is helping us to better meet future capacity and customer needs. A senior working group is considering how we can enhance the customer experience by dealing with a higher proportion of calls at the first point of contact.
Non-Domestic Rating A key focus this year has been on assisting businesses by reducing the number of outstanding NDR appeals. While around three quarters of appeals settled on the 2010 list resulted in no change to the rateable value, we recognise the uncertainty associated with having an appeal outstanding. This is why we are working very hard to clear appeals.
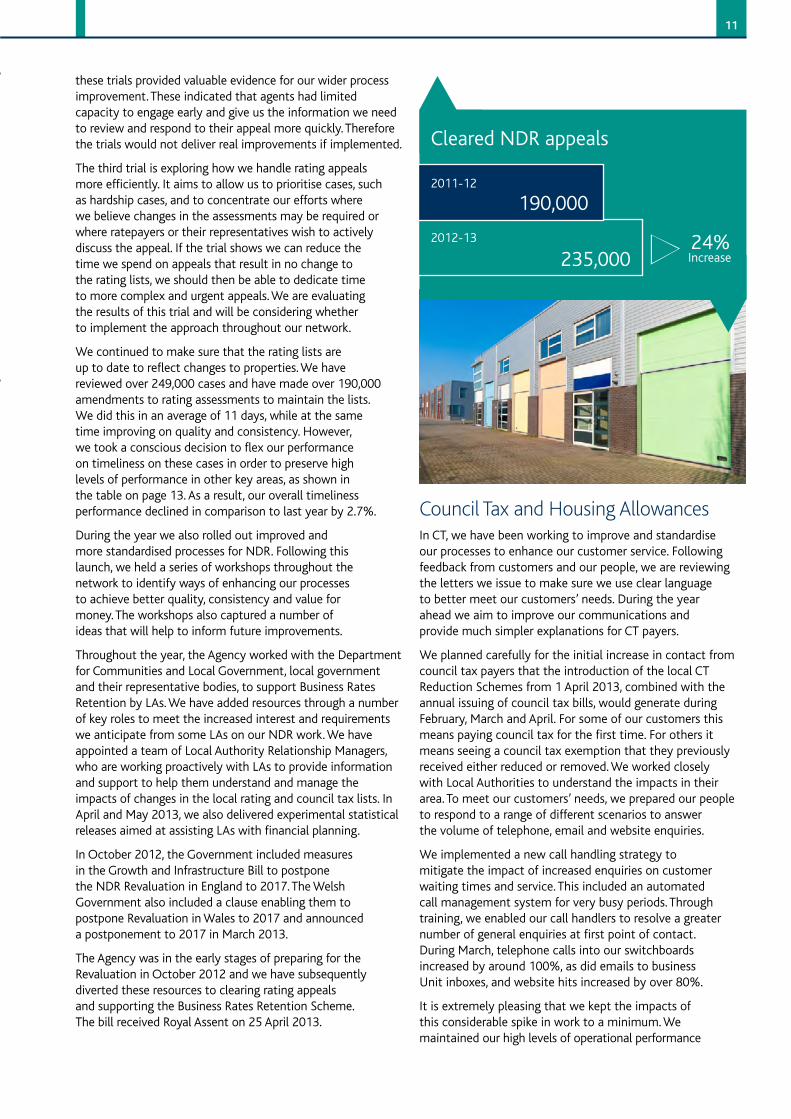
We have increased productivity on appeals clearance and transferred people from other work streams onto settling appeals. We cleared nearly 24% more appeals than in the previous year (236,000 in 2012-13 from 190,000 in 2011-12) and increased value for money performance across the Agency by 7.3%. Over the past 12 months we have cleared appeals on the 2010 rating lists at a faster rate than we received them, so the volume of outstanding appeals is in steady decline. There were just over 201,000 appeals outstanding on the 2005 and 2010 rating lists at the year end.
We also initiated three trials to test different approaches to our initial handling of NDR appeals to try and improve our response times to ratepayers and their agents. Two of
“A key focus this year has been on assisting businesses and reducing the number of outstanding NDR appeals.”
11
these trials provided valuable evidence for our wider process improvement. These indicated that agents had limited capacity to engage early and give us the information we need to review and respond to their appeal more quickly. Therefore the trials would not deliver real improvements if implemented.
The third trial is exploring how we handle rating appeals more efficiently. It aims to allow us to prioritise cases, such as hardship cases, and to concentrate our efforts where we believe changes in the assessments may be required or where ratepayers or their representatives wish to actively discuss the appeal. If the trial shows we can reduce the time we spend on appeals that result in no change to the rating lists, we should then be able to dedicate time to more complex and urgent appeals. We are evaluating the results of this trial and will be considering whether to implement the approach throughout our network.
We continued to make sure that the rating lists are up to date to reflect changes to properties. We have reviewed over 249,000 cases and have made over 190,000 amendments to rating assessments to maintain the lists. We did this in an average of 11 days, while at the same time improving on quality and consistency. However, we took a conscious decision to flex our performance on timeliness on these cases in order to preserve high levels of performance in other key areas, as shown in the table on page 13. As a result, our overall timeliness performance declined in comparison to last year by 2.7%.
During the year we also rolled out improved and more standardised processes for NDR. Following this launch, we held a series of workshops throughout the network to identify ways of enhancing our processes to achieve better quality, consistency and value for money. The workshops also captured a number of ideas that will help to inform future improvements.
Throughout the year, the Agency worked with the Department for Communities and Local Government, local government and their representative bodies, to support Business Rates Retention by LAs. We have added resources through a number of key roles to meet the increased interest and requirements we anticipate from some LAs on our NDR work. We have appointed a team of Local Authority Relationship Managers, who are working proactively with LAs to provide information and support to help them understand and manage the impacts of changes in the local rating and council tax lists. In April and May 2013, we also delivered experimental statistical releases aimed at assisting LAs with financial planning.
In October 2012, the Government included measures in the Growth and Infrastructure Bill to postpone the NDR Revaluation in England to 2017. The Welsh Government also included a clause enabling them to postpone Revaluation in Wales to 2017 and announced a postponement to 2017 in March 2013.
The Agency was in the early stages of preparing for the Revaluation in October 2012 and we have subsequently diverted these resources to clearing rating appeals and supporting the Business Rates Retention Scheme. The bill received Royal Assent on 25 April 2013.
Council Tax and Housing AllowancesIn CT, we have been working to improve and standardise our processes to enhance our customer service. Following feedback from customers and our people, we are reviewing the letters we issue to make sure we use clear language to better meet our customers’ needs. During the year ahead we aim to improve our communications and provide much simpler explanations for CT payers.
We planned carefully for the initial increase in contact from council tax payers that the introduction of the local CT Reduction Schemes from 1 April 2013, combined with the annual issuing of council tax bills, would generate during February, March and April. For some of our customers this means paying council tax for the first time. For others it means seeing a council tax exemption that they previously received either reduced or removed. We worked closely with Local Authorities to understand the impacts in their area. To meet our customers’ needs, we prepared our people to respond to a range of different scenarios to answer the volume of telephone, email and website enquiries.
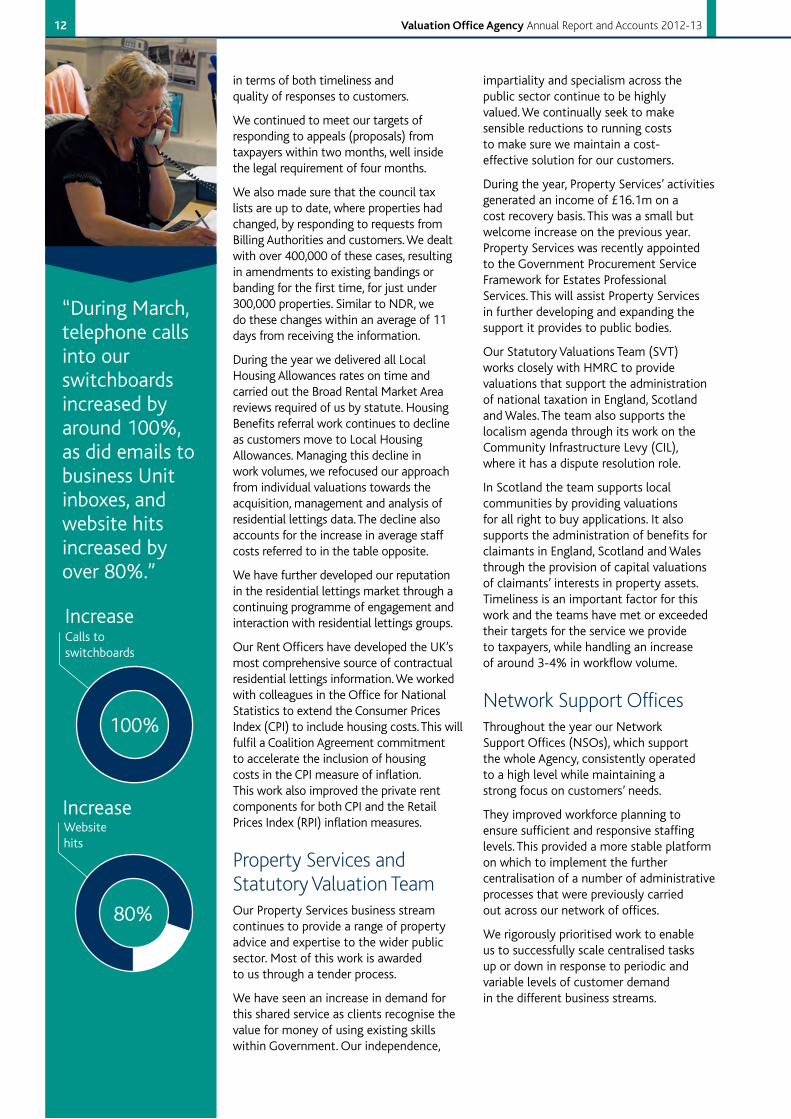
We implemented a new call handling strategy to mitigate the impact of increased enquiries on customer waiting times and service. This included an automated call management system for very busy periods. Through training, we enabled our call handlers to resolve a greater number of general enquiries at first point of contact. During March, telephone calls into our switchboards increased by around 100%, as did emails to business Unit inboxes, and website hits increased by over 80%.
It is extremely pleasing that we kept the impacts of this considerable spike in work to a minimum. We maintained our high levels of operational performance
Cleared NDR appeals
Increase24%
2011-12
2012-13
235,000
190,000
12 ValuationOfficeAgency Annual Report and Accounts 2012-13
in terms of both timeliness and quality of responses to customers.
We continued to meet our targets of responding to appeals (proposals) from taxpayers within two months, well inside the legal requirement of four months.
We also made sure that the council tax lists are up to date, where properties had changed, by responding to requests from Billing Authorities and customers. We dealt with over 400,000 of these cases, resulting in amendments to existing bandings or banding for the first time, for just under 300,000 properties. Similar to NDR, we do these changes within an average of 11 days from receiving the information.
During the year we delivered all Local Housing Allowances rates on time and carried out the Broad Rental Market Area reviews required of us by statute. Housing Benefits referral work continues to decline as customers move to Local Housing Allowances. Managing this decline in work volumes, we refocused our approach from individual valuations towards the acquisition, management and analysis of residential lettings data. The decline also accounts for the increase in average staff costs referred to in the table opposite.
We have further developed our reputation in the residential lettings market through a continuing programme of engagement and interaction with residential lettings groups.
Our Rent Officers have developed the UK’s most comprehensive source of contractual residential lettings information. We worked with colleagues in the Office for National Statistics to extend the Consumer Prices Index (CPI) to include housing costs. This will fulfil a Coalition Agreement commitment to accelerate the inclusion of housing costs in the CPI measure of inflation. This work also improved the private rent components for both CPI and the Retail Prices Index (RPI) inflation measures.
Property Services and on wh
Statutory Valuation Team centraproces
Our Property Services business stream continues to provide a range of property advice and expertise to the wider public sector. Most of this work is awarded to us through a tender process.
We have seen an increase in demand for this shared service as clients recognise the value for money of using existing skills within Government. Our independence,
impartiality and specialism across the public sector continue to be highly valued. We continually seek to make sensible reductions to running costs to make sure we maintain a cost-effective solution for our customers.
During the year, Property Services’ activities generated an income of £16.1m on a cost recovery basis. This was a small but welcome increase on the previous year. Property Services was recently appointed to the Government Procurement Service Framework for Estates Professional Services. This will assist Property Services in further developing and expanding the support it provides to public bodies.
Our Statutory Valuations Team (SVT) works closely with HMRC to provide valuations that support the administration of national taxation in England, Scotland and Wales. The team also supports the localism agenda through its work on the Community Infrastructure Levy (CIL), where it has a dispute resolution role.
In Scotland the team supports local communities by providing valuations for all right to buy applications. It also supports the administration of benefits for claimants in England, Scotland and Wales through the provision of capital valuations of claimants’ interests in property assets. Timeliness is an important factor for this work and the teams have met or exceeded their targets for the service we provide to taxpayers, while handling an increase of around 3-4% in workflow volume.
Network Support OfficesThroughout the year our Network Support Offices (NSOs), which support the whole Agency, consistently operated to a high level while maintaining a strong focus on customers’ needs.
They improved workforce planning to ensure sufficient and responsive staffing levels. This provided a more stable platform
ich to implement the further lisation of a number of administrative ses that were previously carried
out across our network of offices.
We rigorously prioritised work to enable us to successfully scale centralised tasks up or down in response to periodic and variable levels of customer demand in the different business streams.
“During March, telephone calls into our switchboards increased by around 100%, as did emails to business Unit inboxes, and website hits increased by over 80%.”
100%
Calls to switchboards
Increase
80%
Website hits
Increase
13
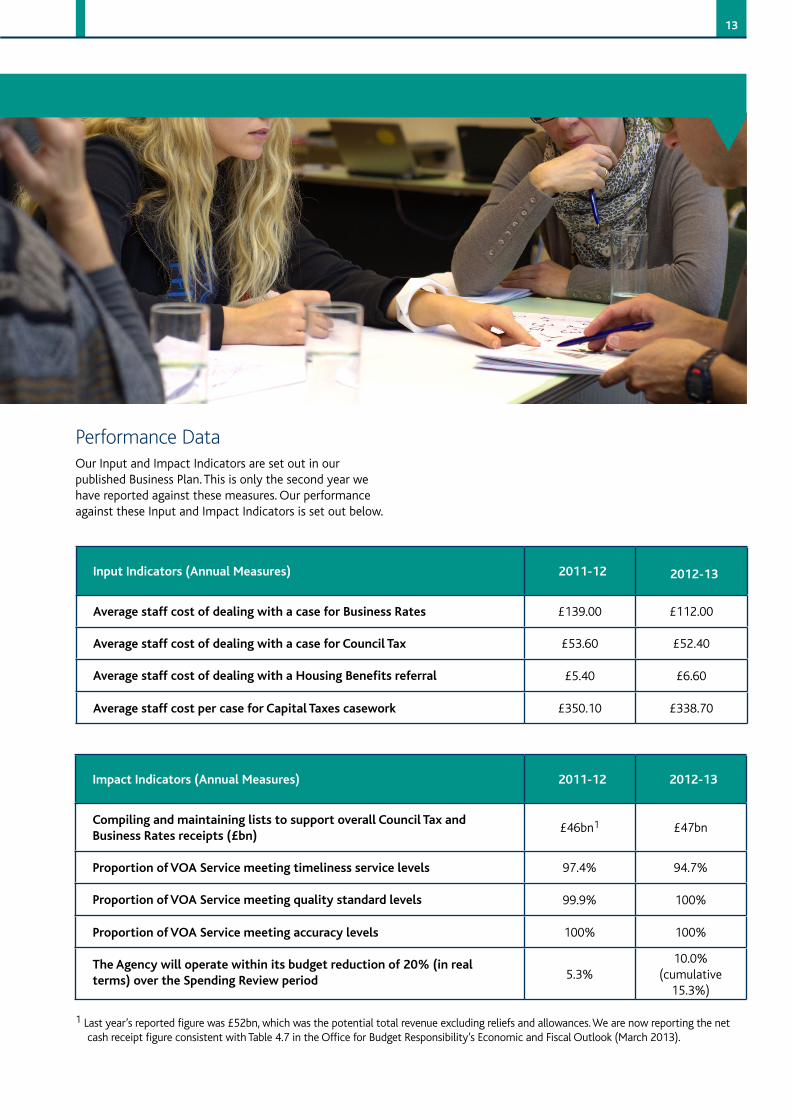
Performance DataOur Input and Impact Indicators are set out in our published Business Plan. This is only the second year we have reported against these measures. Our performance against these Input and Impact Indicators is set out below.
InputIndicators(AnnualMeasures) 2011-12 2012-13
AveragestaffcostofdealingwithacaseforBusinessRates £139.00 £112.00
AveragestaffcostofdealingwithacaseforCouncilTax £53.60 £52.40
AveragestaffcostofdealingwithaHousingBenefitsreferral £5.40 £6.60
AveragestaffcostpercaseforCapitalTaxescasework £350.10 £338.70
ImpactIndicators(AnnualMeasures) 2011-12 2012-13
CompilingandmaintainingliststosupportoverallCouncilTaxandBusinessRatesreceipts(£bn)
£46bn1 £47bn
ProportionofVOAServicemeetingtimelinessservicelevels 97.4% 94.7%
ProportionofVOAServicemeetingqualitystandardlevels 99.9% 100%
ProportionofVOAServicemeetingaccuracylevels 100% 100%
TheAgencywilloperatewithinitsbudgetreductionof20%(inrealterms)overtheSpendingReviewperiod 5.3%
10.0%(cumulative
15.3%)
1 Last year’s reported figure was £52bn, which was the potential total revenue excluding reliefs and allowances. We are now reporting the net cash receipt figure consistent with Table 4.7 in the Office for Budget Responsibility’s Economic and Fiscal Outlook (March 2013).
14 ValuationOfficeAgency Annual Report and Accounts 2012-13
Our performance indicators, which have previously been reported as Key Performance Indicators (KPIs), are shown in the table below for information.
Year 2011-12 2012-13
Operations To contain reductions in the 2010 rating lists to a maximum of 3.6% of the total compiled list rateable value, over the entire life of the lists.
0.4% 1.0%On
Target
To ensure 96% of new council tax bandings are right first time. 98.0% 98.4% Met
To determine 95% of Housing Benefit claims where no inspection is required in 3 working days.
99.9% 99.9% Met
To enable prompt issue of tax assessments by clearing all HMRC initial appraisal cases within an average of 3 working days.
3 days 3 days Met
Value for Money
Improvement on overall value for money on local taxation work by 3% for 2011-12. [Previously - Improvement on overall value for money on local taxation work by 3% a year over a three year period to 2010-11.]
5.4% 7.3% Met
To achieve full cost recovery reflecting a 5% reduction in budget for the year on all work for HMRC.
Met Met Met
To achieve income from non-statutory services of at least £15.0m.2 £15.5m £16.1m Met
Data Security
To have zero data incidents reportable to the Information Commissioner.
Nil Nil Met
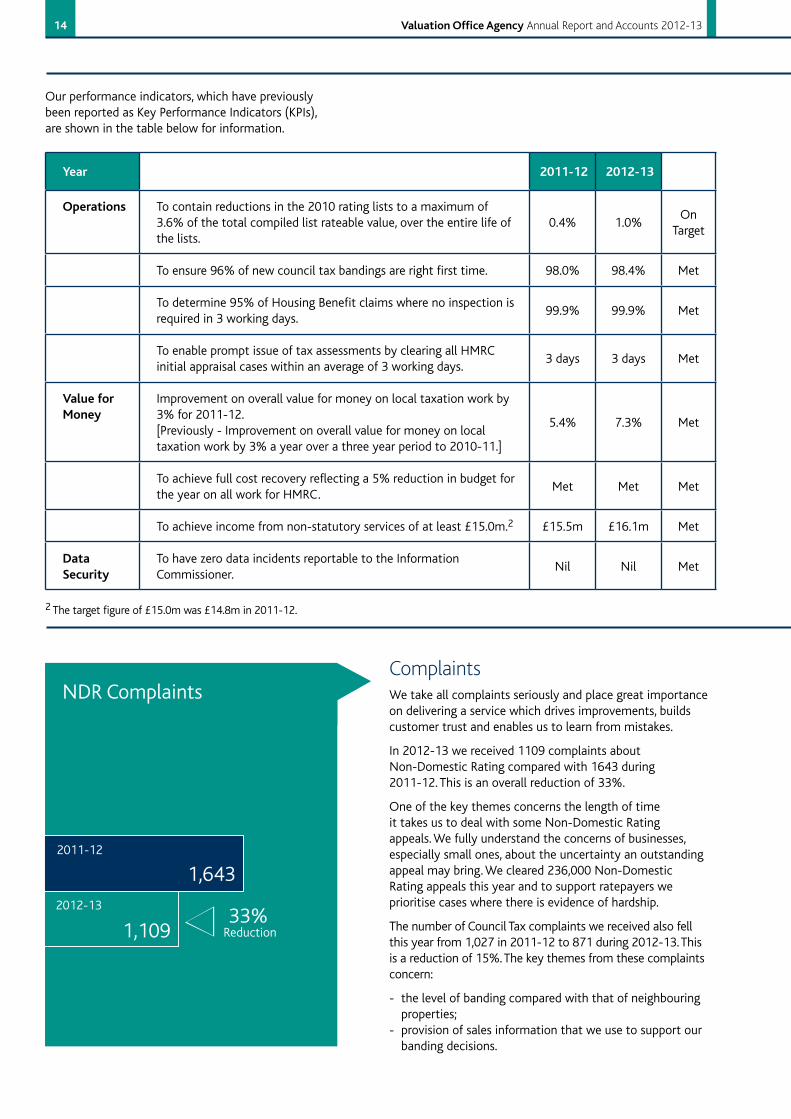
ComplaintsWe take all complaints seriously and place great importance on delivering a service which drives improvements, builds customer trust and enables us to learn from mistakes.
In 2012-13 we received 1109 complaints about Non-Domestic Rating compared with 1643 during 2011-12. This is an overall reduction of 33%.
One of the key themes concerns the length of time it takes us to deal with some Non-Domestic Rating appeals. We fully understand the concerns of businesses, especially small ones, about the uncertainty an outstanding appeal may bring. We cleared 236,000 Non-Domestic Rating appeals this year and to support ratepayers we prioritise cases where there is evidence of hardship.
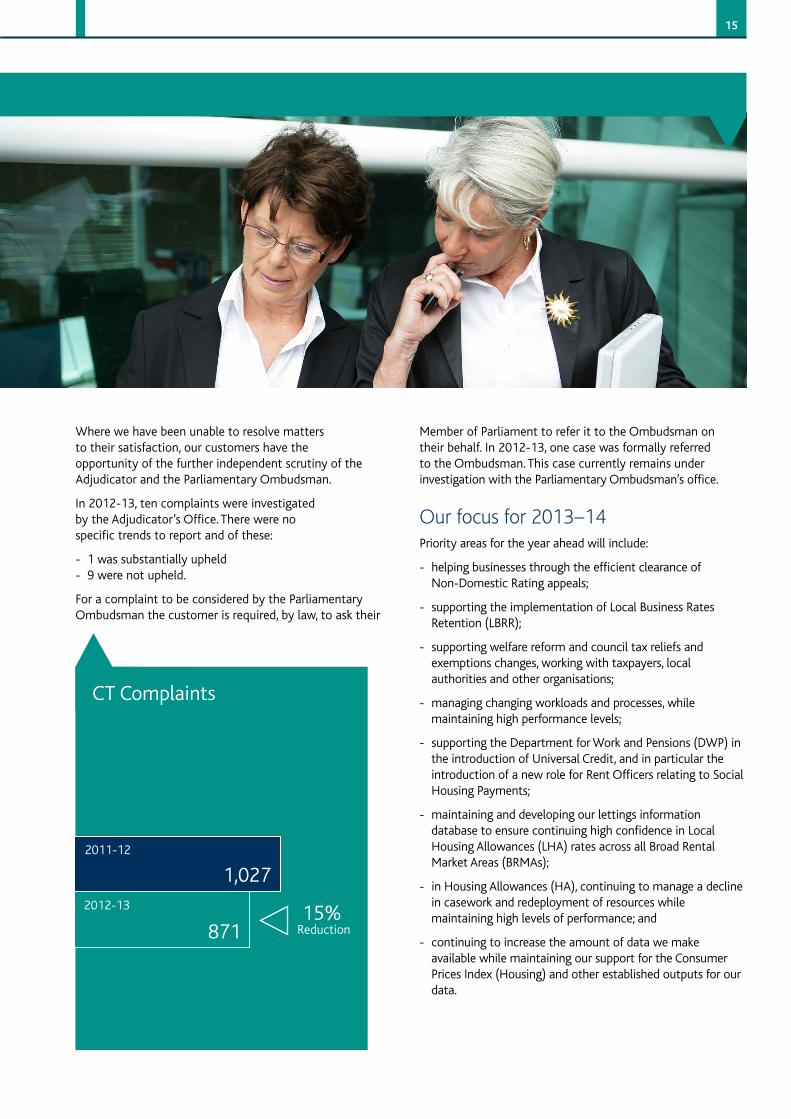
The number of Council Tax complaints we received also fell this year from 1,027 in 2011-12 to 871 during 2012-13. This is a reduction of 15%. The key themes from these complaints concern:
- the level of banding compared with that of neighbouring properties;- provision of sales information that we use to support our banding decisions.
2 The target figure of £15.0m was £14.8m in 2011-12.
33%Reduction
NDR Complaints
2011-12
2012-13
1,109
1,643
15
Where we have been unable to resolve matters to their satisfaction, our customers have the opportunity of the further independent scrutiny of the Adjudicator and the Parliamentary Ombudsman.
In 2012-13, ten complaints were investigated by the Adjudicator’s Office. There were no specific trends to report and of these:
- 1 was substantially upheld- 9 were not upheld.
For a complaint to be considered by the Parliamentary Ombudsman the customer is required, by law, to ask their
Member of Parliament to refer it to the Ombudsman on their behalf. In 2012-13, one case was formally referred to the Ombudsman. This case currently remains under investigation with the Parliamentary Ombudsman’s office.
Our focus for 2013–14Priority areas for the year ahead will include:
- helping businesses through the efficient clearance of Non-Domestic Rating appeals;
- supporting the implementation of Local Business Rates Retention (LBRR);
- supporting welfare reform and council tax reliefs and exemptions changes, working with taxpayers, local authorities and other organisations;
- managing changing workloads and processes, while maintaining high performance levels;
- supporting the Department for Work and Pensions (DWP) in the introduction of Universal Credit, and in particular the introduction of a new role for Rent Officers relating to Social Housing Payments;
- maintaining and developing our lettings information database to ensure continuing high confidence in Local Housing Allowances (LHA) rates across all Broad Rental Market Areas (BRMAs);
- in Housing Allowances (HA), continuing to manage a decline in casework and redeployment of resources while maintaining high levels of performance; and
- continuing to increase the amount of data we make available while maintaining our support for the Consumer Prices Index (Housing) and other established outputs for our data.
CT Complaints
15%Reduction
2011-12
2012-13
871
1,027
16 ValuationOfficeAgency Annual Report and Accounts 2012-13
Improving our Capability
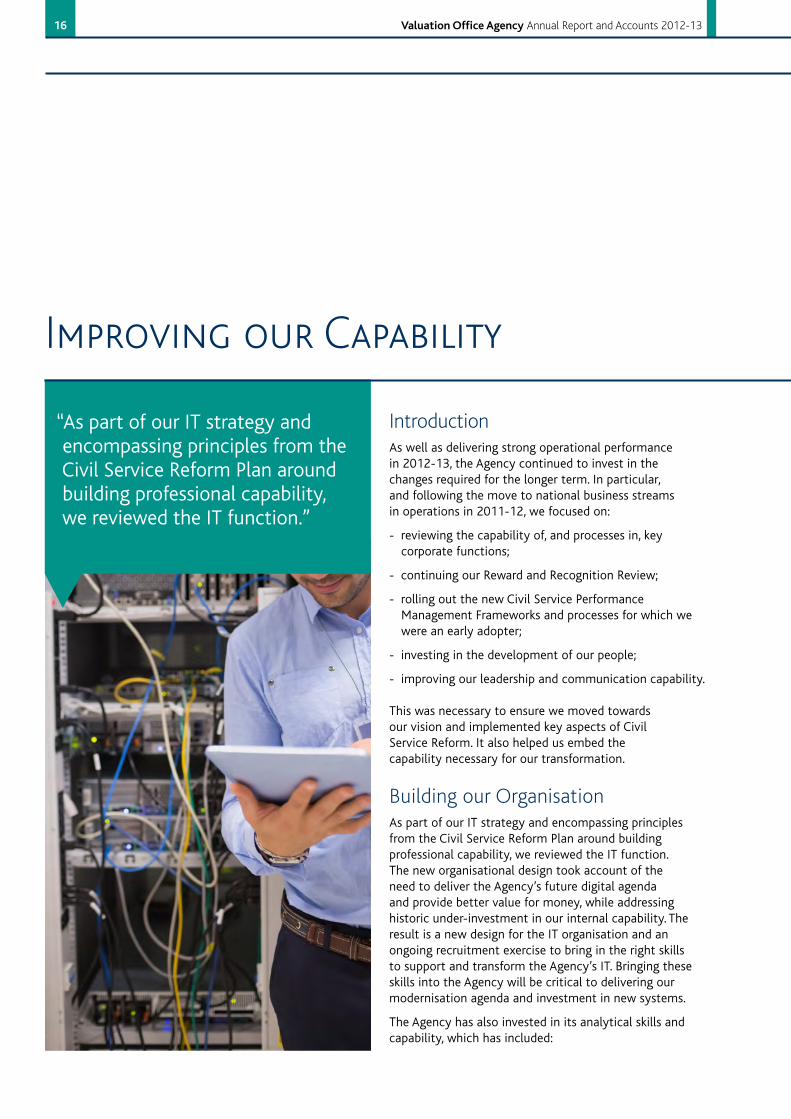
“As part of our IT strategy and encompassing principles from the Civil Service Reform Plan around building professional capability, we reviewed the IT function.”
IntroductionAs well as delivering strong operational performance in 2012-13, the Agency continued to invest in the changes required for the longer term. In particular, and following the move to national business streams in operations in 2011-12, we focused on:
- reviewing the capability of, and processes in, key corporate functions;
- continuing our Reward and Recognition Review;
- rolling out the new Civil Service Performance Management Frameworks and processes for which we were an early adopter;
- investing in the development of our people;
- improving our leadership and communication capability.
This was necessary to ensure we moved towards our vision and implemented key aspects of Civil Service Reform. It also helped us embed the capability necessary for our transformation.
Building our OrganisationAs part of our IT strategy and encompassing principles from the Civil Service Reform Plan around building professional capability, we reviewed the IT function. The new organisational design took account of the need to deliver the Agency’s future digital agenda and provide better value for money, while addressing historic under-investment in our internal capability. The result is a new design for the IT organisation and an ongoing recruitment exercise to bring in the right skills to support and transform the Agency’s IT. Bringing these skills into the Agency will be critical to delivering our modernisation agenda and investment in new systems.
The Agency has also invested in its analytical skills and capability, which has included:
17
- re-designing our Information and Analysis function to ensure we have the professional skills we need to help drive better decision making, support our clients and delivery partners, and contribute to the Government’s transparency agenda;
- providing statistical information to other government departments to inform their policy making and understanding of the role that property values play in the wider economy. This has included contributing to the Government’s new measure of inflation, the Consumer Prices Index (Housing) – CPIH;
- improving the frequency, quality and accessibility of our published Official Statistics; and
- carrying out primary research to collect feedback from those who come into contact with us, and using that feedback to deliver effective and evidence based change to the way we deal with taxpayers, their agents, and Local Authorities.
We also completed the organisational design by reviewing corporate activities previously embedded in operations. The review aimed to:
- align Unit administration, HR and Business Services functions – driving better delivery to the front line;
- align our delivery models with those being introduced by Civil Service HR and the Civil Service Reform Plan;
- centralise HR administration in line with Civil Service HR targets;
- look at the role of our Business Managers and introduce new Unit support teams.
We created a centralised HR Service team in Leeds and redesigned a number of other HR teams. We also introduced HR Advisors to provide direct support and upskilling for our operational managers.
A new team of regional Facilities Managers will support the management of our accommodation. We have reviewed many local support roles and appointed an Office Head for each location. We also put a new Customer Service structure in place and have undertaken initial work to review local IT support roles.
Reward, Recognition and Performance ManagementDuring 2012-13 we implemented the first stage of our comprehensive review of reward and recognition arrangements. On 1 August the Agency moved to a new pay system. This, together with this year’s pay award, has focused on tackling long-standing problems including pay progression and overly long pay scales. We have also introduced reward policies that better support our business needs. In 2013-14, the next stage of the review will concentrate on better aligning our reward and grading system with the rest of the Civil Service.
During the year, the Board took the difficult decision to freeze the pay of all staff on pay band maximums, which
affected around two thirds of our people. However, this enabled us to award pay increases to staff below the band maximum and increase pay band minimums while keeping within our overall 1% budget increase for pay.
Over the past two years the Agency has succeeded in almost halving the length of our longest pay scales (from around 40% to just over 20%). This means the structural cost of paying ordinary progression will fall significantly, making our pay system more sustainable and affordable.
From April 2012, we became early adopters of the new Civil Service Performance Management System and the Civil Service Competency Framework. These are key elements of the Civil Service Reform Plan. To support this development we delivered training to all our line managers in March 2012, which included focusing on the new Civil Service Managing Poor Performance policy.
Wellbeing and Health & SafetyThis year saw a slight increase in our average short term sickness absence rate – from 3.6 to 3.7 days (against a target of 4.0 days per person per year). Our average long term sickness absence rate went up from 3.3 days to 3.5 days (against a target of 3.0 days per person per year). We are investigating the reasons for the increase. We are also reinforcing the support we give our people.
The number of accidents reported in the Agency has continued in the downward trend of recent years.
There was a slight increase in the total number of health and safety reports received during the year because of thermal comfort issues in one office.
However, following a serious health and safety incident, the Board took immediate steps to understand and improve the management of the Agency’s health and safety risks. We:
- commissioned HMRC’s Health, Safety and Wellbeing team to carry out a management review to make sure we focused on the right areas;
- took immediate steps to increase people’s awareness of the issues; and
- made sure our people were clear about their responsibilities and know how to get the support and equipment they need.
During the year there were three injuries where recovery took more than seven days. The RIDDOR (Reporting of Injuries, Diseases and Dangerous Occurrences Regulations 1995) requires us to report these incidents to the Health and Safety Executive (HSE). There were 88 non-reportable injuries.
We have strong diversity and equal opportunity policies and are committed to the employment and development of people with disabilities. As part of our commitment we operate a guaranteed interview scheme for anyone with a disability whose application meets the minimum criteria for the post.
We also ensure our managers support and develop employees with disabilities and that our HR service
18 ValuationOfficeAgency Annual Report and Accounts 2012-13
44%
2011-12
46%
2012-13
team provides advice on putting in place reasonable adjustments. When implementing workplace changes we undertake Equality Impact Assessments to make sure we embed diversity and equality into everything we deliver. We match or exceed statutory requirements in offering our people a range of flexible working contracts.
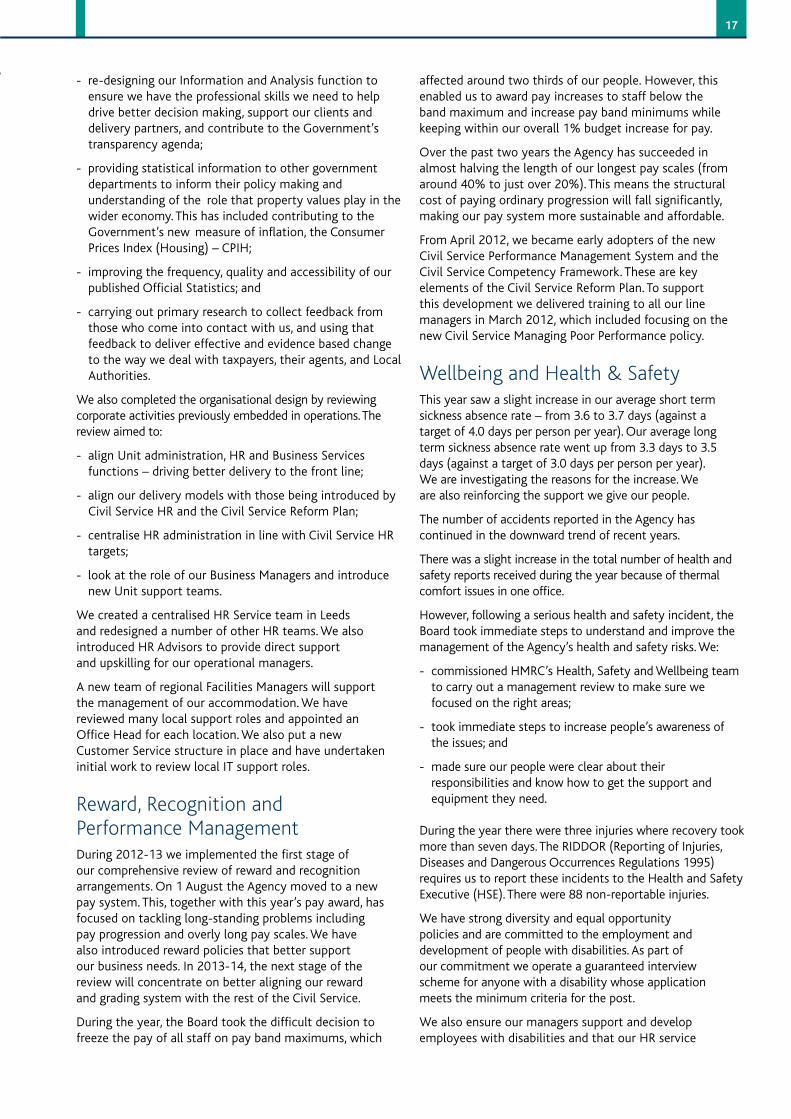
EngagementThe Agency’s Board was pleased our engagement score from the annual Civil Service People Survey increased from 44% in 2011 to 46% in 2012. Although still 12% below the Civil Service average of 58%, it was encouraging that we have reduced the gap.
A key driver was the improvement in our support for learning and development. Directors were also more visible and communicated more effectively with our people: visiting more offices; taking part in ‘back to the floor’ days; and holding Board meetings in the network.
We improved our internal communication channels. This included a complete overhaul of the Agency’s approach to change communication, with better planning and a dedicated change intranet site. We also made improvements to local communications between managers and our people by refreshing our primary face-to-face discussion and feedback channel, VOA Compass. This takes the form of a bulletin for line managers, written in a conversational tone with discussion points.
We recognise how important it is to listen and act on the feedback we now routinely gather from across the Agency and to make sure we continue to improve our leadership and communication.
DevelopmentOne of the key areas of focus for the Agency in 2012-13 has been to build the capabilities of our people. This work has included:
- conducting a ‘skills check’ of our people;
- putting in place a number of technical development schemes;
- engaging with the centralised Civil Service Learning team to ensure our people receive relevant training, at the right level and the right time;
- enabling a number of individuals to participate in Civil Service Local development programmes.
Our 2012 People Survey results for Learning and Development improved by 5% overall to a 39% positive score.
We offer training to our people to gain professional qualifications. This applies not only to those in operational roles undertaking surveying qualifications, but also to specialists in other Professions such as IT, HR, Analysis and Finance, who are also undertaking qualifications relevant to their profession. Congratulations to over 100 colleagues who achieved a qualification this year.
We have supported our Chief Operating Officer and Chief Valuer, as Head of Profession for surveying in the Agency, by working with the Government Property Asset Management profession to develop our surveying colleagues’ professional skills and capability.
We have begun to support operational colleagues, including those who identify with other Civil Service professions, by appointing a Head of Operational Delivery profession to engage with the Whitehall wide profession and identify opportunities for us to introduce the profession into the Agency.
For the second year, the Agency recruited apprentices to work towards an ICT Professional Apprenticeship qualification. In recognition of the need to recruit more IT experts, as we modernised this area of work, we worked with training providers in London and Worthing to design a programme for Level 2 (equivalent to five GCSEs) and Level 3 (equivalent to two A levels). The programme is continuously assessed and gives the apprentices a challenging and varied introduction to real IT. We are the first across Government to recruit apprentices to this particular programme.
RecruitmentOn 24 May 2010 the Coalition Government announced a freeze on all external recruitment in the Civil Service. The Chief Executive has delegated authority to recruit frontline staff for the Agency and exercised this authority a number of times during the year. Our organisational design work also identified a shortage of key corporate and specialist skills within the business to
“The Agency’s Board was pleased our engagement score from the annual Civil Service People Survey increased from 44% in 2011 to 46% in 2012. Although still 12% below the Civil Service average of 58%, it was encouraging that we have reduced the gap.”

19
support our reorganised structure and deliver our strategic objectives, especially in the areas of change and programme management, finance, IT and analysis. Having exhausted cross-government recruitment stages we have also sought and received approval for some targeted and limited external recruitment to fill some of these specialist posts.
In 2012-13 the Agency made external appointments of 149 people to the frontline and 24 to specialist roles. Some are short term appointments while we continue to carry out permanent recruitment.
20 ValuationOfficeAgency Annual Report and Accounts 2012-13
Sustainability Report
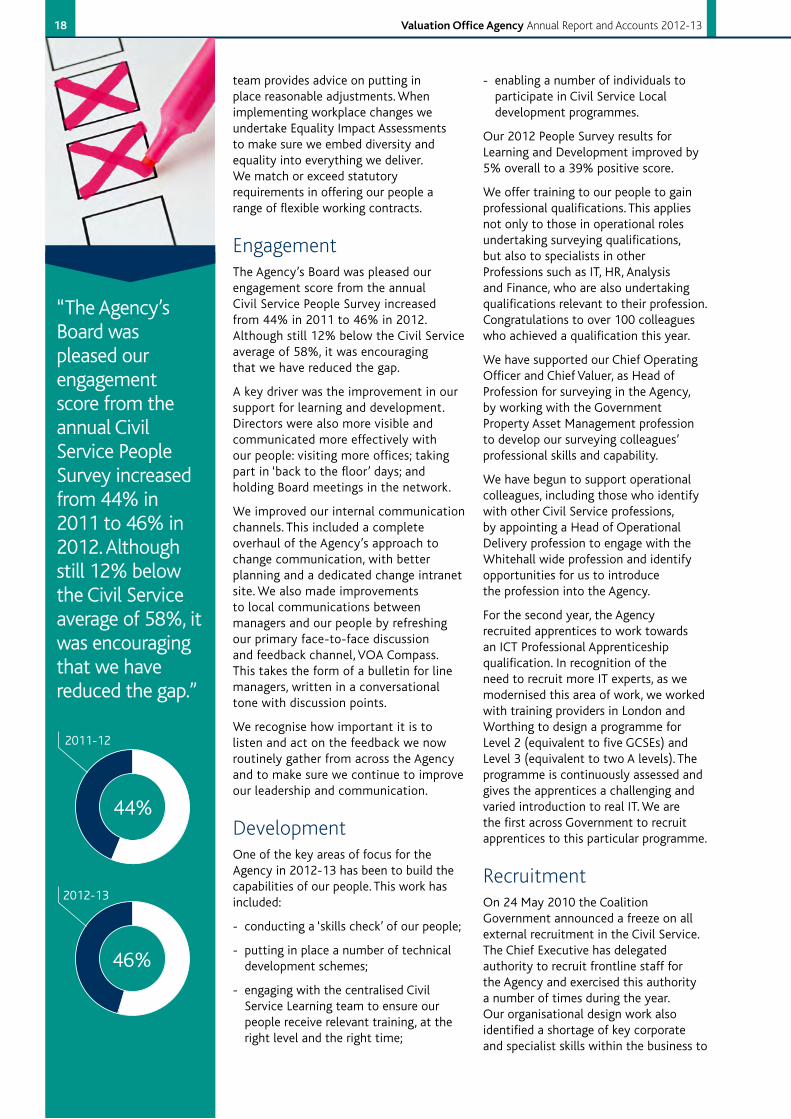
“We are committed to sustainable development and, as part of this, to reducing the environmental impact of our operations.”
IntroductionWe have continued during the year to embrace the need to adapt the way we operate to minimise our impact on the environment and help mitigate climate change.
Our working practices have to meet our customers’ needs. However we are committed to sustainable development and, as part of this, to reducing the environmental impact of our operations. We conduct these to reflect, as far as practicable, best environmental, social and economic sustainability.
In particular we have:
- procured goods and services from suppliers who take a strong approach to sustainable operations;
- regularly reviewed our activities and operations to identify environmental aspects and prioritise action to address their impacts; and
- monitored and reported on progress against the Cabinet Office’s cross-government Greening Government Commitments.
In the future we will look to:
- support our clients in developing policies that have embedded sustainability principles;
- develop and maintain an environmental management system to pursue sustainability, continual improvement and the prevention of pollution; and
- raise our people’s awareness of our sustainable operations agenda across the Agency through specific training and encourage people to participate where appropriate.
As part of major office refurbishment in Gloucester and Swansea we are piloting the use of energy efficient lighting. If our reviews are as positive as we expect, we’ll extend this to other schemes where possible in 2013-14.
We have continued to make sure that we routinely consider rural aspects as part of the planning and decision making process.
21
“We are committed to reducing our estate further during 2013-14 and we have set a target of releasing a further 7,500m2.”
Summary of Performance We set a target to reduce greenhouse gas emissions mainly based on reducing our estate and controlling official travel. We had notable success in delivering our overall target. However, some of the individual elements actually increased our emissions in comparison to last year.
In our Carbon Abatement Plan for 2012-13, we estimated that we would save 159 CO2 tonnes in energy usage. The prediction was based solely on two major office rationalisation plans. In reality we achieved a significantly higher reduction of 884 CO2 tonnes as a result of reducing our accommodation by over 8.5%.
Summary of Future StrategyWe are committed to reducing our estate further during 2013-14 and we have set a target of releasing a further 7,500m2. This equates to approximately 14% of our office space and should have a significant impact on our carbon emissions. In many cases, we have plans to relocate to existing civil estate. This will make a significant saving in financial and sustainability terms.
We are committed to working with HMRC to modernise our existing sustainability plans. We will share their expertise to make sure we meet Government targets and address the wider business and people awareness issues.
At a practical level we will:
- incorporate sustainable options in our major estates projects;
- analyse specific business streams’ travel data to look for opportunities to introduce improved working practices and reduce travel;
- look for improvements by installing modern controls on hot water heaters, dispensing with kettles and removing fan heaters to reduce energy consumption; and
- expand our recycling schemes to give 100% coverage across our locations.
22 ValuationOfficeAgency Annual Report and Accounts 2012-13
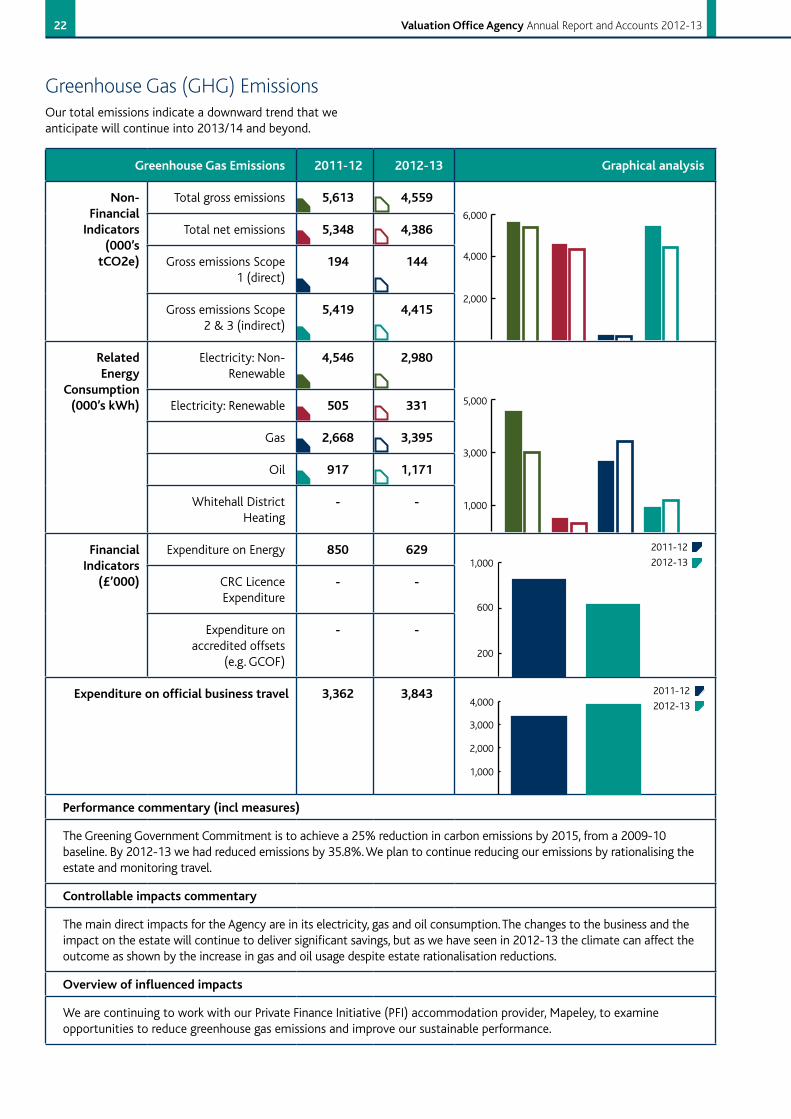
Greenhouse Gas (GHG) EmissionsOur total emissions indicate a downward trend that we anticipate will continue into 2013/14 and beyond.
GreenhouseGasEmissions 2011-12 2012-13 Graphicalanalysis
Non-FinancialIndicators
(000’stCO2e)
Total gross emissions 5,613 4,559
Total net emissions 5,348 4,386
Gross emissions Scope 1 (direct)
194 144
Gross emissions Scope 2 & 3 (indirect)
5,419 4,415
RelatedEnergy
Consumption(000’skWh)
Electricity: Non-Renewable
4,546 2,980
Electricity: Renewable 505 331
Gas 2,668 3,395
Oil 917 1,171
Whitehall District Heating
- -
FinancialIndicators(£’000)
Expenditure on Energy 850 629
CRC Licence Expenditure
- -
Expenditure on accredited offsets
(e.g. GCOF)
- -
Expenditureonofficialbusinesstravel 3,362 3,843
Performancecommentary(inclmeasures)
The Greening Government Commitment is to achieve a 25% reduction in carbon emissions by 2015, from a 2009-10 baseline. By 2012-13 we had reduced emissions by 35.8%. We plan to continue reducing our emissions by rationalising the estate and monitoring travel.
Controllableimpactscommentary
The main direct impacts for the Agency are in its electricity, gas and oil consumption. The changes to the business and the impact on the estate will continue to deliver significant savings, but as we have seen in 2012-13 the climate can affect the outcome as shown by the increase in gas and oil usage despite estate rationalisation reductions.
Overviewofinfluencedimpacts
We are continuing to work with our Private Finance Initiative (PFI) accommodation provider, Mapeley, to examine opportunities to reduce greenhouse gas emissions and improve our sustainable performance.
6,000
4,000
2,000
5,000
3,000
1,000
2012-13
2011-12
1,000
600
200
3,000
2,000
1,000
4,000 2012-13
2011-12
23
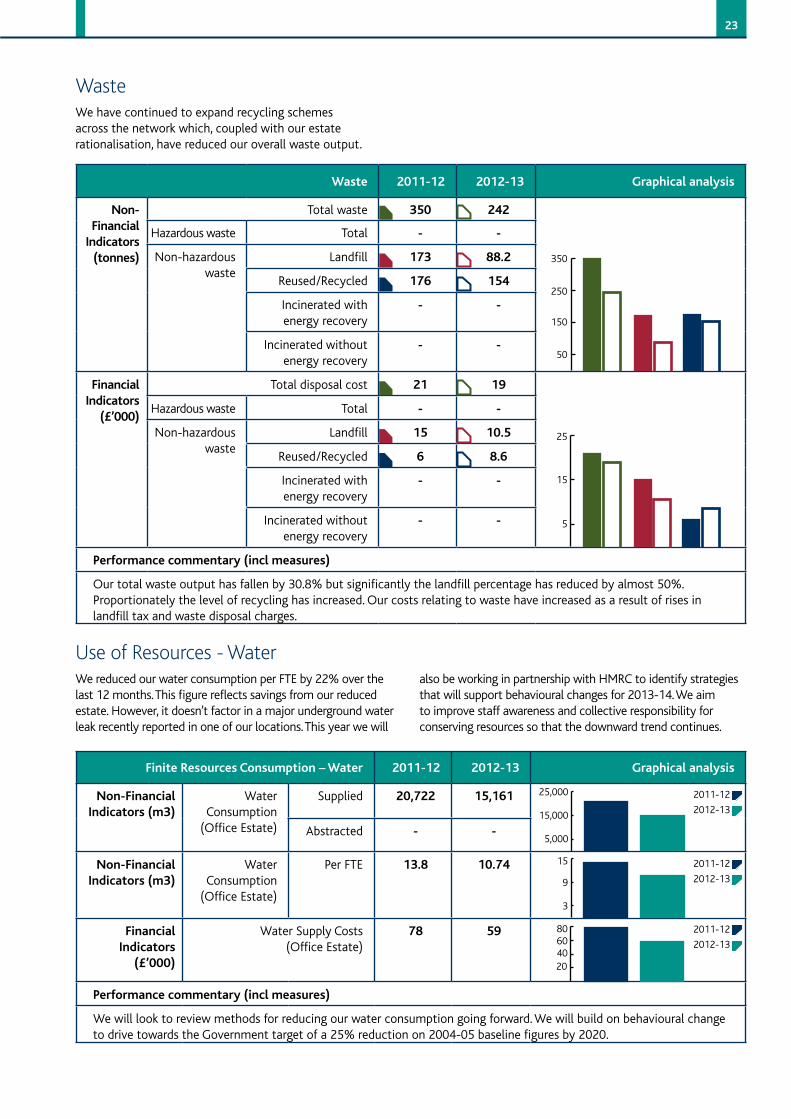
WasteWe have continued to expand recycling schemes across the network which, coupled with our estate rationalisation, have reduced our overall waste output.
Waste 2011-12 2012-13 Graphicalanalysis
Non-FinancialIndicators(tonnes)
Total waste 350 242
Hazardous waste Total - -
Non-hazardous waste
Landfill 173 88.2
Reused/Recycled 176 154
Incinerated with energy recovery
- -
Incinerated without energy recovery
- -
FinancialIndicators(£’000)
Total disposal cost 21 19
Hazardous waste Total - -
Non-hazardous waste
Landfill 15 10.5
Reused/Recycled 6 8.6
Incinerated with energy recovery
- -
Incinerated without energy recovery
- -
Performancecommentary(inclmeasures)
Our total waste output has fallen by 30.8% but significantly the landfill percentage has reduced by almost 50%. Proportionately the level of recycling has increased. Our costs relating to waste have increased as a result of rises in landfill tax and waste disposal charges.
FiniteResourcesConsumption–Water 2011-12 2012-13 Graphicalanalysis
Non-FinancialIndicators(m3)
Water Consumption
(Office Estate)
Supplied 20,722 15,161
Abstracted - -
Non-FinancialIndicators(m3)
Water Consumption
(Office Estate)
Per FTE 13.8 10.74
FinancialIndicators(£’000)
Water Supply Costs (Office Estate)
78 59
Performancecommentary(inclmeasures)
We will look to review methods for reducing our water consumption going forward. We will build on behavioural change to drive towards the Government target of a 25% reduction on 2004-05 baseline figures by 2020.
Use of Resources - WaterWe reduced our water consumption per FTE by 22% over the last 12 months. This figure reflects savings from our reduced estate. However, it doesn’t factor in a major underground water leak recently reported in one of our locations. This year we will
also be working in partnership with HMRC to identify strategies that will support behavioural changes for 2013-14. We aim to improve staff awareness and collective responsibility for conserving resources so that the downward trend continues.
250
150
50
25
15
5
25,000
15,000
5,000
15
9
3
2012-13
2011-12
2012-13
2011-12
80604020
2012-13
2011-12
350
24 ValuationOfficeAgency Annual Report and Accounts 2012-13
Climate change adaptation and mitigationHMRC, our sponsor department, is working towards publishing an Estates Climate Mitigation Policy, with the intention of significantly minimising impact on the environment. The vision will be ‘to have greener operations’. We will adopt this policy where possible. This will cover all the sites where we procure energy directly.
Biodiversity and natural environmentWe have no sites of scientific interest and locations with green areas account for less than 5% of our estate.
Having identified Colchester and Shrewsbury as sites where we have control over green areas, we are engaging with our PFI providers to promote, conserve, and enhance biodiversity.
The steps we can take towards supporting and promoting biodiversity are limited. However, we are committed to exploring opportunities for promoting it, especially where we share space in HMRC buildings.
Sustainable procurement including foodOur Procurement Framework promotes the principles of sustainable procurement to generate social, economic and environmental benefits and opportunities. The framework will:
- make sure we comply with Government sustainability requirements;
- outline the minimum standards we expect from all our suppliers; and
- cover our suppliers’ approach to a range of sustainability issues relating to their environmental, social and ethical performance.
We will introduce the framework by July 2013 and will document our future approach for all contracting activity.
The framework will encourage sustainable considerations as standard, for example environmental accreditations, reductions in costs and use of sub-contractors to support the Small and Medium-sized Enterprise agenda. This will ensure that we establish our procurement and eventual contract documents on the back of sustainable evaluation.
We will continuously develop the knowledge and skills of our procurement people to support this new approach. Our Procurement professionals will keep abreast of all sustainability requirements and considerations as part of their continued professional development.
The Flexible Framework for Sustainable Procurement is a recognised and effective method to improve sustainable activity. To date the Agency has not implemented it but we plan to move to this approach following the launch of the procurement framework.
Sustainable constructionMapeley, our PFI accommodation provider, carries out most of the major refurbishment within our locations. Our agreement with Mapeley complies with our departmental environmental requirements and enables sustainable construction by making sure:
- all records are auditable and comply with ISO 14001;
- all wood is from an independently-verified sustainable source;
- all spent fluorescent tubes and rechargeable batteries are recycled;
- there is a system to ensure legal compliance with all duty of care legislation for all waste streams;
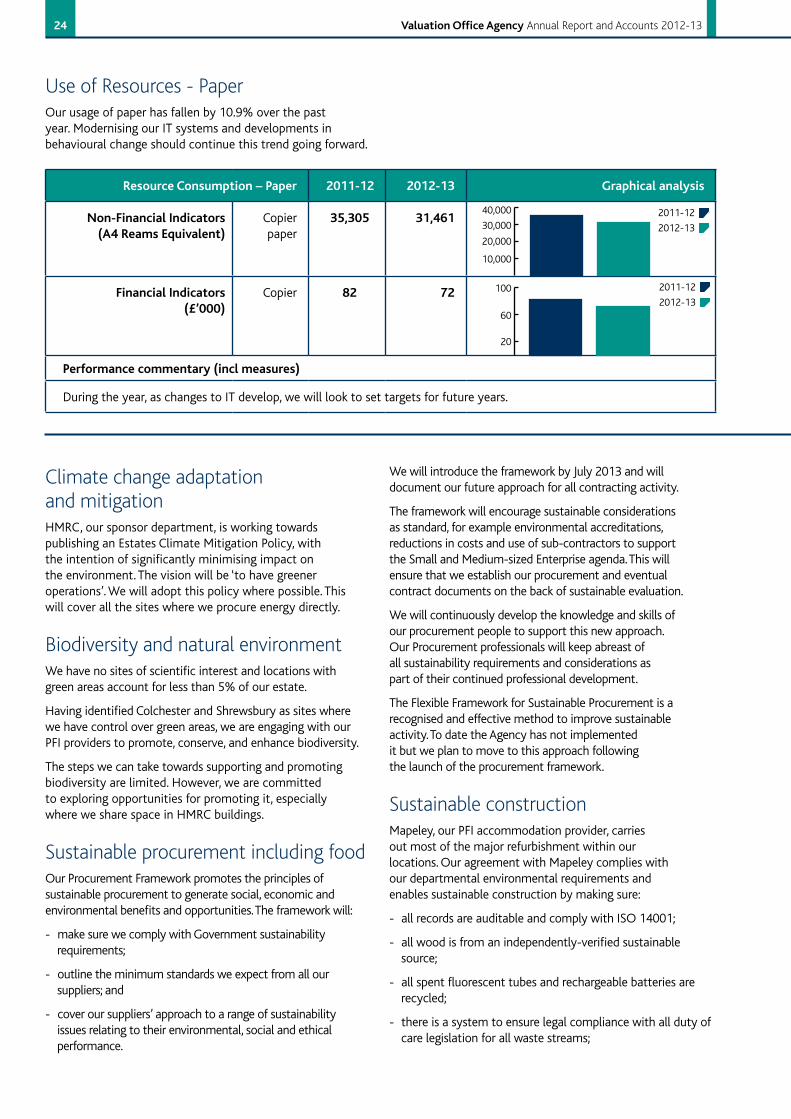
ResourceConsumption–Paper 2011-12 2012-13 Graphicalanalysis
Non-FinancialIndicators(A4ReamsEquivalent)
Copier paper
35,305 31,461
FinancialIndicators(£’000)
Copier 82 72
Performancecommentary(inclmeasures)
During the year, as changes to IT develop, we will look to set targets for future years.
Use of Resources - PaperOur usage of paper has fallen by 10.9% over the past year. Modernising our IT systems and developments in behavioural change should continue this trend going forward.
2012-13
2011-1230,000
20,000
10,000
40,000
2012-13
2011-12100
60
20
25
- procurement follows environmental procurement guidelines (PUG 177/97);
- all service providers comply; and
- no peat is used at any of the sites.
Additionally when the refurbishment cost is more than £250,000 we stipulate that work is carried out to a ‘very good’ or ‘excellent’ BREEAM rating, including making sure:
- there is no venting of recoverable ozone-depleting or global warming substances from any equipment used on our behalf; and
- that substances are recovered for recycling or destruction using appropriate technology.
At all other times Mapeley will, so far as is reasonably practicable:
- conserve resources;- reduce pollution;- protect bio-diversity; and- support the Government’s vision of sustainable development.
PeopleWe are committed to promoting our people’s wellbeing by enhancing the working environment, with better finishes, improved heating, cooling and lighting. We are working to reduce the space we use in accordance with the Government Property Unit standards while retaining a balanced and comfortable environment through good space planning and sensible ergonomic design. Environmental design and sustainability are key deliverables in all office refurbishments/refits and space rationalisation projects.
Environmental Management System (EMS)We are developing an Environmental Management System to provide an overall framework to establish systems and processes necessary for the systematic management of energy. This will ultimately make sure we:
- improve our energy efficiency; - reduce costs; and - reduce greenhouse gas emissions.
“Our Procurement Professionals will keep abreast of all sustainability requirements and considerations as part of their continued professional development.”
26 ValuationOfficeAgency Annual Report and Accounts 2012-13
Remuneration Report
Directors’ remuneration Executive Directors are members of the Senior Civil Service and are subject to the terms and conditions applicable across our sponsor department, HM Revenue & Customs (HMRC). HMRC determines their remuneration within Senior Civil Service pay policy guidelines. There is a separate remuneration committee within the Agency which inputs to performance moderation and objective setting but the Main Pay Committee in HMRC makes the final decisions.
Specific objectives are set for the Executive Directors using the Senior Civil Service performance management processes. Objectives are regularly reviewed and formally reported on at the end of each year. The Chief Executive also has regular reviews with the Non-Executive Directors. The Chief Executive of HMRC reviews the performance of the Agency’s CEO against agreed objectives.
Contracts, notice periods and termination periodsThe majority of our people, including the Executive Directors, are employed on a permanent basis and are subject to statutory and Civil Service conditions of service. The Non-Executive Directors are on renewable three year fixed-term contracts, with the assumption that we will not renew their contracts more than once. We employ a small number of our people on short-term contracts.
We did not make any awards to past managers this year or in previous years.
We did not make non-cash awards to Board members this year or in previous years.
Salary and pension entitlements The following section details the remuneration and pension interest of our most senior people.
27
SalariesThese include:
- gross salary;- overtime;3 - reserved rights to London weighting or London allowances; 4 - recruitment and retention allowance; and- Private Office allowances and any other allowance to the extent that it is subject to UK taxation.5
BonuspaymentsThese are based on the performance level an individual achieves and are part of HMRC’s appraisal process. The bonuses reported in 2012-13 relate to performance in 2011-12. We pay performance-related pay and bonuses in line with the scheme which applies to the Senior Civil Service as a whole.
BenefitsinkindThe monetary value of benefits in kind covers any benefits an employer provides and HMRC treats as a taxable emolument. The benefits in kind in the table on pages 29 and 31 for Board members relate to travel and subsistence expenses. Members incurred these expenses when it was necessary for them to be at a second or more permanent place of work.
One Board member receives childcare vouchers, paid for through a salary sacrifice scheme.
Compensation/thirdpartypaymentsWe did not make compensation payments to former senior managers this year or in previous years.
We did not pay any amounts to third party entities for Directors’ services during the year (2011-12 £nil).
CivilServicepensionsPension benefits are provided through the Civil Service pension arrangements. From 30 July 2007, civil servants may be in one of four defined benefit schemes: either a final salary scheme (classic, premium or classic plus); or a whole career scheme (nuvos). These statutory arrangements are unfunded with the cost of benefits met by monies voted by Parliament each year. Pensions payable under classic, premium, classic plus and nuvos are increased annually in line with Pensions Increase legislation. Members joining from October 2002 may opt for either the appropriate defined benefit arrangement or a ‘money purchase’ stakeholder pension with an employer contribution (partnership pension account).
Employee contributions are salary-related and range between 1.5% and 3.9% of pensionable earnings for classic and 3.5% and 5.9% for premium, classic plus and nuvos. Increases to employee contributions will apply from 1 April 2013. Benefits in classic accrue at the rate of 1/80th of final pensionable earnings for each year of service. In addition, a lump sum equivalent to three years initial pension is payable on retirement. For premium, benefits accrue at the rate of 1/60th of final pensionable earnings for each year of service. Unlike classic, there is no automatic lump sum. Classic plus is essentially a hybrid with benefits for service before 1 October 2002 calculated broadly as
per classic and benefits for service from October 2002 worked out as in premium. In nuvos a member builds up a pension based on their pensionable earnings during their period of scheme membership. At the end of the scheme year (31 March) the member’s earned pension account is credited with 2.3% of their pensionable earnings in that scheme year and the accrued pension is uprated in line with Pensions Increase legislation. In all cases members may opt to give up (commute) pension for a lump sum up to the limits set by the Finance Act 2004.
The partnership pension account is a stakeholder pension arrangement. The employer makes a basic contribution of between 3% and 12.5% (depending on the age of the member) into a stakeholder pension product chosen by the employee from a panel of three providers. The employee does not have to contribute, but where they do make contributions, the employer will match these up to a limit of 3% of pensionable salary (in addition to the employer’s basic contribution). Employers also contribute a further 0.8% of pensionable salary to cover the cost of centrally-provided risk benefit cover (death in service and ill health retirement).
The accrued pension quoted is the pension the member is entitled to receive when they reach pension age, or immediately on ceasing to be an active member of the scheme if they are already at or over pension age. Pension age is 60 for members of classic, premium and classic plus and 65 for members of nuvos.
Further details about the Civil Service pension arrangements can be found at the website: http://www.civilservice.gov.uk/pensions
CashEquivalentTransferValuesA Cash Equivalent Transfer Value (CETV):
- is the actuarially assessed capital value of the pension scheme benefits which a member accrues at a particular point in time. (The benefits valued are the member’s accrued benefits and any contingent spouse’s pension payable from the scheme);
- is paid by a pension scheme or arrangement to secure pensions benefits in another pension scheme or arrangement, when the member leaves a scheme and chooses to transfer the benefits accrued in their former scheme;
- is calculated in accordance with The Occupational Pension Schemes (Transfer Values) (Amendment) Regulations; and
- does not take account of any actual or potential reduction to benefits resulting from Lifetime Allowance Tax, which may be due when pension benefits are taken.
The pension figures shown relate to the benefits that individuals accrued as a result of their total membership of the pension scheme, not just their service in a senior capacity, to which disclosure applies. The figures include the value of any pension benefit in another scheme or arrangement, which the individual has transferred to the Civil Service pension arrangements. They also include any additional pension benefit accrued as a result of the member buying additional pension benefits at their own cost.
3-5 No such payments were made during 2012-13.
28 ValuationOfficeAgency Annual Report and Accounts 2012-13
Real increase in CETV is the increase that the employer funds. It does not include:
- the increase in accrued pension due to inflation; nor
- contributions paid by the employee (including the value of any benefits transferred from another pension scheme or arrangement) and uses common market valuation factors for the start and end of the period.
Travel and Subsistence reimbursementsBoard members received payments to reimburse the out of pocket expenses they incurred in carrying out their duties as set out in the table on page 29.
Except where identified as such, the payments in the table on page 31 do not form part of remuneration.
Pay multiplesThe pay multiple of the remuneration of the highest-paid Board member compared to the average remuneration of the workforce is in the table on page 29.
The banded remuneration of the highest-paid Board member in the Agency in 2012-13 was: £135-140k (2011-12: £120-125k). This was 5.20 times (2011-12: 4.50) the average remuneration of the workforce, which was: £26,438 (2011-12: £27,248).
Total remuneration includes:
- salary;- non-consolidated performance-related pay;- benefits in kind; and- any severance payments.6
It does not include employer pension contributions and the cash equivalent transfer value of pensions.
The ratio of the remuneration of our highest-paid Board member to the average remuneration of our people has increased since 2011-12. This is largely due to the following:
- the total remuneration of our highest-paid Board member (the Chief Operating Officer and Chief Valuer) has increased from £120-125k in 2011-12 to £135-140k in 2012-13; and
- the average remuneration of the workforce has decreased from £27,248 in 2011-12 to £26,438 in 2012-13.
In 2012-13:
- one (18 in 2011-12) employee received remuneration in excess of the highest-paid Board member. All earned a salary below that of the highest-paid Board member, but had larger total remuneration in the year due to one-off severance payments.
- including severance, remuneration ranged from £14,100 to £165,000-170,000 (2011-12: £13,000 to £230,000- 235,000); and
- excluding severance, remuneration ranged from £14,100 to £135,000-140,000 (2011-12: £13,000 to £120,000- 125,000).
For comparison purposes we have estimated equivalent contractor salaries from their day rates. Where practical, we have taken into account the different terms that contractors have compared to civil servants.
6 No such payments were made during 2012-13.
29
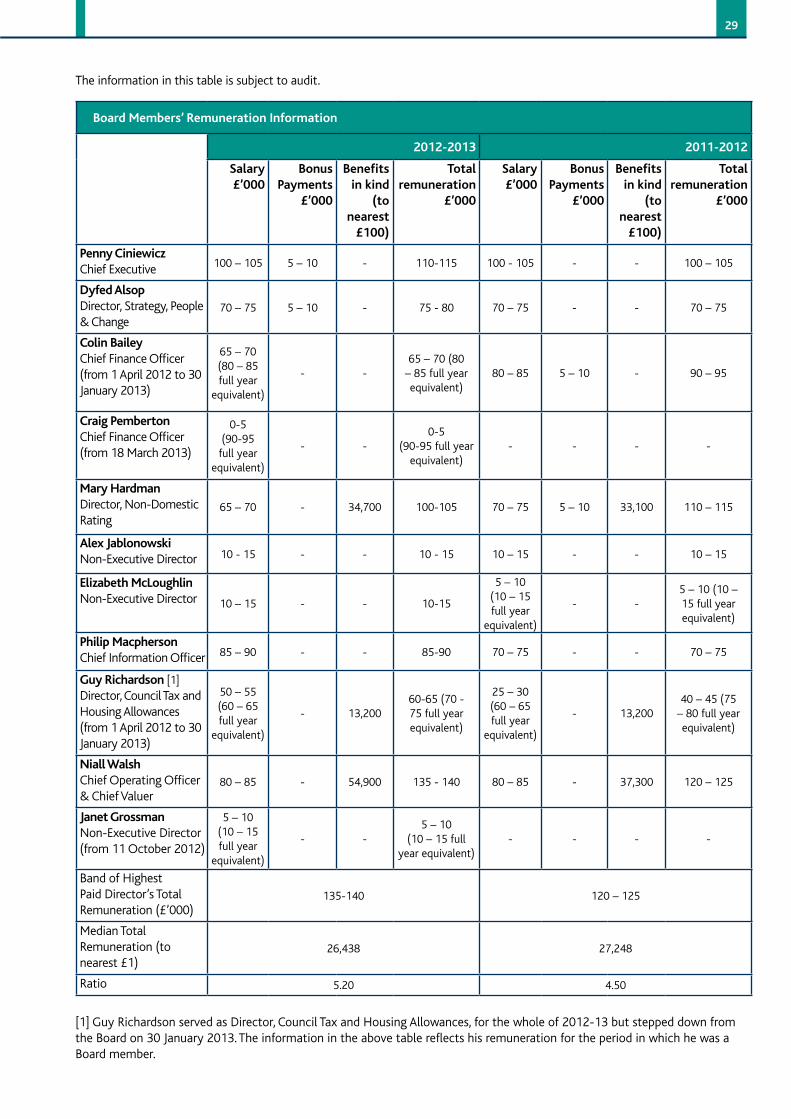
The information in this table is subject to audit.
BoardMembers’RemunerationInformation
2012-2013 2011-2012
Salary£’000
BonusPayments
£’000
Benefitsin kind
(tonearest £100)
Total remuneration
£’000
Salary£’000
BonusPayments
£’000
Benefitsin kind
(tonearest £100)
Total remuneration
£’000
PennyCiniewiczChief Executive 100 – 105 5 – 10 - 110-115 100 - 105 - - 100 – 105
DyfedAlsopDirector, Strategy, People & Change
70 – 75 5 – 10 - 75 - 80 70 – 75 - - 70 – 75
ColinBaileyChief Finance Officer (from 1 April 2012 to 30 January 2013)
65 – 70 (80 – 85 full year
equivalent)
- -65 – 70 (80
– 85 full year equivalent)
80 – 85 5 – 10 - 90 – 95
CraigPembertonChief Finance Officer(from 18 March 2013)
0-5(90-95 full year
equivalent)
- -0-5
(90-95 full year equivalent)
- - - -
MaryHardmanDirector, Non-Domestic Rating
65 – 70 - 34,700 100-105 70 – 75 5 – 10 33,100 110 – 115
AlexJablonowskiNon-Executive Director 10 - 15 - - 10 - 15 10 – 15 - - 10 – 15
ElizabethMcLoughlinNon-Executive Director 10 – 15 - - 10-15
5 – 10 (10 – 15 full year
equivalent)
- -5 – 10 (10 – 15 full year equivalent)
PhilipMacphersonChief Information Officer 85 – 90 - - 85-90 70 – 75 - - 70 – 75
GuyRichardson[1] Director, Council Tax and Housing Allowances(from 1 April 2012 to 30 January 2013)
50 – 55 (60 – 65 full year
equivalent)
- 13,20060-65 (70 - 75 full year equivalent)
25 – 30(60 – 65 full year
equivalent)
- 13,20040 – 45 (75
– 80 full year equivalent)
NiallWalshChief Operating Officer & Chief Valuer
80 – 85 - 54,900 135 - 140 80 – 85 - 37,300 120 – 125
JanetGrossmanNon-Executive Director (from 11 October 2012)
5 – 10(10 – 15 full year
equivalent)
- -5 – 10
(10 – 15 full year equivalent)
- - - -
Band of Highest Paid Director’s Total Remuneration (£’000)
135-140 120 – 125
Median Total Remuneration (to nearest £1)
26,438 27,248
Ratio 5.20 4.50
[1] Guy Richardson served as Director, Council Tax and Housing Allowances, for the whole of 2012-13 but stepped down from the Board on 30 January 2013. The information in the above table reflects his remuneration for the period in which he was a Board member.
30 ValuationOfficeAgency Annual Report and Accounts 2012-13
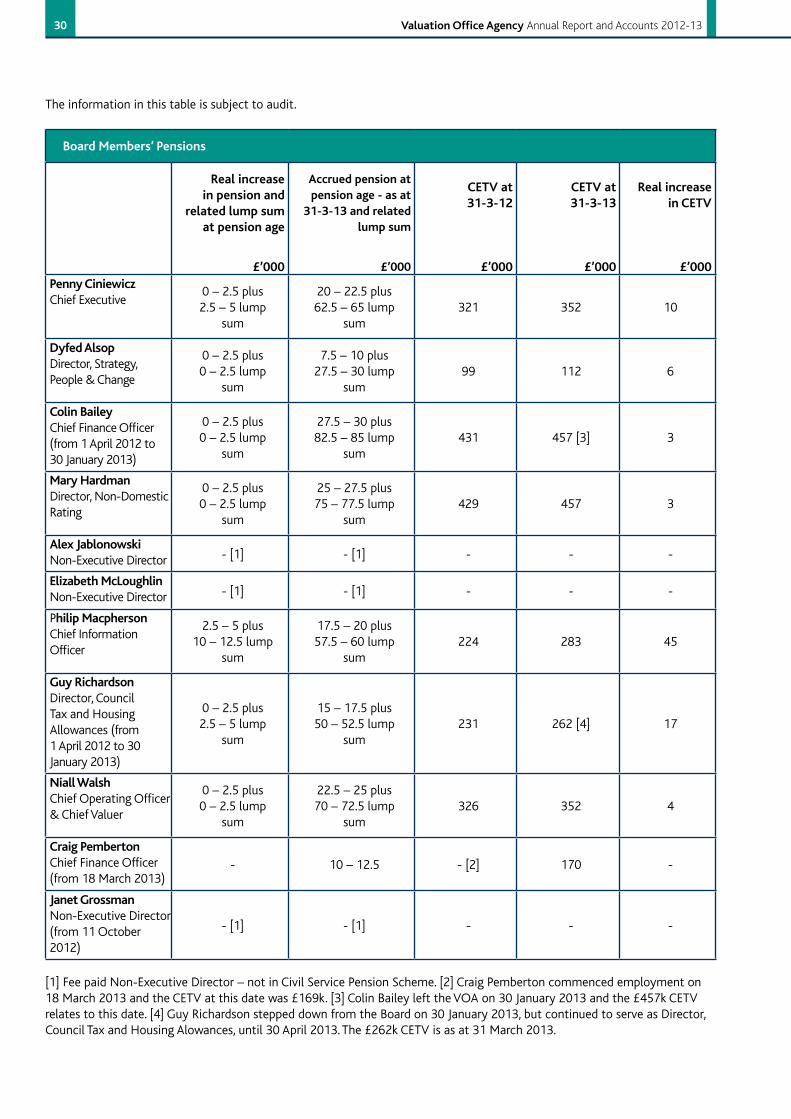
The information in this table is subject to audit.
Board Members’ Pensions
Real increase in pension and
related lump sum at pension age
£’000
Accrued pension at pension age - as at
31-3-13 and related lump sum
£’000
CETV at 31-3-12
£’000
CETV at 31-3-13
£’000
Real increase in CETV
£’000PennyCiniewicz Chief Executive
0 – 2.5 plus 2.5 – 5 lump
sum
20 – 22.5 plus 62.5 – 65 lump
sum321 352 10
DyfedAlsop Director, Strategy, People & Change
0 – 2.5 plus 0 – 2.5 lump
sum
7.5 – 10 plus27.5 – 30 lump
sum99 112 6
Colin Bailey Chief Finance Officer (from 1 April 2012 to 30 January 2013)
0 – 2.5 plus 0 – 2.5 lump
sum
27.5 – 30 plus 82.5 – 85 lump
sum431 457 [3] 3
Mary Hardman Director, Non-Domestic Rating
0 – 2.5 plus 0 – 2.5 lump
sum
25 – 27.5 plus75 – 77.5 lump
sum429 457 3
Alex Jablonowski Non-Executive Director - [1] - [1] - - -
ElizabethMcLoughlin Non-Executive Director - [1] - [1] - - -
Philip Macpherson Chief Information Officer
2.5 – 5 plus 10 – 12.5 lump
sum
17.5 – 20 plus57.5 – 60 lump
sum224 283 45
Guy Richardson Director, Council Tax and Housing Allowances (from 1 April 2012 to 30 January 2013)
0 – 2.5 plus2.5 – 5 lump
sum
15 – 17.5 plus50 – 52.5 lump
sum231 262 [4] 17
NiallWalsh Chief Operating Officer & Chief Valuer
0 – 2.5 plus0 – 2.5 lump
sum
22.5 – 25 plus70 – 72.5 lump
sum326 352 4
Craig Pemberton Chief Finance Officer(from 18 March 2013)
- 10 – 12.5 - [2] 170 -
JanetGrossman Non-Executive Director (from 11 October 2012)
- [1] - [1] - - -
[1] Fee paid Non-Executive Director – not in Civil Service Pension Scheme. [2] Craig Pemberton commenced employment on 18 March 2013 and the CETV at this date was £169k. [3] Colin Bailey left the VOA on 30 January 2013 and the £457k CETV relates to this date. [4] Guy Richardson stepped down from the Board on 30 January 2013, but continued to serve as Director, Council Tax and Housing Alowances, until 30 April 2013. The £262k CETV is as at 31 March 2013.
31
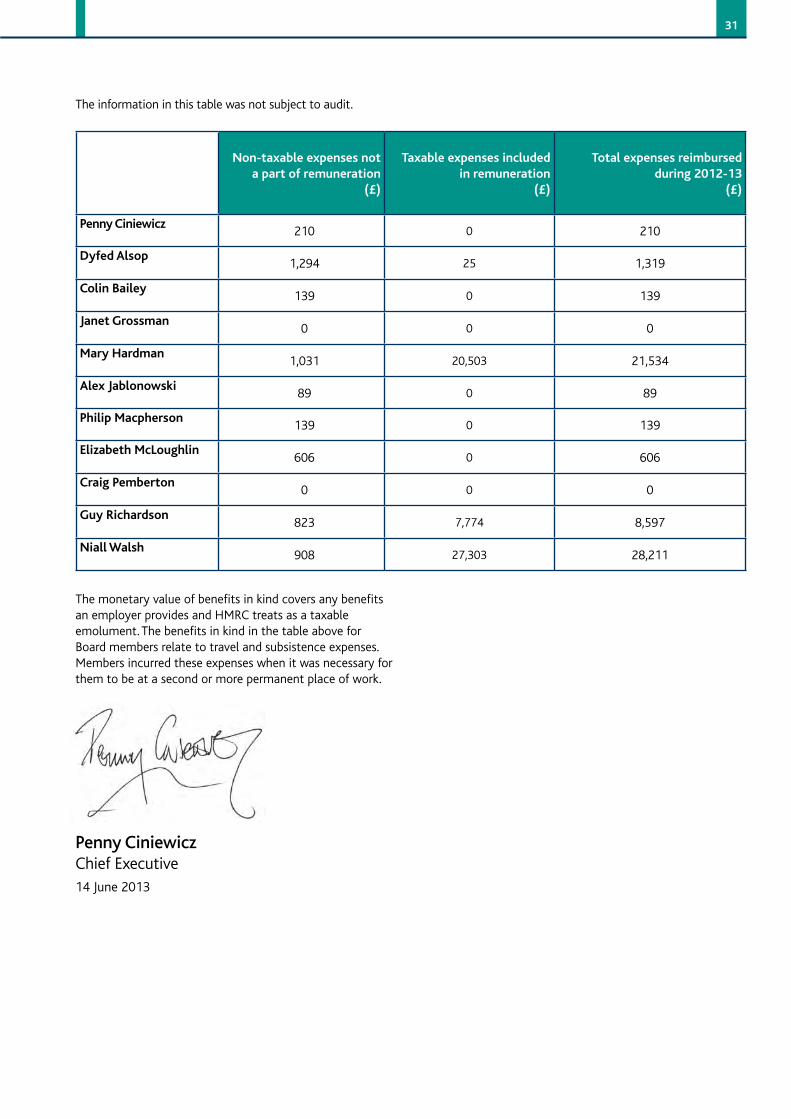
The information in this table was not subject to audit.
Non-taxableexpensesnotapartofremuneration
(£)
Taxableexpensesincludedinremuneration
(£)
Totalexpensesreimbursedduring2012-13
(£)
PennyCiniewicz210 0 210
DyfedAlsop1,294 25 1,319
ColinBailey139 0 139
JanetGrossman0 0 0
MaryHardman1,031 20,503 21,534
AlexJablonowski89 0 89
PhilipMacpherson139 0 139
ElizabethMcLoughlin606 0 606
CraigPemberton0 0 0
GuyRichardson823 7,774 8,597
NiallWalsh908 27,303 28,211
Penny Ciniewicz Chief Executive14 June 2013
The monetary value of benefits in kind covers any benefits an employer provides and HMRC treats as a taxable emolument. The benefits in kind in the table above for Board members relate to travel and subsistence expenses. Members incurred these expenses when it was necessary for them to be at a second or more permanent place of work.
32 ValuationOfficeAgency Annual Report and Accounts 2012-13
Financial Commentary
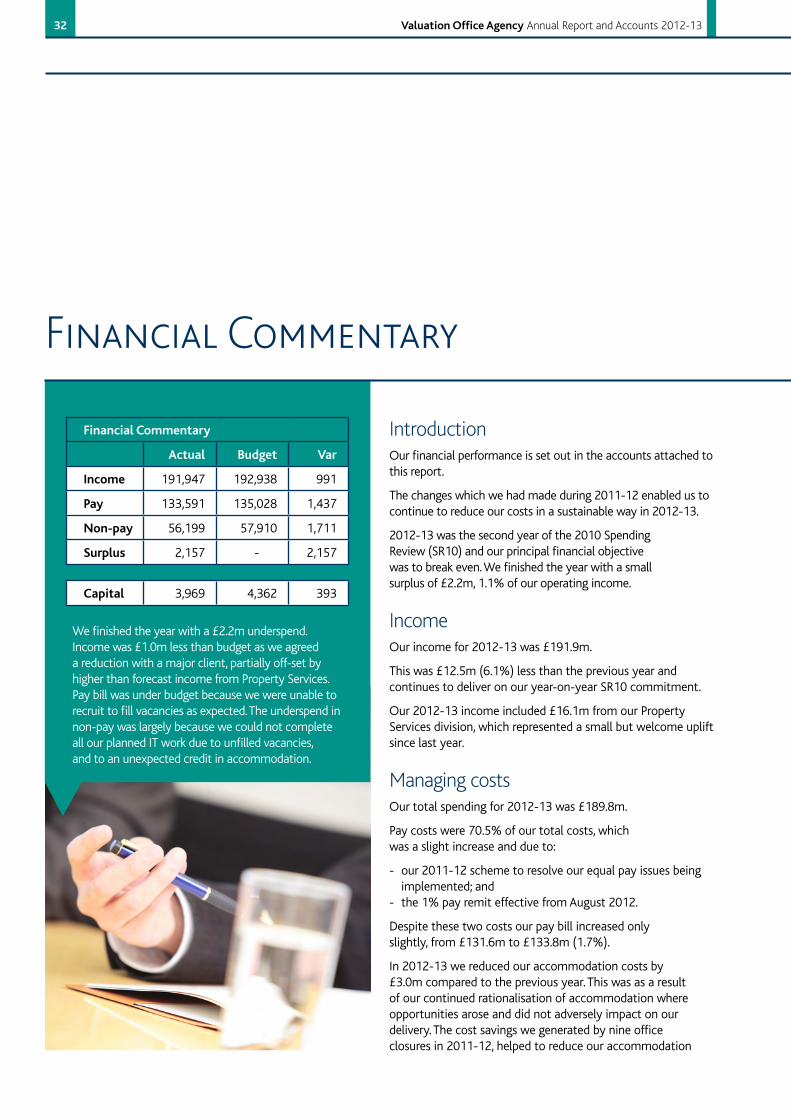
FinancialCommentary
Actual Budget Var
Income 191,947 192,938 991
Pay 133,591 135,028 1,437
Non-pay 56,199 57,910 1,711
Surplus 2,157 - 2,157
Capital 3,969 4,362 393
We finished the year with a £2.2m underspend. Income was £1.0m less than budget as we agreed a reduction with a major client, partially off-set by higher than forecast income from Property Services. Pay bill was under budget because we were unable to recruit to fill vacancies as expected. The underspend in non-pay was largely because we could not complete all our planned IT work due to unfilled vacancies, and to an unexpected credit in accommodation.
IntroductionOur financial performance is set out in the accounts attached to this report.
The changes which we had made during 2011-12 enabled us to continue to reduce our costs in a sustainable way in 2012-13.
2012-13 was the second year of the 2010 Spending Review (SR10) and our principal financial objective was to break even. We finished the year with a small surplus of £2.2m, 1.1% of our operating income.
IncomeOur income for 2012-13 was £191.9m.
This was £12.5m (6.1%) less than the previous year and continues to deliver on our year-on-year SR10 commitment.
Our 2012-13 income included £16.1m from our Property Services division, which represented a small but welcome uplift since last year.
Managing costsOur total spending for 2012-13 was £189.8m.
Pay costs were 70.5% of our total costs, which was a slight increase and due to:
- our 2011-12 scheme to resolve our equal pay issues being implemented; and - the 1% pay remit effective from August 2012.
Despite these two costs our pay bill increased only slightly, from £131.6m to £133.8m (1.7%).
In 2012-13 we reduced our accommodation costs by £3.0m compared to the previous year. This was as a result of our continued rationalisation of accommodation where opportunities arose and did not adversely impact on our delivery. The cost savings we generated by nine office closures in 2011-12, helped to reduce our accommodation
33
“During 2012-13 we continued to invest in our infrastructure - in IT and accommodation. We further reduced our accommodation by 4,800m2, an 8.5% reduction.”
costs from £20.3m to £17.4m. This included some one-off savings such as the reversal of a £1m accrual relating to a potential tax liability on one of our old buildings. We have now received confirmation that this will not crystallise.
Our telephony costs rose by £0.4m (26%) to £1.7m in 2012-13. We incurred extra costs to maintain our customer contact after a fault developed in our telephone system.
Our IT costs rose by £0.9m (7%) to £12.9m compared to 2011-12. This was due to increasing demands for network capacity and improvements to the availability of our online customer systems.
Our depreciation and amortisation charge for 2012-13 increased by £1.4m (18%) to £9.4m. This was after an impairment review of our IT software assets against our IT modernisation strategy. The result of this review reduced the life of our assets.
Last year we made a provision of just under £1m to cover the possible redundancy costs of 12 colleagues without a permanent role, following last year’s Agency restructuring. We made every effort to find suitable roles for these people. Eight were successful in securing a permanent role. As a result we did not need £0.8m of the provision.
During the year seven colleagues left on voluntary exit terms or redundancy at a cost of £0.4m after we reorganised part of our corporate services and closed some offices.
Over 2012-13, the fair value of our pension scheme assets rose by £9.5m. The present value of the unfunded liabilities has increased by £13.7m, increasing the liability on the Statement of Financial Position from £28.8m to £33.0m.
In terms of financial transparency each month we publish details of our spending on items over £25,000.
Controlling cashflowWork in progress (work performed but not yet billed) in our Property Services division fell again in 2012-13 to £2.0m at 31 March 2013. This is a 10% reduction from 31 March 2012, as a result of our improved billing processes.
Our cash levels remain positive with £11.7m at year end.
Our cash forecasting is working effectively. We aim to pay all invoices within five days of receipt of the goods and a valid invoice, in line with guidance issued by the Department of Business, Innovation and Skills. This year
we paid 87% of our invoices within five days and our trade creditor days was one.
Investing in the AgencyDuring 2012-13 we continued to invest in our infrastructure - in IT and accommodation. We further reduced our accommodation by 4,800m2, an 8.5% reduction.
We invested £4.0m in capital assets in 2012-13. This was below our planned budget due to our decision to focus on planning our future IT transformation. £0.6m of our 2012-13 capital-spend was on IT software to support Non-Domestic Rating (NDR) Revaluation 2015. Although Government has now postponed this in England and the Welsh Government has also announced its intention to similarly postpone, we will be able to use this software to support the Revaluation in 2017.
Financial OutlookAlthough we have agreed income figures for 2013-14, there are a number of uncertainties which could impact on our financial position in 2013-14 and beyond.
The principal uncertainties are around:
- the impact of the 2015-16 Spending Review;
- our ability to recruit into key vacancies which impacts ability to deliver;
- a continuing risk that clients may further reduce funding; and
- our ability to successfully make the case for capital investment required to deliver our IT modernisation.
We will continue to work closely with our clients to monitor and manage the position.
We are planning to:
- stabilise our IT infrastructure; and
- modernise our IT business applications.
To do this we are boosting capability in our IT and Information and Analysis teams. This will require some external recruitment, which will increase our pay costs in the medium term.
Adoption of Going ConcernWe have prepared our accounts on a Going Concern basis. There is no reason to believe we will not continue in operational existence for the foreseeable future.
34 ValuationOfficeAgency Annual Report and Accounts 2012-13
Statement Of The Accounting Officer’s Responsibilities
Under the Government Resources and Accounts Act 2000 HM Treasury has directed the Valuation Office Agency to prepare, for each financial year, a statement of account in the form and on the basis set out in the Accounts Direction. The account is prepared on an accruals basis and must give a true and fair view of the state of affairs of the VOA and of its income and expenditure, changes in taxpayers’ equity and cash flows for the financial year.
In preparing the account, the Accounting Officer is required to comply with the requirements of the Government Financial Reporting Manual and in particular to:
- observe the Accounts Direction issued by HM Treasury, including the relevant accounting and disclosure requirements, and apply suitable accounting policies on a consistent basis;
- make judgements and estimates on a reasonable basis;
- state whether applicable accounting standards as set out in the Government Financial Reporting Manual have been followed, and disclose and explain any material departures in the financial statements; and
- prepare the financial statements on a going concern basis.
The Permanent Secretary and Principal Accounting Officer of HMRC has appointed the Chief Executive of the Valuation Office Agency as Accounting Officer for the VOA. The responsibilities of an Accounting Officer, including responsibility for the propriety and regularity of the public finances for which the Accounting Officer is answerable, for keeping proper records and for safeguarding the VOA’s assets, are set out in Managing Public Money published by HM Treasury.
35
Governance Statement
As Accounting Officer and Chief Executive I place great importance on our governance and control environment. We must deliver our business while meeting the standards of integrity, regularity and propriety that the Government expects of us. This statement details our formal governance, which controls how we manage risk and how we comply with the Code of good practice.
Board and Committee Governance StructureOverall responsibility for the VOA rests with me as Chief Executive. I chair the VOA Board. Membership includes key Executive Directors and Non-Executive Directors. The VOA Board is the main decision-making body at Agency level. It is responsible for the VOA’s strategic direction; performance management (including Finance); and risk assessment and management.
To support our Board we have ten other Boards and Committees; nine were in existence last year. You can find more details of their work later in my statement.
Our Operating Framework sets out the Board’s purpose in areas such as strategic clarity; efficiency; capabilities; performance and risk. It outlines what issues the Board explicitly governs, for example setting the Agency’s strategy; approving the operational performance targets and so on. It also details my responsibilities as Chair and those of the Non-Executive Directors.
The strategic issues that the Board discussed during 2012-13 include:
- IT (in particular telephony)- Accommodation- Operational performance- Risk- Governance- Pay - Non-Domestic Rating Revaluation- VOA2015 – our change programme- Our long-term strategy- Financials
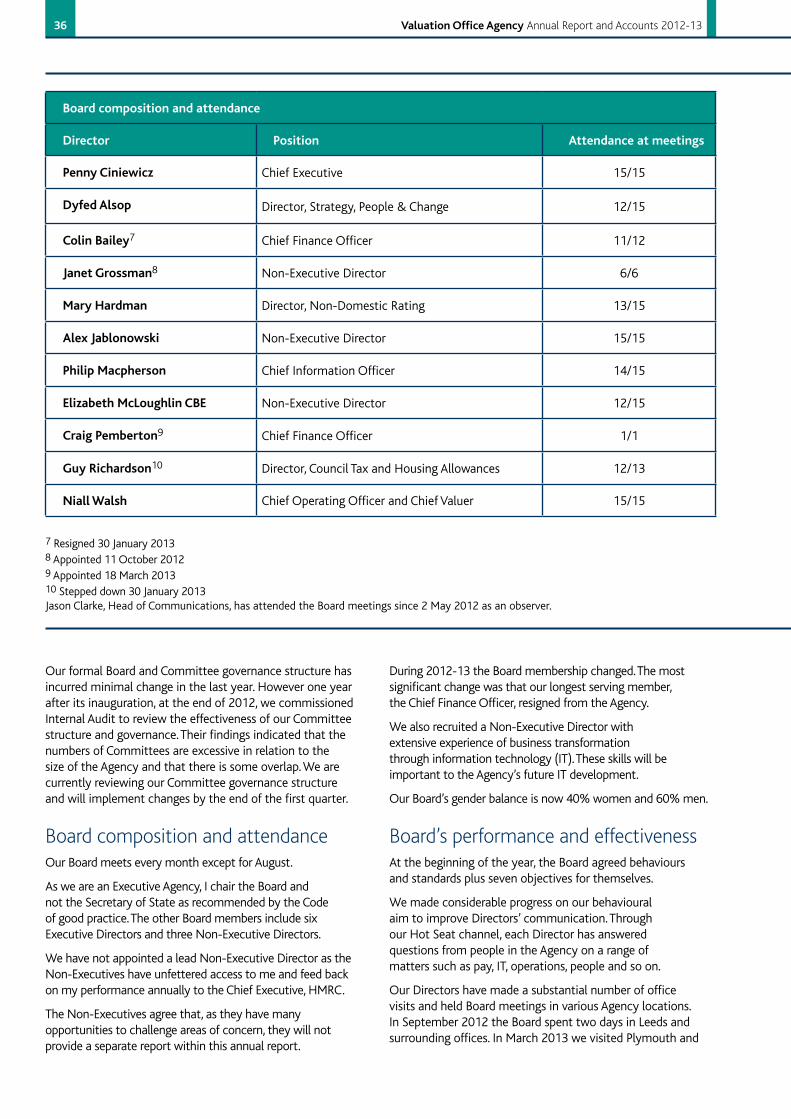
36 ValuationOfficeAgency Annual Report and Accounts 2012-13
Boardcompositionandattendance
Director Position Attendanceatmeetings
PennyCiniewicz Chief Executive 15/15
DyfedAlsop Director, Strategy, People & Change 12/15
ColinBailey7 Chief Finance Officer 11/12
JanetGrossman8 Non-Executive Director 6/6
MaryHardman Director, Non-Domestic Rating 13/15
AlexJablonowski Non-Executive Director 15/15
PhilipMacpherson Chief Information Officer 14/15
ElizabethMcLoughlinCBE Non-Executive Director 12/15
CraigPemberton9 Chief Finance Officer 1/1
GuyRichardson10 Director, Council Tax and Housing Allowances 12/13
NiallWalsh Chief Operating Officer and Chief Valuer 15/15
7 Resigned 30 January 20138 Appointed 11 October 20129 Appointed 18 March 2013 10 Stepped down 30 January 2013Jason Clarke, Head of Communications, has attended the Board meetings since 2 May 2012 as an observer.
Our formal Board and Committee governance structure has incurred minimal change in the last year. However one year after its inauguration, at the end of 2012, we commissioned Internal Audit to review the effectiveness of our Committee structure and governance. Their findings indicated that the numbers of Committees are excessive in relation to the size of the Agency and that there is some overlap. We are currently reviewing our Committee governance structure and will implement changes by the end of the first quarter.
Board composition and attendanceOur Board meets every month except for August.
As we are an Executive Agency, I chair the Board and not the Secretary of State as recommended by the Code of good practice. The other Board members include six Executive Directors and three Non-Executive Directors.
We have not appointed a lead Non-Executive Director as the Non-Executives have unfettered access to me and feed back on my performance annually to the Chief Executive, HMRC.
The Non-Executives agree that, as they have many opportunities to challenge areas of concern, they will not provide a separate report within this annual report.
During 2012-13 the Board membership changed. The most significant change was that our longest serving member, the Chief Finance Officer, resigned from the Agency.
We also recruited a Non-Executive Director with extensive experience of business transformation through information technology (IT). These skills will be important to the Agency’s future IT development.
Our Board’s gender balance is now 40% women and 60% men.
Board’s performance and effectivenessAt the beginning of the year, the Board agreed behaviours and standards plus seven objectives for themselves.
We made considerable progress on our behavioural aim to improve Directors’ communication. Through our Hot Seat channel, each Director has answered questions from people in the Agency on a range of matters such as pay, IT, operations, people and so on.
Our Directors have made a substantial number of office visits and held Board meetings in various Agency locations. In September 2012 the Board spent two days in Leeds and surrounding offices. In March 2013 we visited Plymouth and
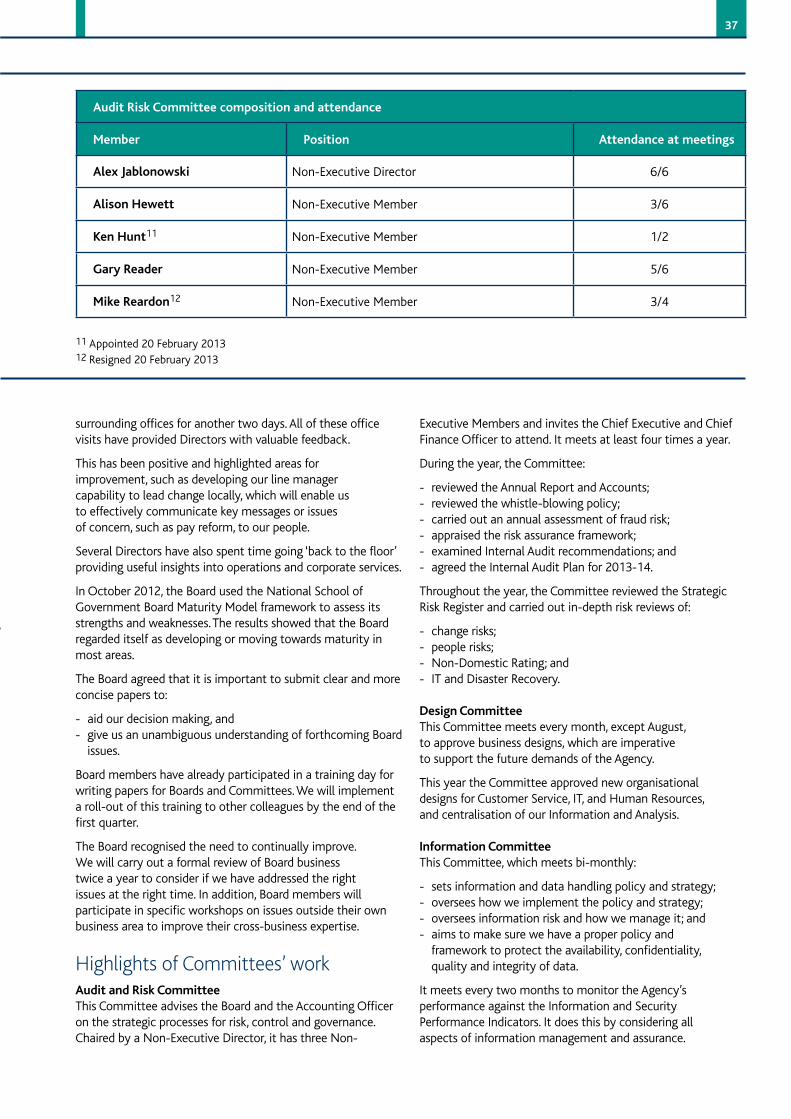
37
AuditRiskCommitteecompositionandattendance
Member Position Attendanceatmeetings
AlexJablonowski Non-Executive Director 6/6
AlisonHewett Non-Executive Member 3/6
Ken Hunt11 Non-Executive Member 1/2
GaryReader Non-Executive Member 5/6
MikeReardon12 Non-Executive Member 3/4
11 Appointed 20 February 201312 Resigned 20 February 2013
surrounding offices for another two days. All of these office visits have provided Directors with valuable feedback.
This has been positive and highlighted areas for improvement, such as developing our line manager capability to lead change locally, which will enable us to effectively communicate key messages or issues of concern, such as pay reform, to our people.
Several Directors have also spent time going ‘back to the floor’ providing useful insights into operations and corporate services.
In October 2012, the Board used the National School of Government Board Maturity Model framework to assess its strengths and weaknesses. The results showed that the Board regarded itself as developing or moving towards maturity in most areas.
The Board agreed that it is important to submit clear and more concise papers to:
- aid our decision making, and - give us an unambiguous understanding of forthcoming Board issues.
Board members have already participated in a training day for writing papers for Boards and Committees. We will implement a roll-out of this training to other colleagues by the end of the first quarter.
The Board recognised the need to continually improve. We will carry out a formal review of Board business twice a year to consider if we have addressed the right issues at the right time. In addition, Board members will participate in specific workshops on issues outside their own business area to improve their cross-business expertise.
Highlights of Committees’ workAuditandRiskCommitteeThis Committee advises the Board and the Accounting Officer on the strategic processes for risk, control and governance. Chaired by a Non-Executive Director, it has three Non-
Executive Members and invites the Chief Executive and Chief Finance Officer to attend. It meets at least four times a year.
During the year, the Committee:
- reviewed the Annual Report and Accounts; - reviewed the whistle-blowing policy; - carried out an annual assessment of fraud risk;- appraised the risk assurance framework; - examined Internal Audit recommendations; and - agreed the Internal Audit Plan for 2013-14.
Throughout the year, the Committee reviewed the Strategic Risk Register and carried out in-depth risk reviews of:
- change risks;- people risks;- Non-Domestic Rating; and - IT and Disaster Recovery.
DesignCommitteeThis Committee meets every month, except August, to approve business designs, which are imperative to support the future demands of the Agency.
This year the Committee approved new organisational designs for Customer Service, IT, and Human Resources, and centralisation of our Information and Analysis.
InformationCommitteeThis Committee, which meets bi-monthly:
- sets information and data handling policy and strategy; - oversees how we implement the policy and strategy;- oversees information risk and how we manage it; and- aims to make sure we have a proper policy and framework to protect the availability, confidentiality, quality and integrity of data.
It meets every two months to monitor the Agency’s performance against the Information and Security Performance Indicators. It does this by considering all aspects of information management and assurance.

38 ValuationOfficeAgency Annual Report and Accounts 2012-13
InvestmentandFinanceCommitteeThis Committee meets every month, except August, to approve significant investment proposals and business cases. It scrutinised the financial plans for 2013-14 and made recommendations to the Board.
A Non-Executive Member from the Audit and Risk Committee attends to bring an independent challenge.
PeopleandEngagementCommitteeThis Committee meets every month, except August, to advise the Board on people related strategic policies and processes. A Non-Executive Director attends to bring an independent challenge.
This year the Committee reviewed and approved several Civil Service Employee Policies for implementation. Examples are: managing poor performance; grievance; and Reserve Forces Policy. It also carried out a review of the Agency’s People strategy; the People Survey results; and our Health and Safety incidents.
PerformanceCommitteeThis Committee meets every month, except August, to assure operational performance against business objectives. This includes major risks to operational delivery and possible impacts of policy changes, including ensuring that the Agency was fully prepared to support the Business Rates Retention Scheme and the Welfare Reform Act 2012.
ProgrammeBoardThe Programme Board generally meets every month, except August, to focus on and assure the delivery of the VOA2015 change programme, in particular on:
- business process improvements for Council Tax and Non- Domestic Rating;- completion of the organisational design for phase 1 of the VOA2015 change programme; and- centralisation of our more straightforward processing and administrative functions.
SeniorAppointments,RemunerationandTalentCommitteeWe formed this Committee as an alternative to the Nominations and Governance Committee outlined in the Code of good practice. We agreed that owing to the size of the Agency, the Board is in the best position to manage our governance. The Chair of this Committee is a Non-Executive Director.
The Committee scrutinises Directors’ performance and our approach to talent management and succession planning at Director level and feeder grades.
WorkforceChangeCommitteeThis Committee focuses on people-related aspects of organisational change, for example the approach to accommodation changes and requests for exceptions to the recruitment freeze, in accordance with Cabinet Office guidance.
“Board members will participate in specific workshops on issues outside their own business area to improve their cross-business expertise.”
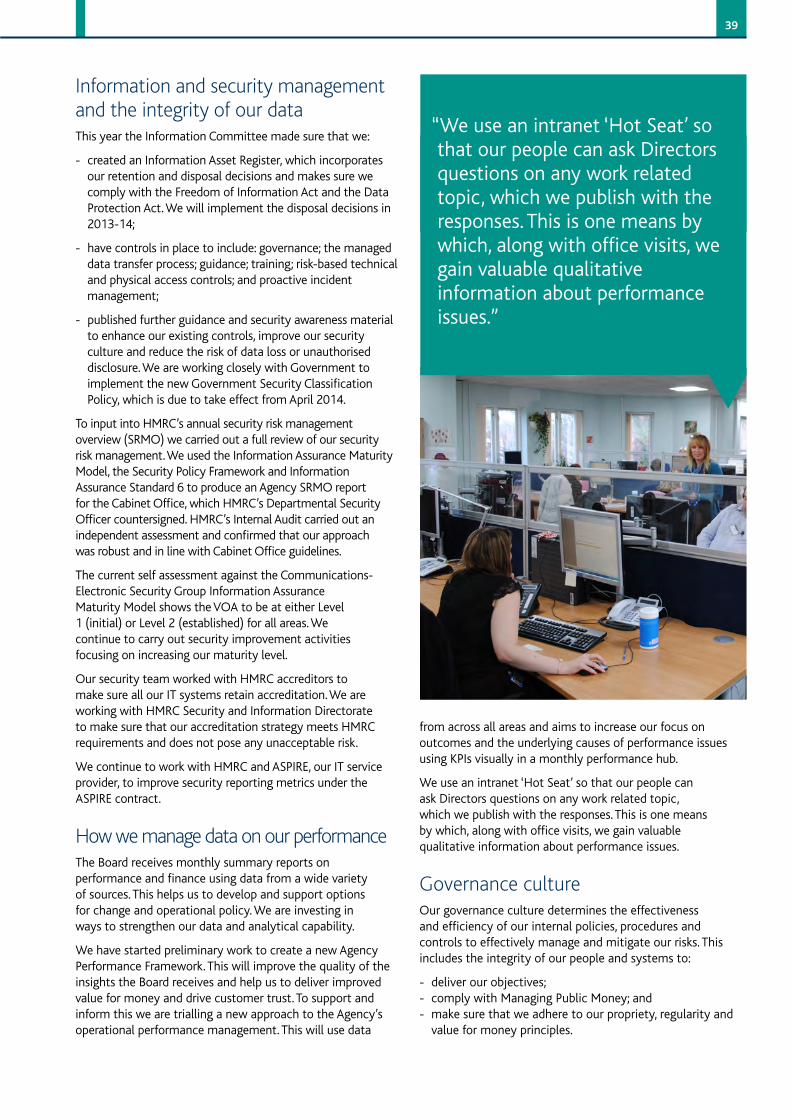
39
Information and security management and the integrity of our dataThis year the Information Committee made sure that we:
- created an Information Asset Register, which incorporates our retention and disposal decisions and makes sure we comply with the Freedom of Information Act and the Data Protection Act. We will implement the disposal decisions in 2013-14;
- have controls in place to include: governance; the managed data transfer process; guidance; training; risk-based technical and physical access controls; and proactive incident management;
- published further guidance and security awareness material to enhance our existing controls, improve our security culture and reduce the risk of data loss or unauthorised disclosure. We are working closely with Government to implement the new Government Security Classification Policy, which is due to take effect from April 2014.
To input into HMRC’s annual security risk management overview (SRMO) we carried out a full review of our security risk management. We used the Information Assurance Maturity Model, the Security Policy Framework and Information Assurance Standard 6 to produce an Agency SRMO report for the Cabinet Office, which HMRC’s Departmental Security Officer countersigned. HMRC’s Internal Audit carried out an independent assessment and confirmed that our approach was robust and in line with Cabinet Office guidelines.
The current self assessment against the Communications-Electronic Security Group Information Assurance Maturity Model shows the VOA to be at either Level 1 (initial) or Level 2 (established) for all areas. We continue to carry out security improvement activities focusing on increasing our maturity level.
Our security team worked with HMRC accreditors to make sure all our IT systems retain accreditation. We are working with HMRC Security and Information Directorate to make sure that our accreditation strategy meets HMRC requirements and does not pose any unacceptable risk.
We continue to work with HMRC and ASPIRE, our IT service provider, to improve security reporting metrics under the ASPIRE contract.
How we manage data on our performance The Board receives monthly summary reports on performance and finance using data from a wide variety of sources. This helps us to develop and support options for change and operational policy. We are investing in ways to strengthen our data and analytical capability.
We have started preliminary work to create a new Agency Performance Framework. This will improve the quality of the insights the Board receives and help us to deliver improved value for money and drive customer trust. To support and inform this we are trialling a new approach to the Agency’s operational performance management. This will use data
“We use an intranet ‘Hot Seat’ so that our people can ask Directors questions on any work related topic, which we publish with the responses. This is one means by which, along with office visits, we gain valuable qualitative information about performance issues.”
from across all areas and aims to increase our focus on outcomes and the underlying causes of performance issues using KPIs visually in a monthly performance hub.
We use an intranet ‘Hot Seat’ so that our people can ask Directors questions on any work related topic, which we publish with the responses. This is one means by which, along with office visits, we gain valuable qualitative information about performance issues.
Governance cultureOur governance culture determines the effectiveness and efficiency of our internal policies, procedures and controls to effectively manage and mitigate our risks. This includes the integrity of our people and systems to:
- deliver our objectives;- comply with Managing Public Money; and - make sure that we adhere to our propriety, regularity and value for money principles.
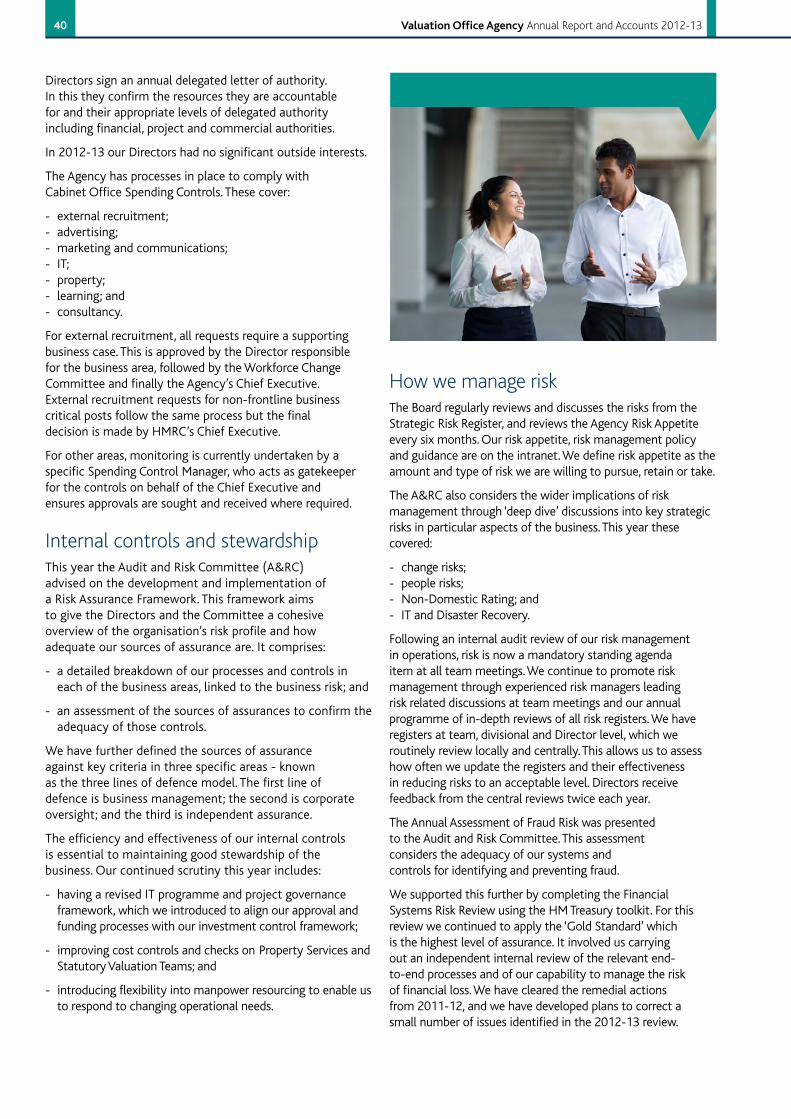
40 ValuationOfficeAgency Annual Report and Accounts 2012-13
How we manage riskThe Board regularly reviews and discusses the risks from the Strategic Risk Register, and reviews the Agency Risk Appetite every six months. Our risk appetite, risk management policy and guidance are on the intranet. We define risk appetite as the amount and type of risk we are willing to pursue, retain or take.
The A&RC also considers the wider implications of risk management through ‘deep dive’ discussions into key strategic risks in particular aspects of the business. This year these covered:
- change risks;- people risks;- Non-Domestic Rating; and - IT and Disaster Recovery.
Following an internal audit review of our risk management in operations, risk is now a mandatory standing agenda item at all team meetings. We continue to promote risk management through experienced risk managers leading risk related discussions at team meetings and our annual programme of in-depth reviews of all risk registers. We have registers at team, divisional and Director level, which we routinely review locally and centrally. This allows us to assess how often we update the registers and their effectiveness in reducing risks to an acceptable level. Directors receive feedback from the central reviews twice each year.
The Annual Assessment of Fraud Risk was presented to the Audit and Risk Committee. This assessment considers the adequacy of our systems and controls for identifying and preventing fraud.
We supported this further by completing the Financial Systems Risk Review using the HM Treasury toolkit. For this review we continued to apply the ‘Gold Standard’ which is the highest level of assurance. It involved us carrying out an independent internal review of the relevant end-to-end processes and of our capability to manage the risk of financial loss. We have cleared the remedial actions from 2011-12, and we have developed plans to correct a small number of issues identified in the 2012-13 review.
Directors sign an annual delegated letter of authority. In this they confirm the resources they are accountable for and their appropriate levels of delegated authority including financial, project and commercial authorities.
In 2012-13 our Directors had no significant outside interests.
The Agency has processes in place to comply with Cabinet Office Spending Controls. These cover:
- external recruitment; - advertising; - marketing and communications; - IT;- property; - learning; and- consultancy.
For external recruitment, all requests require a supporting business case. This is approved by the Director responsible for the business area, followed by the Workforce Change Committee and finally the Agency’s Chief Executive. External recruitment requests for non-frontline business critical posts follow the same process but the final decision is made by HMRC’s Chief Executive.
For other areas, monitoring is currently undertaken by a specific Spending Control Manager, who acts as gatekeeper for the controls on behalf of the Chief Executive and ensures approvals are sought and received where required.
Internal controls and stewardshipThis year the Audit and Risk Committee (A&RC) advised on the development and implementation of a Risk Assurance Framework. This framework aims to give the Directors and the Committee a cohesive overview of the organisation’s risk profile and how adequate our sources of assurance are. It comprises:
- a detailed breakdown of our processes and controls in each of the business areas, linked to the business risk; and
- an assessment of the sources of assurances to confirm the adequacy of those controls.
We have further defined the sources of assurance against key criteria in three specific areas - known as the three lines of defence model. The first line of defence is business management; the second is corporate oversight; and the third is independent assurance.
The efficiency and effectiveness of our internal controls is essential to maintaining good stewardship of the business. Our continued scrutiny this year includes:
- having a revised IT programme and project governance framework, which we introduced to align our approval and funding processes with our investment control framework;
- improving cost controls and checks on Property Services and Statutory Valuation Teams; and
- introducing flexibility into manpower resourcing to enable us to respond to changing operational needs.
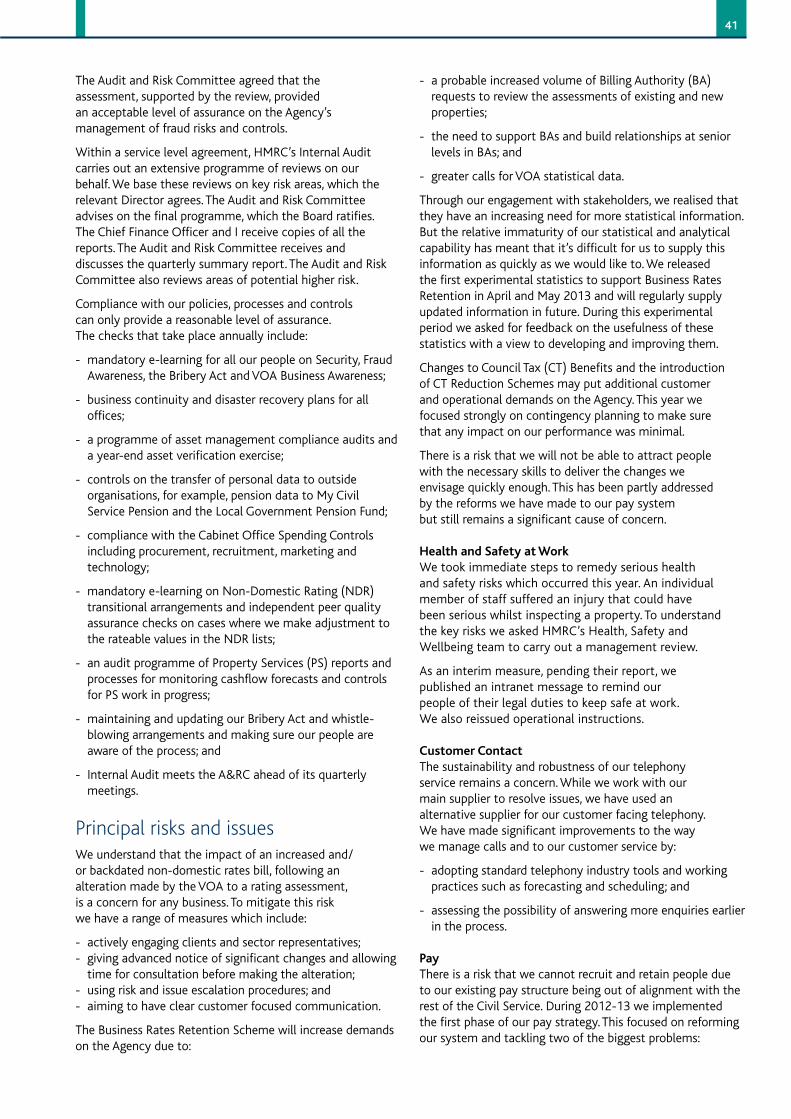
41
The Audit and Risk Committee agreed that the assessment, supported by the review, provided an acceptable level of assurance on the Agency’s management of fraud risks and controls.
Within a service level agreement, HMRC’s Internal Audit carries out an extensive programme of reviews on our behalf. We base these reviews on key risk areas, which the relevant Director agrees. The Audit and Risk Committee advises on the final programme, which the Board ratifies. The Chief Finance Officer and I receive copies of all the reports. The Audit and Risk Committee receives and discusses the quarterly summary report. The Audit and Risk Committee also reviews areas of potential higher risk.
Compliance with our policies, processes and controls can only provide a reasonable level of assurance. The checks that take place annually include:
- mandatory e-learning for all our people on Security, Fraud Awareness, the Bribery Act and VOA Business Awareness;
- business continuity and disaster recovery plans for all offices;
- a programme of asset management compliance audits and a year-end asset verification exercise;
- controls on the transfer of personal data to outside organisations, for example, pension data to My Civil Service Pension and the Local Government Pension Fund;
- compliance with the Cabinet Office Spending Controls including procurement, recruitment, marketing and technology;
- mandatory e-learning on Non-Domestic Rating (NDR) transitional arrangements and independent peer quality assurance checks on cases where we make adjustment to the rateable values in the NDR lists;
- an audit programme of Property Services (PS) reports and processes for monitoring cashflow forecasts and controls for PS work in progress;
- maintaining and updating our Bribery Act and whistle- blowing arrangements and making sure our people are aware of the process; and
- Internal Audit meets the A&RC ahead of its quarterly meetings.
Principal risks and issues We understand that the impact of an increased and/or backdated non-domestic rates bill, following an alteration made by the VOA to a rating assessment, is a concern for any business. To mitigate this risk we have a range of measures which include:
- actively engaging clients and sector representatives;- giving advanced notice of significant changes and allowing time for consultation before making the alteration;- using risk and issue escalation procedures; and- aiming to have clear customer focused communication.
The Business Rates Retention Scheme will increase demands on the Agency due to:
- a probable increased volume of Billing Authority (BA) requests to review the assessments of existing and new properties;
- the need to support BAs and build relationships at senior levels in BAs; and
- greater calls for VOA statistical data.
Through our engagement with stakeholders, we realised that they have an increasing need for more statistical information. But the relative immaturity of our statistical and analytical capability has meant that it’s difficult for us to supply this information as quickly as we would like to. We released the first experimental statistics to support Business Rates Retention in April and May 2013 and will regularly supply updated information in future. During this experimental period we asked for feedback on the usefulness of these statistics with a view to developing and improving them.
Changes to Council Tax (CT) Benefits and the introduction of CT Reduction Schemes may put additional customer and operational demands on the Agency. This year we focused strongly on contingency planning to make sure that any impact on our performance was minimal.
There is a risk that we will not be able to attract people with the necessary skills to deliver the changes we envisage quickly enough. This has been partly addressed by the reforms we have made to our pay system but still remains a significant cause of concern.
HealthandSafetyatWorkWe took immediate steps to remedy serious health and safety risks which occurred this year. An individual member of staff suffered an injury that could have been serious whilst inspecting a property. To understand the key risks we asked HMRC’s Health, Safety and Wellbeing team to carry out a management review.
As an interim measure, pending their report, we published an intranet message to remind our people of their legal duties to keep safe at work. We also reissued operational instructions.
CustomerContactThe sustainability and robustness of our telephony service remains a concern. While we work with our main supplier to resolve issues, we have used an alternative supplier for our customer facing telephony. We have made significant improvements to the way we manage calls and to our customer service by:
- adopting standard telephony industry tools and working practices such as forecasting and scheduling; and
- assessing the possibility of answering more enquiries earlier in the process.
PayThere is a risk that we cannot recruit and retain people due to our existing pay structure being out of alignment with the rest of the Civil Service. During 2012-13 we implemented the first phase of our pay strategy. This focused on reforming our system and tackling two of the biggest problems:
42 ValuationOfficeAgency Annual Report and Accounts 2012-13
- the length of our pay scales; and - the lack of pay progression.
The Board took the difficult decision to freeze the pay of all of our people on pay band maximums - around two thirds of our workforce. This allowed us to target our 1% pay remit on giving significant increases to people below the maximum and on increasing pay band minimums.
Over the past two years the Agency has succeeded in halving the length of our longest pay scales (from around 40% to 20%). This means that the structural cost of paying ordinary progression has fallen significantly, making our pay system more sustainable and affordable.
PeoplecapabilitiesOne of our key areas of focus in 2012-13 was to build the capabilities of our people. We put in place a number of technical development schemes and established our talent at our senior levels. A number of individuals participated in Civil Service Local development programmes.
The Agency was an early adopter of two key elements of the Civil Service Reform Plan: the Civil Service Policy’s new Performance Management System and the Competency Framework. To support our April 2012 roll-out we delivered training to all line managers in March 2012. This included delivery of the new Civil Service Managing Poor Performance policy.
GeographicalInformationSystemFollowing the previous year’s decision to write off an IT programme (Geographical Information System), we conducted a review of lessons learned. This included an assessment against the Office of Government Commerce’s common causes of failure and reviewed all our current IT and non-IT projects against these criteria.
Head of Internal Audit OpinionGovernment Internal Audit Standards (GIAS) require Internal Audit to provide me, as the Accounting Officer, with an objective evaluation of, and opinion on, the overall adequacy and effectiveness of our framework of governance, risk management and control.
In the areas of governance, risk management, and controls, Internal Audit base their opinion on four levels of assurance:
- Strong assurance; - Reasonable assurance; - Limited assurance; and- Weak assurance.
Having reviewed the Committee structure, Internal Audit gave a reasonable assurance on Governance.
Internal Audit gave a reasonable assurance around Risk Management. There were examples of an effective application of risk management. But more can be done to leverage full benefit from existing risk management and assurance mapping processes.
The health and safety incidents that occurred during the year were disconcerting, but steps have been taken to address the control weaknesses. There are no ‘red’ status Internal Audit reports and in view of the progress made in implementing ‘amber’ status reports, Internal Audit gave a reasonable assurance on Controls.
Internal Audit are content this Governance Statement is consistent with their opinion.
Penny Ciniewicz Chief Executive
14 June 2013
“We put in place a number of technical development schemes and established our talent at our senior levels. A number of individuals participated in Civil Service Local development programmes.”
43
Annual AccountsFor the Year Ended 31 March 2013
Contents The Certificate and Report of the Comptroller and Auditor General to the House of Commons
44
Statement of Comprehensive Net Expenditure 46
Statement of Financial Position 47
Statement of Cash Flows 48
Statement of Changes in Taxpayers’ Equity 49
Notes to the VOA’s Accounts 50
Payment of Local Authority Rates (POLAR) 88
AccountsThe Accounting Officer is not aware of any relevant audit information that the auditor is unaware of, and has taken all steps she ought to have in order to make herself aware of any relevant audit information and ensure that the auditor is aware of it.
44 ValuationOfficeAgency Annual Report and Accounts 2012-13
The Certificate and Report of the Comptroller and Auditor General to the House of Commons
I certify that I have audited the financial statements of the Valuation Office Agency for the year ended 31 March 2013 under the Government Resources and Accounts Act 2000. The financial statements comprise: the Statements of Comprehensive Net Expenditure, Financial Position, Cash Flows, Changes in Taxpayers’ Equity; and the related notes. These financial statements have been prepared under the accounting policies set out within them. I have also audited the information in the Remuneration Report that is described in that report as having been audited.
RespectiveresponsibilitiesoftheChiefExecutiveandauditorAs explained more fully in the Statement of the Accounting Officer’s Responsibilities, the Chief Executive as Accounting Officer is responsible for the preparation of the financial statements and for being satisfied that they give a true and fair view. My responsibility is to audit, certify and report on the financial statements in accordance with the Government Resources and Accounts Act 2000. I conducted my audit in accordance with International Standards on Auditing (UK and Ireland). Those standards require me and my staff to comply with the Auditing Practices Board’s Ethical Standards for Auditors.
ScopeoftheauditofthefinancialstatementsAn audit involves obtaining evidence about the amounts and disclosures in the financial statements sufficient to give reasonable assurance that the financial statements are free from material misstatement, whether caused by fraud or error. This includes an assessment of: whether the accounting policies are appropriate to the Valuation Office Agency’s circumstances and have been consistently applied and adequately disclosed; the reasonableness of significant accounting estimates made by the Valuation Office Agency; and the overall presentation of the financial statements. In addition I read all the financial and non-financial information in the Annual Report to identify material inconsistencies with the audited financial statements. If I
become aware of any apparent material misstatements or inconsistencies I consider the implications for my certificate.
I am required to obtain evidence sufficient to give reasonable assurance that the expenditure and income recorded in the financial statements have been applied to the purposes intended by Parliament and the financial transactions recorded in the financial statements conform to the authorities which govern them.
OpiniononregularityIn my opinion, in all material respects the expenditure and income recorded in the financial statements have been applied to the purposes intended by Parliament and the financial transactions recorded in the financial statements conform to the authorities which govern them.
OpiniononfinancialstatementsIn my opinion:
- the financial statements give a true and fair view of the state of the Valuation Office Agency’s affairs as at 31 March 2013 and of the net operating surplus for the year then ended; and
- the financial statements have been properly prepared in accordance with the Government Resources and Accounts Act 2000 and HM Treasury directions issued thereunder.
OpiniononothermattersIn my opinion:
- the part of the Remuneration Report to be audited has been properly prepared in accordance with HM Treasury directions made under the Government Resources and Accounts Act 2000; and
- the information given in the sections of the Annual Report entitled About us, The Chief Executive’s Review, How We’ve Performed, Sustainability Report and Financial Commentary for the financial year for which the financial statements are prepared is consistent with the financial statements.
45
MattersonwhichIreportbyexceptionI have nothing to report in respect of the following matters which I report to you if, in my opinion:
- adequate accounting records have not been kept or returns adequate for my audit have not been received from branches not visited by my staff; or
- the financial statements and the part of the Remuneration Report to be audited are not in agreement with the accounting records and returns; or
- I have not received all of the information and explanations I require for my audit; or
- the Governance Statement does not reflect compliance with HM Treasury’s guidance.
ReportI have no observations to make on these financial statements.
AmyasCEMorse ComptrollerandAuditorGeneral18June2013
National Audit Office157-197 Buckingham Palace RoadVictoriaLondonSW1W 9SP
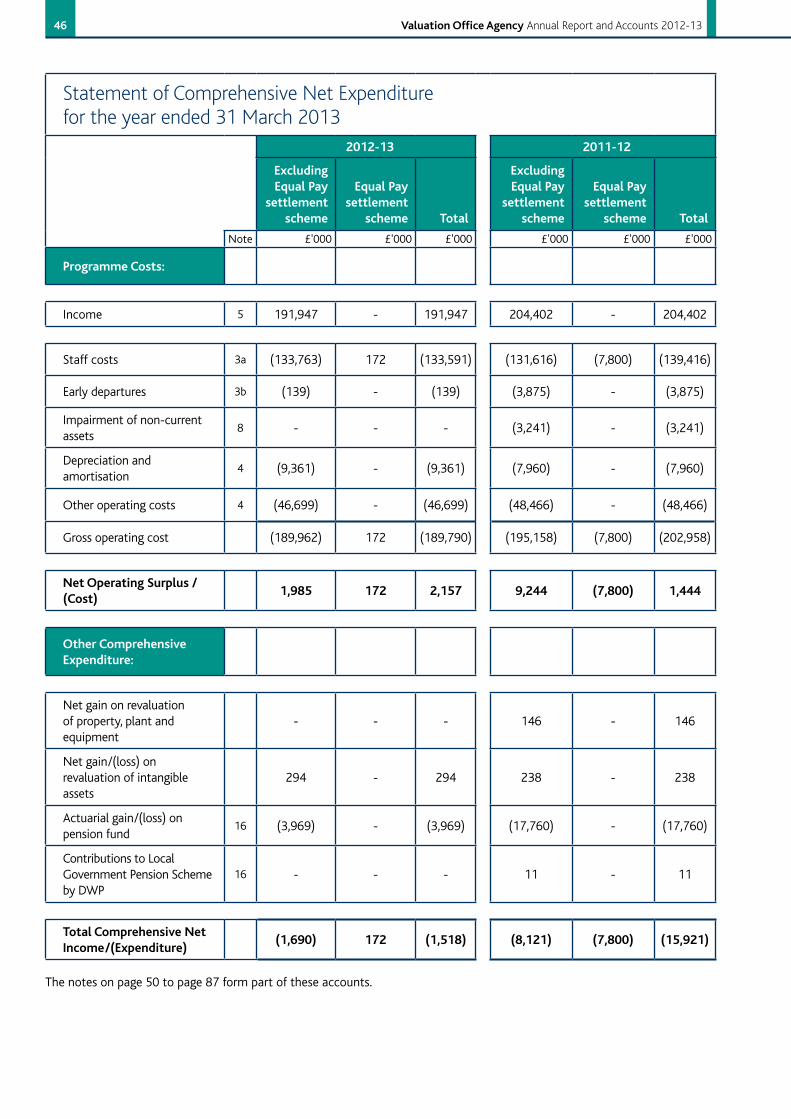
46 ValuationOfficeAgency Annual Report and Accounts 2012-13
Statement of Comprehensive Net Expenditure for the year ended 31 March 2013
2012-13 2011-12
ExcludingEqualPay
settlementscheme
EqualPaysettlement
scheme Total
ExcludingEqualPay
settlementscheme
EqualPaysettlement
scheme Total
Note £'000 £'000 £'000 £'000 £'000 £'000
ProgrammeCosts:
Income 5 191,947 - 191,947 204,402 - 204,402
Staff costs 3a (133,763) 172 (133,591) (131,616) (7,800) (139,416)
Early departures 3b (139) - (139) (3,875) - (3,875)
Impairment of non-current assets
8 - - - (3,241) - (3,241)
Depreciation and amortisation
4 (9,361) - (9,361) (7,960) - (7,960)
Other operating costs 4 (46,699) - (46,699) (48,466) - (48,466)
Gross operating cost (189,962) 172 (189,790) (195,158) (7,800) (202,958)
NetOperatingSurplus/(Cost)
1,985 172 2,157 9,244 (7,800) 1,444
OtherComprehensiveExpenditure:
Net gain on revaluation of property, plant and equipment
- - - 146 - 146
Net gain/(loss) on revaluation of intangible assets
294 - 294 238 - 238
Actuarial gain/(loss) on pension fund
16 (3,969) - (3,969) (17,760) - (17,760)
Contributions to Local Government Pension Scheme by DWP
16 - - - 11 - 11
TotalComprehensiveNetIncome/(Expenditure)
(1,690) 172 (1,518) (8,121) (7,800) (15,921)
The notes on page 50 to page 87 form part of these accounts.
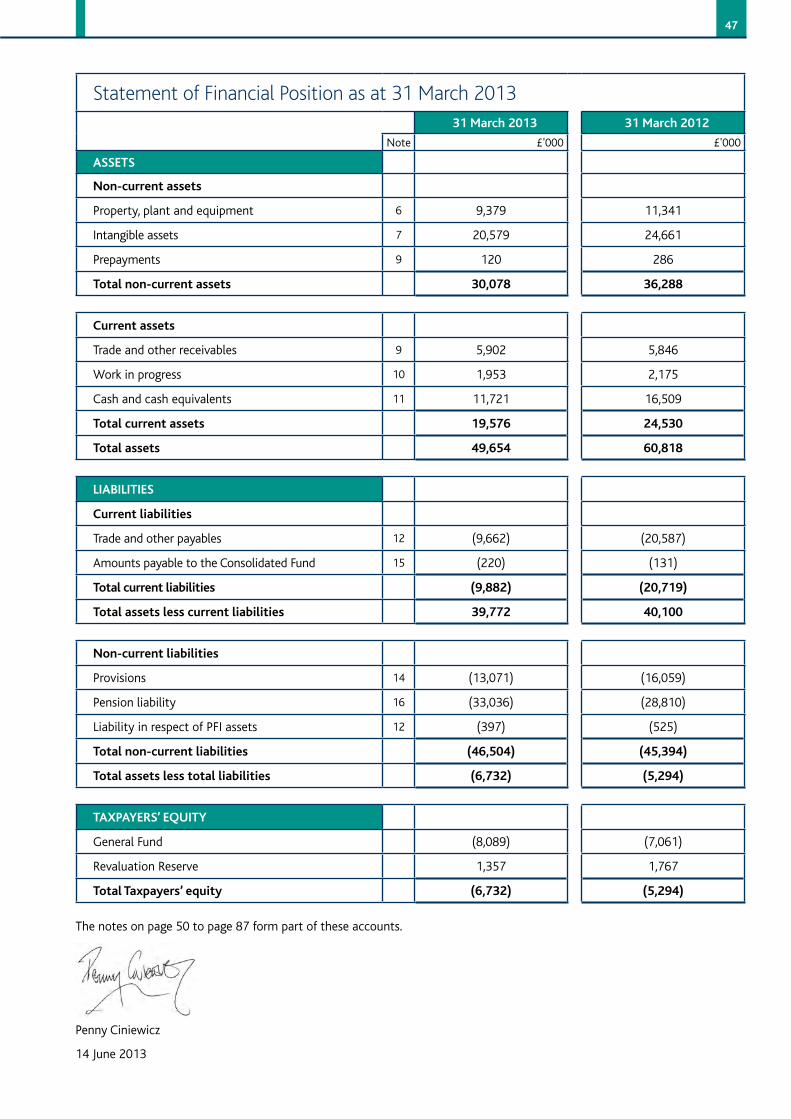
47
Statement of Financial Position as at 31 March 201331March2013 31March2012
Note £'000 £'000
ASSETS
Non-currentassets
Property, plant and equipment 6 9,379 11,341
Intangible assets 7 20,579 24,661
Prepayments 9 120 286
Totalnon-currentassets 30,078 36,288
Current assets
Trade and other receivables 9 5,902 5,846
Work in progress 10 1,953 2,175
Cash and cash equivalents 11 11,721 16,509
Totalcurrentassets 19,576 24,530
Total assets 49,654 60,818
LIABILITIES
Currentliabilities
Trade and other payables 12 (9,662) (20,587)
Amounts payable to the Consolidated Fund 15 (220) (131)
Totalcurrentliabilities (9,882) (20,719)
Totalassetslesscurrentliabilities 39,772 40,100
Non-currentliabilities
Provisions 14 (13,071) (16,059)
Pension liability 16 (33,036) (28,810)
Liability in respect of PFI assets 12 (397) (525)
Totalnon-currentliabilities (46,504) (45,394)
Totalassetslesstotalliabilities (6,732) (5,294)
TAXPAYERS’EQUITY
General Fund (8,089) (7,061)
Revaluation Reserve 1,357 1,767
TotalTaxpayers’equity (6,732) (5,294)
The notes on page 50 to page 87 form part of these accounts.
Penny Ciniewicz
14 June 2013
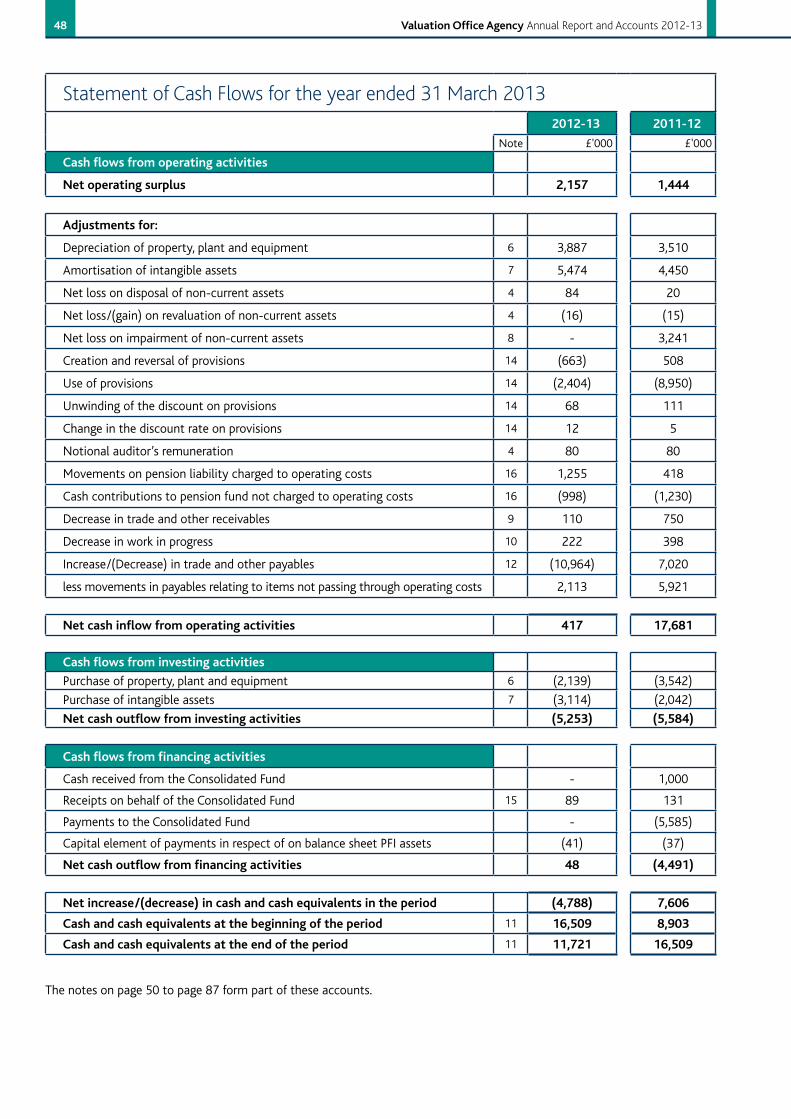
48 ValuationOfficeAgency Annual Report and Accounts 2012-13
Statement of Cash Flows for the year ended 31 March 20132012-13 2011-12
Note £'000 £'000
Cashflowsfromoperatingactivities
Netoperatingsurplus 2,157 1,444
Adjustmentsfor:
Depreciation of property, plant and equipment 6 3,887 3,510
Amortisation of intangible assets 7 5,474 4,450
Net loss on disposal of non-current assets 4 84 20
Net loss/(gain) on revaluation of non-current assets 4 (16) (15)
Net loss on impairment of non-current assets 8 - 3,241
Creation and reversal of provisions 14 (663) 508
Use of provisions 14 (2,404) (8,950)
Unwinding of the discount on provisions 14 68 111
Change in the discount rate on provisions 14 12 5
Notional auditor’s remuneration 4 80 80
Movements on pension liability charged to operating costs 16 1,255 418
Cash contributions to pension fund not charged to operating costs 16 (998) (1,230)
Decrease in trade and other receivables 9 110 750
Decrease in work in progress 10 222 398
Increase/(Decrease) in trade and other payables 12 (10,964) 7,020
less movements in payables relating to items not passing through operating costs 2,113 5,921
Netcashinflowfromoperatingactivities 417 17,681
Cashflowsfrominvestingactivities
Purchase of property, plant and equipment 6 (2,139) (3,542)
Purchase of intangible assets 7 (3,114) (2,042)
Netcashoutflowfrominvestingactivities (5,253) (5,584)
Cashflowsfromfinancingactivities
Cash received from the Consolidated Fund - 1,000
Receipts on behalf of the Consolidated Fund 15 89 131
Payments to the Consolidated Fund - (5,585)
Capital element of payments in respect of on balance sheet PFI assets (41) (37)
Netcashoutflowfromfinancingactivities 48 (4,491)
Netincrease/(decrease)incashandcashequivalentsintheperiod (4,788) 7,606
Cashandcashequivalentsatthebeginningoftheperiod 11 16,509 8,903
Cashandcashequivalentsattheendoftheperiod 11 11,721 16,509
The notes on page 50 to page 87 form part of these accounts.
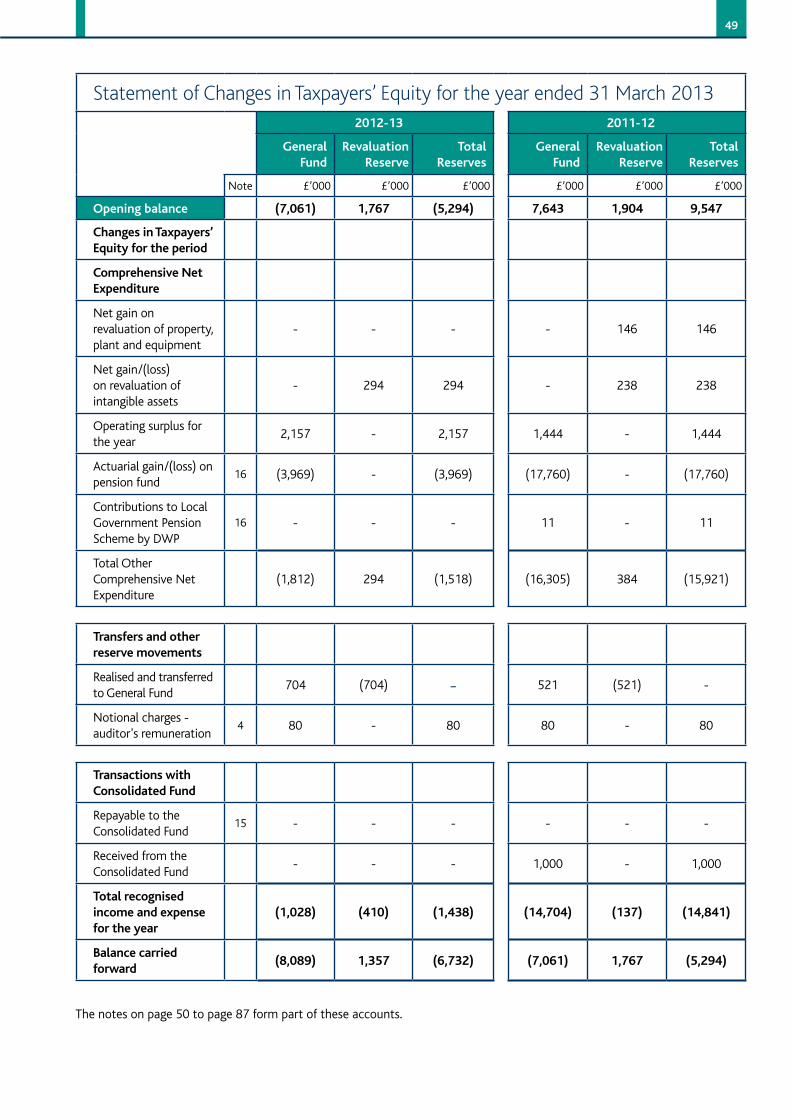
49
Statement of Changes in Taxpayers’ Equity for the year ended 31 March 20132012-13 2011-12
General Fund
RevaluationReserve
Total Reserves
General Fund
RevaluationReserve
Total Reserves
Note £’000 £’000 £’000 £’000 £’000 £’000
Openingbalance (7,061) 1,767 (5,294) 7,643 1,904 9,547
ChangesinTaxpayers’Equityfortheperiod
ComprehensiveNetExpenditure
Net gain on revaluation of property, plant and equipment
- - - - 146 146
Net gain/(loss) on revaluation of intangible assets
- 294 294 - 238 238
Operating surplus for the year
2,157 - 2,157 1,444 - 1,444
Actuarial gain/(loss) on pension fund
16 (3,969) - (3,969) (17,760) - (17,760)
Contributions to Local Government Pension Scheme by DWP
16 - - - 11 - 11
Total Other Comprehensive Net Expenditure
(1,812) 294 (1,518) (16,305) 384 (15,921)
Transfers and other reservemovements
Realised and transferred to General Fund
704 (704) - 521 (521) -
Notional charges - auditor's remuneration
4 80 - 80 80 - 80
TransactionswithConsolidated Fund
Repayable to the Consolidated Fund
15 - - - - - -
Received from the Consolidated Fund
- - - 1,000 - 1,000
Totalrecognisedincomeandexpensefor the year
(1,028) (410) (1,438) (14,704) (137) (14,841)
Balancecarriedforward
(8,089) 1,357 (6,732) (7,061) 1,767 (5,294)
The notes on page 50 to page 87 form part of these accounts.
50 ValuationOfficeAgency Annual Report and Accounts 2012-13
Notes to the VOA’s Accounts
1. Statement of accounting policies As the VOA is a Government entity, we have prepared these financial statements in accordance with the 2012-13 Government Financial Reporting Manual (FReM) issued by HM Treasury. The accounting policies contained in the FReM apply International Financial Reporting Standards (IFRS) as adapted or interpreted for the public sector context.
Where the FReM permits a choice of accounting policy, we have selected the accounting policy which is most appropriate for giving a true and fair view. Our accounting policies are described below. They have been applied consistently in dealing with items that are considered material to the accounts.
1.1 Accounting conventionThese accounts have been prepared using the historical cost convention, modified to account for the revaluation of property, plant and equipment, and intangible assets (see Notes 1.2 and 1.3).
The accounts have been prepared on a going concern basis.
1.2 Property, plant and equipment
InitialRecognitionOn initial recognition, we recognise property, plant and equipment assets at cost, including all costs directly attributable to making them available for use. Cost is the amount of cash or cash equivalent paid or the fair value of any consideration given to acquire the asset or during its construction.
We carry the costs of the refurbishment of office accommodation on the Statement of Financial Position as non-current assets where the work results in additional and/or extended service potential to the VOA.
SubsequentmeasurementIn subsequent periods, we account for these assets using their fair values.
Land and buildings are valued professionally on an existing use basis every five years, supplemented by such interim valuations as are necessary to ensure that the recorded values of the assets materially reflect their fair values.
The fair value of all other assets is assessed annually using a relevant revaluation index. Where the difference between the fair value and carrying value is
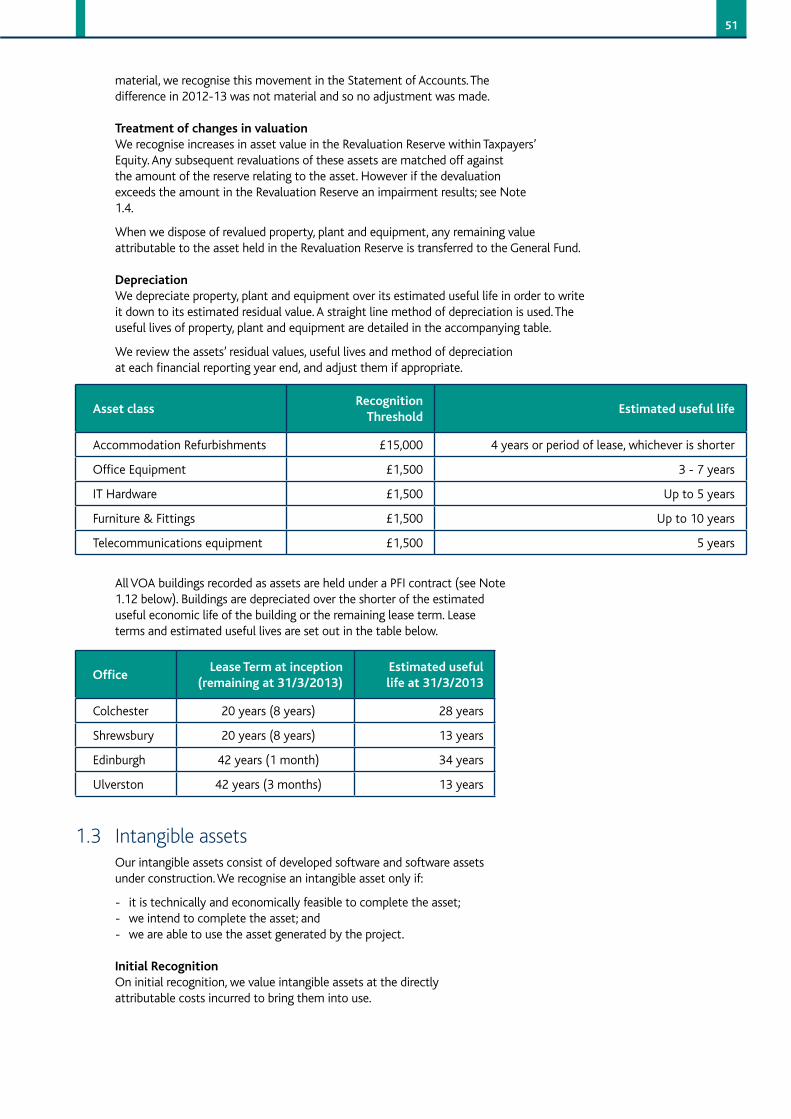
51
material, we recognise this movement in the Statement of Accounts. The difference in 2012-13 was not material and so no adjustment was made.
TreatmentofchangesinvaluationWe recognise increases in asset value in the Revaluation Reserve within Taxpayers’ Equity. Any subsequent revaluations of these assets are matched off against the amount of the reserve relating to the asset. However if the devaluation exceeds the amount in the Revaluation Reserve an impairment results; see Note 1.4.
When we dispose of revalued property, plant and equipment, any remaining value attributable to the asset held in the Revaluation Reserve is transferred to the General Fund.
DepreciationWe depreciate property, plant and equipment over its estimated useful life in order to write it down to its estimated residual value. A straight line method of depreciation is used. The useful lives of property, plant and equipment are detailed in the accompanying table.
We review the assets’ residual values, useful lives and method of depreciation at each financial reporting year end, and adjust them if appropriate.
All VOA buildings recorded as assets are held under a PFI contract (see Note 1.12 below). Buildings are depreciated over the shorter of the estimated useful economic life of the building or the remaining lease term. Lease terms and estimated useful lives are set out in the table below.
1.3 Intangible assetsOur intangible assets consist of developed software and software assets under construction. We recognise an intangible asset only if:
- it is technically and economically feasible to complete the asset;- we intend to complete the asset; and- we are able to use the asset generated by the project.
InitialRecognitionOn initial recognition, we value intangible assets at the directly attributable costs incurred to bring them into use.
AssetclassRecognition
ThresholdEstimatedusefullife
Accommodation Refurbishments £15,000 4 years or period of lease, whichever is shorter
Office Equipment £1,500 3 - 7 years
IT Hardware £1,500 Up to 5 years
Furniture & Fittings £1,500 Up to 10 years
Telecommunications equipment £1,500 5 years
OfficeLeaseTermatinception
(remainingat31/3/2013)Estimatedusefullifeat31/3/2013
Colchester 20 years (8 years) 28 years
Shrewsbury 20 years (8 years) 13 years
Edinburgh 42 years (1 month) 34 years
Ulverston 42 years (3 months) 13 years
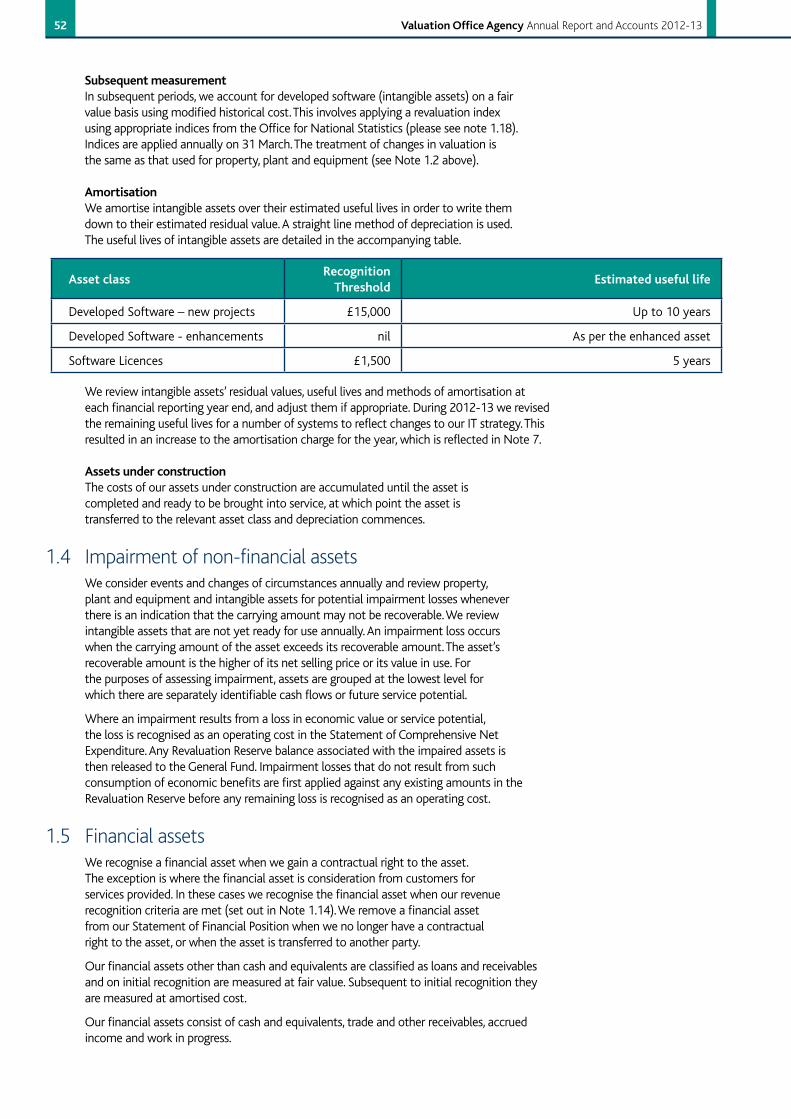
52 ValuationOfficeAgency Annual Report and Accounts 2012-13
SubsequentmeasurementIn subsequent periods, we account for developed software (intangible assets) on a fair value basis using modified historical cost. This involves applying a revaluation index using appropriate indices from the Office for National Statistics (please see note 1.18). Indices are applied annually on 31 March. The treatment of changes in valuation is the same as that used for property, plant and equipment (see Note 1.2 above).
AmortisationWe amortise intangible assets over their estimated useful lives in order to write them down to their estimated residual value. A straight line method of depreciation is used. The useful lives of intangible assets are detailed in the accompanying table.
AssetclassRecognition
ThresholdEstimatedusefullife
Developed Software – new projects £15,000 Up to 10 years
Developed Software - enhancements nil As per the enhanced asset
Software Licences £1,500 5 years
We review intangible assets’ residual values, useful lives and methods of amortisation at each financial reporting year end, and adjust them if appropriate. During 2012-13 we revised the remaining useful lives for a number of systems to reflect changes to our IT strategy. This resulted in an increase to the amortisation charge for the year, which is reflected in Note 7.
AssetsunderconstructionThe costs of our assets under construction are accumulated until the asset is completed and ready to be brought into service, at which point the asset is transferred to the relevant asset class and depreciation commences.
1.4 Impairment of non-financial assetsWe consider events and changes of circumstances annually and review property, plant and equipment and intangible assets for potential impairment losses whenever there is an indication that the carrying amount may not be recoverable. We review intangible assets that are not yet ready for use annually. An impairment loss occurs when the carrying amount of the asset exceeds its recoverable amount. The asset’s recoverable amount is the higher of its net selling price or its value in use. For the purposes of assessing impairment, assets are grouped at the lowest level for which there are separately identifiable cash flows or future service potential.
Where an impairment results from a loss in economic value or service potential, the loss is recognised as an operating cost in the Statement of Comprehensive Net Expenditure. Any Revaluation Reserve balance associated with the impaired assets is then released to the General Fund. Impairment losses that do not result from such consumption of economic benefits are first applied against any existing amounts in the Revaluation Reserve before any remaining loss is recognised as an operating cost.
1.5 Financial assetsWe recognise a financial asset when we gain a contractual right to the asset. The exception is where the financial asset is consideration from customers for services provided. In these cases we recognise the financial asset when our revenue recognition criteria are met (set out in Note 1.14). We remove a financial asset from our Statement of Financial Position when we no longer have a contractual right to the asset, or when the asset is transferred to another party.
Our financial assets other than cash and equivalents are classified as loans and receivables and on initial recognition are measured at fair value. Subsequent to initial recognition they are measured at amortised cost.
Our financial assets consist of cash and equivalents, trade and other receivables, accrued income and work in progress.
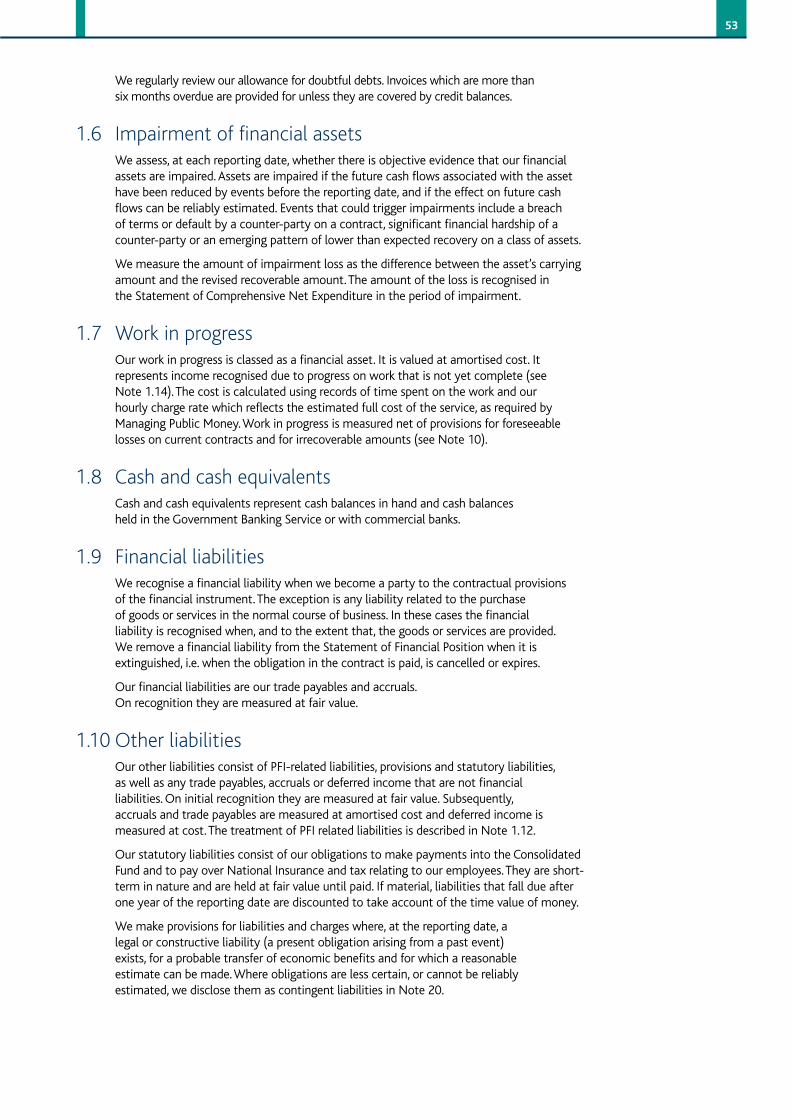
53
We regularly review our allowance for doubtful debts. Invoices which are more than six months overdue are provided for unless they are covered by credit balances.
1.6 Impairment of financial assetsWe assess, at each reporting date, whether there is objective evidence that our financial assets are impaired. Assets are impaired if the future cash flows associated with the asset have been reduced by events before the reporting date, and if the effect on future cash flows can be reliably estimated. Events that could trigger impairments include a breach of terms or default by a counter-party on a contract, significant financial hardship of a counter-party or an emerging pattern of lower than expected recovery on a class of assets.
We measure the amount of impairment loss as the difference between the asset’s carrying amount and the revised recoverable amount. The amount of the loss is recognised in the Statement of Comprehensive Net Expenditure in the period of impairment.
1.7 Work in progressOur work in progress is classed as a financial asset. It is valued at amortised cost. It represents income recognised due to progress on work that is not yet complete (see Note 1.14). The cost is calculated using records of time spent on the work and our hourly charge rate which reflects the estimated full cost of the service, as required by Managing Public Money. Work in progress is measured net of provisions for foreseeable losses on current contracts and for irrecoverable amounts (see Note 10).
1.8 Cash and cash equivalentsCash and cash equivalents represent cash balances in hand and cash balances held in the Government Banking Service or with commercial banks.
1.9 Financial liabilitiesWe recognise a financial liability when we become a party to the contractual provisions of the financial instrument. The exception is any liability related to the purchase of goods or services in the normal course of business. In these cases the financial liability is recognised when, and to the extent that, the goods or services are provided. We remove a financial liability from the Statement of Financial Position when it is extinguished, i.e. when the obligation in the contract is paid, is cancelled or expires.
Our financial liabilities are our trade payables and accruals. On recognition they are measured at fair value.
1.10 Other liabilitiesOur other liabilities consist of PFI-related liabilities, provisions and statutory liabilities, as well as any trade payables, accruals or deferred income that are not financial liabilities. On initial recognition they are measured at fair value. Subsequently, accruals and trade payables are measured at amortised cost and deferred income is measured at cost. The treatment of PFI related liabilities is described in Note 1.12.
Our statutory liabilities consist of our obligations to make payments into the Consolidated Fund and to pay over National Insurance and tax relating to our employees. They are short-term in nature and are held at fair value until paid. If material, liabilities that fall due after one year of the reporting date are discounted to take account of the time value of money.
We make provisions for liabilities and charges where, at the reporting date, a legal or constructive liability (a present obligation arising from a past event) exists, for a probable transfer of economic benefits and for which a reasonable estimate can be made. Where obligations are less certain, or cannot be reliably estimated, we disclose them as contingent liabilities in Note 20.
54 ValuationOfficeAgency Annual Report and Accounts 2012-13
1.11 Employee benefits
PensionsWe operate two different pension arrangements.
PrincipalCivilServicePensionScheme(PCSPS)The majority of past and present permanent staff members are part of the PCSPS, to which the conditions of the Superannuation Acts 1965 and 1972 and subsequent amendments apply. The PCSPS is accounted for as a defined contribution scheme despite being a defined benefit scheme. Owing to the largely unfunded, multi-employer nature of the scheme, it is not possible to identify the assets and liabilities associated with any one employer. Actual contributions to the scheme are used as the basis for the charge to the Statement of Comprehensive Net Expenditure. We do not recognise any PCSPS assets or liabilities.
Pension scheme members who first joined the Civil Service pensions arrangements by 30 July 2007 have their benefits calculated as a fraction of their final salary. Members first joining the arrangements after this date are entitled to benefits based on career average salary. The Civil Service also offers the option of defined-contribution stakeholder pension arrangements. Employer contributions to these arrangements are expensed in the period in which the employee earns them.
LocalGovernmentPensionScheme(LGPS)We merged with The Rent Service in April 2009, taking on staff who are members of the LGPS. This is a funded defined benefit scheme. Entitlement to benefits is based on a scheme member’s final salary.
The LGPS is accounted for in accordance with IAS 19 – Employee Benefits. The Statement of Financial Position includes an LGPS liability, which is the present value of the defined benefit obligation to staff minus the fair value of the scheme assets attributable to the VOA.
Independent actuaries value the defined benefit obligation using the projected unit method – an assessment of the future payments that will be made in relation to retirement benefits earned to date by employees.
The scheme managers carry out a formal valuation of the scheme’s assets and liabilities for the purpose of setting employers’ contributions every three years.
We charge current service costs, interest on the scheme liabilities, gains and losses on settlements or curtailments and the expected return on assets as operating costs on the Statement of Comprehensive Net Expenditure in the period in which they occur. Past service costs are charged to the Statement of Comprehensive Net Expenditure immediately after they arise.
Actuarial gains and losses arising from experience adjustments and changes in actuarial assumptions are recognised in reserves in the period in which they arise.
Annualleaveandothershort-termemployeebenefitsWe recognise employee entitlements to untaken annual leave when they accrue to employees. We provide for the estimated liability for leave earned but not taken by employees at 31 March each year.
Until 2010-11 our people were allowed to transfer up to ten days of leave per year into a ‘bank’. Such banked leave may be held indefinitely for use at a future time or may result in pay in lieu of the leave when the employee leaves. We have withdrawn the right to add further leave to the bank, but the historical bank balance remains, and forms the majority of our leave liability. As a result there is substantial uncertainty as to the timing and value of the outgoing future economic benefits that will settle this liability. We therefore record the liability as a provision.
EarlydeparturecostsCosts of early departures are recognised when we are committed to the departure without reasonable possibility of withdrawal. They are disclosed in Note 3b. The increased pension liabilities in respect of LGPS members due to early departures are recognised within the pension liability (Note 16). Liabilities in respect of other departures are recognised in the provision for early departure and additional pension commitments.
55
1.12 Private Finance Initiative (PFI) transactionsHM Treasury has determined that Government bodies shall account for infrastructure PFI schemes ‘on balance sheet’ where:
- we control the service provided using the infrastructure; and - we control a significant residual interest in the infrastructure at the end of the
arrangement; or- the arrangement meets the definition of a finance lease under IAS 17 - Leases.
‘On balance sheet’ means that an asset and corresponding liability appear in our Statement of Financial Position. We have consequently recognised four ‘on balance sheet’ PFI assets together with liabilities to pay for them. The services received under the contract are recorded as operating expenses. We continue to treat ‘off balance sheet’ PFI-procured assets as operating leases, and do not recognise assets and liabilities in respect of them. The land elements of all leases are treated as operating leases.
For ‘on balance sheet’ PFI schemes, we separate the annual payments into the following component parts, using appropriate estimation techniques where necessary:
- repayment of the principal element of the imputed financing arrangement;- interest charged on the imputed principal outstanding; and- the remaining expenditure, including contingent rents, rents for land and charges for
services associated with the buildings.
The first element is treated as repayment of financing and used to write down the PFI liability in the Statement of Financial Position. The final two elements are charged to the Statement of Comprehensive Net Expenditure. PFI assets are treated in the same way as other property, plant and equipment, as discussed above.
Details of our PFI arrangements can be found in Note 19.
1.13 Leases
Our non-PFI leases are all operating leases (i.e. the risks and rewards of ownership remain with the lessor). Rentals paid under operating lease agreements are charged to the Statement of Comprehensive Net Expenditure over the period of the lease term, in order to reflect the consumption of economic benefit. The future obligations for the lease rentals for the period ended 31 March 2013 are disclosed in Note 18.
1.14 Operating incomeOperating income comprises fees and charges for services provided to other Government departments, agencies, non-departmental public bodies and external customers and is recorded net of Value Added Tax.
We recognise revenue when:
- the amount of revenue can be reliably measured;- it is probable that future economic benefits will flow to us; and- the services for which the revenue is receivable or has been received have been performed.
We set our charges for our statutory and non-statutory work in order to recover the full cost of services from clients. We recognise revenue as we incur the costs of providing the services.
For most statutory work, our service level agreements with our customers are for year-long periods matching our reporting years. We recognise the revenue for an agreement in the year to which the agreement pertains.
For non-statutory services and a small amount of statutory work, we record the time worked on each customer contract and recognise as revenue an amount equal to the estimated fully-absorbed cost of each hour of work as the hour is recorded. Where there is indication that costs incurred on a contract will not be recoverable, for example if costs exceed the value of a fixed price contract, further revenue is not recognised. Revenue is measured net of an estimate of foreseeable losses on current contracts and of an estimate of amounts that we are unlikely to recover from clients.
56 ValuationOfficeAgency Annual Report and Accounts 2012-13
1.15 Administration and programme expenditure
As a net-funded agency, the VOA’s expenditure does not fall inside the administration budgets set in the 2010 Spending Review. All our expenditure is therefore classified as programme expenditure.
Operating costs are recognised when, and to the extent that, the goods or services for which they are incurred have been provided.
1.16 Value Added TaxApart from some Property Services income, most of our activities are outside the scope of VAT. In general output tax does not apply and input tax on purchases is not recoverable. Some input VAT on a restricted number of services is recovered under Section 41(3) of the VAT Act 1994 and in accordance with the HM Treasury ‘Contracting-out Direction’. Section 41(3) is intended to remove any disincentive to Government departments of contracting-out activities performed ‘in-house’ where there is a sound basis for doing so. In addition, we recover a portion of the VAT on our inputs calculated to reflect the portion of our output services which are within the scope of VAT. We charge irrecoverable VAT to the relevant expenditure category or include it in the capitalised purchase cost of fixed assets.
1.17 Civil penaltiesWe levy civil penalties for the failure to submit Forms of Return deemed essential for the assessment of rateable values. We do not account for receipts of these penalties in the Statement of Comprehensive Net Expenditure as we have no claim on them and must surrender them to the Consolidated Fund. Therefore they are recognised as a liability on the Statement of Financial Position and shown as receipts and payments in the Cash Flow Statement.
1.18 Critical accounting judgements and key sources of estimation uncertaintyThe preparation of the financial statements requires the use of estimates and assumptions. Although we base judgements and estimates on our best knowledge of current events and actions, actual results may differ from our assumptions. The most significant estimates and areas of management judgement made in the accounts relate to:
- Provisionsforlegalclaimsandearlydepartures(Note14)Concerning legal claims, judgement is required to estimate the likelihood of a case being found against us and to estimate the most likely amount that we would be required to pay. Both estimates are made based on past experience and the advice of our legal advisors.
Regarding early departures, there is not normally any doubt that the liability exists, but it is necessary to estimate the future cashflows based on quotes from our pensions administrator. From past experience, cashflows vary from forecast on average by 21%. Cashflows are also subject to a discount factor. We apply the Treasury pensions discount rate, currently 2.35%. In certain cases there may be doubt as to whether past events create an obligation on us to pay early departure costs. We consider the status of our plans, announcements to staff and other factors and use our judgement to determine whether we have an obligation. At 31 March 2013 £829k (2011-12: £845k) of costs are provided where judgement has been used to determine that a constructive obligation exists.
- Estimationofrecoverabilityandforeseeablelossesonworkinprogress(Note10)We estimate the extent to which work in progress will not be recovered by referring to historical trends which indicate that balances relating to cases that have not been worked on for more than six months are unlikely to be billed and recovered. A 10% error in the estimate of unrecoverable amounts would alter the overall work in progress balance by less than 1%.
Similarly, an estimate is made for foreseeable losses on fixed term contracts by considering past performance on such contracts. A 10% error in estimating foreseeable losses would alter the overall work in progress balance by 1%.
57
- TreatmentoftheSTEPSandASPIREcontracts(Note19)Both contracts are complex and it has been necessary for us to use judgement in determining the economic substance of the arrangements.
A number of judgements have been made regarding the treatment of the STEPS contract. The extent of our residual interest in the properties beyond the end of the contract is a matter of judgement, as the contract gives us some rights. We have judged that for all but three properties these rights do not grant significant control. In addition, the classification of properties between on and off balance sheet requires judgements to be made about the useful lives of the buildings and the extent of the other rights that the leases grant us.
Addressing the ASPIRE contract, the principal judgements are that the contract does not give us the use of particular assets and that it does not give any continuing right to use any assets throughout and beyond the contract period. The contract is therefore not accounted for on balance sheet. More details can be found in Note 19.
- MeasurementoftheLGPSpensionliability(Note16)The present value of our net pension obligation under the LGPS depends on a number of factors which are actuarially determined on the basis of a set of assumptions. Key assumptions include the discount rate to be applied, inflation forecasts, long-term changes in member salaries, future return on assets and member mortality.
Assumptions are determined annually with the advice of the scheme actuary. Financial assumptions are made on the basis of market conditions at the reporting date. Mortality assumptions are made using the Club Vita longevity analysis.
The net liability is particularly sensitive to variations in the discount rate and in mortality. A change in the discount rate assumption by 0.1% would change the net liability by £2.4m. A one year increase in the mortality age would increase the net liability by £4.4m; a one year decrease would reduce it by £4.4m.
- Revaluationofassetsusingindices(Notes6and7)In previous years, all assets other than land and buildings were revalued using appropriate indices from the Office for National Statistics. In 2012-13 we have only applied indexation to developed software to ensure consistency with the approach followed by HMRC. Software has been indexed using the K5EX (Employment & Earnings – Average Weekly Earnings – Information & Communication) which is published on the Office for National Statistics’ website at: http://www.statistics.gov.uk/statbase/tsdtimezone.asp. We have used the average of the monthly index across 2012-13.
The impact of not revaluing the non-software assets in 2012-13 is not material.
- Measurementoftheprovisionforemployeeleaveliability(Note14)We use an employee-by-employee breakdown of actual leave balance and salary to calculate our liability for employee leave. The principal uncertainty is in respect of when the banked leave balance will be used. In the absence of information on the timing of staff members’ future use of their leave, we neither discount the liability nor include any forecast of future salary increases.
2. Operating segments for the year ended 31 March 2013In accordance with IFRS 8, we have identified four key factors to distinguish our reportable operating segments. These are:
- that the reportable operating segment engages in activities from which we earn revenues and incur expenses;
- that the reportable operating segment’s financial results are regularly reviewed by the chief operating decision maker to make decisions about allocation of resources to the segment and assess its performance;
- that the reportable operating segment has discrete financial information; and
- that the reportable operating segment provides a distinct service to its customers.
We consider our chief operating decision maker to be our Board. The segmental information below is based on the information presented to the Board. The Board reviews financial information based on four reportable segments:
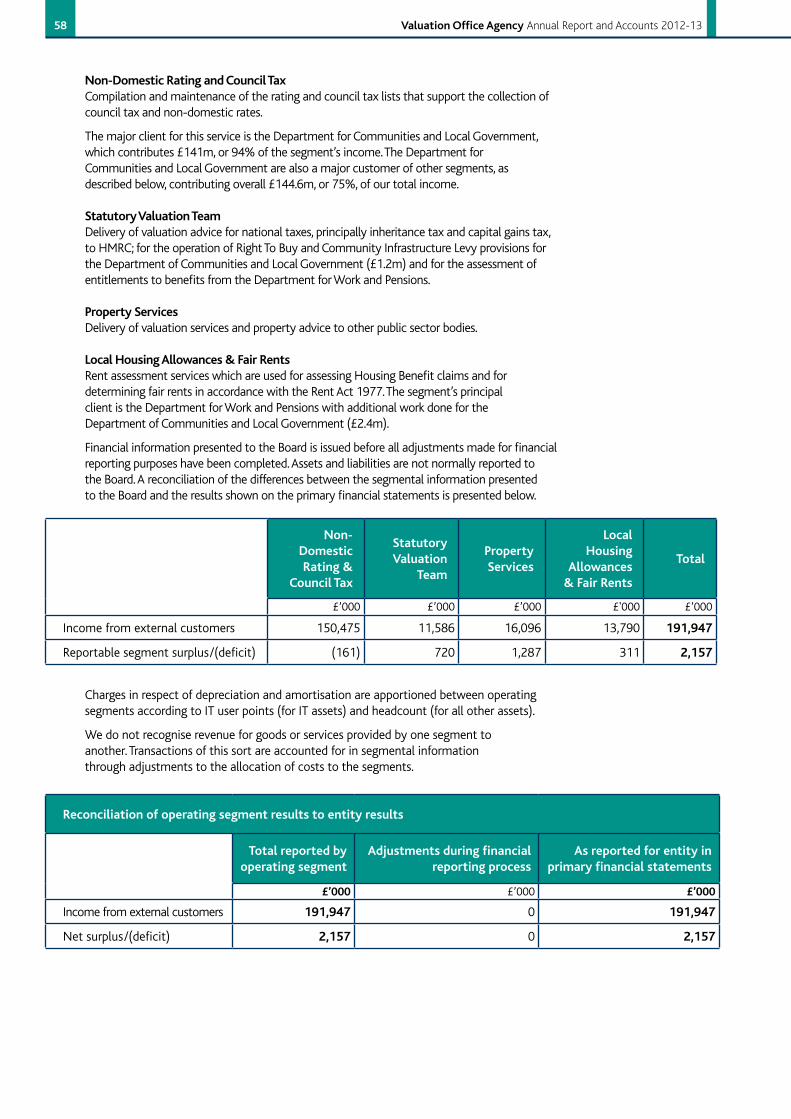
58 ValuationOfficeAgency Annual Report and Accounts 2012-13
Non-DomesticRatingandCouncilTaxCompilation and maintenance of the rating and council tax lists that support the collection of council tax and non-domestic rates.
The major client for this service is the Department for Communities and Local Government, which contributes £141m, or 94% of the segment’s income. The Department for Communities and Local Government are also a major customer of other segments, as described below, contributing overall £144.6m, or 75%, of our total income.
StatutoryValuationTeam Delivery of valuation advice for national taxes, principally inheritance tax and capital gains tax, to HMRC; for the operation of Right To Buy and Community Infrastructure Levy provisions for the Department of Communities and Local Government (£1.2m) and for the assessment of entitlements to benefits from the Department for Work and Pensions.
PropertyServicesDelivery of valuation services and property advice to other public sector bodies.
LocalHousingAllowances&FairRentsRent assessment services which are used for assessing Housing Benefit claims and for determining fair rents in accordance with the Rent Act 1977. The segment’s principal client is the Department for Work and Pensions with additional work done for the Department of Communities and Local Government (£2.4m).
Financial information presented to the Board is issued before all adjustments made for financial reporting purposes have been completed. Assets and liabilities are not normally reported to the Board. A reconciliation of the differences between the segmental information presented to the Board and the results shown on the primary financial statements is presented below.
Non-DomesticRating&
CouncilTax
Statutory Valuation
Team
PropertyServices
LocalHousing
Allowances&FairRents
Total
£’000 £’000 £’000 £'000 £’000
Income from external customers 150,475 11,586 16,096 13,790 191,947
Reportable segment surplus/(deficit) (161) 720 1,287 311 2,157
Charges in respect of depreciation and amortisation are apportioned between operating segments according to IT user points (for IT assets) and headcount (for all other assets).
We do not recognise revenue for goods or services provided by one segment to another. Transactions of this sort are accounted for in segmental information through adjustments to the allocation of costs to the segments.
Reconciliationofoperatingsegmentresultstoentityresults
Totalreportedbyoperatingsegment
Adjustmentsduringfinancialreportingprocess
Asreportedforentityinprimaryfinancialstatements
£’000 £’000 £’000
Income from external customers 191,947 0 191,947
Net surplus/(deficit) 2,157 0 2,157
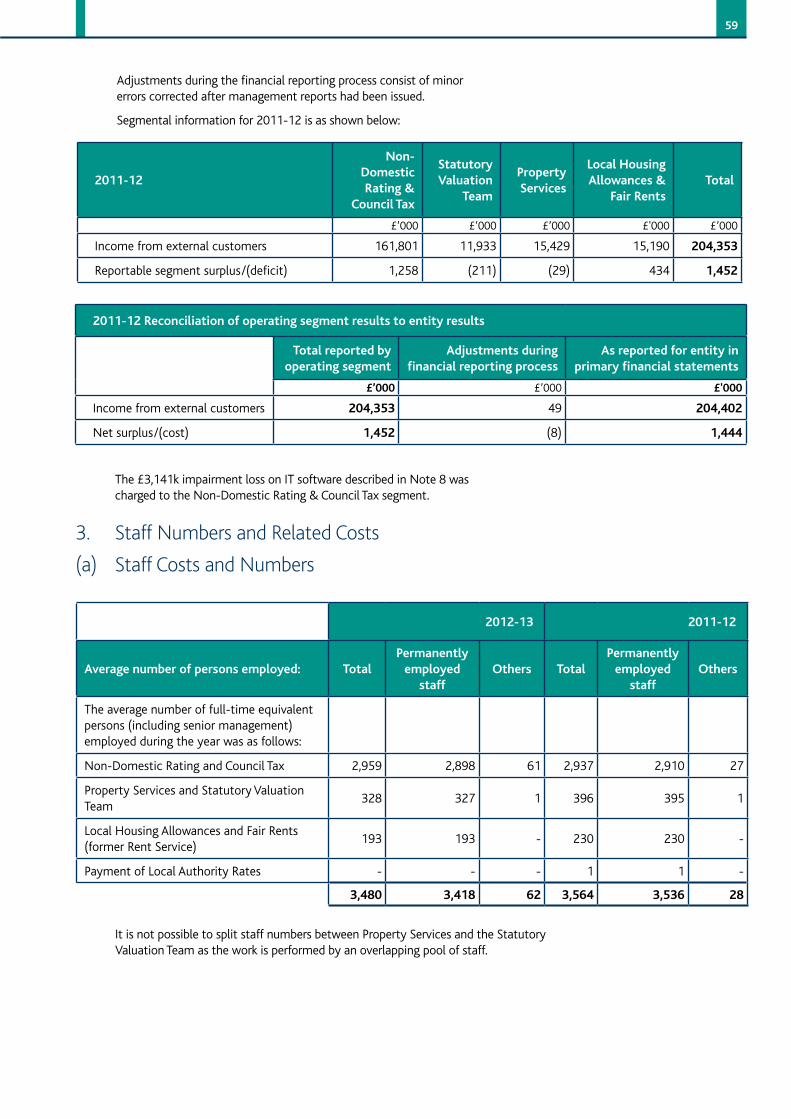
59
2011-12Reconciliationofoperatingsegmentresultstoentityresults
Totalreportedbyoperatingsegment
Adjustmentsduringfinancialreportingprocess
Asreportedforentityinprimaryfinancialstatements
£’000 £’000 £'000
Income from external customers 204,353 49 204,402
Net surplus/(cost) 1,452 (8) 1,444
Adjustments during the financial reporting process consist of minor errors corrected after management reports had been issued.
Segmental information for 2011-12 is as shown below:
2011-12
Non-DomesticRating&
CouncilTax
Statutory Valuation
Team
PropertyServices
LocalHousingAllowances&
FairRentsTotal
£’000 £’000 £’000 £'000 £’000
Income from external customers 161,801 11,933 15,429 15,190 204,353
Reportable segment surplus/(deficit) 1,258 (211) (29) 434 1,452
The £3,141k impairment loss on IT software described in Note 8 was charged to the Non-Domestic Rating & Council Tax segment.
3. Staff Numbers and Related Costs
(a) Staff Costs and Numbers
2012-13 2011-12
Averagenumberofpersonsemployed: Total Permanentlyemployed
staffOthers Total
Permanentlyemployed
staffOthers
The average number of full-time equivalent persons (including senior management) employed during the year was as follows:
Non-Domestic Rating and Council Tax 2,959 2,898 61 2,937 2,910 27
Property Services and Statutory Valuation Team
328 327 1 396 395 1
Local Housing Allowances and Fair Rents (former Rent Service)
193 193 - 230 230 -
Payment of Local Authority Rates - - - 1 1 -
3,480 3,418 62 3,564 3,536 28
It is not possible to split staff numbers between Property Services and the Statutory Valuation Team as the work is performed by an overlapping pool of staff.
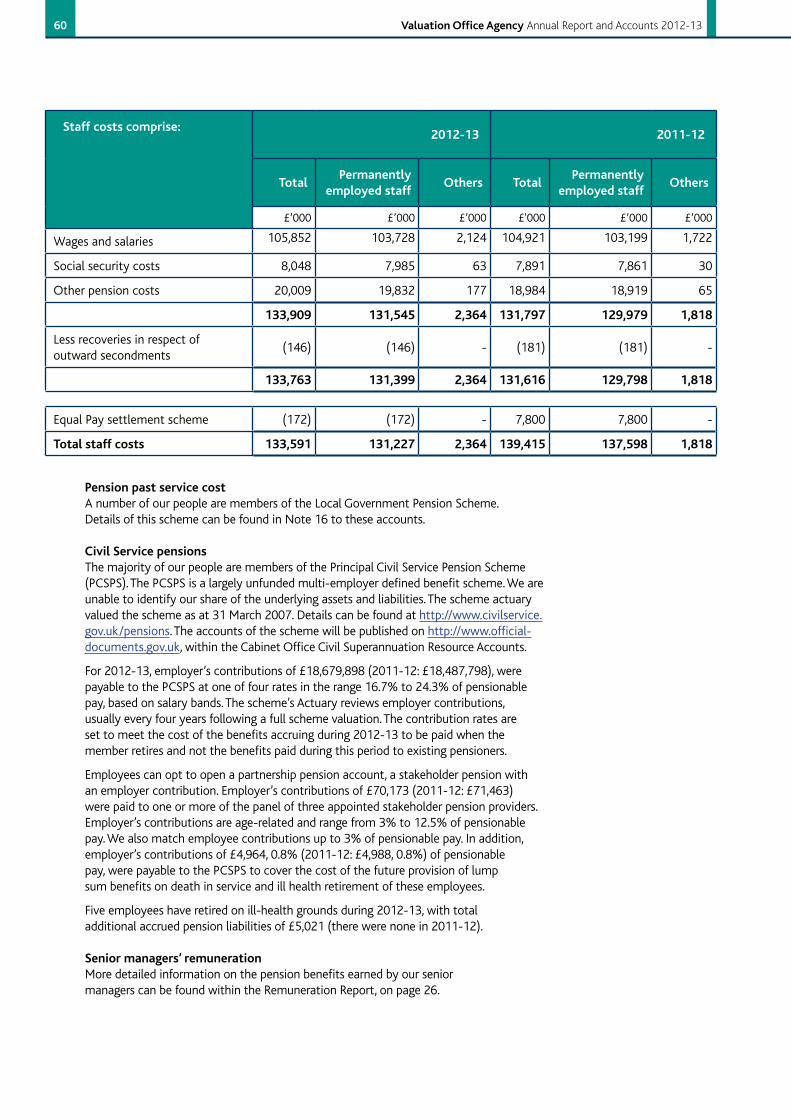
60 ValuationOfficeAgency Annual Report and Accounts 2012-13
Staffcostscomprise:2012-13 2011-12
Total Permanently
employedstaffOthers Total
Permanentlyemployedstaff
Others
£’000 £’000 £’000 £'000 £’000 £’000
Wages and salaries 105,852 103,728 2,124 104,921 103,199 1,722
Social security costs 8,048 7,985 63 7,891 7,861 30
Other pension costs 20,009 19,832 177 18,984 18,919 65
133,909 131,545 2,364 131,797 129,979 1,818
Less recoveries in respect of outward secondments
(146) (146) - (181) (181) -
133,763 131,399 2,364 131,616 129,798 1,818
Equal Pay settlement scheme (172) (172) - 7,800 7,800 -
Totalstaffcosts 133,591 131,227 2,364 139,415 137,598 1,818
PensionpastservicecostA number of our people are members of the Local Government Pension Scheme. Details of this scheme can be found in Note 16 to these accounts.
CivilServicepensionsThe majority of our people are members of the Principal Civil Service Pension Scheme (PCSPS). The PCSPS is a largely unfunded multi-employer defined benefit scheme. We are unable to identify our share of the underlying assets and liabilities. The scheme actuary valued the scheme as at 31 March 2007. Details can be found at http://www.civilservice.gov.uk/pensions. The accounts of the scheme will be published on http://www.official-documents.gov.uk, within the Cabinet Office Civil Superannuation Resource Accounts.
For 2012-13, employer’s contributions of £18,679,898 (2011-12: £18,487,798), were payable to the PCSPS at one of four rates in the range 16.7% to 24.3% of pensionable pay, based on salary bands. The scheme’s Actuary reviews employer contributions, usually every four years following a full scheme valuation. The contribution rates are set to meet the cost of the benefits accruing during 2012-13 to be paid when the member retires and not the benefits paid during this period to existing pensioners.
Employees can opt to open a partnership pension account, a stakeholder pension with an employer contribution. Employer’s contributions of £70,173 (2011-12: £71,463) were paid to one or more of the panel of three appointed stakeholder pension providers. Employer’s contributions are age-related and range from 3% to 12.5% of pensionable pay. We also match employee contributions up to 3% of pensionable pay. In addition, employer’s contributions of £4,964, 0.8% (2011-12: £4,988, 0.8%) of pensionable pay, were payable to the PCSPS to cover the cost of the future provision of lump sum benefits on death in service and ill health retirement of these employees.
Five employees have retired on ill-health grounds during 2012-13, with total additional accrued pension liabilities of £5,021 (there were none in 2011-12).
Seniormanagers’remunerationMore detailed information on the pension benefits earned by our senior managers can be found within the Remuneration Report, on page 26.
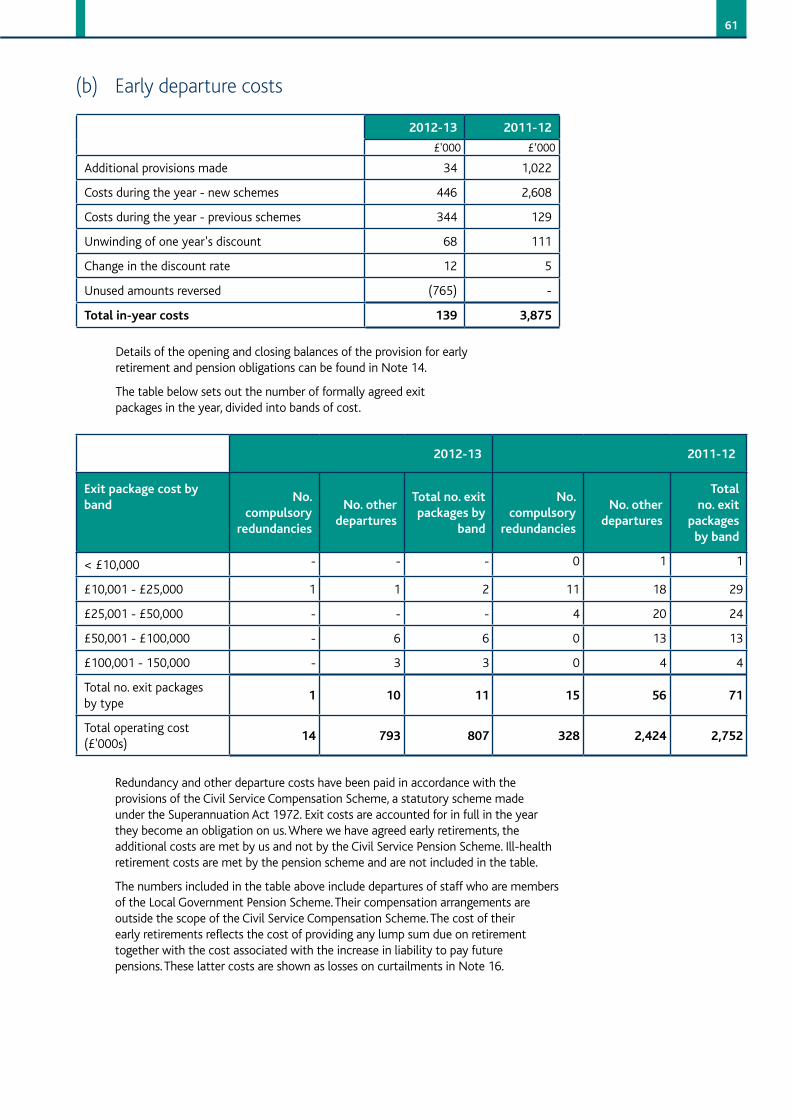
61
(b) Early departure costs
2012-13 2011-12
£'000 £’000
Additional provisions made 34 1,022
Costs during the year - new schemes 446 2,608
Costs during the year - previous schemes 344 129
Unwinding of one year's discount 68 111
Change in the discount rate 12 5
Unused amounts reversed (765) -
Totalin-yearcosts 139 3,875
Details of the opening and closing balances of the provision for early retirement and pension obligations can be found in Note 14.
The table below sets out the number of formally agreed exit packages in the year, divided into bands of cost.
2012-13 2011-12
Exitpackagecostbyband
No.compulsory
redundancies
No.otherdepartures
Totalno.exitpackagesby
band
No.compulsory
redundancies
No.otherdepartures
Total no.exit
packagesbyband
< £10,000 - - - 0 1 1
£10,001 - £25,000 1 1 2 11 18 29
£25,001 - £50,000 - - - 4 20 24
£50,001 - £100,000 - 6 6 0 13 13
£100,001 - 150,000 - 3 3 0 4 4
Total no. exit packages by type
1 10 11 15 56 71
Total operating cost (£'000s)
14 793 807 328 2,424 2,752
Redundancy and other departure costs have been paid in accordance with the provisions of the Civil Service Compensation Scheme, a statutory scheme made under the Superannuation Act 1972. Exit costs are accounted for in full in the year they become an obligation on us. Where we have agreed early retirements, the additional costs are met by us and not by the Civil Service Pension Scheme. Ill-health retirement costs are met by the pension scheme and are not included in the table.
The numbers included in the table above include departures of staff who are members of the Local Government Pension Scheme. Their compensation arrangements are outside the scope of the Civil Service Compensation Scheme. The cost of their early retirements reflects the cost of providing any lump sum due on retirement together with the cost associated with the increase in liability to pay future pensions. These latter costs are shown as losses on curtailments in Note 16.
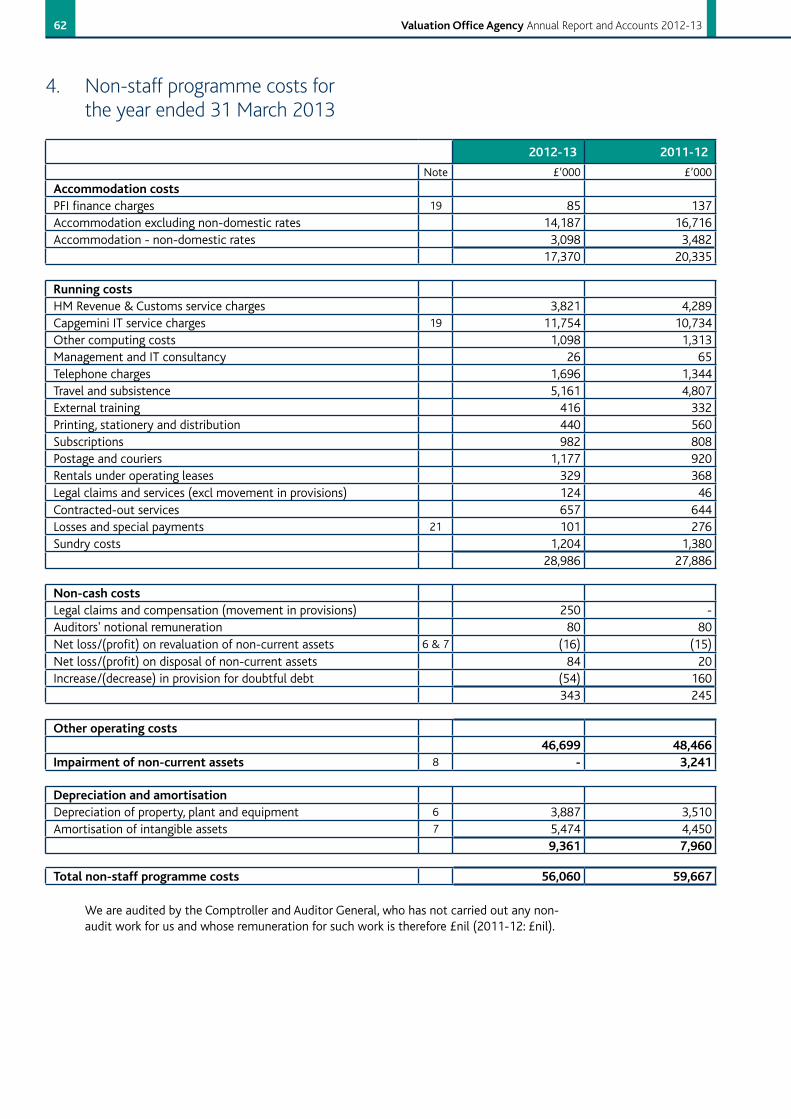
62 ValuationOfficeAgency Annual Report and Accounts 2012-13
4. Non-staff programme costs for the year ended 31 March 2013
2012-13 2011-12
Note £’000 £’000
AccommodationcostsPFI finance charges 19 85 137Accommodation excluding non-domestic rates 14,187 16,716Accommodation - non-domestic rates 3,098 3,482
17,370 20,335
RunningcostsHM Revenue & Customs service charges 3,821 4,289Capgemini IT service charges 19 11,754 10,734Other computing costs 1,098 1,313Management and IT consultancy 26 65Telephone charges 1,696 1,344Travel and subsistence 5,161 4,807External training 416 332Printing, stationery and distribution 440 560Subscriptions 982 808Postage and couriers 1,177 920Rentals under operating leases 329 368Legal claims and services (excl movement in provisions) 124 46Contracted-out services 657 644Losses and special payments 21 101 276Sundry costs 1,204 1,380
28,986 27,886
Non-cashcostsLegal claims and compensation (movement in provisions) 250 -Auditors' notional remuneration 80 80Net loss/(profit) on revaluation of non-current assets 6 & 7 (16) (15)Net loss/(profit) on disposal of non-current assets 84 20Increase/(decrease) in provision for doubtful debt (54) 160
343 245
Otheroperatingcosts46,699 48,466
Impairmentofnon-currentassets 8 - 3,241
DepreciationandamortisationDepreciation of property, plant and equipment 6 3,887 3,510Amortisation of intangible assets 7 5,474 4,450
9,361 7,960
Totalnon-staffprogrammecosts 56,060 59,667
We are audited by the Comptroller and Auditor General, who has not carried out any non-audit work for us and whose remuneration for such work is therefore £nil (2011-12: £nil).
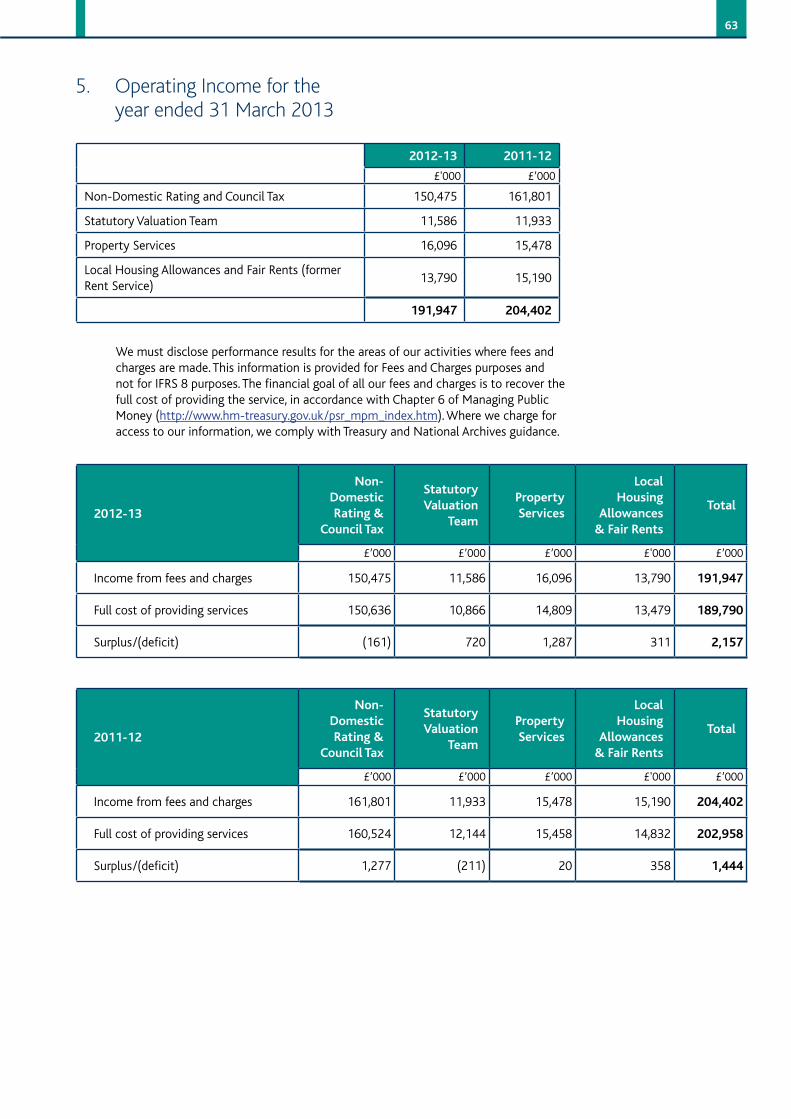
63
5. Operating Income for the year ended 31 March 2013
2012-13 2011-12
£'000 £’000
Non-Domestic Rating and Council Tax 150,475 161,801
Statutory Valuation Team 11,586 11,933
Property Services 16,096 15,478
Local Housing Allowances and Fair Rents (former Rent Service)
13,790 15,190
191,947 204,402
We must disclose performance results for the areas of our activities where fees and charges are made. This information is provided for Fees and Charges purposes and not for IFRS 8 purposes. The financial goal of all our fees and charges is to recover the full cost of providing the service, in accordance with Chapter 6 of Managing Public Money (http://www.hm-treasury.gov.uk/psr_mpm_index.htm). Where we charge for access to our information, we comply with Treasury and National Archives guidance.
2012-13
Non-DomesticRating&
CouncilTax
Statutory Valuation
Team
PropertyServices
LocalHousing
Allowances&FairRents
Total
£’000 £’000 £’000 £'000 £’000
Income from fees and charges 150,475 11,586 16,096 13,790 191,947
Full cost of providing services 150,636 10,866 14,809 13,479 189,790
Surplus/(deficit) (161) 720 1,287 311 2,157
2011-12
Non-DomesticRating&
CouncilTax
Statutory Valuation
Team
PropertyServices
LocalHousing
Allowances&FairRents
Total
£’000 £’000 £’000 £'000 £’000
Income from fees and charges 161,801 11,933 15,478 15,190 204,402
Full cost of providing services 160,524 12,144 15,458 14,832 202,958
Surplus/(deficit) 1,277 (211) 20 358 1,444
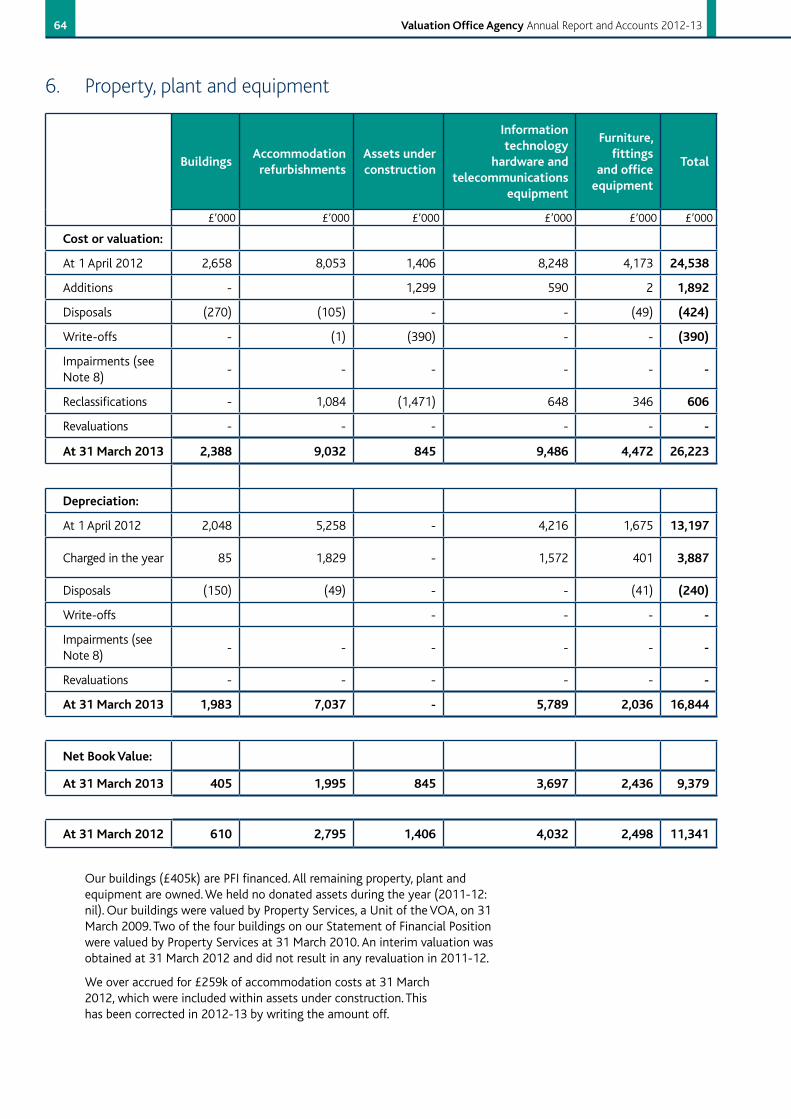
64 ValuationOfficeAgency Annual Report and Accounts 2012-13
6. Property, plant and equipment
BuildingsAccommodationrefurbishments
Assetsunderconstruction
Informationtechnology
hardware and telecommunications
equipment
Furniture,fittings
andofficeequipment
Total
£’000 £’000 £’000 £’000 £’000 £’000
Costorvaluation:
At 1 April 2012 2,658 8,053 1,406 8,248 4,173 24,538
Additions - 1,299 590 2 1,892
Disposals (270) (105) - - (49) (424)
Write-offs - (1) (390) - - (390)
Impairments (see Note 8)
- - - - - -
Reclassifications - 1,084 (1,471) 648 346 606
Revaluations - - - - - -
At31March2013 2,388 9,032 845 9,486 4,472 26,223
Depreciation:
At 1 April 2012 2,048 5,258 - 4,216 1,675 13,197
Charged in the year 85 1,829 - 1,572 401 3,887
Disposals (150) (49) - - (41) (240)
Write-offs - - - -
Impairments (see Note 8)
- - - - - -
Revaluations - - - - - -
At31March2013 1,983 7,037 - 5,789 2,036 16,844
NetBookValue:
At31March2013 405 1,995 845 3,697 2,436 9,379
At31March2012 610 2,795 1,406 4,032 2,498 11,341
Our buildings (£405k) are PFI financed. All remaining property, plant and equipment are owned. We held no donated assets during the year (2011-12: nil). Our buildings were valued by Property Services, a Unit of the VOA, on 31 March 2009. Two of the four buildings on our Statement of Financial Position were valued by Property Services at 31 March 2010. An interim valuation was obtained at 31 March 2012 and did not result in any revaluation in 2011-12.
We over accrued for £259k of accommodation costs at 31 March 2012, which were included within assets under construction. This has been corrected in 2012-13 by writing the amount off.
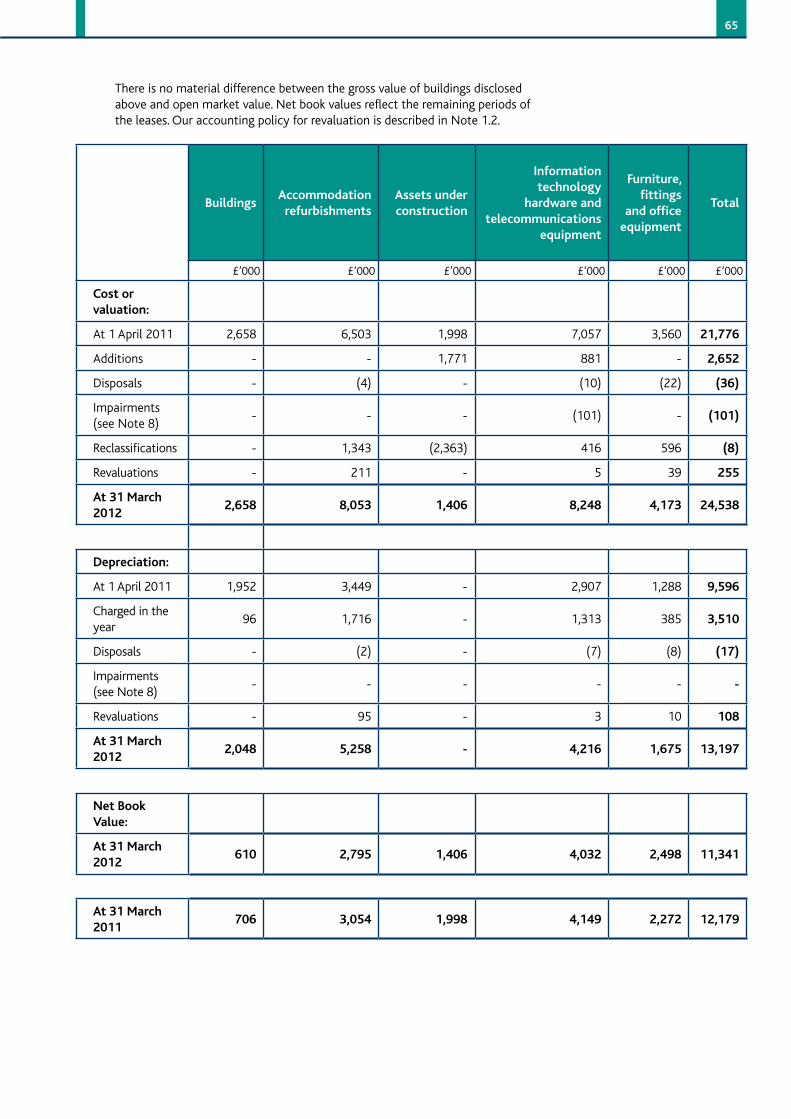
65
There is no material difference between the gross value of buildings disclosed above and open market value. Net book values reflect the remaining periods of the leases. Our accounting policy for revaluation is described in Note 1.2.
BuildingsAccommodationrefurbishments
Assetsunderconstruction
Informationtechnology
hardware and telecommunications
equipment
Furniture,fittings
andofficeequipment
Total
£’000 £’000 £’000 £’000 £’000 £’000
Cost or valuation:
At 1 April 2011 2,658 6,503 1,998 7,057 3,560 21,776
Additions - - 1,771 881 - 2,652
Disposals - (4) - (10) (22) (36)
Impairments (see Note 8)
- - - (101) - (101)
Reclassifications - 1,343 (2,363) 416 596 (8)
Revaluations - 211 - 5 39 255
At31March2012
2,658 8,053 1,406 8,248 4,173 24,538
Depreciation:
At 1 April 2011 1,952 3,449 - 2,907 1,288 9,596
Charged in the year
96 1,716 - 1,313 385 3,510
Disposals - (2) - (7) (8) (17)
Impairments (see Note 8)
- - - - - -
Revaluations - 95 - 3 10 108
At31March2012
2,048 5,258 - 4,216 1,675 13,197
NetBookValue:
At31March2012
610 2,795 1,406 4,032 2,498 11,341
At31March2011
706 3,054 1,998 4,149 2,272 12,179
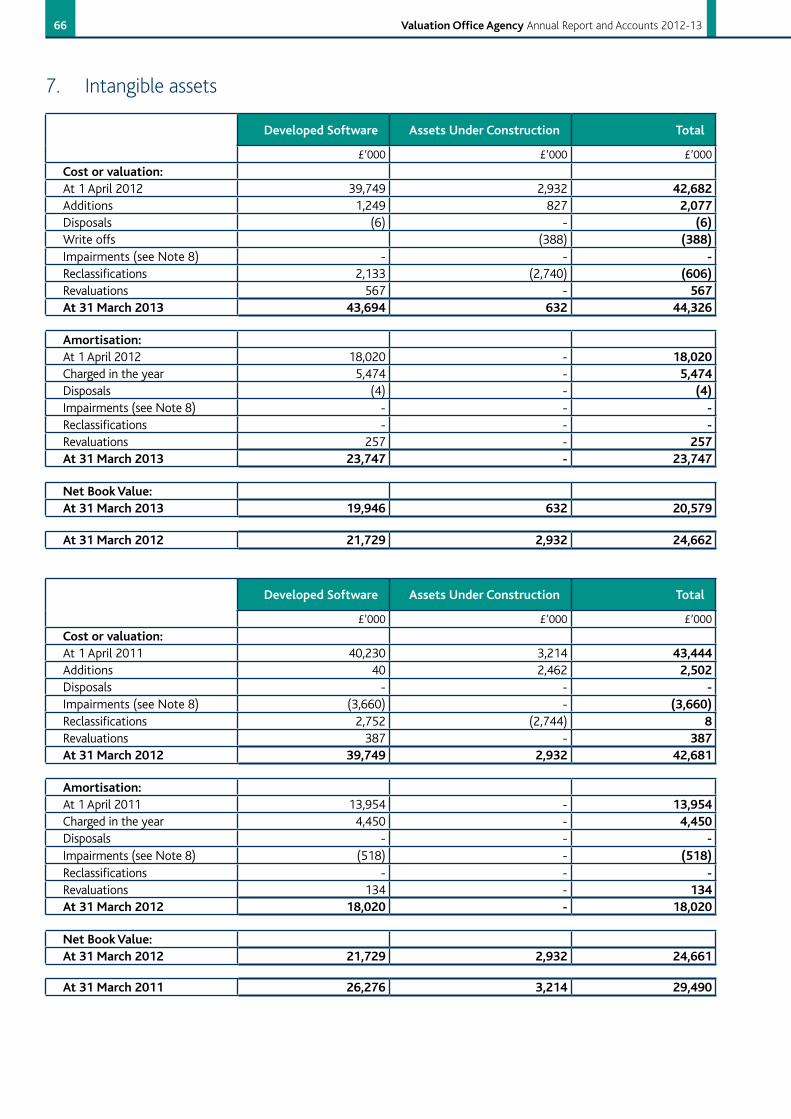
66 ValuationOfficeAgency Annual Report and Accounts 2012-13
7. Intangible assets
DevelopedSoftware AssetsUnderConstruction Total
£’000 £’000 £’000
Costorvaluation:At 1 April 2012 39,749 2,932 42,682Additions 1,249 827 2,077Disposals (6) - (6)Write offs (388) (388)Impairments (see Note 8) - - -Reclassifications 2,133 (2,740) (606)Revaluations 567 - 567At31March2013 43,694 632 44,326
Amortisation:At 1 April 2012 18,020 - 18,020Charged in the year 5,474 - 5,474Disposals (4) - (4)Impairments (see Note 8) - - -Reclassifications - - -Revaluations 257 - 257At31March2013 23,747 - 23,747
NetBookValue:At31March2013 19,946 632 20,579
At31March2012 21,729 2,932 24,662
DevelopedSoftware AssetsUnderConstruction Total
£’000 £’000 £’000
Costorvaluation:At 1 April 2011 40,230 3,214 43,444Additions 40 2,462 2,502Disposals - - -Impairments (see Note 8) (3,660) - (3,660)Reclassifications 2,752 (2,744) 8Revaluations 387 - 387At31March2012 39,749 2,932 42,681
Amortisation:At 1 April 2011 13,954 - 13,954Charged in the year 4,450 - 4,450Disposals - - -Impairments (see Note 8) (518) - (518)Reclassifications - - -Revaluations 134 - 134At31March2012 18,020 - 18,020
NetBookValue:At31March2012 21,729 2,932 24,661
At31March2011 26,276 3,214 29,490
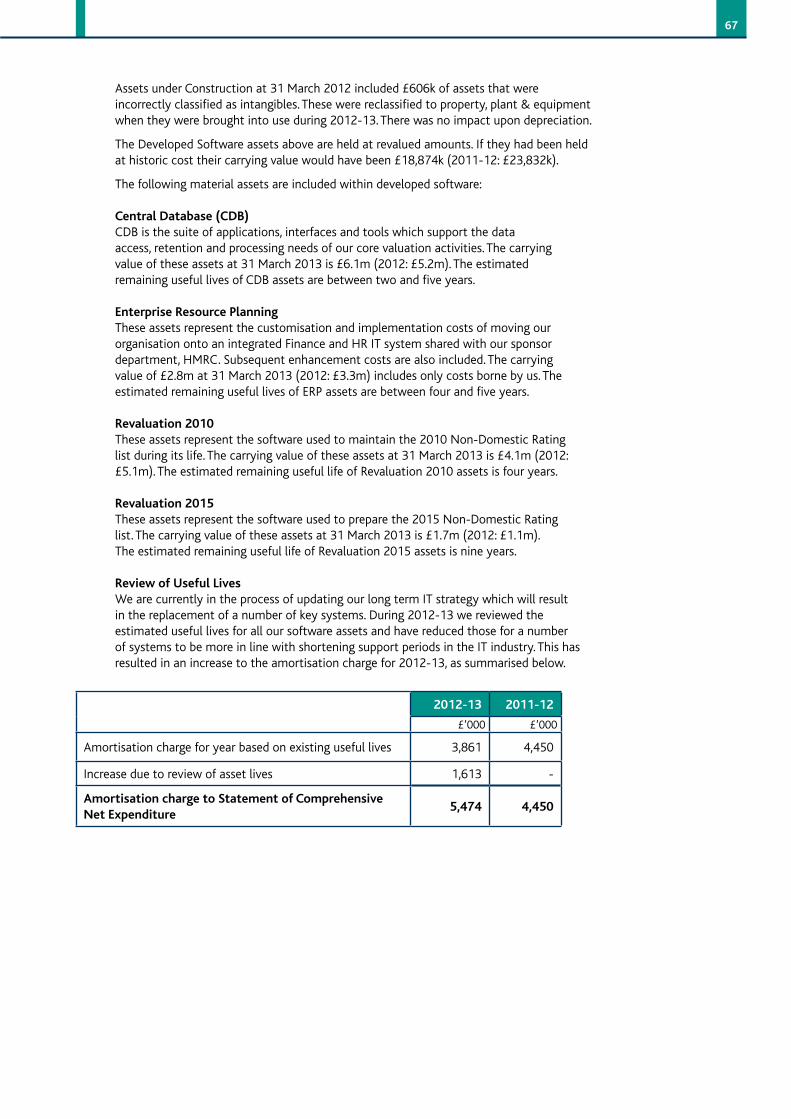
67
Assets under Construction at 31 March 2012 included £606k of assets that were incorrectly classified as intangibles. These were reclassified to property, plant & equipment when they were brought into use during 2012-13. There was no impact upon depreciation.
The Developed Software assets above are held at revalued amounts. If they had been held at historic cost their carrying value would have been £18,874k (2011-12: £23,832k).
The following material assets are included within developed software:
CentralDatabase(CDB)CDB is the suite of applications, interfaces and tools which support the data access, retention and processing needs of our core valuation activities. The carrying value of these assets at 31 March 2013 is £6.1m (2012: £5.2m). The estimated remaining useful lives of CDB assets are between two and five years.
EnterpriseResourcePlanningThese assets represent the customisation and implementation costs of moving our organisation onto an integrated Finance and HR IT system shared with our sponsor department, HMRC. Subsequent enhancement costs are also included. The carrying value of £2.8m at 31 March 2013 (2012: £3.3m) includes only costs borne by us. The estimated remaining useful lives of ERP assets are between four and five years.
Revaluation2010These assets represent the software used to maintain the 2010 Non-Domestic Rating list during its life. The carrying value of these assets at 31 March 2013 is £4.1m (2012: £5.1m). The estimated remaining useful life of Revaluation 2010 assets is four years.
Revaluation2015These assets represent the software used to prepare the 2015 Non-Domestic Rating list. The carrying value of these assets at 31 March 2013 is £1.7m (2012: £1.1m). The estimated remaining useful life of Revaluation 2015 assets is nine years.
ReviewofUsefulLivesWe are currently in the process of updating our long term IT strategy which will result in the replacement of a number of key systems. During 2012-13 we reviewed the estimated useful lives for all our software assets and have reduced those for a number of systems to be more in line with shortening support periods in the IT industry. This has resulted in an increase to the amortisation charge for 2012-13, as summarised below.
2012-13 2011-12
£’000 £’000
Amortisation charge for year based on existing useful lives 3,861 4,450
Increase due to review of asset lives 1,613 -
AmortisationchargetoStatementofComprehensiveNetExpenditure
5,474 4,450
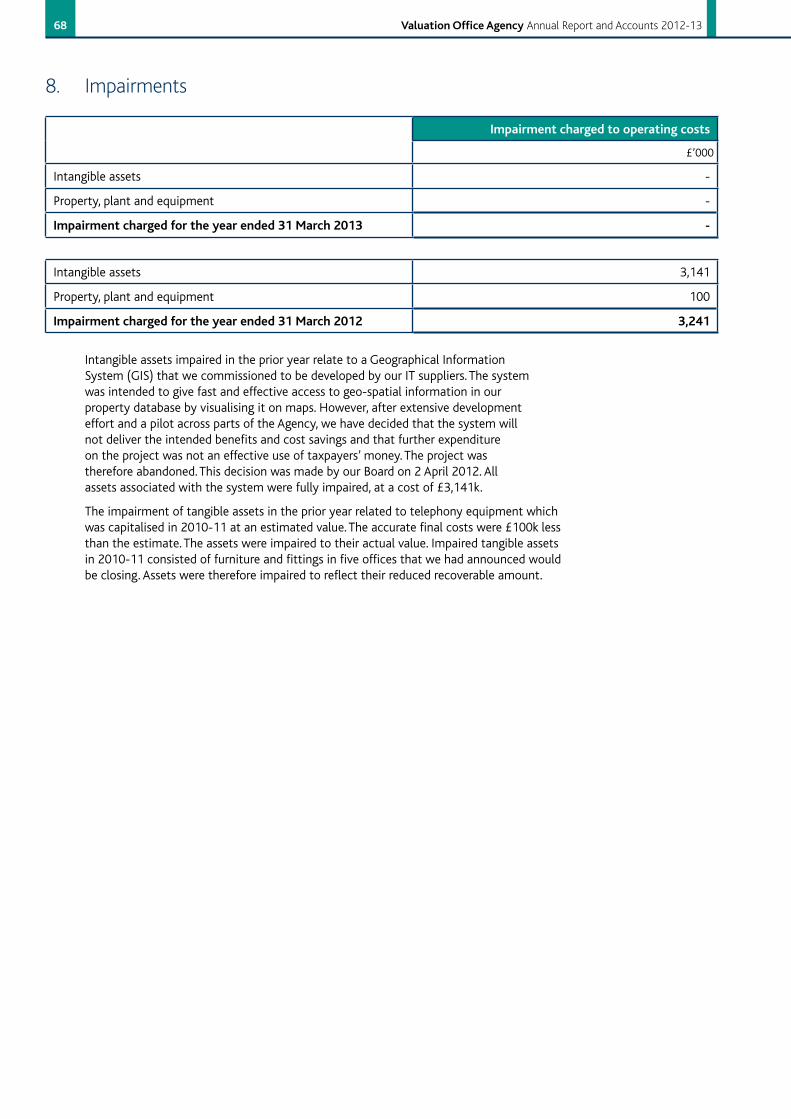
68 ValuationOfficeAgency Annual Report and Accounts 2012-13
8. Impairments
Impairmentchargedtooperatingcosts
£’000
Intangible assets -
Property, plant and equipment -
Impairmentchargedfortheyearended31March2013 -
Intangible assets 3,141
Property, plant and equipment 100
Impairmentchargedfortheyearended31March2012 3,241
Intangible assets impaired in the prior year relate to a Geographical Information System (GIS) that we commissioned to be developed by our IT suppliers. The system was intended to give fast and effective access to geo-spatial information in our property database by visualising it on maps. However, after extensive development effort and a pilot across parts of the Agency, we have decided that the system will not deliver the intended benefits and cost savings and that further expenditure on the project was not an effective use of taxpayers’ money. The project was therefore abandoned. This decision was made by our Board on 2 April 2012. All assets associated with the system were fully impaired, at a cost of £3,141k.
The impairment of tangible assets in the prior year related to telephony equipment which was capitalised in 2010-11 at an estimated value. The accurate final costs were £100k less than the estimate. The assets were impaired to their actual value. Impaired tangible assets in 2010-11 consisted of furniture and fittings in five offices that we had announced would be closing. Assets were therefore impaired to reflect their reduced recoverable amount.
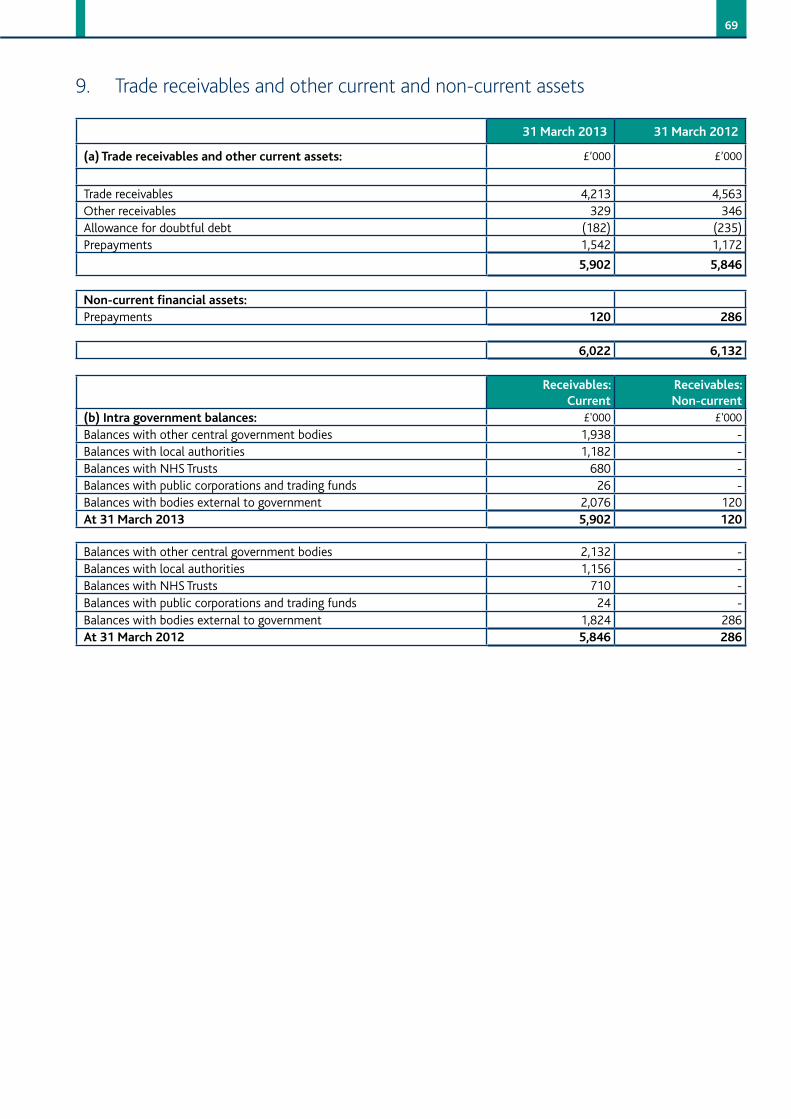
69
9. Trade receivables and other current and non-current assets
31March2013 31March2012
(a)Tradereceivablesandothercurrentassets: £’000 £’000
Trade receivables 4,213 4,563Other receivables 329 346Allowance for doubtful debt (182) (235)Prepayments 1,542 1,172
5,902 5,846
Non-currentfinancialassets:Prepayments 120 286
6,022 6,132
Receivables:Current
Receivables:Non-current
(b)Intragovernmentbalances: £'000 £'000
Balances with other central government bodies 1,938 -Balances with local authorities 1,182 -Balances with NHS Trusts 680 -Balances with public corporations and trading funds 26 -Balances with bodies external to government 2,076 120At31March2013 5,902 120
Balances with other central government bodies 2,132 -Balances with local authorities 1,156 -Balances with NHS Trusts 710 -Balances with public corporations and trading funds 24 -Balances with bodies external to government 1,824 286At31March2012 5,846 286
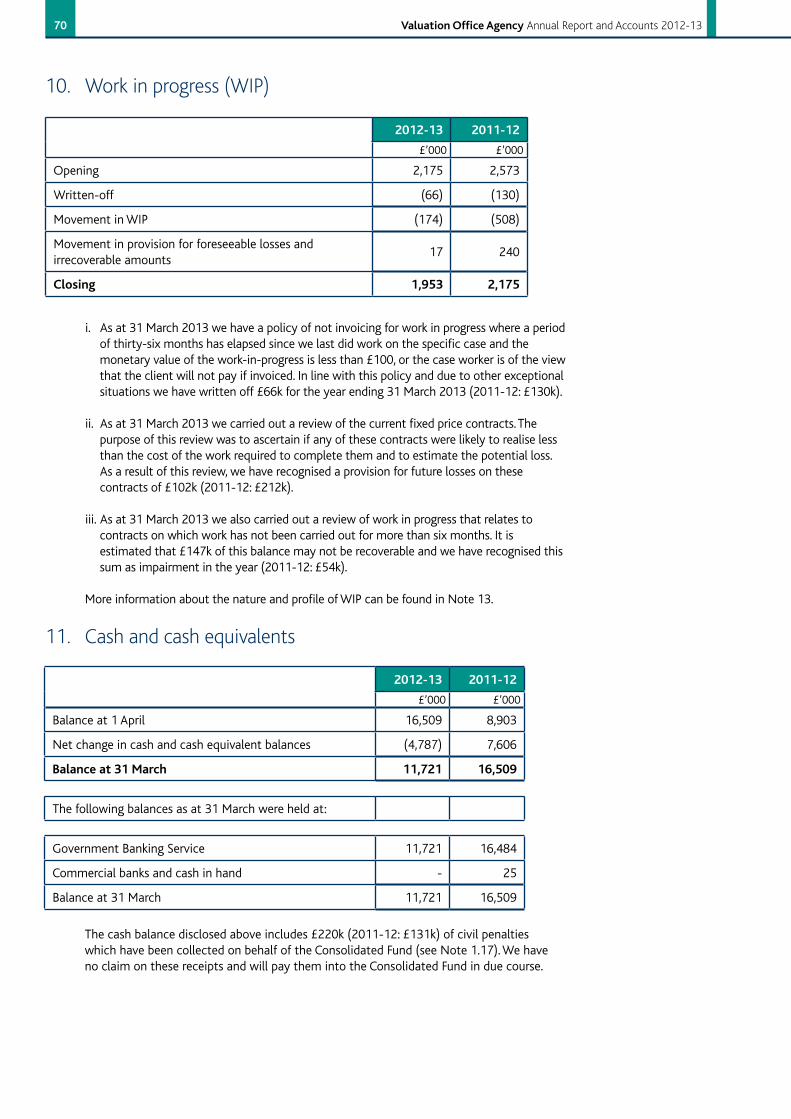
70 ValuationOfficeAgency Annual Report and Accounts 2012-13
10. Work in progress (WIP)
2012-13 2011-12
£’000 £’000
Opening 2,175 2,573
Written-off (66) (130)
Movement in WIP (174) (508)
Movement in provision for foreseeable losses and irrecoverable amounts
17 240
Closing 1,953 2,175
11. Cash and cash equivalents
i. As at 31 March 2013 we have a policy of not invoicing for work in progress where a period of thirty-six months has elapsed since we last did work on the specific case and the monetary value of the work-in-progress is less than £100, or the case worker is of the view that the client will not pay if invoiced. In line with this policy and due to other exceptional situations we have written off £66k for the year ending 31 March 2013 (2011-12: £130k).
ii. As at 31 March 2013 we carried out a review of the current fixed price contracts. The purpose of this review was to ascertain if any of these contracts were likely to realise less than the cost of the work required to complete them and to estimate the potential loss. As a result of this review, we have recognised a provision for future losses on these contracts of £102k (2011-12: £212k).
iii. As at 31 March 2013 we also carried out a review of work in progress that relates to contracts on which work has not been carried out for more than six months. It is estimated that £147k of this balance may not be recoverable and we have recognised this sum as impairment in the year (2011-12: £54k).
More information about the nature and profile of WIP can be found in Note 13.
2012-13 2011-12
£’000 £’000
Balance at 1 April 16,509 8,903
Net change in cash and cash equivalent balances (4,787) 7,606
Balanceat31March 11,721 16,509
The following balances as at 31 March were held at:
Government Banking Service 11,721 16,484
Commercial banks and cash in hand - 25
Balance at 31 March 11,721 16,509
The cash balance disclosed above includes £220k (2011-12: £131k) of civil penalties which have been collected on behalf of the Consolidated Fund (see Note 1.17). We have no claim on these receipts and will pay them into the Consolidated Fund in due course.
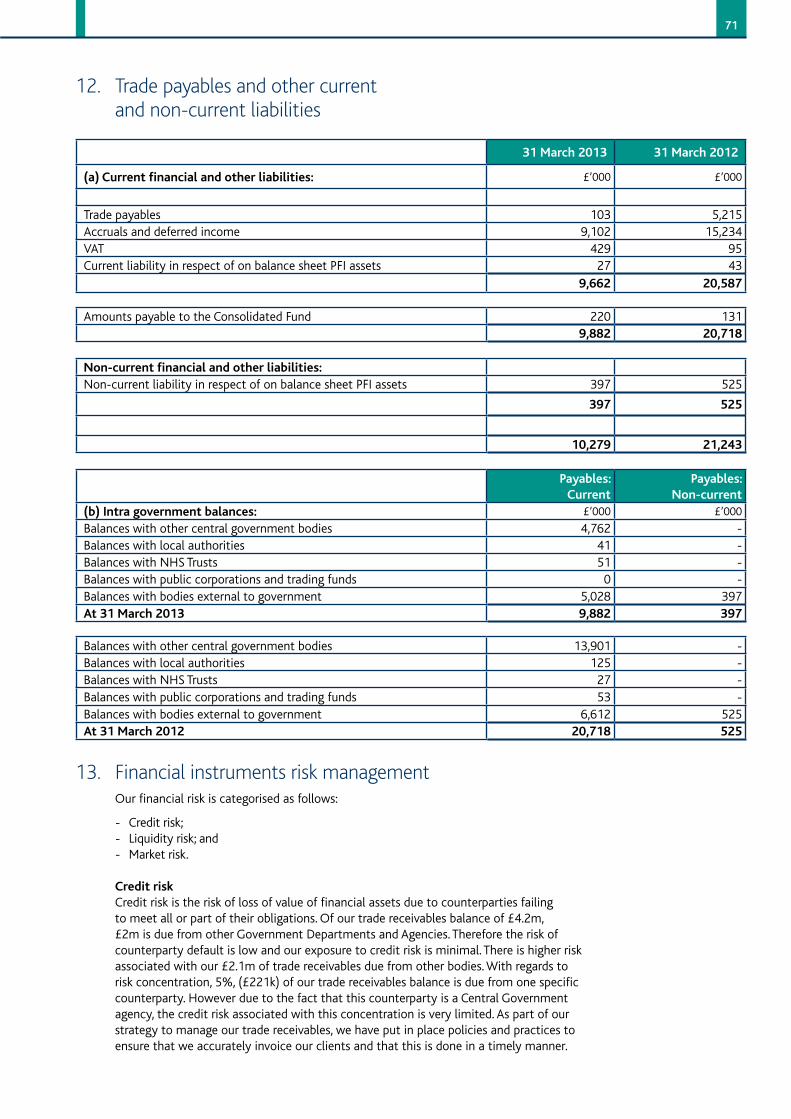
71
12. Trade payables and other current and non-current liabilities
31March2013 31March2012
(a)Currentfinancialandotherliabilities: £’000 £’000
Trade payables 103 5,215Accruals and deferred income 9,102 15,234VAT 429 95Current liability in respect of on balance sheet PFI assets 27 43
9,662 20,587
Amounts payable to the Consolidated Fund 220 1319,882 20,718
Non-currentfinancialandotherliabilities:Non-current liability in respect of on balance sheet PFI assets 397 525
397 525
10,279 21,243
Payables:Current
Payables:Non-current
(b)Intragovernmentbalances: £’000 £’000
Balances with other central government bodies 4,762 -Balances with local authorities 41 -Balances with NHS Trusts 51 -Balances with public corporations and trading funds 0 -Balances with bodies external to government 5,028 397At31March2013 9,882 397
Balances with other central government bodies 13,901 -Balances with local authorities 125 -Balances with NHS Trusts 27 -Balances with public corporations and trading funds 53 -Balances with bodies external to government 6,612 525At31March2012 20,718 525
13. Financial instruments risk management Our financial risk is categorised as follows:
- Credit risk;- Liquidity risk; and- Market risk.
Credit riskCredit risk is the risk of loss of value of financial assets due to counterparties failing to meet all or part of their obligations. Of our trade receivables balance of £4.2m, £2m is due from other Government Departments and Agencies. Therefore the risk of counterparty default is low and our exposure to credit risk is minimal. There is higher risk associated with our £2.1m of trade receivables due from other bodies. With regards to risk concentration, 5%, (£221k) of our trade receivables balance is due from one specific counterparty. However due to the fact that this counterparty is a Central Government agency, the credit risk associated with this concentration is very limited. As part of our strategy to manage our trade receivables, we have put in place policies and practices to ensure that we accurately invoice our clients and that this is done in a timely manner.
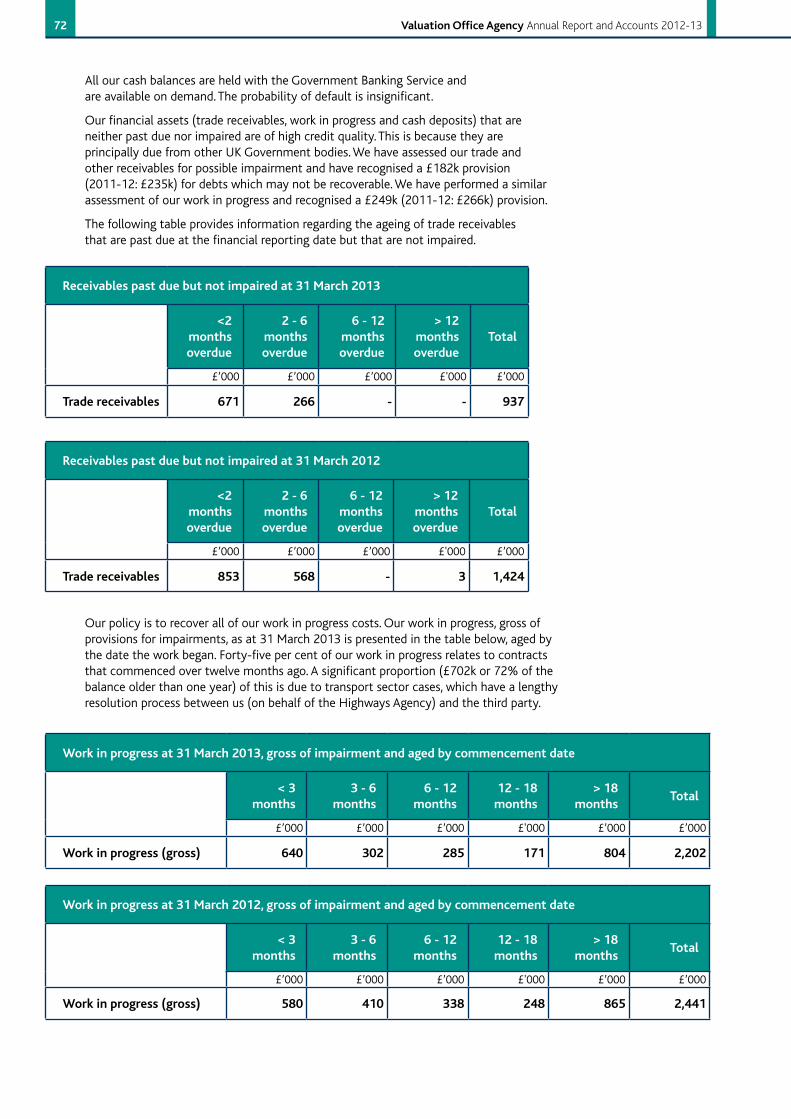
72 ValuationOfficeAgency Annual Report and Accounts 2012-13
All our cash balances are held with the Government Banking Service and are available on demand. The probability of default is insignificant.
Our financial assets (trade receivables, work in progress and cash deposits) that are neither past due nor impaired are of high credit quality. This is because they are principally due from other UK Government bodies. We have assessed our trade and other receivables for possible impairment and have recognised a £182k provision (2011-12: £235k) for debts which may not be recoverable. We have performed a similar assessment of our work in progress and recognised a £249k (2011-12: £266k) provision.
The following table provides information regarding the ageing of trade receivables that are past due at the financial reporting date but that are not impaired.
Receivablespastduebutnotimpairedat31March2013
<2 monthsoverdue
2-6monthsoverdue
6-12monthsoverdue
>12monthsoverdue
Total
£’000 £’000 £’000 £'000 £’000
Tradereceivables 671 266 - - 937
Receivablespastduebutnotimpairedat31March2012
<2 monthsoverdue
2-6monthsoverdue
6-12monthsoverdue
>12monthsoverdue
Total
£’000 £’000 £’000 £'000 £’000
Tradereceivables 853 568 - 3 1,424
Workinprogressat31March2013,grossofimpairmentandagedbycommencementdate
<3months
3-6months
6-12months
12-18months
>18months
Total
£’000 £’000 £’000 £'000 £’000 £’000
Workinprogress(gross) 640 302 285 171 804 2,202
Workinprogressat31March2012,grossofimpairmentandagedbycommencementdate
<3months
3-6months
6-12months
12-18months
>18months
Total
£’000 £’000 £’000 £'000 £’000 £’000
Workinprogress(gross) 580 410 338 248 865 2,441
Our policy is to recover all of our work in progress costs. Our work in progress, gross of provisions for impairments, as at 31 March 2013 is presented in the table below, aged by the date the work began. Forty-five per cent of our work in progress relates to contracts that commenced over twelve months ago. A significant proportion (£702k or 72% of the balance older than one year) of this is due to transport sector cases, which have a lengthy resolution process between us (on behalf of the Highways Agency) and the third party.
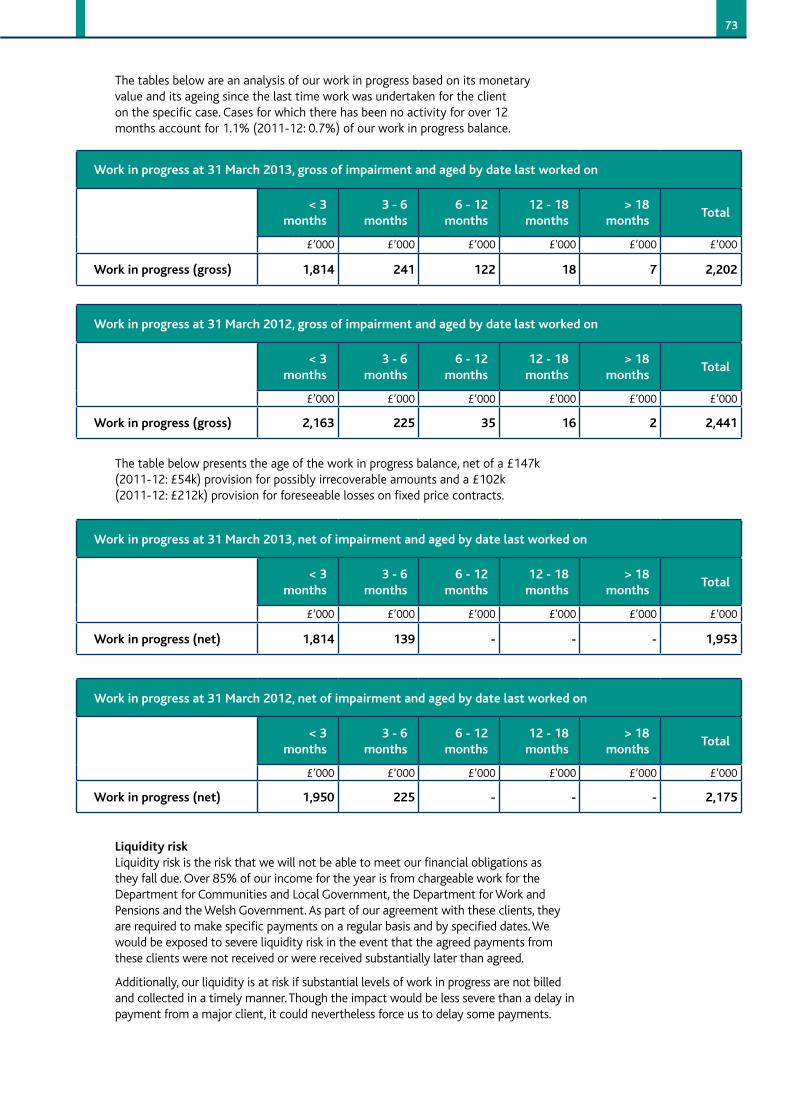
73
The tables below are an analysis of our work in progress based on its monetary value and its ageing since the last time work was undertaken for the client on the specific case. Cases for which there has been no activity for over 12 months account for 1.1% (2011-12: 0.7%) of our work in progress balance.
Workinprogressat31March2013,grossofimpairmentandagedbydatelastworkedon
<3months
3-6months
6-12months
12-18months
>18months
Total
£’000 £’000 £’000 £'000 £’000 £’000
Workinprogress(gross) 1,814 241 122 18 7 2,202
Workinprogressat31March2012,grossofimpairmentandagedbydatelastworkedon
<3months
3-6months
6-12months
12-18months
>18months
Total
£’000 £’000 £’000 £'000 £’000 £’000
Workinprogress(gross) 2,163 225 35 16 2 2,441
The table below presents the age of the work in progress balance, net of a £147k (2011-12: £54k) provision for possibly irrecoverable amounts and a £102k (2011-12: £212k) provision for foreseeable losses on fixed price contracts.
Workinprogressat31March2013,netofimpairmentandagedbydatelastworkedon
<3months
3-6months
6-12months
12-18months
>18months
Total
£’000 £’000 £’000 £'000 £’000 £’000
Workinprogress(net) 1,814 139 - - - 1,953
Workinprogressat31March2012,netofimpairmentandagedbydatelastworkedon
<3months
3-6months
6-12months
12-18months
>18months
Total
£’000 £’000 £’000 £'000 £’000 £’000
Workinprogress(net) 1,950 225 - - - 2,175
Liquidityrisk Liquidity risk is the risk that we will not be able to meet our financial obligations as they fall due. Over 85% of our income for the year is from chargeable work for the Department for Communities and Local Government, the Department for Work and Pensions and the Welsh Government. As part of our agreement with these clients, they are required to make specific payments on a regular basis and by specified dates. We would be exposed to severe liquidity risk in the event that the agreed payments from these clients were not received or were received substantially later than agreed.
Additionally, our liquidity is at risk if substantial levels of work in progress are not billed and collected in a timely manner. Though the impact would be less severe than a delay in payment from a major client, it could nevertheless force us to delay some payments.
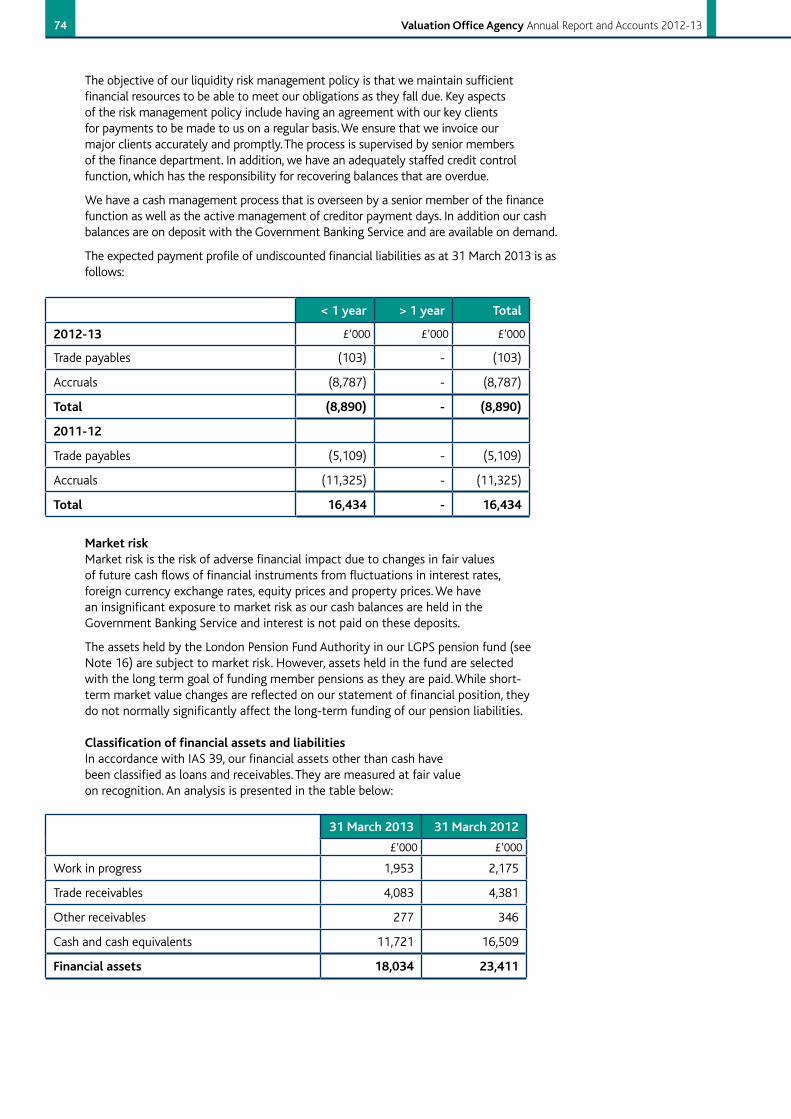
74 ValuationOfficeAgency Annual Report and Accounts 2012-13
The objective of our liquidity risk management policy is that we maintain sufficient financial resources to be able to meet our obligations as they fall due. Key aspects of the risk management policy include having an agreement with our key clients for payments to be made to us on a regular basis. We ensure that we invoice our major clients accurately and promptly. The process is supervised by senior members of the finance department. In addition, we have an adequately staffed credit control function, which has the responsibility for recovering balances that are overdue.
We have a cash management process that is overseen by a senior member of the finance function as well as the active management of creditor payment days. In addition our cash balances are on deposit with the Government Banking Service and are available on demand.
The expected payment profile of undiscounted financial liabilities as at 31 March 2013 is as follows:
<1year >1year Total
2012-13 £’000 £’000 £’000
Trade payables (103) - (103)
Accruals (8,787) - (8,787)
Total (8,890) - (8,890)
2011-12
Trade payables (5,109) - (5,109)
Accruals (11,325) - (11,325)
Total 16,434 - 16,434
Marketrisk Market risk is the risk of adverse financial impact due to changes in fair values of future cash flows of financial instruments from fluctuations in interest rates, foreign currency exchange rates, equity prices and property prices. We have an insignificant exposure to market risk as our cash balances are held in the Government Banking Service and interest is not paid on these deposits.
The assets held by the London Pension Fund Authority in our LGPS pension fund (see Note 16) are subject to market risk. However, assets held in the fund are selected with the long term goal of funding member pensions as they are paid. While short-term market value changes are reflected on our statement of financial position, they do not normally significantly affect the long-term funding of our pension liabilities.
ClassificationoffinancialassetsandliabilitiesIn accordance with IAS 39, our financial assets other than cash have been classified as loans and receivables. They are measured at fair value on recognition. An analysis is presented in the table below:
31March2013 31March2012
£’000 £’000
Work in progress 1,953 2,175
Trade receivables 4,083 4,381
Other receivables 277 346
Cash and cash equivalents 11,721 16,509
Financialassets 18,034 23,411
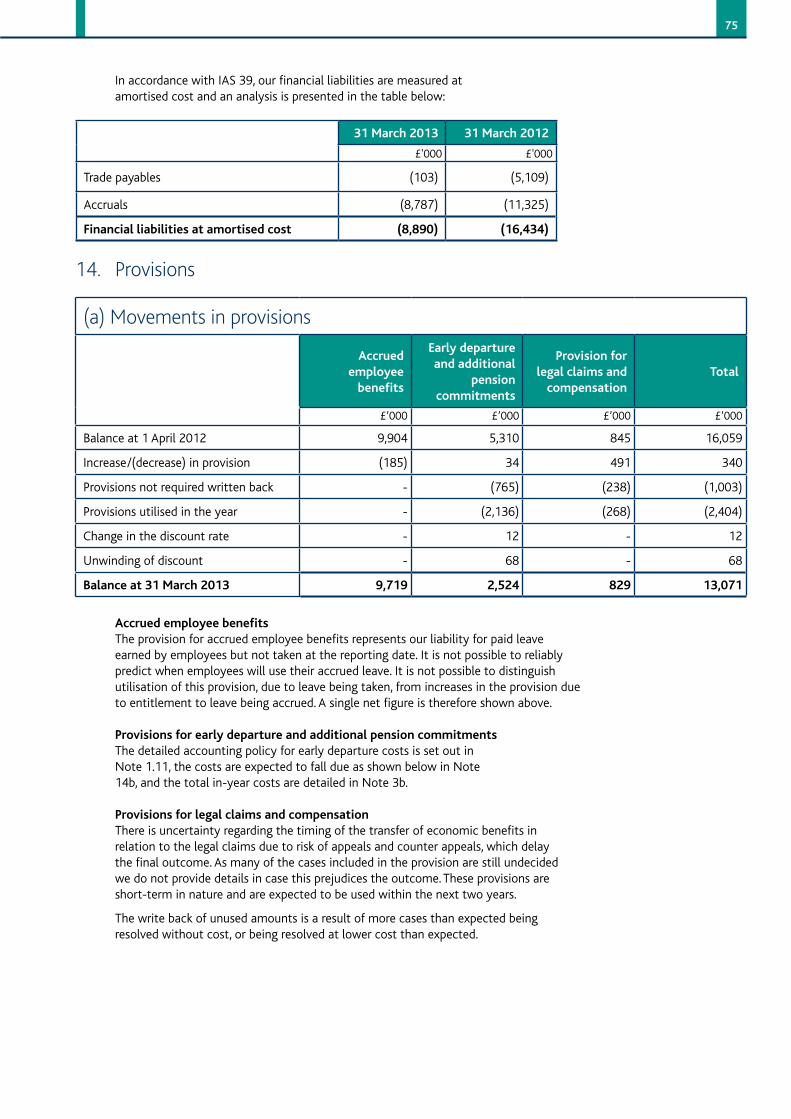
75
In accordance with IAS 39, our financial liabilities are measured at amortised cost and an analysis is presented in the table below:
31March2013 31March2012
£'000 £'000
Trade payables (103) (5,109)
Accruals (8,787) (11,325)
Financialliabilitiesatamortisedcost (8,890) (16,434)
14. Provisions
(a) Movements in provisions
Accruedemployeebenefits
Earlydepartureand additional
pensioncommitments
Provisionforlegalclaimsandcompensation
Total
£’000 £’000 £’000 £’000
Balance at 1 April 2012 9,904 5,310 845 16,059
Increase/(decrease) in provision (185) 34 491 340
Provisions not required written back - (765) (238) (1,003)
Provisions utilised in the year - (2,136) (268) (2,404)
Change in the discount rate - 12 - 12
Unwinding of discount - 68 - 68
Balanceat31March2013 9,719 2,524 829 13,071
AccruedemployeebenefitsThe provision for accrued employee benefits represents our liability for paid leave earned by employees but not taken at the reporting date. It is not possible to reliably predict when employees will use their accrued leave. It is not possible to distinguish utilisation of this provision, due to leave being taken, from increases in the provision due to entitlement to leave being accrued. A single net figure is therefore shown above.
ProvisionsforearlydepartureandadditionalpensioncommitmentsThe detailed accounting policy for early departure costs is set out in Note 1.11, the costs are expected to fall due as shown below in Note 14b, and the total in-year costs are detailed in Note 3b.
Provisionsforlegalclaimsandcompensation There is uncertainty regarding the timing of the transfer of economic benefits in relation to the legal claims due to risk of appeals and counter appeals, which delay the final outcome. As many of the cases included in the provision are still undecided we do not provide details in case this prejudices the outcome. These provisions are short-term in nature and are expected to be used within the next two years.
The write back of unused amounts is a result of more cases than expected being resolved without cost, or being resolved at lower cost than expected.
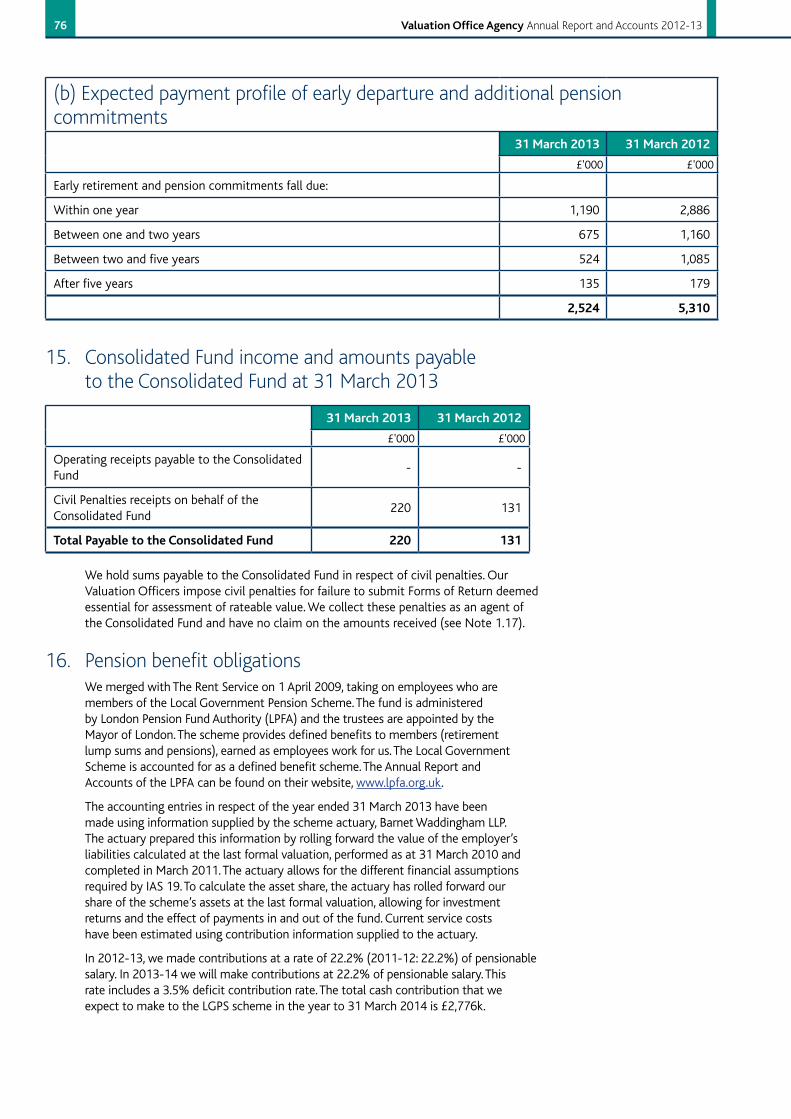
76 ValuationOfficeAgency Annual Report and Accounts 2012-13
(b) Expected payment profile of early departure and additional pension commitments
31March2013 31March2012
£'000 £'000
Early retirement and pension commitments fall due:
Within one year 1,190 2,886
Between one and two years 675 1,160
Between two and five years 524 1,085
After five years 135 179
2,524 5,310
15. Consolidated Fund income and amounts payable to the Consolidated Fund at 31 March 2013
31March2013 31March2012
£'000 £'000
Operating receipts payable to the Consolidated Fund
- -
Civil Penalties receipts on behalf of the Consolidated Fund
220 131
TotalPayabletotheConsolidatedFund 220 131
We hold sums payable to the Consolidated Fund in respect of civil penalties. Our Valuation Officers impose civil penalties for failure to submit Forms of Return deemed essential for assessment of rateable value. We collect these penalties as an agent of the Consolidated Fund and have no claim on the amounts received (see Note 1.17).
16. Pension benefit obligationsWe merged with The Rent Service on 1 April 2009, taking on employees who are members of the Local Government Pension Scheme. The fund is administered by London Pension Fund Authority (LPFA) and the trustees are appointed by the Mayor of London. The scheme provides defined benefits to members (retirement lump sums and pensions), earned as employees work for us. The Local Government Scheme is accounted for as a defined benefit scheme. The Annual Report and Accounts of the LPFA can be found on their website, www.lpfa.org.uk.
The accounting entries in respect of the year ended 31 March 2013 have been made using information supplied by the scheme actuary, Barnet Waddingham LLP. The actuary prepared this information by rolling forward the value of the employer’s liabilities calculated at the last formal valuation, performed as at 31 March 2010 and completed in March 2011. The actuary allows for the different financial assumptions required by IAS 19. To calculate the asset share, the actuary has rolled forward our share of the scheme’s assets at the last formal valuation, allowing for investment returns and the effect of payments in and out of the fund. Current service costs have been estimated using contribution information supplied to the actuary.
In 2012-13, we made contributions at a rate of 22.2% (2011-12: 22.2%) of pensionable salary. In 2013-14 we will make contributions at 22.2% of pensionable salary. This rate includes a 3.5% deficit contribution rate. The total cash contribution that we expect to make to the LGPS scheme in the year to 31 March 2014 is £2,776k.
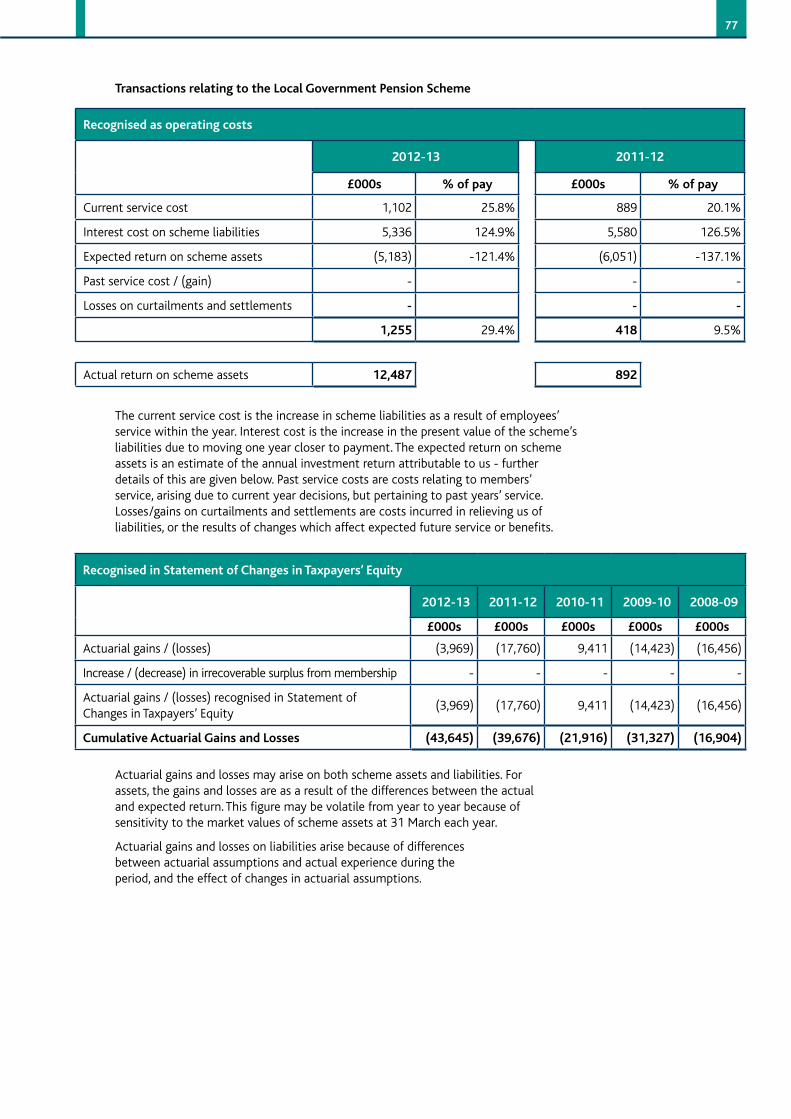
77
Recognisedasoperatingcosts
2012-13 2011-12
£000s %ofpay £000s %ofpay
Current service cost 1,102 25.8% 889 20.1%
Interest cost on scheme liabilities 5,336 124.9% 5,580 126.5%
Expected return on scheme assets (5,183) -121.4% (6,051) -137.1%
Past service cost / (gain) - - -
Losses on curtailments and settlements - - -
1,255 29.4% 418 9.5%
Actual return on scheme assets 12,487 892
TransactionsrelatingtotheLocalGovernmentPensionScheme
The current service cost is the increase in scheme liabilities as a result of employees’ service within the year. Interest cost is the increase in the present value of the scheme’s liabilities due to moving one year closer to payment. The expected return on scheme assets is an estimate of the annual investment return attributable to us - further details of this are given below. Past service costs are costs relating to members’ service, arising due to current year decisions, but pertaining to past years’ service. Losses/gains on curtailments and settlements are costs incurred in relieving us of liabilities, or the results of changes which affect expected future service or benefits.
RecognisedinStatementofChangesinTaxpayers’Equity
2012-13 2011-12 2010-11 2009-10 2008-09
£000s £000s £000s £000s £000s
Actuarial gains / (losses) (3,969) (17,760) 9,411 (14,423) (16,456)
Increase / (decrease) in irrecoverable surplus from membership - - - - -
Actuarial gains / (losses) recognised in Statement of Changes in Taxpayers’ Equity
(3,969) (17,760) 9,411 (14,423) (16,456)
CumulativeActuarialGainsandLosses (43,645) (39,676) (21,916) (31,327) (16,904)
Actuarial gains and losses may arise on both scheme assets and liabilities. For assets, the gains and losses are as a result of the differences between the actual and expected return. This figure may be volatile from year to year because of sensitivity to the market values of scheme assets at 31 March each year.
Actuarial gains and losses on liabilities arise because of differences between actuarial assumptions and actual experience during the period, and the effect of changes in actuarial assumptions.
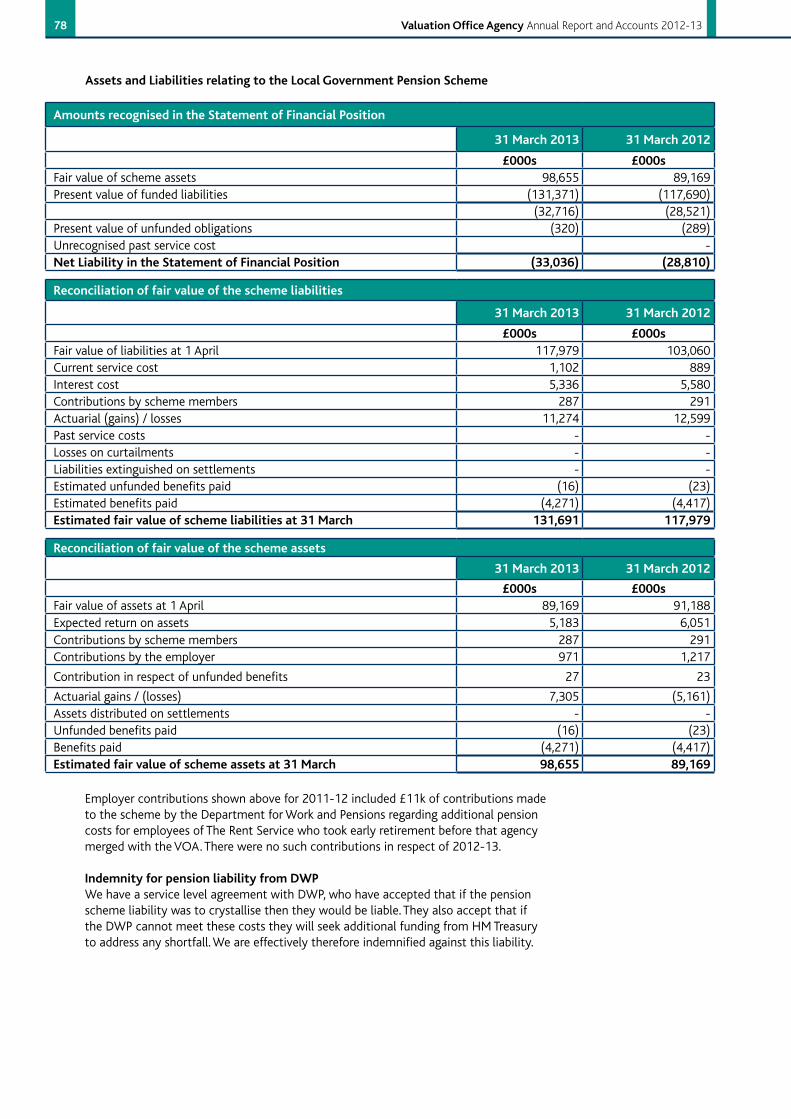
78 ValuationOfficeAgency Annual Report and Accounts 2012-13
AmountsrecognisedintheStatementofFinancialPosition
31March2013 31March2012
£000s £000sFair value of scheme assets 98,655 89,169Present value of funded liabilities (131,371) (117,690)
(32,716) (28,521)Present value of unfunded obligations (320) (289)Unrecognised past service cost -NetLiabilityintheStatementofFinancialPosition (33,036) (28,810)
Reconciliationoffairvalueoftheschemeliabilities
31March2013 31March2012
£000s £000sFair value of liabilities at 1 April 117,979 103,060Current service cost 1,102 889Interest cost 5,336 5,580Contributions by scheme members 287 291Actuarial (gains) / losses 11,274 12,599Past service costs - -Losses on curtailments - -Liabilities extinguished on settlements - -Estimated unfunded benefits paid (16) (23)Estimated benefits paid (4,271) (4,417)Estimatedfairvalueofschemeliabilitiesat31March 131,691 117,979
Reconciliationoffairvalueoftheschemeassets
31March2013 31March2012
£000s £000sFair value of assets at 1 April 89,169 91,188Expected return on assets 5,183 6,051Contributions by scheme members 287 291Contributions by the employer 971 1,217
Contribution in respect of unfunded benefits 27 23
Actuarial gains / (losses) 7,305 (5,161)Assets distributed on settlements - -Unfunded benefits paid (16) (23)Benefits paid (4,271) (4,417)Estimatedfairvalueofschemeassetsat31March 98,655 89,169
AssetsandLiabilitiesrelatingtotheLocalGovernmentPensionScheme
Employer contributions shown above for 2011-12 included £11k of contributions made to the scheme by the Department for Work and Pensions regarding additional pension costs for employees of The Rent Service who took early retirement before that agency merged with the VOA. There were no such contributions in respect of 2012-13.
IndemnityforpensionliabilityfromDWPWe have a service level agreement with DWP, who have accepted that if the pension scheme liability was to crystallise then they would be liable. They also accept that if the DWP cannot meet these costs they will seek additional funding from HM Treasury to address any shortfall. We are effectively therefore indemnified against this liability.
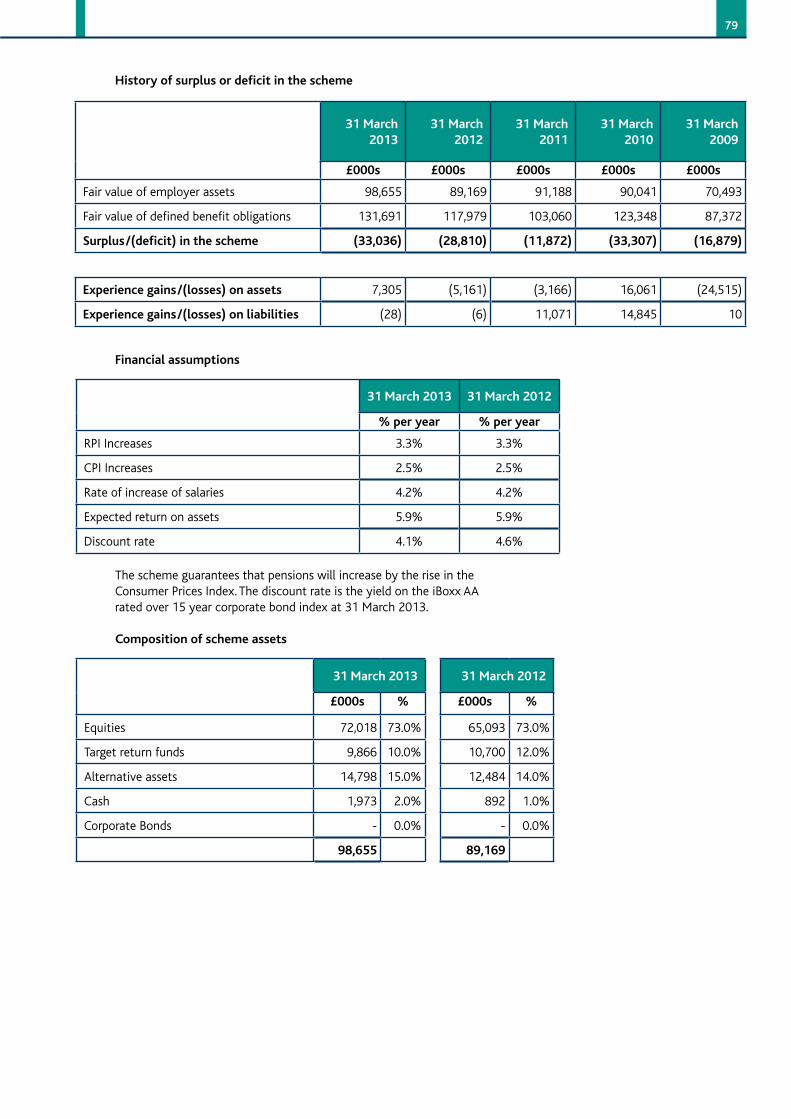
79
Historyofsurplusordeficitinthescheme
31March2013
31March2012
31March2011
31March2010
31March2009
£000s £000s £000s £000s £000s
Fair value of employer assets 98,655 89,169 91,188 90,041 70,493
Fair value of defined benefit obligations 131,691 117,979 103,060 123,348 87,372
Surplus/(deficit)inthescheme (33,036) (28,810) (11,872) (33,307) (16,879)
Experiencegains/(losses)onassets 7,305 (5,161) (3,166) 16,061 (24,515)
Experiencegains/(losses)onliabilities (28) (6) 11,071 14,845 10
Financialassumptions
31March2013 31March2012
%peryear %peryear
RPI Increases 3.3% 3.3%
CPI Increases 2.5% 2.5%
Rate of increase of salaries 4.2% 4.2%
Expected return on assets 5.9% 5.9%
Discount rate 4.1% 4.6%
The scheme guarantees that pensions will increase by the rise in the Consumer Prices Index. The discount rate is the yield on the iBoxx AA rated over 15 year corporate bond index at 31 March 2013.
Compositionofschemeassets
31March2013 31March2012
£000s % £000s %
Equities 72,018 73.0% 65,093 73.0%
Target return funds 9,866 10.0% 10,700 12.0%
Alternative assets 14,798 15.0% 12,484 14.0%
Cash 1,973 2.0% 892 1.0%
Corporate Bonds - 0.0% - 0.0%
98,655 89,169
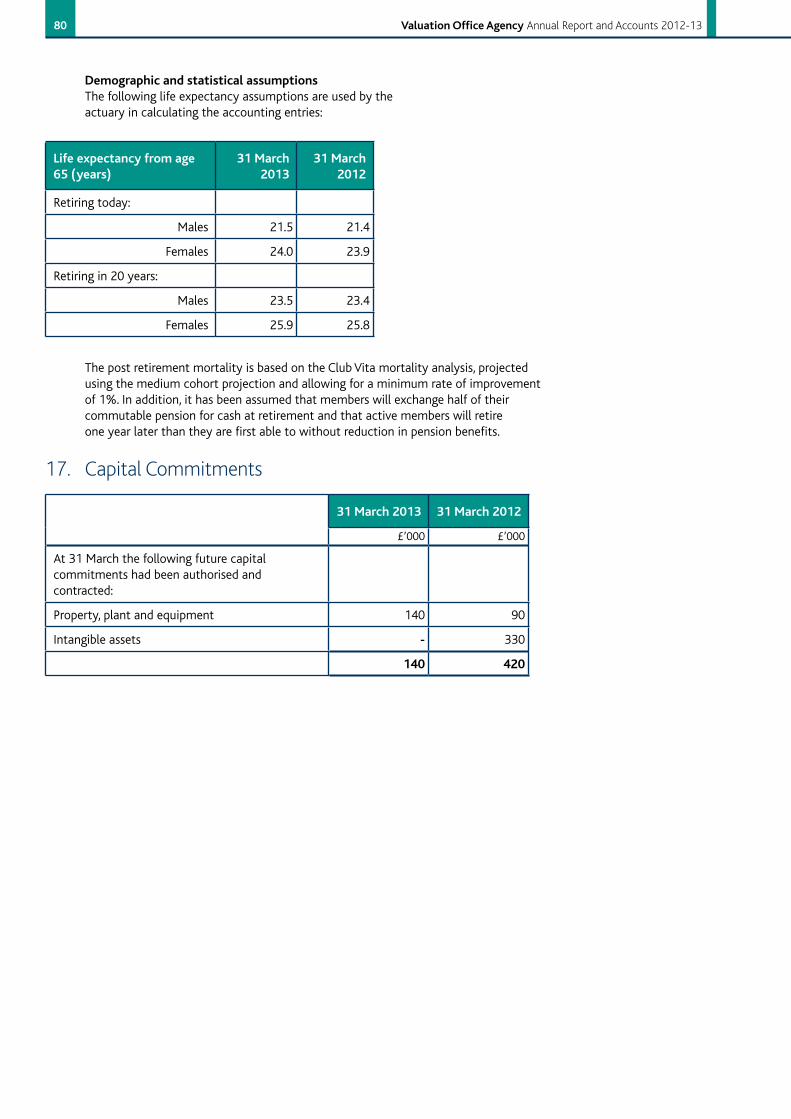
80 ValuationOfficeAgency Annual Report and Accounts 2012-13
DemographicandstatisticalassumptionsThe following life expectancy assumptions are used by the actuary in calculating the accounting entries:
Lifeexpectancyfromage65(years)
31March2013
31March2012
Retiring today:
Males 21.5 21.4
Females 24.0 23.9
Retiring in 20 years:
Males 23.5 23.4
Females 25.9 25.8
The post retirement mortality is based on the Club Vita mortality analysis, projected using the medium cohort projection and allowing for a minimum rate of improvement of 1%. In addition, it has been assumed that members will exchange half of their commutable pension for cash at retirement and that active members will retire one year later than they are first able to without reduction in pension benefits.
31March2013 31March2012
£’000 £’000
At 31 March the following future capital commitments had been authorised and contracted:
Property, plant and equipment 140 90
Intangible assets - 330
140 420
17. Capital Commitments
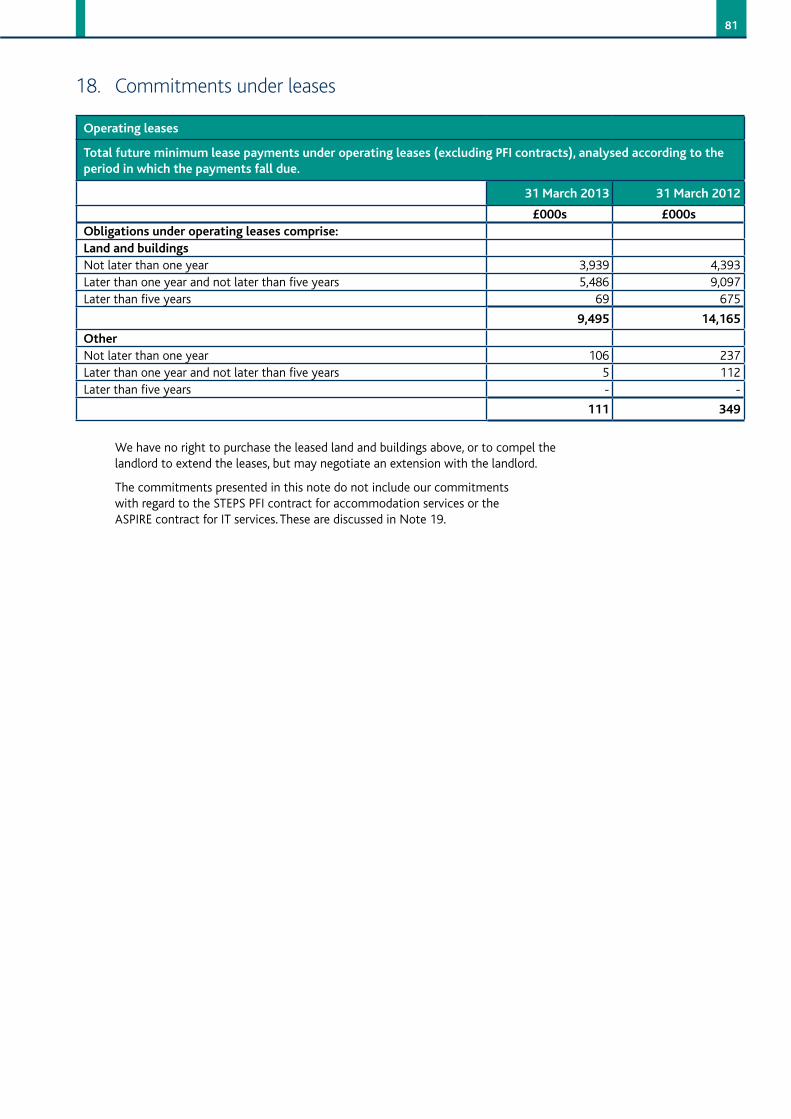
81
18. Commitments under leases
Operatingleases
Totalfutureminimumleasepaymentsunderoperatingleases(excludingPFIcontracts),analysedaccordingtotheperiodinwhichthepaymentsfalldue.
31March2013 31March2012
£000s £000sObligationsunderoperatingleasescomprise:LandandbuildingsNot later than one year 3,939 4,393Later than one year and not later than five years 5,486 9,097Later than five years 69 675
9,495 14,165
OtherNot later than one year 106 237Later than one year and not later than five years 5 112Later than five years - -
111 349
We have no right to purchase the leased land and buildings above, or to compel the landlord to extend the leases, but may negotiate an extension with the landlord.
The commitments presented in this note do not include our commitments with regard to the STEPS PFI contract for accommodation services or the ASPIRE contract for IT services. These are discussed in Note 19.
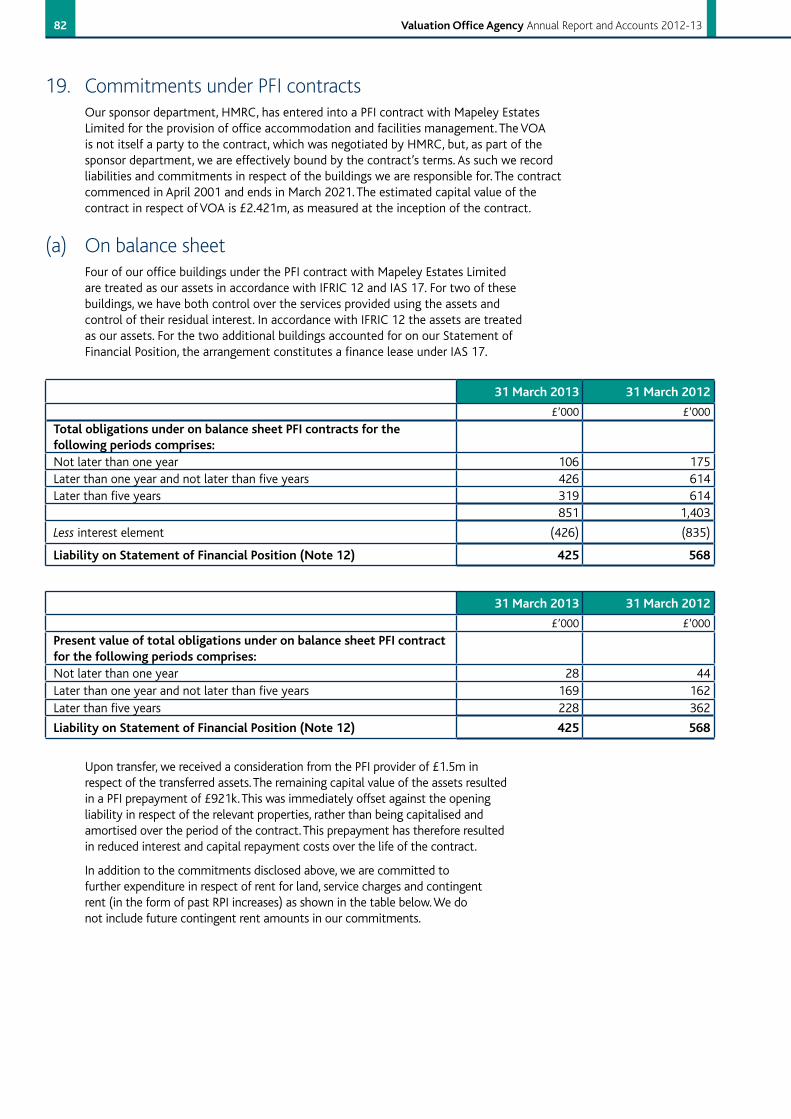
82 ValuationOfficeAgency Annual Report and Accounts 2012-13
19. Commitments under PFI contractsOur sponsor department, HMRC, has entered into a PFI contract with Mapeley Estates Limited for the provision of office accommodation and facilities management. The VOA is not itself a party to the contract, which was negotiated by HMRC, but, as part of the sponsor department, we are effectively bound by the contract’s terms. As such we record liabilities and commitments in respect of the buildings we are responsible for. The contract commenced in April 2001 and ends in March 2021. The estimated capital value of the contract in respect of VOA is £2.421m, as measured at the inception of the contract.
(a) On balance sheet Four of our office buildings under the PFI contract with Mapeley Estates Limited are treated as our assets in accordance with IFRIC 12 and IAS 17. For two of these buildings, we have both control over the services provided using the assets and control of their residual interest. In accordance with IFRIC 12 the assets are treated as our assets. For the two additional buildings accounted for on our Statement of Financial Position, the arrangement constitutes a finance lease under IAS 17.
31March2013 31March2012
£’000 £’000
TotalobligationsunderonbalancesheetPFIcontractsforthefollowingperiodscomprises:Not later than one year 106 175Later than one year and not later than five years 426 614Later than five years 319 614
851 1,403
Less interest element (426) (835)
LiabilityonStatementofFinancialPosition(Note12) 425 568
31March2013 31March2012
£’000 £’000
PresentvalueoftotalobligationsunderonbalancesheetPFIcontractforthefollowingperiodscomprises:Not later than one year 28 44Later than one year and not later than five years 169 162Later than five years 228 362
LiabilityonStatementofFinancialPosition(Note12) 425 568
Upon transfer, we received a consideration from the PFI provider of £1.5m in respect of the transferred assets. The remaining capital value of the assets resulted in a PFI prepayment of £921k. This was immediately offset against the opening liability in respect of the relevant properties, rather than being capitalised and amortised over the period of the contract. This prepayment has therefore resulted in reduced interest and capital repayment costs over the life of the contract.
In addition to the commitments disclosed above, we are committed to further expenditure in respect of rent for land, service charges and contingent rent (in the form of past RPI increases) as shown in the table below. We do not include future contingent rent amounts in our commitments.
83
31March2013
31March2012
£’000 £’000
TotalfurthercommitmentsrelatingtoonbalancesheetPFIcontracts,analysedbyperioddue:Not later than one year 39 347Later than one year and not later than five years - 44Later than five years - -
39 391
The commitments above consist of the minimum lease payments for each property, over the term running from the reporting date to the earliest date that we can vacate the property without penalty.
For the properties accounted for under IFRIC 12, we have the right to require that a new lease be granted so that it can remain in occupation beyond the end of the STEPS agreement. For the other properties, we have no right to purchase the leased land and buildings above, or to compel the landlord to extend the leases, but may negotiate an extension with the landlord.
We disposed of the Alnwick office in May 2012. This had previously been recognised in the Statement of Financial Position under IFRIC 12. The associated asset, held at a value of £122k at 31 March 2012, was disposed of. The associated creditor, £102k at 31 March 2012, was extinguished on the termination (without penalty) of the lease, and the resultant gain offset against the loss on disposal of the asset.
(b) Off balance sheetThe total payments we are committed to make in respect of off balance sheet PFI properties, analysed by the period in which they are due, are set out below:
31March2013
31March2012
£’000 £’000
Totalcommitments,analysedbyperiodinwhichtheyaredue:Not later than one year 5,485 7,509Later than one year and not later than five years 3,660 6,663Later than five years - 381
9,145 14,553
The commitments above consist of the minimum lease payments for each property, over the term running from the reporting date to the earliest date that we can vacate the property without penalty.
Our STEPS lease payments increase with the Retail Prices Index (RPI). In line with a change in our sponsor department’s policy, we no longer include these future contingent rent amounts in our commitments.
We have no right to purchase these properties at the end of the STEPS agreement, but may negotiate an extension to the leases if required.
In the year to 31 March 2013, we paid £7,281k (2011-12: £7,688k) to the STEPs contractor in respect of off balance sheet properties and service charges. In addition to the STEPS scheme described above, we occupy space in buildings procured under PFI schemes by HMRC and the Department for Work and Pensions. Lease commitments to other Government bodies in respect of these buildings are included in Note 18.
84 ValuationOfficeAgency Annual Report and Accounts 2012-13
(c) Total charge to the Statement of Net Comprehensive Expenditure and future commitmentsThe total charge to the Statement of Net Comprehensive Expenditure in respect of:
- service charges;- rent for off balance sheet land and buildings; and - interest and contingent rent for on balance sheet properties
was £7,805k (2011-12: £8,212k). Future commitments in respect of these payments are analysed below:
31March2013
31March2012
£’000 £’000
Totalcommitments,analysedbyperiodinwhichtheyaredue:Not later than one year 5,603 7,985Later than one year and not later than five years 3,916 7,159Later than five years 91 632
9,610 15,776
The commitments above consist of the minimum payments for each property, over the term running from the reporting date to the earliest date that we can vacate the property without penalty.
(d) The ASPIRE contract for the provision of IT services and equipmentWe outsourced the management of some of our IT services as part of a HMRC-wide arrangement in 2004. This Public Private Partnership (PPP) agreement, known as ASPIRE, involved us selling some of our IT hardware to a consortium who then provided a managed service using those assets. The initial term of the arrangement was 10 years, but the contract has since been extended until June 2017.
In 2007 the ASPIRE arrangement was amended to allow better use of the overall asset base. Essentially it allowed the provider to allocate asset usage in such a way as to maximise efficiency and deliver savings on the overall contract. The managed service continued but the asset base was no longer specified.
Effectively our former assets became fungible elements of a much larger asset pool which is almost entirely devoted to the activities of HMRC. We have estimated our share of that pool to be less than 2%.
On the introduction of IFRS from 1 April 2008, preparers of accounts were directed to consider assets involved in such arrangements for inclusion on the Statement of Financial Position. However, the structure of the ASPIRE contract is such that it has not been possible to reliably identify the specific assets within the overall pool which are used to provide services to the VOA. Nor has it been possible to gain any assurance that we have a continuing right to the use of particular assets within the pool, as is required by IFRIC 12 if assets are to be included on the Statement of Financial Position.
We have therefore concluded that the accounting treatment that most accurately reflects the substance of the arrangement is to treat the costs of the service provided through the ASPIRE contract as operating costs recognised as the services are consumed. Amounts paid to the ASPIRE consortium for the development and construction of assets are capitalised in accordance with the accounting policies set down in Note 1.
During the year to 31 March 2013, we paid £12,068k (2011-12: £11,122k) in service charges in respect of the ASPIRE contract. While we currently plan to incur £10,050k in operating expenditure for ASPIRE services during 2013-14 there is no commitment to expend these sums.
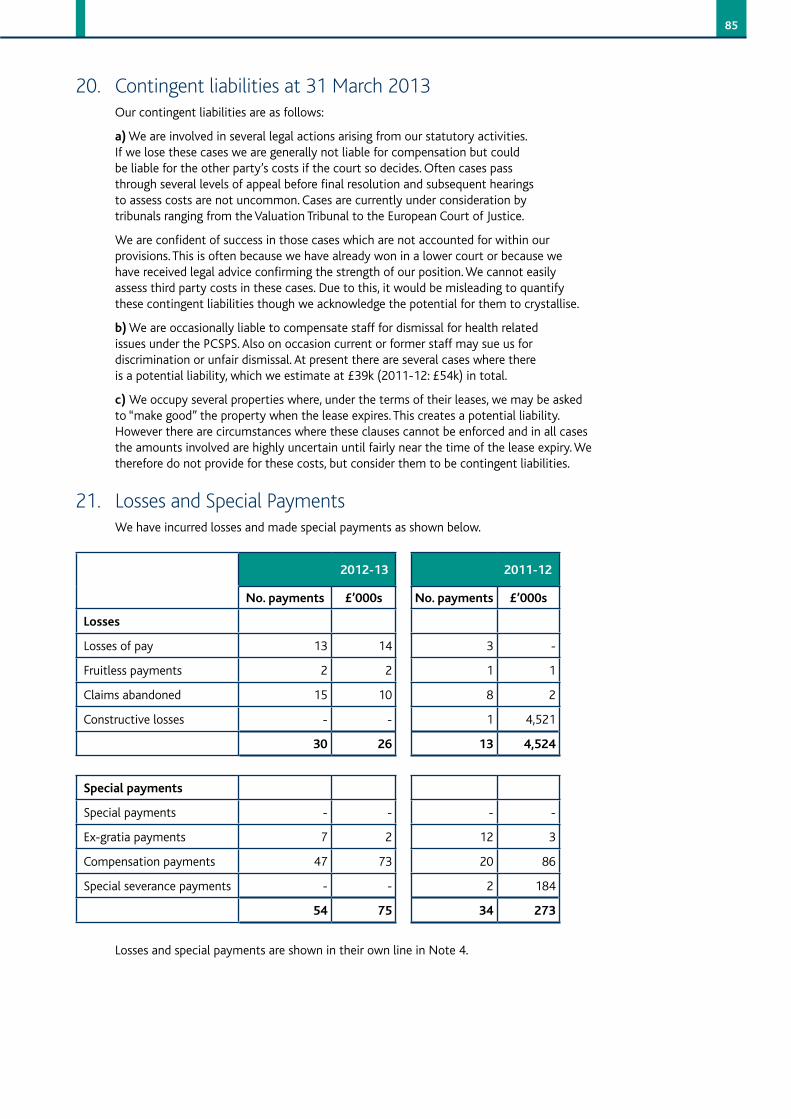
85
20. Contingent liabilities at 31 March 2013Our contingent liabilities are as follows:
a) We are involved in several legal actions arising from our statutory activities. If we lose these cases we are generally not liable for compensation but could be liable for the other party’s costs if the court so decides. Often cases pass through several levels of appeal before final resolution and subsequent hearings to assess costs are not uncommon. Cases are currently under consideration by tribunals ranging from the Valuation Tribunal to the European Court of Justice.
We are confident of success in those cases which are not accounted for within our provisions. This is often because we have already won in a lower court or because we have received legal advice confirming the strength of our position. We cannot easily assess third party costs in these cases. Due to this, it would be misleading to quantify these contingent liabilities though we acknowledge the potential for them to crystallise.
b) We are occasionally liable to compensate staff for dismissal for health related issues under the PCSPS. Also on occasion current or former staff may sue us for discrimination or unfair dismissal. At present there are several cases where there is a potential liability, which we estimate at £39k (2011-12: £54k) in total.
c)We occupy several properties where, under the terms of their leases, we may be asked to “make good” the property when the lease expires. This creates a potential liability. However there are circumstances where these clauses cannot be enforced and in all cases the amounts involved are highly uncertain until fairly near the time of the lease expiry. We therefore do not provide for these costs, but consider them to be contingent liabilities.
21. Losses and Special PaymentsWe have incurred losses and made special payments as shown below.
2012-13 2011-12
No.payments £’000s No.payments £’000s
Losses
Losses of pay 13 14 3 -
Fruitless payments 2 2 1 1
Claims abandoned 15 10 8 2
Constructive losses - - 1 4,521
30 26 13 4,524
Specialpayments
Special payments - - - -
Ex-gratia payments 7 2 12 3
Compensation payments 47 73 20 86
Special severance payments - - 2 184
54 75 34 273
Losses and special payments are shown in their own line in Note 4.
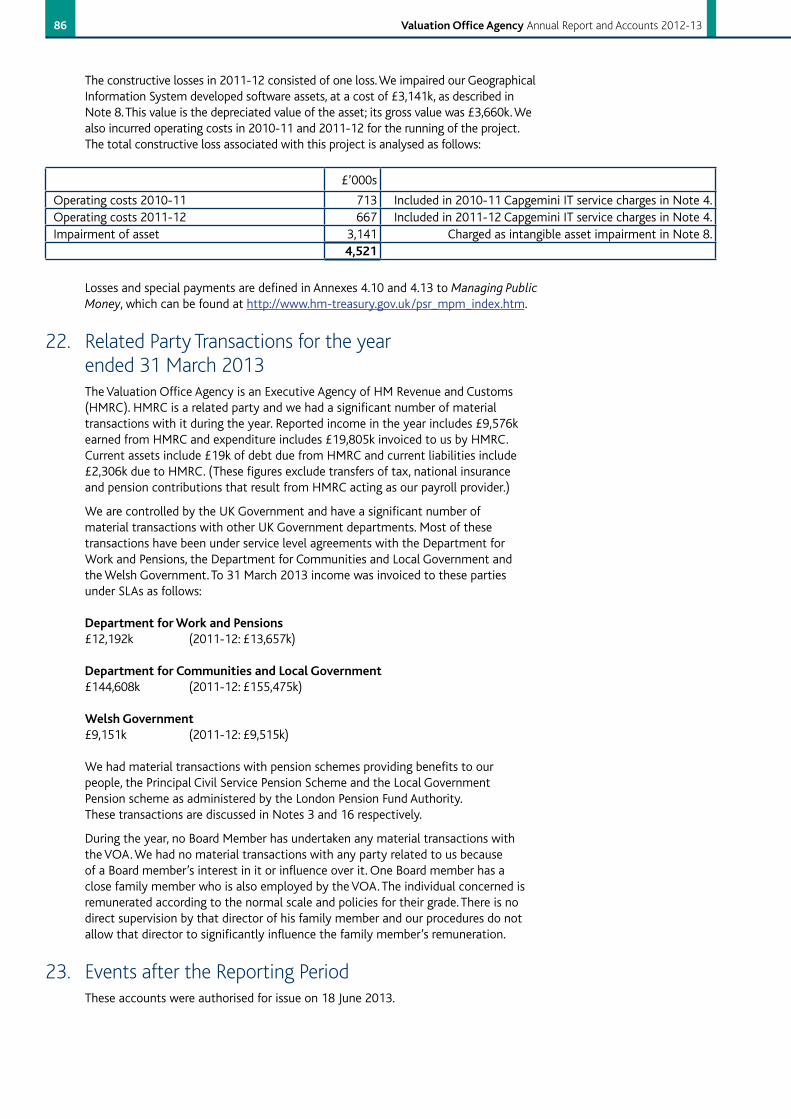
86 ValuationOfficeAgency Annual Report and Accounts 2012-13
The constructive losses in 2011-12 consisted of one loss. We impaired our Geographical Information System developed software assets, at a cost of £3,141k, as described in Note 8. This value is the depreciated value of the asset; its gross value was £3,660k. We also incurred operating costs in 2010-11 and 2011-12 for the running of the project. The total constructive loss associated with this project is analysed as follows:
£’000s
Operating costs 2010-11 713 Included in 2010-11 Capgemini IT service charges in Note 4.Operating costs 2011-12 667 Included in 2011-12 Capgemini IT service charges in Note 4.Impairment of asset 3,141 Charged as intangible asset impairment in Note 8.
4,521
Losses and special payments are defined in Annexes 4.10 and 4.13 to Managing Public Money, which can be found at http://www.hm-treasury.gov.uk/psr_mpm_index.htm.
22. Related Party Transactions for the year ended 31 March 2013 The Valuation Office Agency is an Executive Agency of HM Revenue and Customs (HMRC). HMRC is a related party and we had a significant number of material transactions with it during the year. Reported income in the year includes £9,576k earned from HMRC and expenditure includes £19,805k invoiced to us by HMRC. Current assets include £19k of debt due from HMRC and current liabilities include £2,306k due to HMRC. (These figures exclude transfers of tax, national insurance and pension contributions that result from HMRC acting as our payroll provider.)
We are controlled by the UK Government and have a significant number of material transactions with other UK Government departments. Most of these transactions have been under service level agreements with the Department for Work and Pensions, the Department for Communities and Local Government and the Welsh Government. To 31 March 2013 income was invoiced to these parties under SLAs as follows:
DepartmentforWorkandPensions£12,192k (2011-12: £13,657k)
DepartmentforCommunitiesandLocalGovernment£144,608k (2011-12: £155,475k)
WelshGovernment £9,151k (2011-12: £9,515k)
We had material transactions with pension schemes providing benefits to our people, the Principal Civil Service Pension Scheme and the Local Government Pension scheme as administered by the London Pension Fund Authority. These transactions are discussed in Notes 3 and 16 respectively.
During the year, no Board Member has undertaken any material transactions with the VOA. We had no material transactions with any party related to us because of a Board member’s interest in it or influence over it. One Board member has a close family member who is also employed by the VOA. The individual concerned is remunerated according to the normal scale and policies for their grade. There is no direct supervision by that director of his family member and our procedures do not allow that director to significantly influence the family member’s remuneration.
23. Events after the Reporting Period These accounts were authorised for issue on 18 June 2013.

87
IFRS9FinancialInstruments
This standard is effective from 1 January 2013, but has not yet been adopted by the EU. If adopted in the future, it will apply to these financial statements in place of the current IAS 39. We do not currently hold assets or liabilities which would be affected by this change and do not anticipate doing so in future.
IFRS13FairValueMeasurement
This standard is effective from 1 January 2013, but has not yet been adopted by the EU. This standard would provide guidance on all fair value measurements across IFRS, discussing measurement techniques and disclosure requirements. Fair value measurement is used in our accounts as follows:
- property, plant and equipment, and intangible assets, are held at their fair values;
- financial assets and liabilities are recorded at fair value on initial recognition; and
- the assets and liabilities that form the net LGPS pension liability are held at fair value.
IAS1PresentationofFinancialStatements(amendedbyImprovementstoIFRS2010)
The amended standard is effective from 1 June 2012, but has not yet been adopted by the EU. It would require that items of Other Comprehensive Net Expenditure be grouped in the Statement of Comprehensive Net Expenditure according to whether or not they may be reclassified as part of Net Operating Surplus in a future period. None of our Other Comprehensive Net Expenditure is subject to such reclassification.
IAS19EmploymentBenefits(asamendedJune2011)
This revised standard is effective from 1 January 2013 and has yet to be adopted for use in the EU. It revises the treatment of employee benefits, relevant to our accounts as follows:
- it changes the recognition criteria for termination benefits for voluntary exits and redundancies so that the expense is incurred when the employer can no longer withdraw the offer.
- it increases the level of disclosure required regarding funded defined benefit obligations, such as our liability in respect of the Local Government Pension Scheme (LGPS). In particular, details of the expected maturity profile of the obligation will be required, as will sensitivity analysis for each significant actuarial assumption.
- anticipated return on pension scheme assets will no longer be recognised in net comprehensive expenditure. Instead, interest cost will be calculated on the pension liability net of scheme assets, rather than on the gross liability as now. As our LGPS has a net liability, this will increase the total charge to the Statement of Comprehensive Net Expenditure.
24. Standards in issue but not yet effectiveThese accounts have been prepared according to the 2012-13 Financial Reporting Manual. This manual typically applies the standards and interpretations that are effective for the accounting period to which it refers. New and revised standards and interpretations have been issued but are not yet effective, and have not therefore been adopted in this account. The following new standards may affect our accounts when they become effective:
88 ValuationOfficeAgency Annual Report and Accounts 2012-13
Payment of Local Authority Rates (POLAR)
IntroductionThe Valuation Office Agency (VOA) is responsible for administering the POLAR scheme for the Foreign & Commonwealth Office (FCO). The Chief Executive Officer of the VOA is the Accounting Officer for POLAR. The POLAR accounts are included within the HMRC consolidated resource accounts and are audited as part of the overall HMRC audit. It does not form part of the VOA accounts and is not audited as part of the VOA audit. Therefore the following information has not been subject to audit.
BackgroundPOLAR is a scheme by which local billing authorities in the UK are compensated by central Government for the non-domestic rates due on properties occupied by a mission with diplomatic status. As per the Vienna Convention on Diplomatic Relations 1961 and Diplomatic Privileges Act 1964, all states and other bodies sending diplomatic representatives to another state are exempt from all national, regional or municipal dues and taxes in respect of premises of the mission. Under the scheme, diplomatic missions are encouraged to contribute an amount known as the Beneficial Portion. This is to take account of the extraneous services such as the fire service and street lighting. The Beneficial Portion is currently set at 6% of the overall rates bill.
VOAResponsibilitiesThe VOA administers the POLAR scheme. Essentially the VOA’s role is to liaise with local billing authorities, diplomatic missions and the FCO.
The VOA pays 100% of the rates liability to the billing authorities and then seeks to recover the Beneficial Portion from the mission. In cases of arrears FCO writes to the missions encouraging them to pay the Beneficial Portion – although there is no legal obligation to pay this.
FactsandFiguresIn 2012-13 there were 193 diplomatic missions in the UK covering 472 properties. Of these all were in England except 26 in Scotland, three in Wales and three in Northern Ireland. Rateable values ranged from less than £500 to £7 million and a total of 30 billing authorities are involved in the POLAR scheme, mainly in Greater London. During 2012-13 the POLAR scheme required £56 million of funding (2011-12: £50m). The net Beneficial Portion collected was £3.3 million (2011-12: £2.8m). The inherent risk of the POLAR scheme is low. The main areas of uncertainty are vacation of properties without FCO knowledge and changes in the rateable value of properties due to refurbishments etc. These issues can sometimes take several years to come to light and can lead to sudden demands for backdated rates or indeed refunds.


Published by TSO (The Stationery Office) and available from: Online www.tsoshop.co.uk
Mail, telephone, fax and email TSO PO Box 29, Norwich NR3 1GN Telephone orders/general enquiries: 0870 600 5522 Order through the Parliamentary Hotline Lo-Call 0845 7 023474 Fax orders: 0870 600 5533 Email: [email protected] Textphone: 0870 240 3701 The Houses of Parliament Shop 12 Bridge Street, Parliament Square, London SW1A 2JX Telephone orders/general enquiries: 020 7219 3890 Fax orders: 020 7219 3866 Email: [email protected] Internet: http://www.shop.parliament.uk TSO@Blackwell and other accredited agents