Embed Size (px)
Citation preview

Aswath Damodaran 1
Valuation: Many a slip between the cupand the lip…
Aswath Damodaranwww.damodaran.com

Aswath Damodaran 2
Some Initial Thoughts
" One hundred thousand lemmings cannot be wrong"Graffiti

Aswath Damodaran 3
Misconceptions about Valuation
Myth 1: A valuation is an objective search for “true” value• Truth 1.1: All valuations are biased. The only questions are how much and in which
direction.• Truth 1.2: The direction and magnitude of the bias in your valuation is directly
proportional to who pays you and how much you are paid. Myth 2.: A good valuation provides a precise estimate of value
• Truth 2.1: There are no precise valuations• Truth 2.2: The payoff to valuation is greatest when valuation is least precise.
Myth 3: . The more quantitative a model, the better the valuation• Truth 3.1: One’s understanding of a valuation model is inversely proportional to
the number of inputs required for the model.• Truth 3.2: Simpler valuation models do much better than complex ones.
Aswath Damodaran 4
Approaches to Valuation
Discounted cashflow valuation, relates the value of an asset to the presentvalue of expected future cashflows on that asset.
Relative valuation, estimates the value of an asset by looking at the pricing of'comparable' assets relative to a common variable like earnings, cashflows,book value or sales.
Contingent claim valuation, uses option pricing models to measure the valueof assets that share option characteristics.

Aswath Damodaran 5
Discounted Cash Flow Valuation
What is it: In discounted cash flow valuation, the value of an asset is thepresent value of the expected cash flows on the asset.
Philosophical Basis: Every asset has an intrinsic value that can be estimated,based upon its characteristics in terms of cash flows, growth and risk.
Information Needed: To use discounted cash flow valuation, you need• to estimate the life of the asset• to estimate the cash flows during the life of the asset• to estimate the discount rate to apply to these cash flows to get present value
Market Inefficiency: Markets are assumed to make mistakes in pricing assetsacross time, and are assumed to correct themselves over time, as newinformation comes out about assets.

Aswath Damodaran 6
DCF Choices: Equity Valuation versus Firm Valuation
Assets Liabilities
Assets in Place Debt
Equity
Fixed Claim on cash flowsLittle or No role in managementFixed MaturityTax Deductible
Residual Claim on cash flowsSignificant Role in managementPerpetual Lives
Growth Assets
Existing InvestmentsGenerate cashflows todayIncludes long lived (fixed) and
short-lived(working capital) assets
Expected Value that will be created by future investments
Equity valuation: Value just theequity claim in the business
Firm Valuation: Value the entire business

Aswath Damodaran 7
Valuation with Infinite Life
Cash flowsFirm: Pre-debt cash flowEquity: After debt cash flows
Expected GrowthFirm: Growth in Operating EarningsEquity: Growth in Net Income/EPS
CF1 CF2 CF3 CF4 CF5
Forever
Firm is in stable growth:Grows at constant rateforever
Terminal Value
CFn.........
Discount RateFirm:Cost of Capital
Equity: Cost of Equity
ValueFirm: Value of Firm
Equity: Value of Equity
DISCOUNTED CASHFLOW VALUATION
Length of Period of High Growth

Aswath Damodaran 8
Cashflow to FirmEBIT (1-t)- (Cap Ex - Depr)- Change in WC= FCFF
Expected GrowthReinvestment Rate* Return on Capital
FCFF1 FCFF2 FCFF3 FCFF4 FCFF5
Forever
Firm is in stable growth:Grows at constant rateforever
Terminal Value= FCFF n+1/(r-gn)
FCFFn.........
Cost of Equity Cost of Debt(Riskfree Rate+ Default Spread) (1-t)
WeightsBased on Market Value
Discount at WACC= Cost of Equity (Equity/(Debt + Equity)) + Cost of Debt (Debt/(Debt+ Equity))
Value of Operating Assets+ Cash & Non-op Assets= Value of Firm- Value of Debt= Value of Equity
Riskfree Rate :- No default risk- No reinvestment risk- In same currency andin same terms (real or nominal as cash flows
+Beta- Measures market risk X
Risk Premium- Premium for averagerisk investment
Type of Business
Operating Leverage
FinancialLeverage
Base EquityPremium
Country RiskPremium
DISCOUNTED CASHFLOW VALUATION
Aswath Damodaran 9
Current Cashflow to FirmEBIT(1-t) : 2210- Nt CpX 366 - Chg WC 155= FCFF 1689Reinvestment Rate = 521/1689= 23.58%
Expected Growth in EBIT (1-t).41*.0901=.03693.69%
Stable Growthg = 3%; Beta = 0.9;Country Premium= 1.3%Debt Ratio = 23.7%Cost of capital = 9.19% ROC= 9.19%; Tax rate=30%Reinvestment Rate=g/ROC =3/9.19 = 32.63%
Terminal Value5= 1838/(.0919-.03) = 29,676
Cost of Equity12.25%
Cost of Debt(5.50%+0.85%)(1-.30)= 4.45%
WeightsE = 76.3% D = 23.7%
Discount at Cost of Capital (WACC) = 12.25% (.763) + 4.45% (0.237) = 10.39%
Op. Assets 23,524+ Cash: 2,904- Debt 7,660=Equity 18,768-Options 0Equity 18,768Value/Sh Rs 104/sh
Riskfree Rate:Rs Riskfree Rate= 5.50%
+Beta 0.90 X
Mature market premium 4 %
Unlevered Beta for Sectors: 0.74
Firm!s D/ERatio: 31.13%
Tata Chemicals: StatusQuo
Reinvestment Rate 41%
Return on Capital9.01%
Term Yr 2,728 - 890=1838
+ Lambda1.21
XCountry Equity RiskPremium2.60%
Country Default Spread1.30%
X
Rel Equity Mkt Vol
2.00
On June 15, 2004Tata Chem= Rs 136.2
Average Reinvestment Rate(1999-2003) = 41%
Year 1 2 3 4 5EBIT (1-t) 2291 2376 2464 2555 2649 - Reinvestment 939 974 1010 1047 1086FCFF 1352 1402 1454 1507 1563

Aswath Damodaran 10
Current Cashflow to FirmEBIT(1-t) : 9485- Nt CpX 2594 - Chg WC 341= FCFF 6550Reinvestment Rate = 2935/9485= 30.95%
Expected Growth in EBIT (1-t).7547*.2682=.202420.24%
Stable Growthg = 5%; Beta = 1.0;Country Premium= 1.3%Debt Ratio = 20%Cost of capital = 8.83% ROC= 8.83%; Tax rate=25%Reinvestment Rate=g/ROC =5/8.83 = 56.60%
Terminal Value5= 16163/(.0883-.05) = 421,583
Cost of Equity11.33%
Cost of Debt(5.50%+0.35%)(1-.15)= 4.97%
WeightsE = 99.7% D = 0.3%
Discount at Cost of Capital (WACC) = 11.33% (.997) + 4.97% (0.003) = 11.31%
Op. Assets 196,704+ Cash: 28792- Debt 1054- Minority Int. 524=Equity 223,917-Options 1,971Equity 221,946Value/Sh Rs 960/sh
Riskfree Rate:Rs Riskfree Rate= 5.50%
+Beta 1.2480 X
Mature market premium 4 %
Unlevered Beta for Sectors: 1.2446
Firm!s D/ERatio: 0.30%
Wipro: Status Quo
Reinvestment Rate 75.47%
Return on Capital26.82%
Term Yr 3724221079=16163
+ Lambda0.32
XCountry Equity RiskPremium2.60%
Country Default Spread1.30%
X
Rel Equity Mkt Vol
2.00
On June 15, 2004Wipro price = Rs 1523
Average Reinvestment Rate(1999-2003) = 75.47%
Year 1 2 3 4 5 6 7 8 9 10
EBIT 13418 16134 19400 23327 28048 32871 37521 41684 45039 47291
EBIT (1-t) 11405 13714 16490 19828 23841 27940 31893 35432 38283 40198
- Reinvestment 8608 10350 12445 14964 17993 20033 21663 22729 23114 22752
FCFF 2797 3364 4045 4863 5848 7908 10230 12703 15170 17446
Adjust beta to 1, debt ratio to 20% in years 6-10
49656
First 5 years
Growth declines to 5%

Aswath Damodaran 11
I. Measure earnings right..
Update- Trailing Earnings- Unofficial numbers
Normalize Earnings
Cleanse operating items of- Financial Expenses- Capital Expenses- Non-recurring expenses
Operating leases- Convert into debt- Adjust operating income
R&D Expenses- Convert into asset- Adjust operating income
Measuring Earnings
Firm!s history
Comparable Firms

Aswath Damodaran 12
II. Get the big picture (not the accounting one) when it comesto cap ex and working capital
Capital expenditures should include• Research and development expenses, once they have been re-categorized as capital
expenses.• Acquisitions of other firms, whether paid for with cash or stock.
Working capital should be defined not as the difference between current assetsand current liabilities but as the difference between non-cash current assetsand non-debt current liabilities.
On both items, start with what the company did in the most recent year but dolook at the company’s history and at industry averages.

Aswath Damodaran 13
III. Betas don’t come from regressions or services
Step 1: Find the business or businesses that your firm operates in.
Step 2: Find publicly traded firms in each of these businesses and obtain their regression betas. Compute the simple average across these regression betas to arrive at an average beta for these publicly traded firms. Unlever this average beta using the average debt to equity ratio across the publicly traded firms in the sample.Unlevered beta for business = Average beta across publicly traded firms/ (1 + (1- t) (Average D/E ratio across firms))
If you can, adjust this beta for differencesbetween your firm and the comparablefirms on operating leverage and product characteristics.
Step 3: Estimate how much value your firm derives from each of the different businesses it is in.
While revenues or operating income are often used as weights, it is better to try to estimate the value of each business.
Step 4: Compute a weighted average of the unlevered betas of the different businesses (from step 2) using the weights from step 3.Bottom-up Unlevered beta for your firm = Weighted average of the unlevered betas of the individual business
Step 5: Compute a levered beta (equity beta) for your firm, using the market debt to equity ratio for your firm. Levered bottom-up beta = Unlevered beta (1+ (1-t) (Debt/Equity))
If you expect the business mix of your firm to change over time, you can change the weights on a year-to-year basis.
If you expect your debt to equity ratio to change over time, the levered beta will change over time.
Possible Refinements
Business Mix Revenues Operating Income Weights Unlevered beta Debt/Equity Levered Beta
Consulting and Service 36803 7128 63.88% 0.98 0.30% 0.98
Software 16534 3203 28.70% 1.97 0.30% 1.98
Consumer products 5475 828 7.42% 0.72 0.30% 0.72
11159 1.24 0.30% 1.25

Aswath Damodaran 14
IV. And the past is not always a good indicator of the future
It is standard practice to use historical premiums as forward looking premiums. :Arithmetic average Geometric AverageStocks - Stocks - Stocks - Stocks -
Historical Period T.Bills T.Bonds T.Bills T.Bonds
1928-2005 7.83% 5.95% 6.47% 4.80%1964-2005 5.52% 4.29% 4.08% 3.21%1994-2005 8.80% 7.07% 5.15% 3.76%
An alternative is to back out the premium from market prices:
Implied Equity risk premium = Expected return on stocks - Treasury bond rate = 8.47%-4.39% = 4.08%
January 1, 2006S&P 500 is at 1248.24
In 2005, dividends & stock buybacks were 3.34% of the index, generating 41.63.in cashflows
Analyst estimate of growth in net income for S&P 500 over next 5 years = 8%
After year 5, we will assume that earnings on the index will grow at 4.39%, the same rate as the entire economy
44.96 48.56 52.44 56.64 61.17

Aswath Damodaran 15
V. There is a downside to globalization…
Emerging markets offer growth opportunities but they are also riskier. If wewant to count the growth, we have to also consider the risk.
Consider, for example, India as a country. In mid-2004, India was rated Baa2,with a default spread of 1.30%.
• To estimate the country equity risk premium, we scaled up the default spread toreflect the additional risk in equities.
– Standard Deviation in BSE = 32%– Standard Deviation in Indian Government Bond = 16%– Additional country risk premium = 1.30% (32/16) = 2.60%
Aswath Damodaran 16
VI. And it is not just emerging market companies that areexposed to this risk..
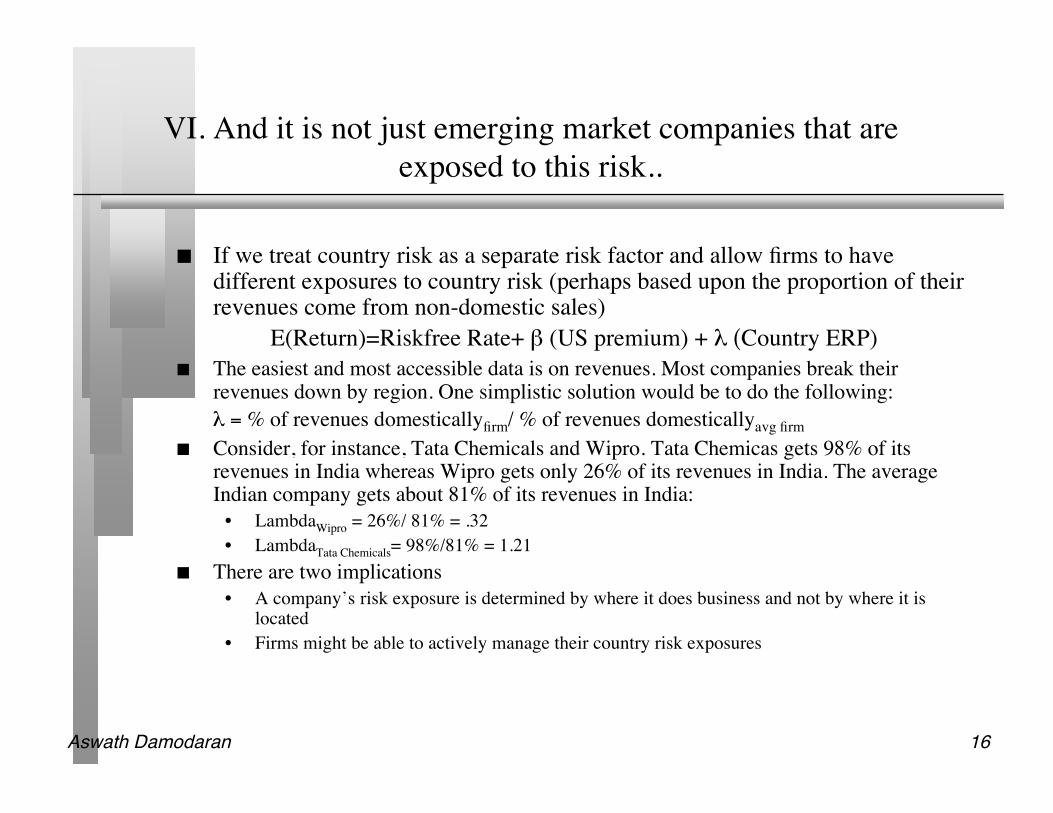
If we treat country risk as a separate risk factor and allow firms to havedifferent exposures to country risk (perhaps based upon the proportion of theirrevenues come from non-domestic sales)
E(Return)=Riskfree Rate+ β (US premium) + λ (Country ERP) The easiest and most accessible data is on revenues. Most companies break their
revenues down by region. One simplistic solution would be to do the following:λ = % of revenues domesticallyfirm/ % of revenues domesticallyavg firm
Consider, for instance, Tata Chemicals and Wipro. Tata Chemicas gets 98% of itsrevenues in India whereas Wipro gets only 26% of its revenues in India. The averageIndian company gets about 81% of its revenues in India:
• LambdaWipro = 26%/ 81% = .32• LambdaTata Chemicals= 98%/81% = 1.21
There are two implications• A company’s risk exposure is determined by where it does business and not by where it is
located• Firms might be able to actively manage their country risk exposures
Aswath Damodaran 17
VII. Discount rates can (and often should) change overtime…
The inputs into the cost of capital - the cost of equity (beta), the cost of debt(default risk) and the debt ratio - can change over time. For younger firms,they should change over time.
At the minimum, they should change when you get to your terminal year toinputs that better reflect a mature firm.

Aswath Damodaran 18
VIII. Growth has to be earned (not endowed or estimated)Expected Growth
Net Income Operating Income
Retention Ratio=1 - Dividends/Net Income
Return on EquityNet Income/Book Value of Equity
X
Reinvestment Rate = (Net Cap Ex + Chg in WC/EBIT(1-t)
Return on Capital =EBIT(1-t)/Book Value of Capital
X
ROC = EBIT ( 1- tax rate)
Book Value of Equity + Book value of debt - Cash
Adjust EBIT fora. Extraordinary or one-time expenses or incomeb. Operating leases and R&Dc. Cyclicality in earnings (Normalize)d. Acquisition Debris (Goodwill amortization etc.)
Use a marginal tax rateto be safe. A high ROC created by paying low effective taxes is not sustainable
Adjust book equity for1. Capitalized R&D2. Acquisition Debris (Goodwill)
Adjust book value of debt fora. Capitalized operating leases
Use end of prior year numbers or average over the yearbut be consistent in your application

Aswath Damodaran 19
IX. All good things come to an end..And the terminal valueis not an ATM…
Terminal Valuen =EBITn+1 (1 - tax rate) (1 - Reinvestment Rate)
Cost of capital - Expected growth rate
Are you reinvesting enough to sustain your stable growth rate?CheckReinv Rate = g/ ROC
This growth rate should be less than the nominlnal growth rate of the economy
This is a mature company. It!s cost of capital should reflect that.
This tax rate locks in forever. Does it make sense to use an effective tax rate?

Aswath Damodaran 20
X. The loose ends matter…
Value of Operating Assets
+ Cash and Marketable Securities
+ Value of Cross Holdings
+ Value of Other Assets
Value of Firm
- Value of Debt
= Value of Equity
- Value of Equity Options
= Value of Common Stock
/ Number of shares
= Value per share
Operating versus Non-opeating cashShould cash be discounted for earning a low return?
How do you value cross holdings in other companies?What if the cross holdings are in private businesses?
What about other valuable assets?How do you consider under utlilized assets?
What should be counted in debt?Should you subtract book or market value of debt?What about other obligations (pension fund and health care?What about contingent liabilities?What about minority interests?
What equity options should be valued here (vested versus non-vested)?How do you value equity options?
Should you divide by primary or diluted shares?
Should you discount this value for opacity or complexity?How about a premium for synergy?What about a premium for intangibles (brand name)?
Should there be a premium/discount for control?Should there be a discount for distress
Should there be a discount for illiquidity/ marketability?Should there be a discount for minority interests?
Since this is a discounted cashflow valuation, should there be a real option premium?

Aswath Damodaran 21
1a. The Value of Cash
The simplest and most direct way of dealing with cash and marketablesecurities is to keep it out of the valuation - the cash flows should be beforeinterest income from cash and securities, and the discount rate should not becontaminated by the inclusion of cash. (Use betas of the operating assets aloneto estimate the cost of equity).
Once the operating assets have been valued, you should add back the value ofcash and marketable securities.

Aswath Damodaran 22
How much cash is too much cash?
Cash as % of Firm Value: July 2000
0
200
400
600
800
1000
1200
0-1% 1-2% 2-5% 5-10% 10-15% 15-20% 20-25% 25-30% >30%
Aswath Damodaran 23
Should you ever discount cash for its low returns?
There are some analysts who argue that companies with a lot of cash on theirbalance sheets should be penalized by having the excess cash discounted toreflect the fact that it earns a low return.
• Excess cash is usually defined as holding cash that is greater than what the firmneeds for operations.
• A low return is defined as a return lower than what the firm earns on its non-cashinvestments.
This is the wrong reason for discounting cash. If the cash is invested inriskless securities, it should earn a low rate of return. As long as the return ishigh enough, given the riskless nature of the investment, cash does not destroyvalue.
There is a right reason, though, that may apply to some companies…
Aswath Damodaran 24
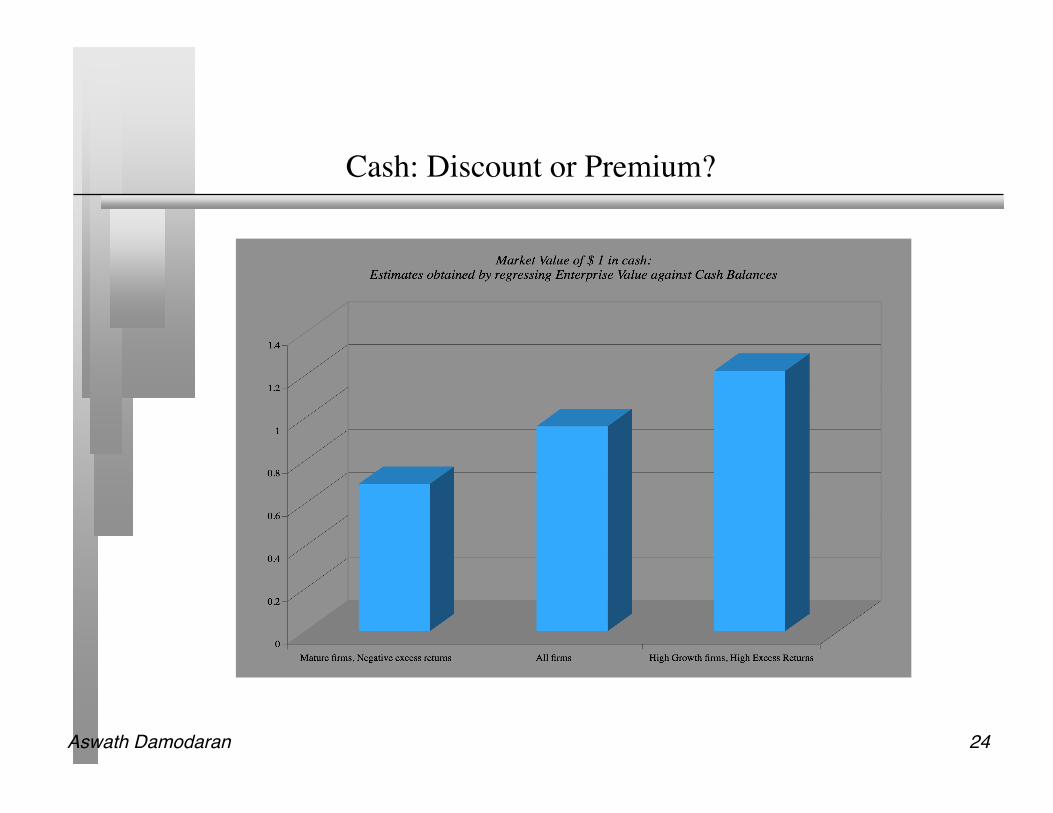
Cash: Discount or Premium?

Aswath Damodaran 25
1b. Dealing with Holdings in Other firms
Holdings in other firms can be categorized into• Minority passive holdings, in which case only the dividend from the holdings is
shown in the balance sheet• Minority active holdings, in which case the share of equity income is shown in the
income statements• Majority active holdings, in which case the financial statements are consolidated.

Aswath Damodaran 26
How to value holdings in other firms.. In a perfect world..
In a perfect world, we would strip the parent company from its subsidiariesand value each one separately. The value of the combined firm will be
• Value of parent company + Proportion of value of each subsidiary To do this right, you will need to be provided detailed information on each
subsidiary to estimated cash flows and discount rates.

Aswath Damodaran 27
Two compromise solutions…
The market value solution: When the subsidiaries are publicly traded, youcould use their traded market capitalizations to estimate the values of the crossholdings. You do risk carrying into your valuation any mistakes that themarket may be making in valuation.
The relative value solution: When there are too many cross holdings to valueseparately or when there is insufficient information provided on crossholdings, you can convert the book values of holdings that you have on thebalance sheet (for both minority holdings and minority interests in majorityholdings) by using the average price to book value ratio of the sector in whichthe subsidiaries operate.

Aswath Damodaran 28
2. Other Assets that have not been counted yet..
Unutilized assets: If you have assets or property that are not being utilized(vacant land, for example), you have not valued it yet. You can assess amarket value for these assets and add them on to the value of the firm.
Overfunded pension plans: If you have a defined benefit plan and your assetsexceed your expected liabilities, you could consider the over funding with twocaveats:
• Collective bargaining agreements may prevent you from laying claim to theseexcess assets.
• There are tax consequences. Often, withdrawals from pension plans get taxed atmuch higher rates.
Do not double count an asset. If you count the income from an asset in yourcashflows, you cannot count the market value of the asset in your value.

Aswath Damodaran 29
3. A Discount for Complexity:An Experiment
Company A Company BOperating Income $ 1 billion $ 1 billionTax rate 40% 40%ROIC 10% 10%Expected Growth 5% 5%Cost of capital 8% 8%Business Mix Single Business Multiple BusinessesHoldings Simple ComplexAccounting Transparent Opaque Which firm would you value more highly?

Aswath Damodaran 30
Sources of Complexity
Accounting Standards• Inconsistency in applying accounting principles (Operating leases, R&D etc.)• Fuzzy Accounting Standards (One-time charges, hidden assets)• Unintended Consequences of Increased Disclosure
Nature and mix of businesses• Multiple businesses (Eg. GE)• Multiple countries (Eg. Coca Cola)
Structuring of businesses• Cross Holdings (The Japanese Curse)• Creative Holding Structures (Enronitis)
Financing Choices• Growth of Hybrids• New Securities (Playing the Ratings Game)
Aswath Damodaran 31
Reasons for Complexity
Control• Complex holding structures were designed to make it more difficult for outsiders
(which includes investors) to know how much a firm is worth, how much it ismaking and what assets it holds.
• Multiple classes of shares and financing choices also make it more likely thatincumbents can retain control in the event of a challenge.
Tax Benefits• Complex tax law begets complex business mixes and holding structures.
– Different tax rates for different locales and different transactions– Tax credits
Deceit

Aswath Damodaran 32
Measuring Complexity: Volume of Data in FinancialStatements
Company Number of pages in last 10Q Number of pages in last 10K
General Electric 65 410
Microsoft 63 218
Wal-mart 38 244
Exxon Mobil 86 332
Pfizer 171 460
Citigroup 252 1026
Intel 69 215
AIG 164 720
Johnson & Johnson 63 218
IBM 85 353

Aswath Damodaran 33
Measuring Complexity: A Complexity Score
Item Factors Follow-up Question Answer Complexity score
1. Multiple Businesses Number of businesses (with more than 10% of revenues) = 2 4
2. One-time income and expenses Percent of operating income = 20% 1
3. Income from unspecified sources Percent of operating income = 15% 0.75
Operating Income
4. Items in income statement that are volatile
Percent of operating income = 5% 0.25
1. Income from multiple locales Percent of revenues from non-domestic locales = 100% 3
2. Different tax and reporting books Yes or No Yes 3
3. Headquarters in tax havens Yes or No Yes 3
Tax Rate
4. Volatile effective tax rate Yes or No Yes 2
1. Volatile capital expenditures Yes or No Yes 2
2. Frequent and large acquisitions Yes or No Yes 4
Capital
Expenditures
3. Stock payment for acquisitions and investments Yes or No Yes 4
1. Unspecified current assets and current liabilitiesYes or No Yes 3
Working capital
2. Volatile working capital items Yes or No Yes 2
1. Off-balance sheet assets and liabilities (operating
leases and R&D) Yes or No Yes 3
2. Substantial stock buybacks Yes or No Yes 3
3. Changing return on capital over time Is your return on capital volatile? Yes 5
Expected Growth
rate
4. Unsustainably high return Is your firm's ROC much higher than industry average? Yes 5
1. Multiple businesses Number of businesses (more than 10% of revenues) = 2 2
2. Operations in emerging markets Percent of revenues= 30% 1.5
3. Is the debt market traded? Yes or No Yes 0
4. Does the company have a rating? Yes or No Yes 0
Cost of capital
5. Does the company have off-balance sheet debt?
Yes or No No 0
Complexity Score = 51.5
Aswath Damodaran 34
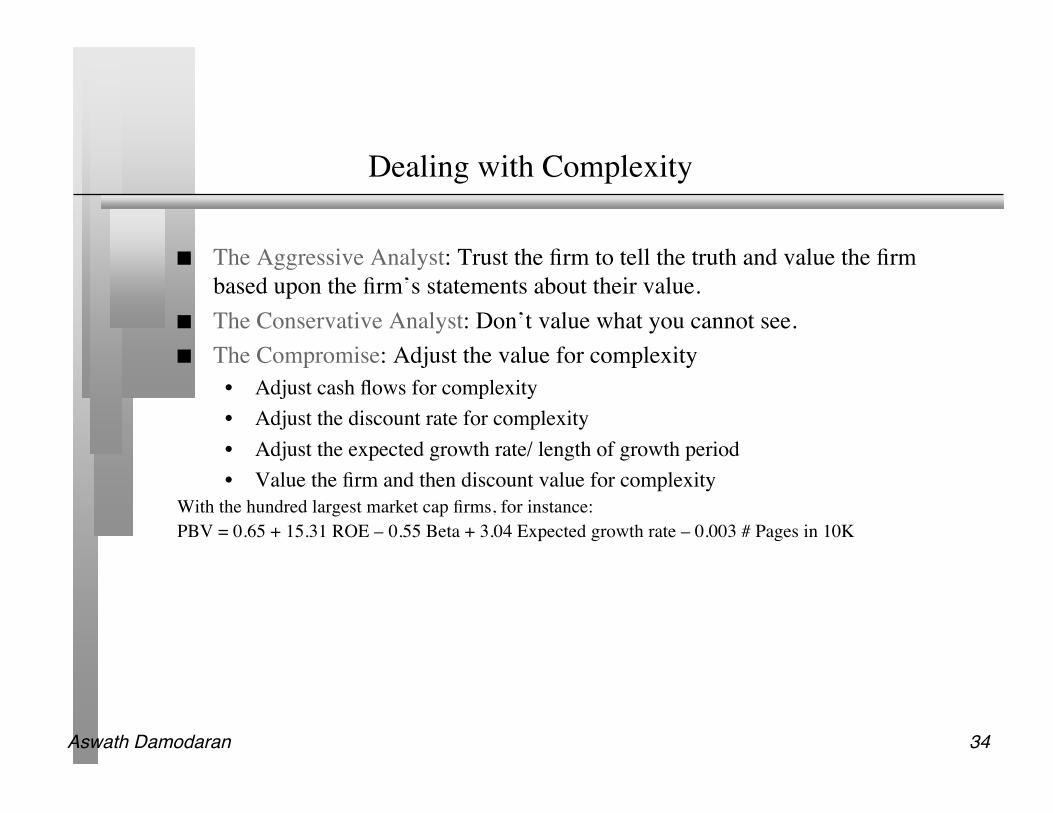
Dealing with Complexity
The Aggressive Analyst: Trust the firm to tell the truth and value the firmbased upon the firm’s statements about their value.
The Conservative Analyst: Don’t value what you cannot see. The Compromise: Adjust the value for complexity
• Adjust cash flows for complexity• Adjust the discount rate for complexity• Adjust the expected growth rate/ length of growth period• Value the firm and then discount value for complexity
With the hundred largest market cap firms, for instance:PBV = 0.65 + 15.31 ROE – 0.55 Beta + 3.04 Expected growth rate – 0.003 # Pages in 10K

Aswath Damodaran 35
4. The Value of Synergy
Synergy can be valued. In fact, if you want to pay for it, it should be valued. To value synergy, you need to answer two questions:
(a) What form is the synergy expected to take? Will it reduce costs as a percentage ofsales and increase profit margins (as is the case when there are economies of scale)?Will it increase future growth (as is the case when there is increased marketpower)? )
(b) When can the synergy be reasonably expected to start affecting cashflows?(Will the gains from synergy show up instantaneously after the takeover? If it willtake time, when can the gains be expected to start showing up? )
If you cannot answer these questions, you need to go back to the drawingboard…

Aswath Damodaran 36
A procedure for valuing synergy
(1) the firms involved in the merger are valued independently, by discountingexpected cash flows to each firm at the weighted average cost of capital forthat firm.
(2) the value of the combined firm, with no synergy, is obtained by adding thevalues obtained for each firm in the first step.
(3) The effects of synergy are built into expected growth rates and cashflows,and the combined firm is re-valued with synergy.
Value of Synergy = Value of the combined firm, with synergy - Value of thecombined firm, without synergy
Aswath Damodaran 37
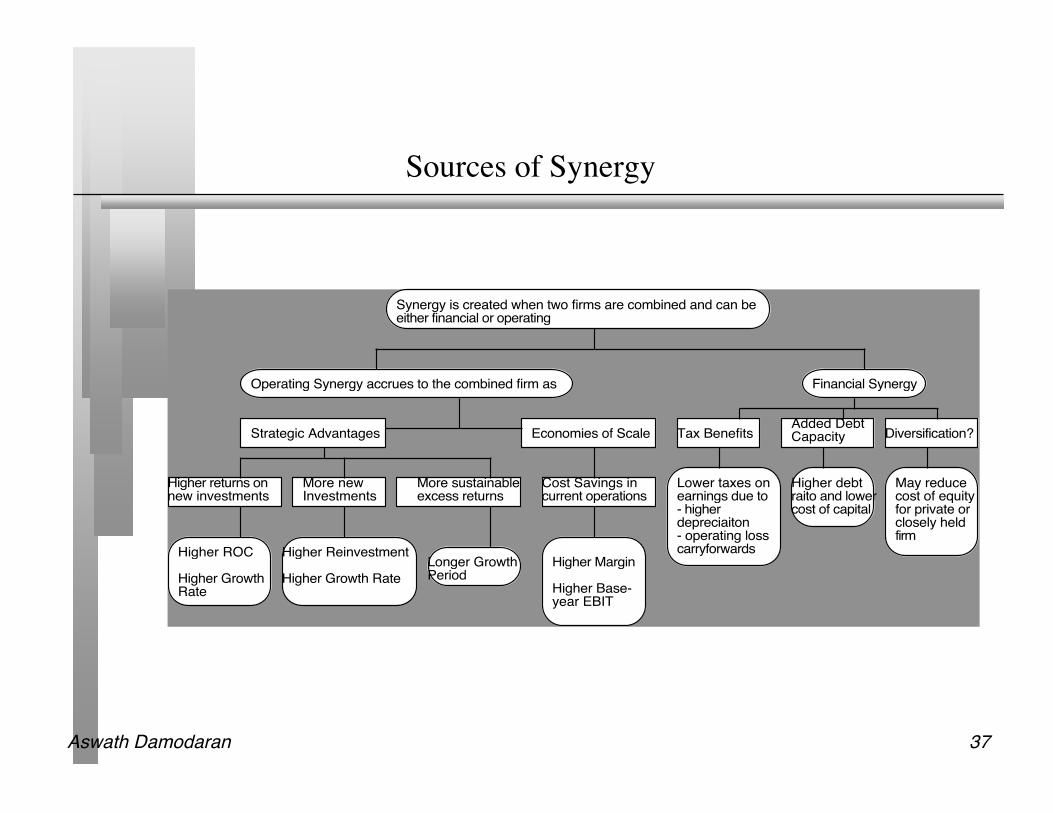
Sources of Synergy
Synergy is created when two firms are combined and can be either financial or operating
Operating Synergy accrues to the combined firm as Financial Synergy
Higher returns on new investments
More newInvestments
Cost Savings in current operations
Tax BenefitsAdded Debt Capacity Diversification?
Higher ROC
Higher Growth Rate
Higher Reinvestment
Higher Growth Rate
Higher Margin
Higher Base-year EBIT
Strategic Advantages Economies of Scale
Longer GrowthPeriod
More sustainableexcess returns
Lower taxes on earnings due to - higher depreciaiton- operating loss carryforwards
Higher debt raito and lower cost of capital
May reducecost of equity for private or closely heldfirm
Aswath Damodaran 38
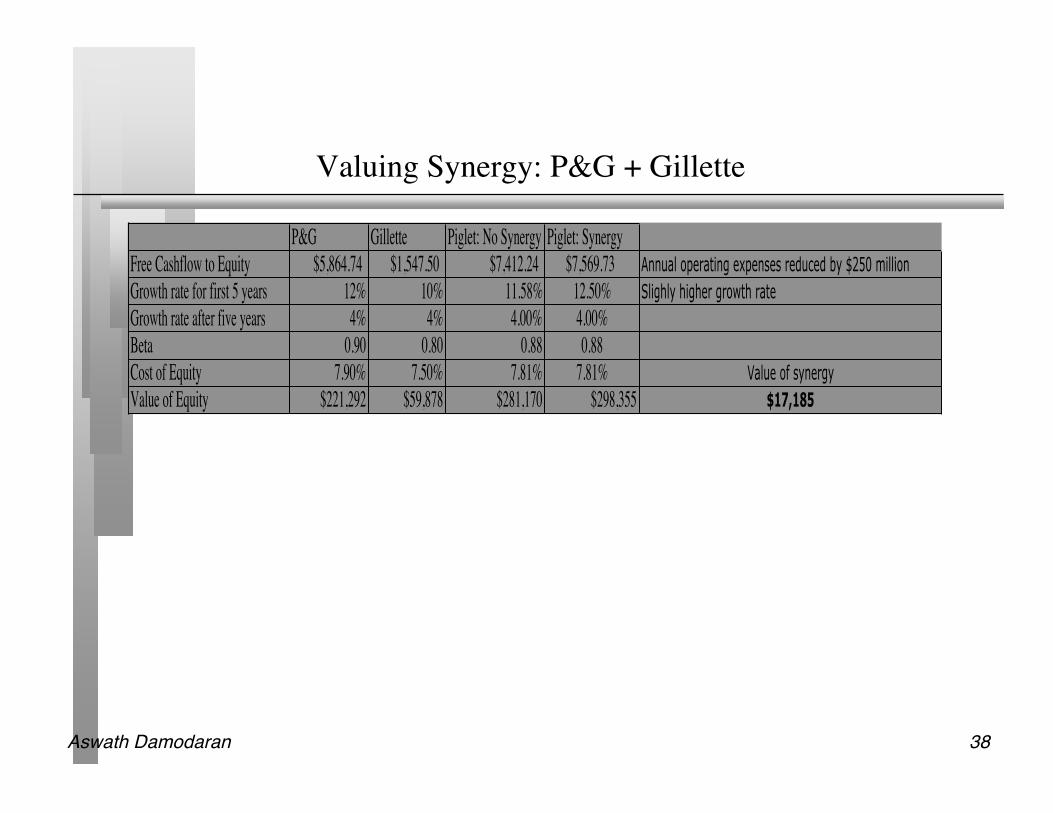
Valuing Synergy: P&G + Gillette
P&G Gillette Piglet: No Synergy Piglet: SynergyFree Cashflow to Equity $5,864.74 $1,547.50 $7,412.24 $7,569.73 Annual operating expenses reduced by $250 million
Growth rate for first 5 years 12% 10% 11.58% 12.50% Slighly higher growth rate
Growth rate after five years 4% 4% 4.00% 4.00%Beta 0.90 0.80 0.88 0.88Cost of Equity 7.90% 7.50% 7.81% 7.81% Value of synergy
Value of Equity $221,292 $59,878 $281,170 $298,355 $17,185

Aswath Damodaran 39
5. Brand name, great management, superb product …Are weshort changing the intangibles?
There is often a temptation to add on premiums for intangibles. Among themare
• Brand name• Great management• Loyal workforce• Technological prowess
There are two potential dangers:• For some assets, the value may already be in your value and adding a premium will
be double counting.• For other assets, the value may be ignored but incorporating it will not be easy.

Aswath Damodaran 40
Categorizing Intangibles
Independent and Cash flow
generating intangibles
Not independent and cash flow
generating to the firm
No cash flows now but potential
for cashflows in future
Examples Copyrights, trademarks, licenses,
franchises, professional practices
(medical, dental)
Brand names, Quality and Morale
of work force, Technological
expertise, Corporate reputation
Undeveloped patents, operating or
financial flexibility (to expand into
new products/markets or abandon
existing ones)
Valuation approach Estimate expected cashflows from
the product or service and discount
back at appropriate discount rate.
• C ompare DCF value of firm
with intangible with firm
without (if you can find one)
• A ssume that all excess returns
of firm are due to intangible.
• C ompare multiples at which
firm trades to sector averages.
Option valuation
• V a lue the undeveloped patent
as an option to develop the
underlying product.
• V a lue expansion options as call
options
• V a lue abandonment options as
put options.
Challenges • L ife is usually finite and
terminal value may be small.
• C a s hflows and value may be
person dependent (for
professional practices)
With multiple intangibles (brand
name and reputation for service), it
becomes difficult to break down
individual components.
• Need exclusivity.
• D i f f icult to replicate and
arbitrage (making option
pricing models dicey)

Aswath Damodaran 41
Valuing Brand Name
Coca Cola With Cott MarginsCurrent Revenues = $21,962.00 $21,962.00Length of high-growth period 10 10Reinvestment Rate = 50% 50%Operating Margin (after-tax) 15.57% 5.28%Sales/Capital (Turnover ratio) 1.34 1.34Return on capital (after-tax) 20.84% 7.06%Growth rate during period (g) = 10.42% 3.53%Cost of Capital during period = 7.65% 7.65%Stable Growth PeriodGrowth rate in steady state = 4.00% 4.00%Return on capital = 7.65% 7.65%Reinvestment Rate = 52.28% 52.28%Cost of Capital = 7.65% 7.65%Value of Firm = $79,611.25 $15,371.24
Aswath Damodaran 42
6. Defining Debt
General Rule: Debt generally has the following characteristics:• Commitment to make fixed payments in the future• The fixed payments are tax deductible• Failure to make the payments can lead to either default or loss of control of the firm
to the party to whom payments are due. Defined as such, debt should include
• All interest bearing liabilities, short term as well as long term• All leases, operating as well as capital
Debt should not include• Accounts payable or supplier credit
Aswath Damodaran 43
Book Value or Market Value
For some firms that are in financial trouble, the book value of debt can besubstantially higher than the market value of debt. Analysts worry thatsubtracting out the market value of debt in this case can yield too high a valuefor equity.
A discounted cashflow valuation is designed to value a going concern. In agoing concern, it is the market value of debt that should count, even if it ismuch lower than book value.
In a liquidation valuation, you can subtract out the book value of debt from theliquidation value of the assets.
Converting book debt into market debt,,,,,
Aswath Damodaran 44
But you should consider other potential liabilities
If you have under funded pension fund or health care plans, you shouldconsider the under funding at this stage in getting to the value of equity.
• If you do so, you should not double count by also including a cash flow line itemreflecting cash you would need to set aside to meet the unfunded obligation.
• You should not be counting these items as debt in your cost of capitalcalculations….
If you have contingent liabilities - for example, a potential liability from alawsuit that has not been decided - you should consider the expected value ofthese contingent liabilities
• Value of contingent liability = Probability that the liability will occur * Expectedvalue of liability

Aswath Damodaran 45
7. The Value of Control
The value of the control premium that will be paid to acquire a block of equitywill depend upon two factors -
• Probability that control of firm will change: This refers to the probability thatincumbent management will be replaced. this can be either through acquisition orthrough existing stockholders exercising their muscle.
• Value of Gaining Control of the Company: The value of gaining control of acompany arises from two sources - the increase in value that can be wrought bychanges in the way the company is managed and run, and the side benefits andperquisites of being in control
Value of Gaining Control = Present Value (Value of Company with change in control -Value of company without change in control) + Side Benefits of Control

Aswath Damodaran 46
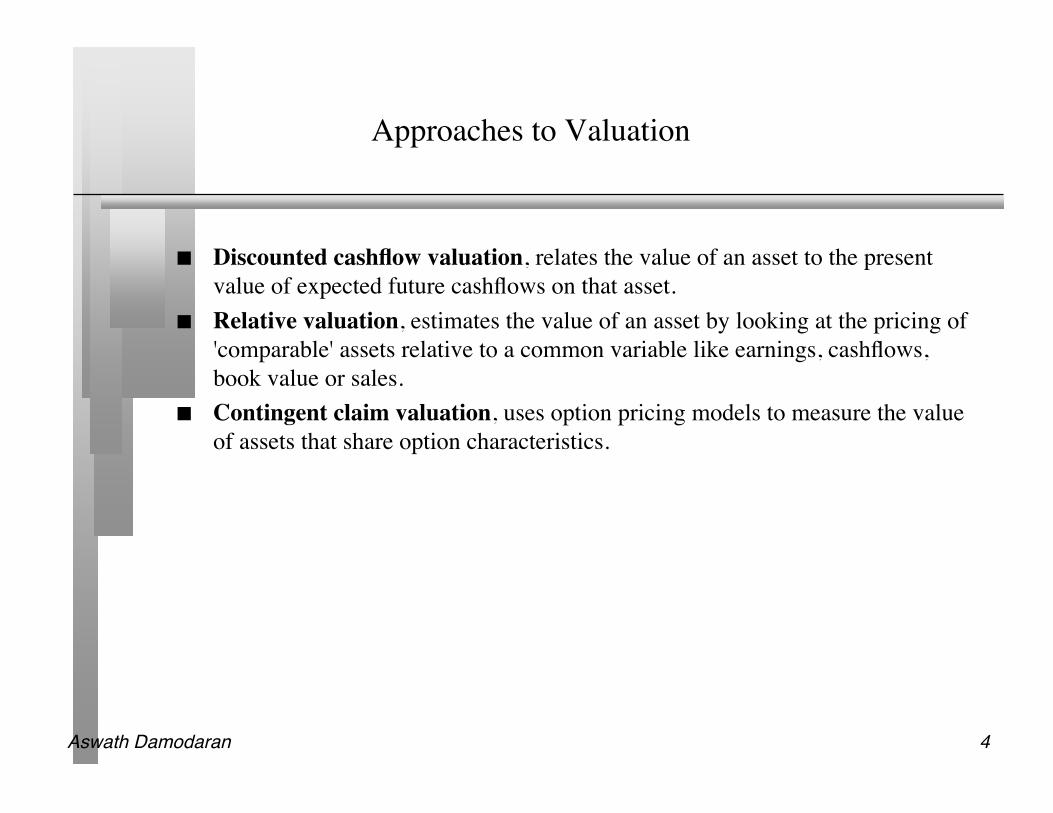
Tata Chemicals: Optimal Debt Ratio
Debt Ratio Beta Cost of Equity Bond Rating Interest rate on debt Tax Rate Cost of Debt (after-tax) WACC Firm Value (G)
0% 0.74 11.60% AAA 6.00% 30.00% 4.20% 11.60% $26,591
10% 0.80 11.83% AA 6.00% 30.00% 4.20% 11.07% $28,841
20% 0.87 12.12% A+ 6.20% 30.00% 4.34% 10.56% $31,333
30% 0.96 12.49% A- 6.50% 30.00% 4.55% 10.11% $33,964
40% 1.08 12.98% BB 8.00% 30.00% 5.60% 10.03% $34,459
50% 1.26 13.67% B- 11.50% 30.00% 8.05% 10.86% $29,819
60% 1.51 14.71% CC 15.50% 30.00% 10.85% 12.39% $23,810
70% 2.00 16.63% CC 15.50% 27.05% 11.31% 12.90% $22,284
80% 3.08 20.95% C 17.50% 20.96% 13.83% 15.25% $17,139
90% 6.54 34.80% D 25.50% 12.79% 22.24% 23.50% $9,115
Tata Chemical’s Existing Debt RatioEquity = 76.3% Debt = 23.7%Cost of Capital = 10.39%
Aswath Damodaran 47
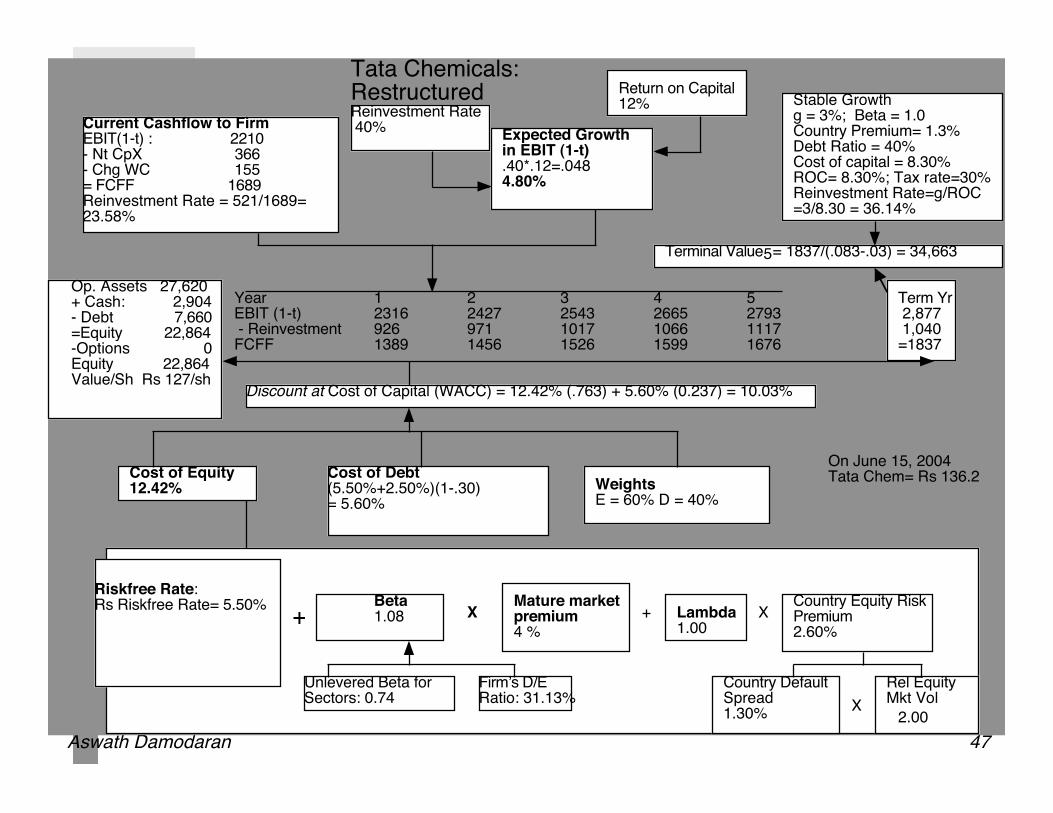
Current Cashflow to FirmEBIT(1-t) : 2210- Nt CpX 366 - Chg WC 155= FCFF 1689Reinvestment Rate = 521/1689= 23.58%
Expected Growth in EBIT (1-t).40*.12=.0484.80%
Stable Growthg = 3%; Beta = 1.0Country Premium= 1.3%Debt Ratio = 40%Cost of capital = 8.30% ROC= 8.30%; Tax rate=30%Reinvestment Rate=g/ROC =3/8.30 = 36.14%
Terminal Value5= 1837/(.083-.03) = 34,663
Cost of Equity12.42%
Cost of Debt(5.50%+2.50%)(1-.30)= 5.60%
WeightsE = 60% D = 40%
Discount at Cost of Capital (WACC) = 12.42% (.763) + 5.60% (0.237) = 10.03%
Op. Assets 27,620+ Cash: 2,904- Debt 7,660=Equity 22,864-Options 0Equity 22,864Value/Sh Rs 127/sh
Riskfree Rate:Rs Riskfree Rate= 5.50%
+Beta 1.08 X
Mature market premium 4 %
Unlevered Beta for Sectors: 0.74
Firm!s D/ERatio: 31.13%
Tata Chemicals: RestructuredReinvestment Rate 40%
Return on Capital12%
Term Yr 2,877 1,040=1837
+ Lambda1.00
XCountry Equity RiskPremium2.60%
Country Default Spread1.30%
X
Rel Equity Mkt Vol
2.00
On June 15, 2004Tata Chem= Rs 136.2
Year 1 2 3 4 5EBIT (1-t) 2316 2427 2543 2665 2793 - Reinvestment 926 971 1017 1066 1117FCFF 1389 1456 1526 1599 1676

Aswath Damodaran 48
The Value of Control?
If the value of a firm run optimally is significantly higher than the value of thefirm with the status quo (or incumbent management), you can write the valuethat you should be willing to pay as:
• Value of control = Value of firm optimally run - Value of firm with status quo• Value of control at Tata Chemicals= 127 - 104= Rs 23 per share or roughly 22%
Implications:• The value of control is greatest at poorly run firms.• As the likelihood of changing management at badly run firms increases (hostile
acquisitions, proxy fights etc.), the value per share will move towards the optimalvalue.
• Voting shares in poorly run firms should trade at a premium on non-voting shares ifthe votes associated with the shares will give you a chance to have a say in a hostileacquisition.

Aswath Damodaran 49
Minority Discounts and Voting Shares
Assume that a firm has a value of $ 100 million run by incumbent managers and $ 150million run optimally.
Proposition 1: The market price will reflect the expected value of control• The firm has 10 million voting shares outstanding.• Since the potential for changing management is created by this offering, the value per share
will fall between $10 and $15, depending upon the probability that is attached to themanagement change. Thus, if the probability of the management change is 60%, the value pershare will be $13.00.
Value/Share = (150*.6+100*.4)/10 = $13
Proposition 2: If you have shares with different voting rights, the voting shares will get adisproportionate share of the value of control…
Proposition 3: The value of a minority interest (49%) of a private business will besignificantly lower then the value of a majority stake in the same business if control hasvalue.

Aswath Damodaran 50
8. Distress and the Going Concern Assumption
Traditional valuation techniques are built on the assumption of a goingconcern, i.e., a firm that has continuing operations and there is no significantthreat to these operations.
• In discounted cashflow valuation, this going concern assumption finds its placemost prominently in the terminal value calculation, which usually is based upon aninfinite life and ever-growing cashflows.
• In relative valuation, this going concern assumption often shows up implicitlybecause a firm is valued based upon how other firms - most of which are healthy -are priced by the market today.
When there is a significant likelihood that a firm will not survive theimmediate future (next few years), traditional valuation models may yield anover-optimistic estimate of value.
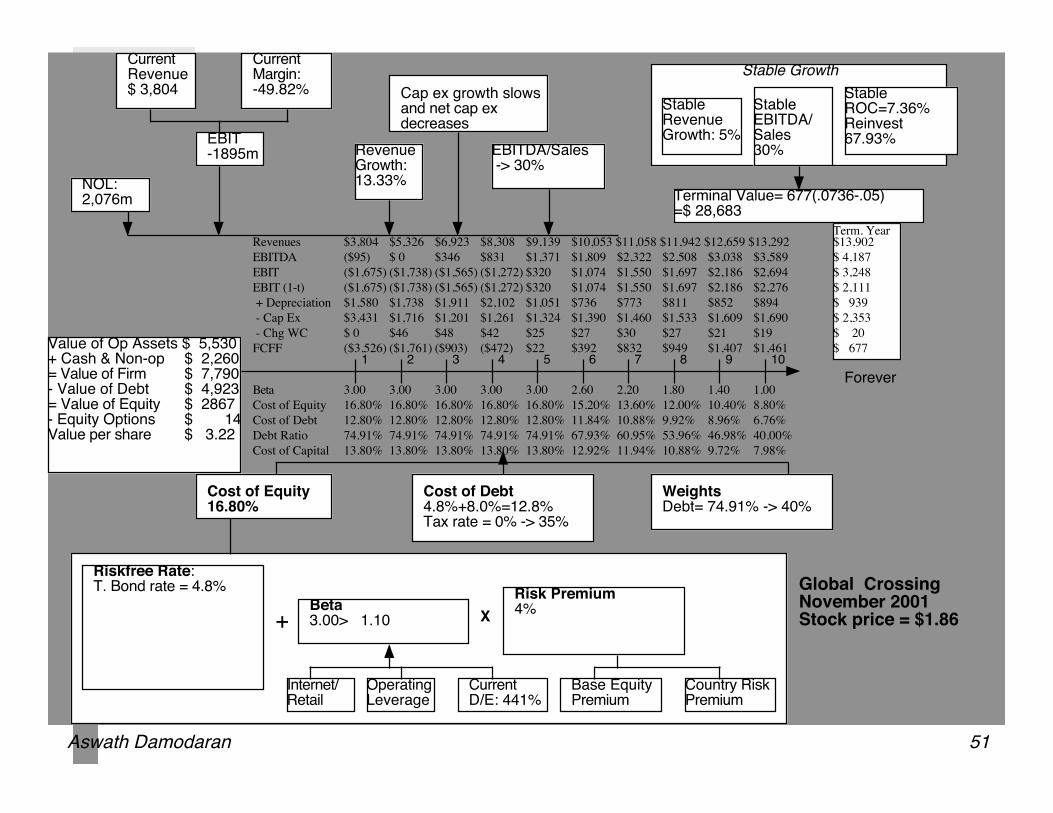
Aswath Damodaran 51
Forever
Terminal Value= 677(.0736-.05)=$ 28,683
Cost of Equity16.80%
Cost of Debt4.8%+8.0%=12.8%Tax rate = 0% -> 35%
WeightsDebt= 74.91% -> 40%
Value of Op Assets $ 5,530+ Cash & Non-op $ 2,260= Value of Firm $ 7,790- Value of Debt $ 4,923= Value of Equity $ 2867- Equity Options $ 14Value per share $ 3.22
Riskfree Rate:T. Bond rate = 4.8%
+Beta3.00> 1.10 X
Risk Premium4%
Internet/Retail
Operating Leverage
Current D/E: 441%
Base EquityPremium
Country RiskPremium
CurrentRevenue$ 3,804
CurrentMargin:-49.82%
Revenue Growth:13.33%
EBITDA/Sales -> 30%
Stable Growth
StableRevenueGrowth: 5%
StableEBITDA/Sales 30%
Stable ROC=7.36%Reinvest 67.93% EBIT
-1895m
NOL:2,076m
$13,902
$ 4,187
$ 3,248
$ 2,111
$ 939
$ 2,353
$ 20
$ 677
Term. Year
2 431 5 6 8 9 107
Global CrossingNovember 2001Stock price = $1.86
Cap ex growth slows and net cap ex decreases
Beta 3.00 3.00 3.00 3.00 3.00 2.60 2.20 1.80 1.40 1.00
Cost of Equity 16.80% 16.80% 16.80% 16.80% 16.80% 15.20% 13.60% 12.00% 10.40% 8.80%
Cost of Debt 12.80% 12.80% 12.80% 12.80% 12.80% 11.84% 10.88% 9.92% 8.96% 6.76%
Debt Ratio 74.91% 74.91% 74.91% 74.91% 74.91% 67.93% 60.95% 53.96% 46.98% 40.00%
Cost of Capital 13.80% 13.80% 13.80% 13.80% 13.80% 12.92% 11.94% 10.88% 9.72% 7.98%
Revenues $3,804 $5,326 $6,923 $8,308 $9,139 $10,053 $11,058 $11,942 $12,659 $13,292
EBITDA ($95) $ 0 $346 $831 $1,371 $1,809 $2,322 $2,508 $3,038 $3,589
EBIT ($1,675) ($1,738) ($1,565) ($1,272) $320 $1,074 $1,550 $1,697 $2,186 $2,694
EBIT (1-t) ($1,675) ($1,738) ($1,565) ($1,272) $320 $1,074 $1,550 $1,697 $2,186 $2,276
+ Depreciation $1,580 $1,738 $1,911 $2,102 $1,051 $736 $773 $811 $852 $894
- Cap Ex $3,431 $1,716 $1,201 $1,261 $1,324 $1,390 $1,460 $1,533 $1,609 $1,690
- Chg WC $ 0 $46 $48 $42 $25 $27 $30 $27 $21 $19
FCFF ($3,526) ($1,761) ($903) ($472) $22 $392 $832 $949 $1,407 $1,461

Aswath Damodaran 52
Valuing Global Crossing with Distress
Probability of distress• Price of 8 year, 12% bond issued by Global Crossing = $ 653
• Probability of distress = 13.53% a year• Cumulative probability of survival over 10 years = (1- .1353)10 = 23.37%
Distress sale value of equity• Book value of capital = $14,531 million• Distress sale value = 15% of book value = .15*14531 = $2,180 million• Book value of debt = $7,647 million• Distress sale value of equity = $ 0
Distress adjusted value of equity• Value of Global Crossing = $3.22 (.2337) + $0.00 (.7663) = $0.75
!
653 =120(1"#
Distress)t
(1.05)t
t=1
t= 8
$ +1000(1"#
Distress)8
(1.05)8

Aswath Damodaran 53
9. Equity to Employees: Effect on Value
In recent years, firms have turned to giving employees (and especially topmanagers) equity option packages as part of compensation. These options areusually
• Long term• At-the-money when issued• On volatile stocks
Are they worth money? And if yes, who is paying for them? Two key issues with employee options:
• How do options granted in the past affect equity value per share today?• How do expected future option grants affect equity value today?
Aswath Damodaran 54
Equity Options and Value
Options outstanding• Step 1: List all options outstanding, with maturity, exercise price and vesting status.• Step 2: Value the options, taking into accoutning dilution, vesting and early
exercise considerations• Step 3: Subtract from the value of equity and divide by the actual number of shares
outstanding (not diluted or partially diluted). Expected future option and restricted stock issues
• Step 1: Forecast value of options that will be granted each year as percent ofrevenues that year. (As firm gets larger, this should decrease)
• Step 2: Treat as operating expense and reduce operating income and cash flows• Step 3: Take present value of cashflows to value operations or equity.
Aswath Damodaran 55
10. Analyzing the Effect of Illiquidity on Value
Investments which are less liquid should trade for less than otherwise similarinvestments which are more liquid.
The size of the illiquidity discount should depend upon• Type of Assets owned by the Firm: The more liquid the assets owned by the firm,
the lower should be the liquidity discount for the firm• Size of the Firm: The larger the firm, the smaller should be size of the liquidity
discount.• Health of the Firm: Stock in healthier firms should sell for a smaller discount than
stock in troubled firms.• Cash Flow Generating Capacity: Securities in firms which are generating large
amounts of cash from operations should sell for a smaller discounts than securitiesin firms which do not generate large cash flows.
• Size of the Block: The liquidity discount should increase with the size of theportion of the firm being sold.

Aswath Damodaran 56
Empirical Evidence on Illiquidity Discounts: RestrictedStock
Restricted securities are securities issued by a company, but not registeredwith the SEC, that can be sold through private placements to investors, butcannot be resold in the open market for a two-year holding period, and limitedamounts can be sold after that. Restricted securities trade at significantdiscounts on publicly traded shares in the same company.
• Maher examined restricted stock purchases made by four mutual funds in theperiod 1969-73 and concluded that they traded an average discount of 35.43% onpublicly traded stock in the same companies.
• Moroney reported a mean discount of 35% for acquisitions of 146 restricted stockissues by 10 investment companies, using data from 1970.
• In a recent study of this phenomenon, Silber finds that the median discount forrestricted stock is 33.75%.

Aswath Damodaran 57
An Alternate Approach to the Illiquidity Discount: Bid AskSpread
The bid ask spread is the difference between the price at which you can buy asecurity and the price at which you can sell it, at the same point. In otherwords, it is the illiqudity discount on a publicly traded stock.
Studies have tied the bid-ask spread to• the size of the firm• the trading volume on the stock• the degree
Regressing the bid-ask spread against variables that can be measured for aprivate firm (such as revenues, cash flow generating capacity, type of assets,variance in operating income) and are also available for publicly traded firmsoffers promise.
Aswath Damodaran 58
A Bid-Ask Spread Regression
Using data from the end of 2000, for instance, we regressed the bid-ask spread againstannual revenues, a dummy variable for positive earnings (DERN: 0 if negative and 1 ifpositive), cash as a percent of firm value and trading volume.
Spread = 0.145 – 0.0022 ln (Annual Revenues) -0.015 (DERN) – 0.016 (Cash/Firm Value) –0.11 ($ Monthly trading volume/ Firm Value)
You could plug in the values for a private firm into this regression (with zero tradingvolume) and estimate the spread for the firm.
To estimate the illiquidity discount for a private firm with $209 million in revenues, 3%in cash as a percent of value and positive earnings.
Spread = 0.145 – 0.0022 ln (Annual Revenues) -0.015 (DERN) – 0.016 (Cash/Firm Value) –0.11 ($ Monthly trading volume/ Firm Value)
= 0.145 – 0.0022 ln (209) -0.015 (1) – 0.016 (.03) – 0.11 (0) = .1178 or 11.78%

Aswath Damodaran 59
Back to Lemmings...


![hapter 1: Introducing Dapr...namespace sample. microservice.web [ApiContr011er] 0 references public class SaluteWor1dContr Service 1 Service 2 Depr runtime Depr runtime Order Service](https://img.pdfslide.us/doc/110x75/60c019cee1a9721dae68c23c/hapter-1-introducing-dapr-namespace-sample-microserviceweb-apicontr011er.jpg)