Embed Size (px)
Citation preview

11 1
Valuation Insights: Equity Risk Premium (ERP) for Indian Market October 2015 Authored by – Manish Saxena, assisted by Saatvik Sharma
© Grant Thornton India LLP. All rights reserved. Member firm of Grant Thornton International Ltd Offices in Bengaluru, Chandigarh, Chennai, Gurgaon, Hyderabad, Kolkata, Mumbai, New Delhi and Pune
Contents
Context 3
Approach and Methodology 6
Sources and References 13
3
Section 1 Context
1. Context
2. Approach and Methodology
4
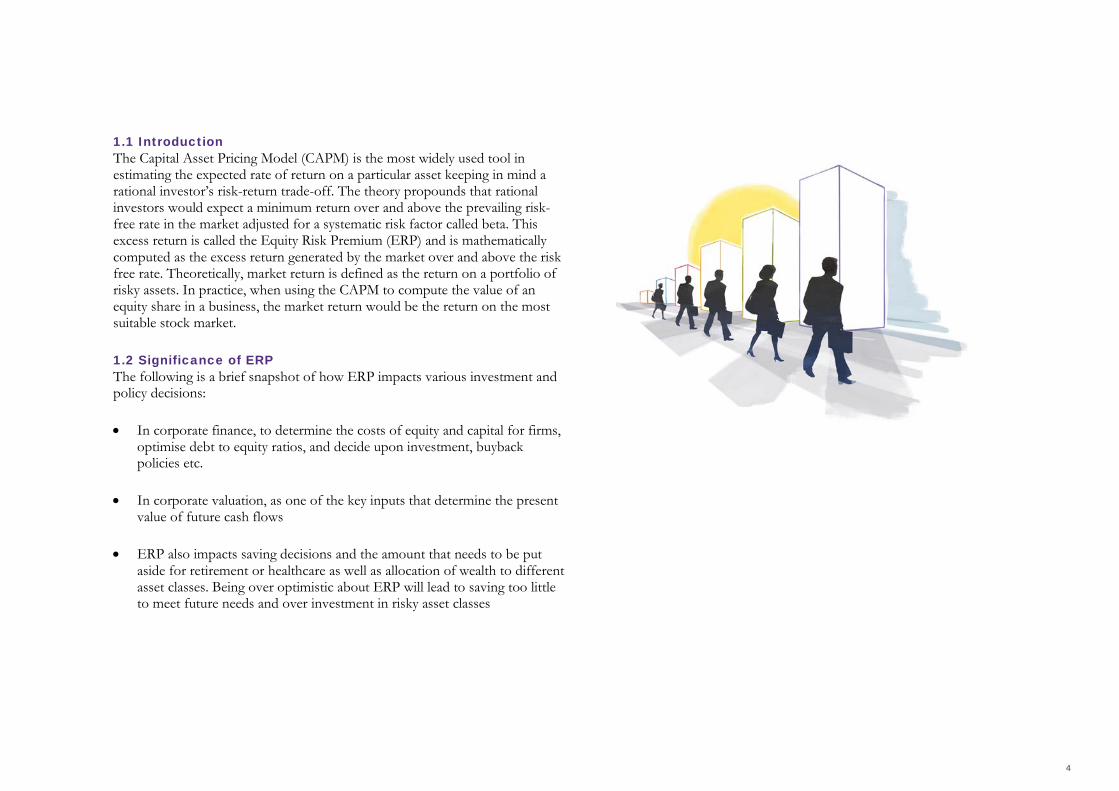
1.1 Introduction The Capital Asset Pricing Model (CAPM) is the most widely used tool in estimating the expected rate of return on a particular asset keeping in mind a rational investor’s risk-return trade-off. The theory propounds that rational investors would expect a minimum return over and above the prevailing risk-free rate in the market adjusted for a systematic risk factor called beta. This excess return is called the Equity Risk Premium (ERP) and is mathematically computed as the excess return generated by the market over and above the risk free rate. Theoretically, market return is defined as the return on a portfolio of risky assets. In practice, when using the CAPM to compute the value of an equity share in a business, the market return would be the return on the most suitable stock market.
1.2 Significance of ERP The following is a brief snapshot of how ERP impacts various investment and policy decisions:
• In corporate finance, to determine the costs of equity and capital for firms, optimise debt to equity ratios, and decide upon investment, buyback policies etc.
• In corporate valuation, as one of the key inputs that determine the present value of future cash flows
• ERP also impacts saving decisions and the amount that needs to be put aside for retirement or healthcare as well as allocation of wealth to different asset classes. Being over optimistic about ERP will lead to saving too little to meet future needs and over investment in risky asset classes
5
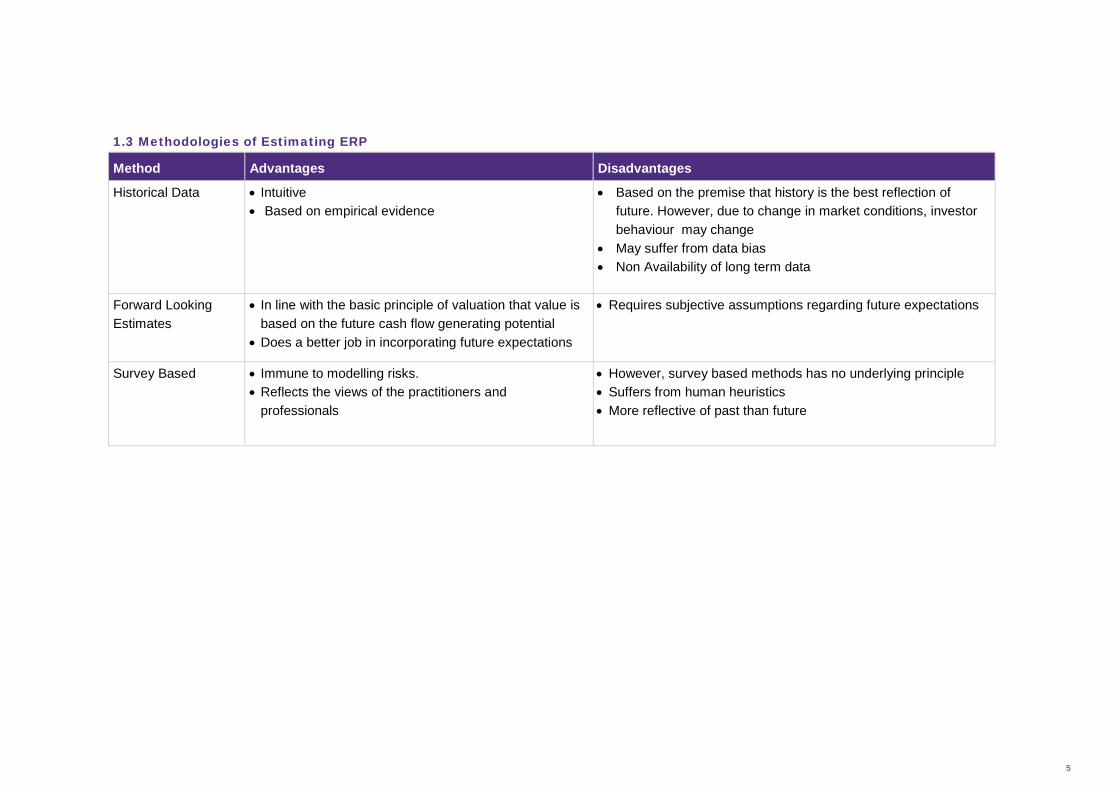
1.3 Methodologies of Estimating ERP
Method Advantages Disadvantages
Historical Data • Intuitive • Based on empirical evidence
• Based on the premise that history is the best reflection of future. However, due to change in market conditions, investor behaviour may change
• May suffer from data bias • Non Availability of long term data
Forward Looking Estimates
• In line with the basic principle of valuation that value is based on the future cash flow generating potential
• Does a better job in incorporating future expectations
• Requires subjective assumptions regarding future expectations
Survey Based • Immune to modelling risks. • Reflects the views of the practitioners and
professionals
• However, survey based methods has no underlying principle • Suffers from human heuristics • More reflective of past than future
6
1.4 Current Practices Over the years, several researchers and academicians have tried to assess and estimate equity risk premiums over varying time horizons. However, most of these studies have been conducted in developed markets like the USA mainly due to the abundance of data available and the several business cycles the US economy has been through.
There are many practical problems in estimating returns in developing markets where the stock markets may not be efficient or liquid. Also, stock markets may not be true reflectors of economic activity and may not behave as risky assets. A perfect example can be China’s stock market which may be subjected to frequent government interventions.
The other major challenge in estimating ERP can be availability of data. In the US, stock and bond market data is available for hundreds of years, which allows researchers/ practitioners to derive meaningful conclusion regarding excess returns in equity market, which may not be the case in emerging markets.
Because of the above factors, most researchers have continued to use the US ERP data as a proxy when estimating the ERP for other less developed countries adjusting them for default spreads between government bond rates, illiquidity premiums and general stability factors. This could however, lead to inaccurate results for countries where capital flows are limited or where the regulatory environment is less investor friendly than the US markets. Further, it is a widely known fact that a country’s stock market reflects the general state of the economy and could differ significantly region by region. Our analysis of the ERP in India is a step towards addressing the above problem.
How much additional premium should one expect to compensate for the systematic risk of investing in equity markets? This is a key question often faced by Investors, financial advisors and valuation professionals alike. While the answer to this is quite subjective and not easy to determine, an attempt is made in the ERP analysis presented here to provide interesting insights in ERP estimation and would hopefully help the reader in their decision making process.
Darshana Kadakia Partner, Grant Thornton India LLP
7
Section 2
Approach and Methodology
1. Context
2. Approach and Methodology
8
2.1 Our Approach We have used both historical as well as a forward looking approach to arrive at an ERP for the Indian market.
2.2 Historical ERP Estimating historical ERP involves analysing various factors like selecting the most appropriate market, selecting the most appropriate risk-free instrument, period of study, methodology of calculation and adjustments to be made, if any. Our analysis of these factors is detailed in the following paragraphs.
2.2.1 The Market Portfolio, Risk-free rate and considered period As per CAPM, the market portfolio should contain all risky assets.
• In selecting an appropriate market, some of the important factors that were considered were:
• Index should be reflective of the economic condition of the country • Volumes traded must reflect significant liquidity and substantial activity • Trading history of the index • Index components must constitute a broad mix of companies across
different sectors
We chose S&P CNX Nifty (“Nifty”) index as the representative market index. Nifty consists of stocks of 50 leading Indian companies and have fair representation of all the leading industry sectors of India. Nifty was launched in 1996 and trading volume wise, one of the leading pan-India stock exchanges.
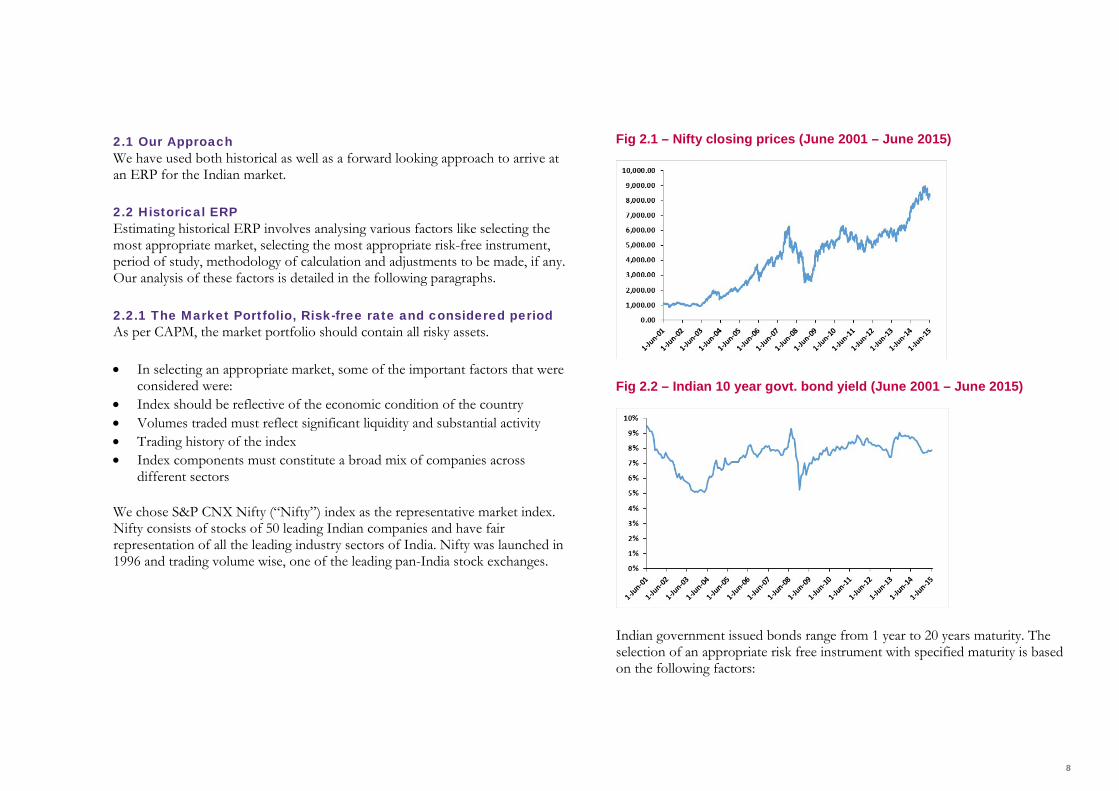
Fig 2.1 – Nifty closing prices (June 2001 – June 2015)
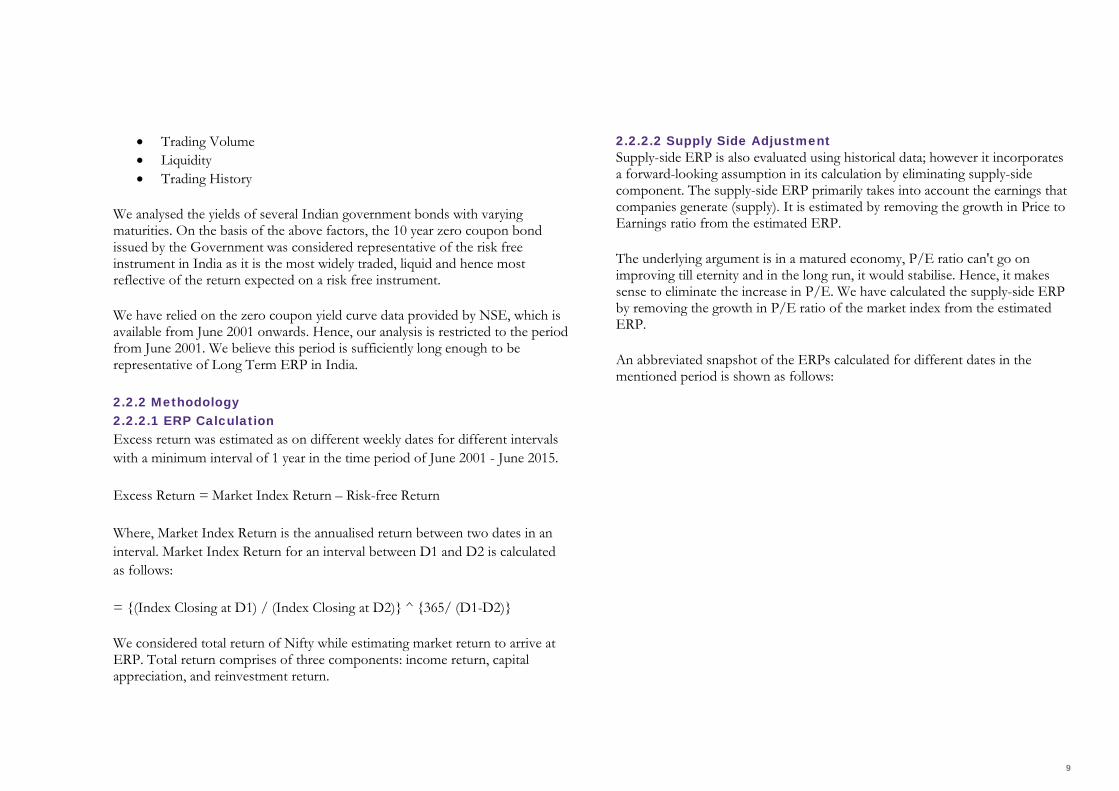
Fig 2.2 – Indian 10 year govt. bond yield (June 2001 – June 2015)
Indian government issued bonds range from 1 year to 20 years maturity. The selection of an appropriate risk free instrument with specified maturity is based on the following factors:
9
• Trading Volume • Liquidity • Trading History
We analysed the yields of several Indian government bonds with varying maturities. On the basis of the above factors, the 10 year zero coupon bond issued by the Government was considered representative of the risk free instrument in India as it is the most widely traded, liquid and hence most reflective of the return expected on a risk free instrument.
We have relied on the zero coupon yield curve data provided by NSE, which is available from June 2001 onwards. Hence, our analysis is restricted to the period from June 2001. We believe this period is sufficiently long enough to be representative of Long Term ERP in India.
2.2.2 Methodology 2.2.2.1 ERP Calculation Excess return was estimated as on different weekly dates for different intervals with a minimum interval of 1 year in the time period of June 2001 - June 2015.
Excess Return = Market Index Return – Risk-free Return
Where, Market Index Return is the annualised return between two dates in an interval. Market Index Return for an interval between D1 and D2 is calculated as follows:
= {(Index Closing at D1) / (Index Closing at D2)} ^ {365/ (D1-D2)}
We considered total return of Nifty while estimating market return to arrive at ERP. Total return comprises of three components: income return, capital appreciation, and reinvestment return.
2.2.2.2 Supply Side Adjustment Supply-side ERP is also evaluated using historical data; however it incorporates a forward-looking assumption in its calculation by eliminating supply-side component. The supply-side ERP primarily takes into account the earnings that companies generate (supply). It is estimated by removing the growth in Price to Earnings ratio from the estimated ERP.
The underlying argument is in a matured economy, P/E ratio can't go on improving till eternity and in the long run, it would stabilise. Hence, it makes sense to eliminate the increase in P/E. We have calculated the supply-side ERP by removing the growth in P/E ratio of the market index from the estimated ERP.
An abbreviated snapshot of the ERPs calculated for different dates in the mentioned period is shown as follows:
10
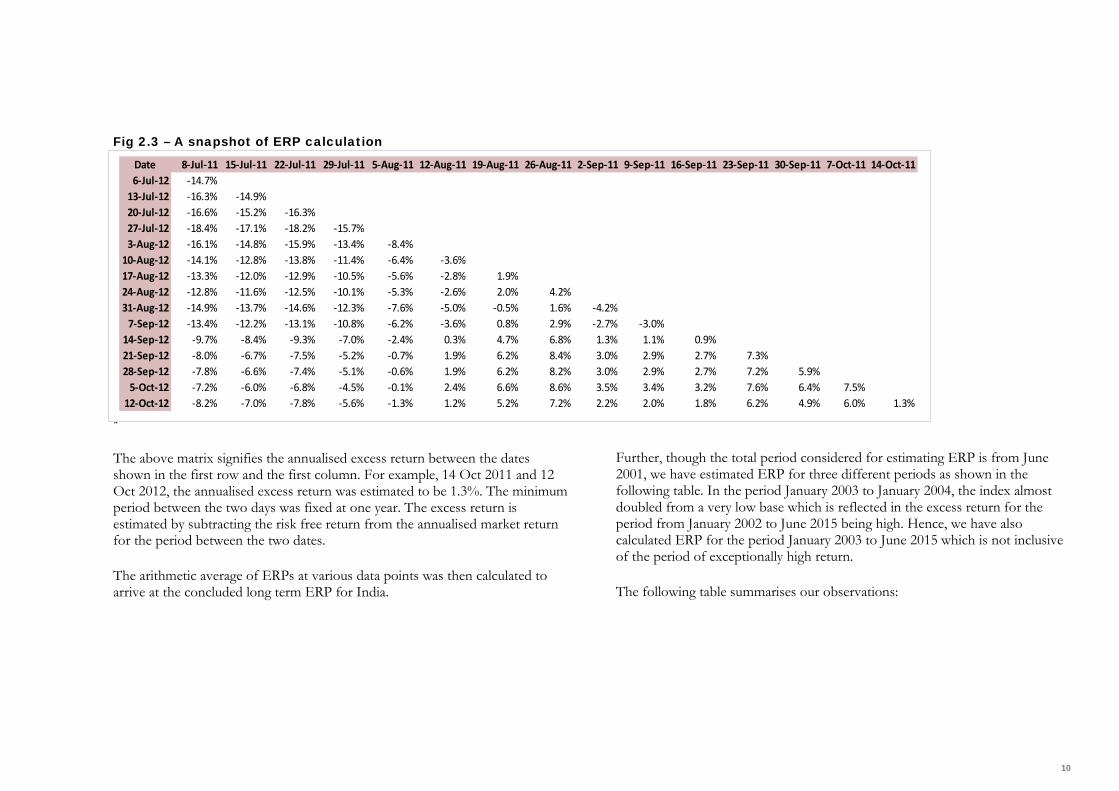
Fig 2.3 – A snapshot of ERP calculation
*
The above matrix signifies the annualised excess return between the dates shown in the first row and the first column. For example, 14 Oct 2011 and 12 Oct 2012, the annualised excess return was estimated to be 1.3%. The minimum period between the two days was fixed at one year. The excess return is estimated by subtracting the risk free return from the annualised market return for the period between the two dates.
The arithmetic average of ERPs at various data points was then calculated to arrive at the concluded long term ERP for India.
Further, though the total period considered for estimating ERP is from June 2001, we have estimated ERP for three different periods as shown in the following table. In the period January 2003 to January 2004, the index almost doubled from a very low base which is reflected in the excess return for the period from January 2002 to June 2015 being high. Hence, we have also calculated ERP for the period January 2003 to June 2015 which is not inclusive of the period of exceptionally high return.
The following table summarises our observations:
Date 8-Jul-11 15-Jul-11 22-Jul-11 29-Jul-11 5-Aug-11 12-Aug-11 19-Aug-11 26-Aug-11 2-Sep-11 9-Sep-11 16-Sep-11 23-Sep-11 30-Sep-11 7-Oct-11 14-Oct-116-Jul-12 -14.7%
13-Jul-12 -16.3% -14.9%20-Jul-12 -16.6% -15.2% -16.3%27-Jul-12 -18.4% -17.1% -18.2% -15.7%3-Aug-12 -16.1% -14.8% -15.9% -13.4% -8.4%
10-Aug-12 -14.1% -12.8% -13.8% -11.4% -6.4% -3.6%17-Aug-12 -13.3% -12.0% -12.9% -10.5% -5.6% -2.8% 1.9%24-Aug-12 -12.8% -11.6% -12.5% -10.1% -5.3% -2.6% 2.0% 4.2%31-Aug-12 -14.9% -13.7% -14.6% -12.3% -7.6% -5.0% -0.5% 1.6% -4.2%
7-Sep-12 -13.4% -12.2% -13.1% -10.8% -6.2% -3.6% 0.8% 2.9% -2.7% -3.0%14-Sep-12 -9.7% -8.4% -9.3% -7.0% -2.4% 0.3% 4.7% 6.8% 1.3% 1.1% 0.9%21-Sep-12 -8.0% -6.7% -7.5% -5.2% -0.7% 1.9% 6.2% 8.4% 3.0% 2.9% 2.7% 7.3%28-Sep-12 -7.8% -6.6% -7.4% -5.1% -0.6% 1.9% 6.2% 8.2% 3.0% 2.9% 2.7% 7.2% 5.9%
5-Oct-12 -7.2% -6.0% -6.8% -4.5% -0.1% 2.4% 6.6% 8.6% 3.5% 3.4% 3.2% 7.6% 6.4% 7.5%12-Oct-12 -8.2% -7.0% -7.8% -5.6% -1.3% 1.2% 5.2% 7.2% 2.2% 2.0% 1.8% 6.2% 4.9% 6.0% 1.3%
11
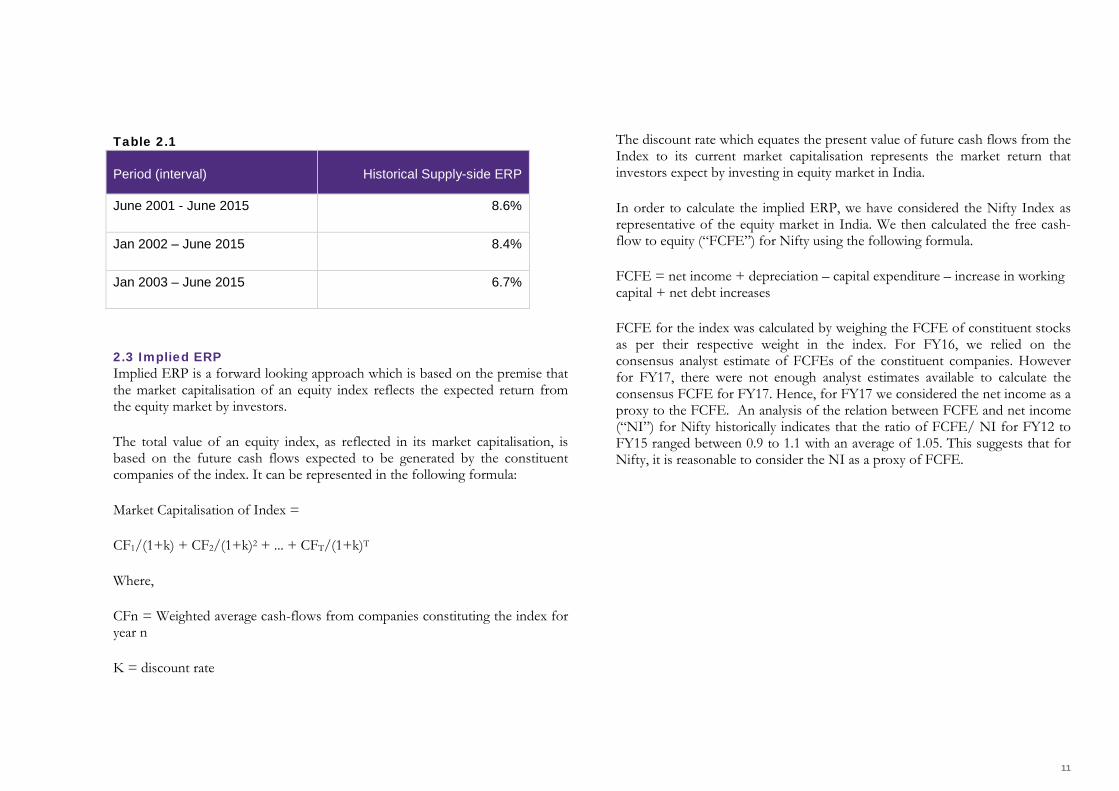
Table 2.1
Period (interval) Historical Supply-side ERP
June 2001 - June 2015 8.6%
Jan 2002 – June 2015 8.4%
Jan 2003 – June 2015 6.7%
2.3 Implied ERP Implied ERP is a forward looking approach which is based on the premise that the market capitalisation of an equity index reflects the expected return from the equity market by investors.
The total value of an equity index, as reflected in its market capitalisation, is based on the future cash flows expected to be generated by the constituent companies of the index. It can be represented in the following formula:
Market Capitalisation of Index =
CF1/(1+k) + CF2/(1+k)2 + ... + CFT/(1+k)T
Where,
CFn = Weighted average cash-flows from companies constituting the index for year n
K = discount rate
The discount rate which equates the present value of future cash flows from the Index to its current market capitalisation represents the market return that investors expect by investing in equity market in India.
In order to calculate the implied ERP, we have considered the Nifty Index as representative of the equity market in India. We then calculated the free cash-flow to equity (“FCFE”) for Nifty using the following formula.
FCFE = net income + depreciation – capital expenditure – increase in working capital + net debt increases
FCFE for the index was calculated by weighing the FCFE of constituent stocks as per their respective weight in the index. For FY16, we relied on the consensus analyst estimate of FCFEs of the constituent companies. However for FY17, there were not enough analyst estimates available to calculate the consensus FCFE for FY17. Hence, for FY17 we considered the net income as a proxy to the FCFE. An analysis of the relation between FCFE and net income (“NI”) for Nifty historically indicates that the ratio of FCFE/ NI for FY12 to FY15 ranged between 0.9 to 1.1 with an average of 1.05. This suggests that for Nifty, it is reasonable to consider the NI as a proxy of FCFE.
12
We have considered a multi-stage growth model with an explicit period till FY25 and a terminal value beyond FY25. Till FY20, growth rates are based on forecasts for India by IMF. As per IMF, the nominal GDP growth rate of India during the period FY18-20 is expected to be around 13%. Between FY21-25, a growth rate 10% has been considered, while the perpetual rate is considered to be 7.5%. In a stable state, risk-free rate can be considered a proxy for nominal growth rate of an economy1. Since, the 10-year Indian government bond yield is around 7.8%, we have reasonably considered 7.5% to be the perpetual growth rate for Indian economy.
Based on the above assumptions, the implied discount rate which equates the discounted cash flows of Nifty to the current index value is estimated to be 15.8%. Based on risk-free rate of 7.8% and index beta of 1, ERP is estimated to be approx. 8%.
2.4 Estimated ERPs Under Historical method as shown in table 2.1, the ERP varies significantly depending on the chosen period. It is our contention that the year 2003 represented a one-off period of extraordinary returns because of lower base of the index and also liquidity fuelled dream run that is unlikely to repeat in future. Hence the Historical ERP of 6.7% calculated for the period Jan 2003 to June 2015 is a better representative of the expected ERP in India. Further, the ERP estimated using the implied method is approx. 8%.
Hence, based on the average of the historical and implied ERP analysis, an ERP of 7.4% can be considered a reasonable premium for investing in Indian market currently.
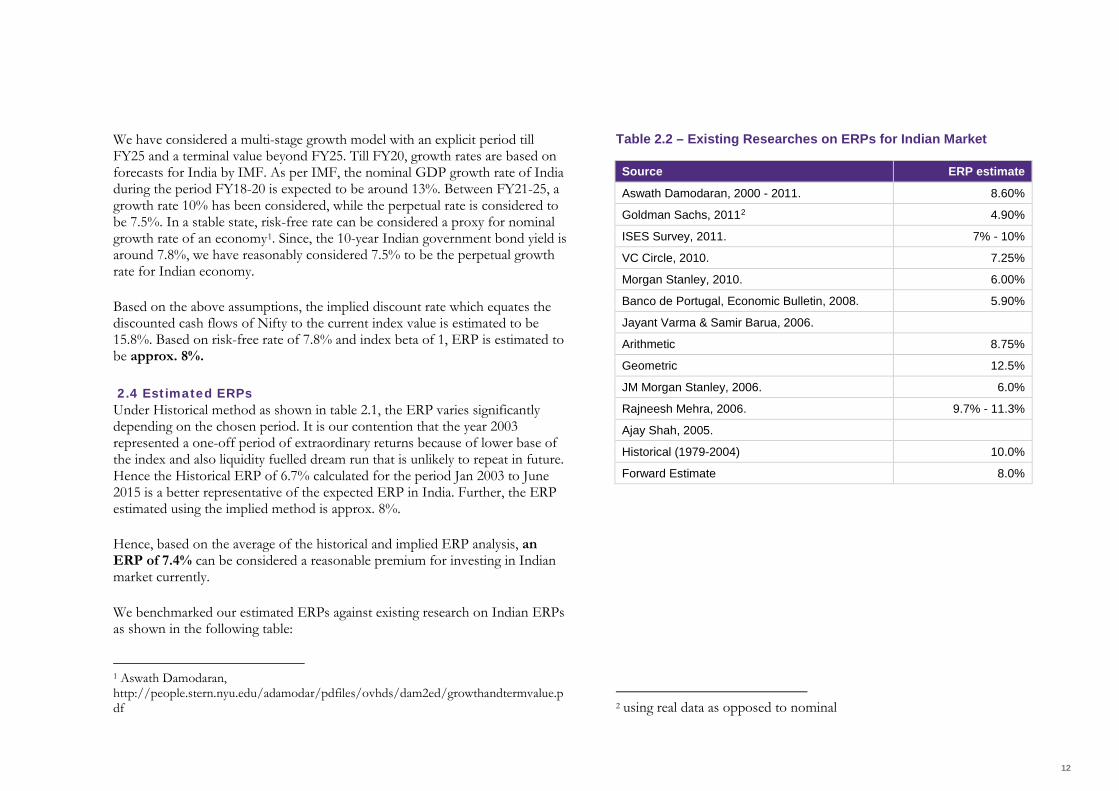
We benchmarked our estimated ERPs against existing research on Indian ERPs as shown in the following table:
1 Aswath Damodaran, http://people.stern.nyu.edu/adamodar/pdfiles/ovhds/dam2ed/growthandtermvalue.pdf
Table 2.2 – Existing Researches on ERPs for Indian Market Source ERP estimate
Aswath Damodaran, 2000 - 2011. 8.60%
Goldman Sachs, 20112 4.90%
ISES Survey, 2011. 7% - 10%
VC Circle, 2010. 7.25%
Morgan Stanley, 2010. 6.00%
Banco de Portugal, Economic Bulletin, 2008. 5.90%
Jayant Varma & Samir Barua, 2006. Arithmetic 8.75%
Geometric 12.5%
JM Morgan Stanley, 2006. 6.0%
Rajneesh Mehra, 2006. 9.7% - 11.3%
Ajay Shah, 2005. Historical (1979-2004) 10.0%
Forward Estimate 8.0%
2 using real data as opposed to nominal
13
1. Equity Risk Premiums (ERP): Determinants, Estimation and Implications – The 2012 Edition, Updated: March 2012 by Aswath Damodaran
2. Equity Risk Premium Article by Michael Annin, CFA and Dominic Falaschetti, CFA
3. Unraveling the Supply-Side Equity Risk Premium by Magdalena Mroczek
4. Aswath Damodaran, 2000 – 2011, Annual ERP estimates 5. Goldman Sachs, 2011, Linking GDP Growth and Equity Returns 6. ISES Survey, 2011. Market Risk Premium Used in 56 Countries in 2011 7. VC Circle, 2010. What Is the Real Cost of Equity in India? 8. Morgan Stanley, 2010. India's Coming Growth Acceleration 9. Banco de Portugal, Economic Bulletin, 2008. Equity Risk Premia
Across Major International Markets 10. Jayant Varma & Samir Barua, 2006. First Cut Estimate of the Equity
Risk Premium in India 11. JM Morgan Stanley, 2006. India's equity risk premium high 12. Rajneesh Mehra, 2006. The Equity Premium in India 13. Ajay Shah, 2005. Returns on equity index portfolios in India 14. International Databases
About "Valuation Insights" "Valuation Insights" is a periodic newsletter published by Grant Thornton India LLP, a member firm within Grant Thornton International. This publication is our effort to discuss and address various valuation issues using the best practices and international guidelines. Our team of professionals share their thoughts on the nuances of valuations and its strategic and practical implications. We hope that you will find our newsletter informative and encourage you to look at Grant Thornton as a reliable and valuable solution provider for your valuation needs.
Disclaimer The ERP estimation involves use of subjective estimates and multiple approaches. Hence different researchers may come out with different ERPs. Further, the ERP concluded in this report represents the ERP prevailing post the publication date and hence should not be considered representative of ERP prevailing at any other historical date. The ERP remains stable for a fairly long period unless there is a drastic change in the economic and market conditions. Hence, the concluded ERP could be considered effective till such time the current analysis is updated in future or there is a significant change in the economic and market conditions.
The document is for information purpose only. The analysis is based on generally accepted methodologies, information available in the public domain as well as information sourced from international data bases. The information contained in this document is published for the assistance of the recipient but is not to be relied upon as authoritative or taken in substitution for the exercise of judgment by any recipient. This document is not intended to be a substitute for professional, technical or legal advice. We have no obligation to update this report. All opinions expressed in this document are subject to change without notice. Whilst due care has been taken in the preparation of this document and information contained herein, Grant Thornton, does not accept any liability whatsoever, for any direct or consequential loss howsoever arising from any use of this document or its contents or otherwise arising in connection herewith.

14
Contact us To know more about Grant Thornton in India, please visit www.grantthornton.in or contact any of our offices as mentioned below:
NEW DELHI National Office Outer Circle L 41 Connaught Circus New Delhi 110001 T +91 11 4278 7070
AHMEDABAD BSQUARE Managed Offices, 7th Floor, Shree Krishna Centre, Nr. Mithakali Six Roads, Navrangpura, Ahmedabad 380009 T +91 76000 01620
BENGALURU “Wings”, 1st Floor 16/1 Cambridge Road Ulsoor Bengaluru 56000 T +91 80 4243 0700
CHANDIGARH B-406A, 4th Floor, L&T Elante office Industrial area, Phase-I Chandigarh 160002 T +91 172 4338 000
CHENNAI Arihant Nitco Park, 6th Floor No.90, Dr. Radhakrishnan Salai Mylapore Chennai 600004 T +91 44 4294 0000
GURGAON 21st Floor, DLF Square Jacaranda Marg DLF Phase II Gurgaon 122002 T +91 124 462 8000
HYDERABAD 7th Floor, Block III White House Kundan Bagh, Begumpet Hyderabad 500016 T +91 40 6630 8200
KOCHI 7th Floor, Modayil Centre Point, Warriam road junction, M.G.Road, Kochi 682016 T +91 484 406 4541
KOLKATA 10C Hungerford Street 5th Floor Kolkata 700017 T +91 33 4050 8000
MUMBAI 16th Floor, Tower II Indiabulls Finance Centre SB Marg, Elphinstone (W) Mumbai 400013 T +91 22 6626 2600
MUMBAI 9th Floor, Classic Pentagon, Nr Bisleri, Western Express Highway, Andheri (E) Mumbai 400099 T +91 22 6176 7800
NOIDA Plot No. 19A, 7th Floor Sector – 16A, Noida 201301 T +91 120 7109 001
PUNE 401 Century Arcade Narangi Baug Road Off Boat Club Road Pune 411001 T +91 20 4105 7000
For more information or for any queries, write to us at [email protected]
Follow us @GrantThorntonIN
© 2015 Grant Thornton India LLP. All rights reserved.
“Grant Thornton in India” means Grant Thornton India LLP, a member firm within Grant Thornton International Ltd, and those legal entities which are its related parties as defined by the Companies Act, 2013 read in conjunction with the applicable Accounting Standards issued by the Institute of Chartered Accountants of India.
Grant Thornton India LLP (formerly Grant Thornton India) is registered with limited liability with identity number AAA-7677 and has its registered office at L-41 Connaught Circus, New Delhi, 110001.

© 2015 Grant Thornton India LLP. All rights reserved. References to Grant Thornton are to Grant Thornton International Ltd (Grant Thornton International) or its member firms. Grant Thornton International and the member firms are not a worldwide partnership. Services are delivered independently by the member firms.